Embed Size (px)
Citation preview

An Integrated Data Evaluation and Action System, led by Milwaukee Public Schools and its Partnersled by Milwaukee Public Schools and its Partners
November 29, 2011

Milwaukee Public Schools◦ District contextDistrict context◦ Data systems
Information Gaps Introduction to IDEAS Building Support, “Investors” and Partners◦ Interest/Engagement◦ Commitment
Building Capacity Building Capacity Next Steps

Large, at-risk youth community
◦ 4th poorest US city of its size, high poverty rates, and single, female-headed households (22%)
◦ Low birth weights, immunization rates, and other indicators of poor health (e g diabetes obesity)indicators of poor health (e.g., diabetes, obesity)
◦ +48,000 (8.65%) children under age 5 in Milwaukee (2005), only a small share in MPSy
◦ Low rates of school readiness and academic achievement
◦ High mobility across schools/systemsg y / y Large, historically under-performing district (33rd largest)◦ History of decentralized programs, resources, etc.
District in corrective action◦ District in corrective action

Students81 000 K4 12 students
Schools◦ 174 (preK-5 K-8 middle 6-◦ 81,000 K4-12 students
◦ largely minority--African American (56.1%),
( )
◦ 174 (preK-5, K-8, middle, 6-12, and 9-12) schools◦ Diverse school types--IB,
Montessori languageHispanic (23.1%), Asian(5.0%), American Indian (.8%), and White
Montessori, language immersion, comprehensive high schools, charter (instrumentality and non-
(14.9%),◦ High poverty--82% FRPL◦ 10% ELLs
( yinstrumentality), partnership/contract◦ Various ECE programs (e.g., 10% ELLs
◦ 19.5% special education Head Start, state-subsidized childcare)◦ More than 55 schools SiFi
d f didentified

To learn and improve
To support data-informed decision-making at all Data extracts to support:
To learn and improve
decision making at all levels w/in MPS
Data extracts to support:
Classroom teachers Goal setting, progress i i d d Learning teams
School leadersRegional and district
monitoring, and targeted support (e.g., school-specific growth targets)
Regional and district leaders
District-sponsored research for program improvement and evaluation/policy research
External research requests State and federal
reporting
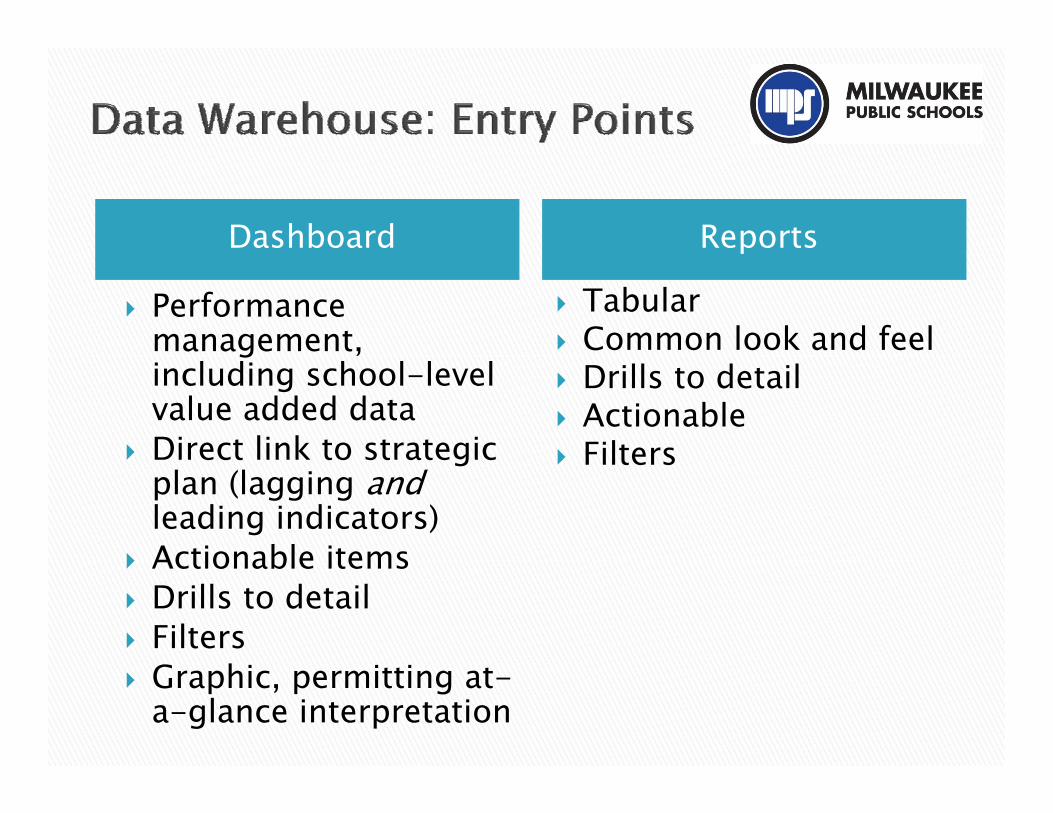
Dashboard Reportsp
Performance management,
Tabular Common look and feelg ,
including school-level value added data
Direct link to strategic
Drills to detail Actionable Filters Direct link to strategic
plan (lagging andleading indicators)
Actionable items
Filters
Actionable items Drills to detail Filters Graphic, permitting at-
a-glance interpretation


Tables w/ data refreshed from source systems:
E ll / i hd l◦ Enrollments/withdrawals◦ Transportation◦ Demographicsg p◦ Attendance◦ Discipline/safety◦ Assessment (WKCE MAP-universal screener)◦ Assessment (WKCE, MAP universal screener),
courses, grades, post-secondary outcomes (National Student Clearinghouse data)
Interventions (Tier 2 reading and math including Interventions (Tier 2 reading and math, including progress monitoring in Exceed) and Early Warning/at-risk indicators (attendance, suspension, retention/overage, and total quality credit)

Click on any of the bars to go see all risk levelssee all risk levels for each risk area


The Attendance metric drills tometric drills to attendance data by student

TQC summary metric

System improvements◦ Financials◦ Staff◦ Staff◦ Surveys (Teachers: PD, Instructional practices,
climate; Students: climate, exit plans) ◦ Interventions◦ After-school data
Automatic ETL processes load data to DW overnightovernight
New use of “push” technology◦ Daily “Push Outs” to Superintendent, senior staff,
and Regional Executive Specialistsand Regional Executive Specialists◦ Focus on key, real-time indicators (e.g., attendance,
suspensions) w/ immediate follow up (e.g., team response social worker support)response, social worker support)


Heightened sense of urgency and Heightened sense of urgency and accountability
Decreased student suspensions Decreased student suspensions◦ Suspension rate dropped 26% to 20.4%◦ Lowest number of student suspensions in +10 yrsIncreased instructional time• Increased instructional time◦ +38,000 student days recovered◦ Increased fidelity to new literacy and math
linstructional minutes requirements Increased student attendance◦ District-wide attendance rose 88 1% to 90 1%District wide, attendance rose 88.1% to 90.1%
(2009-10 to 2010-11)◦ Highest overall attendance rate and largest
increase in 15 yrsincrease in 15 yrs

2009 2010 & 2010 2011 S2009-2010 & 2010-2011 Suspension Rate by Grade - SpEd & Non-SpEd
50 0%
60.0%
70.0%
30.0%
40.0%
50.0%
10.0%
20.0%
0.0%K5 Gr 1 Gr 2 Gr 3 Gr 4 Gr 5 Gr 6 Gr 7 Gr 8 Gr 9 Gr 10 Gr 11 Gr 12
2009-2010 Non-SpEd Students 2009-2010 SpEd Studentsp p
2010-2011 Non-SpEd Students 2010-2011 SpEd Students

100 0%
Attendance by Grade
70 0%
80.0%
90.0%
100.0%
40 0%
50.0%
60.0%
70.0%
10 0%
20.0%
30.0%
40.0%
0.0%
10.0%
K5 Gr 1 Gr 2 Gr 3 Gr 4 Gr 5 Gr 6 Gr 7 Gr 8 Gr 9 Gr 10 Gr 11 Gr 12
2009 2010 2010 20112009-2010 2010-2011
Increased Reading proficiency (based on November 2010 assessment)November 2010 assessment)◦ Overall rate improved almost 2% points◦ Growth out-paced the State◦ All student subgroups improved in grades 3-5 and
6-8 Increased college readiness as measured Increased college readiness, as measured
on ACT◦ Tested more students than ever before◦ First increases since 2007 (in all but one subject)◦ Growth out-paced the State

Early Success: College ReadinessEarly Success: College Readiness
Total Tested English Math Reading Science Composite
Grad Year District State District State District State District State District State District State
2 086 46 430 16 7 21 6 17 3 22 2 17 9 22 4 18 2 22 4 17 3 22 32007
2,086 46,430 16.7 21.6 17.3 22.2 17.9 22.4 18.2 22.4 17.3 22.3
20082,071 46,990 16.6 21.7 17.2 21.7 17.9 22.6 17.9 22.3 17.6 22.3
2008
2009 2,334 46,658 16.2 21.7 16.9 21.7 17.5 22.6 17.8 22.3 17.2 22.3
2010 3,846 47,755 14.1 21.5 16.0 21.5 15.8 22.0 16.6 22.2 15.8 22.1
2011 3,812 47,693 14.5 21.6 16.2 21.6 16.2 22.1 16.4 22.3 16.0 22.2

MPS is making progress, but we need to do more, faster, starting earlier….starting earlier…. and we can’t do it alone

MPS “Tag” for participation in various supports and
programs (e g Head Start CLCs SES collegeprograms (e.g., Head Start, CLCs, SES, college prep, parental involvement)
Fully linked data (e.g., PD participation-outcomes) Early warning systems before high schoolCity/community Early learning indicators (e g Early learning indicators (e.g.,
health/immunizations, school readiness) Non-MPS early childhood experiences
l ( f ) d l Social services (e.g., foster care) and criminal justice
Understanding of “why” and “how” Understanding of why and how

Multiple service providers and data sources
◦ Data local governmental agencies collect regarding families and children usually segregated in thefamilies and children usually segregated in the organization and not shared w/ other agencies
◦ Often, multiple agencies work w/ the same families and children, yet lack ability to share or study information to determine needed or effective interventions
Lack of linked data across orgs and variables limits ability◦ Lack of linked data across orgs and variables limits ability to: 1)understand specific risk factors, 2)discover protective factors, and 3)support strategic planning, program i t d t t d i t tiimprovement, and targeted intervention
Breadth and depth of challenges facing Milwaukee’s children call for more coordinated and targeted interventionscall for more coordinated and targeted interventions

Integrated Data Evaluation and Action System for Children: An integrated data system on health, social, and educational needs and outcomes of children andand educational needs and outcomes of children and youth in Milwaukee
Modeled after similar city- and county-wide finitiatives from across the country (e.g., Baltimore,
MD; Philadelphia, PA; Los Angeles County-in development), most notably, Kids Integrated Data System (KIDS), a nationally recognized integrated data system focused on children in the City of Philadelphia
Designed to leverage existing data and data management capacity, as well as local and national expertiseexpertise

P id i l hild d l i di l d b Provide a single, child-centered, longitudinal database Assist in the development of a cross-agency learning
agenda to:g◦ protect privacy and ensure appropriate data sharing◦ conduct meaningful data analyses to identify specific g y y p
risk and protective factors, assess community needs, and determine program impacts (and areas for improvement)◦ support program development, improvement, and
implementation; public policy development; and community planning across systems and agenciesy p g y g
Foster cross-agency dialogue and support development of a shared vision and plan(s) for community-wide action
Help create meaningful change for Milwaukee’s children

Leveraging the Philadelphia KIDS example◦ Internal “research”, discussions, and consultations at
staff and senior team levels (July-December 2010) Introducing the idea (September 2010-January
2011)2011)◦ Governor’s Early Childhood Advisory Committee◦ Community convenings, board meetings, etc. w/ variousCommunity convenings, board meetings, etc. w/ various
funders present (soft sell)◦ Targeted leadership mtgs (e.g., police chief, county
exec )exec.) Identifying partners (October 2010-on-going) ◦ State, county, and city agencies; university partnersState, county, and city agencies; university partners

Building internal buy in Building internal buy-in◦ MPS internal stakeholders meeting (January
2011)2011)◦ MPS Board of School Directors request to
work w/ Milwaukee Cty to develop / y pintergovernmental agreement on shared services and data (February 2011)◦ Initiative named--IDEAS (Integrated Data and
Action System) for ChildrenM ti / it tt ( l f MPS)◦ Meetings w/ city attorney (counsel for MPS)

Engaging partners◦ Milwaukee Cty Bd of Supervisors passes
lsimilar action◦ Formal presentations (April-July 2011)
H f ld F d ti f f di t ( t th i Herzfeld Foundation for funding support (at their request), resulting in LoI and later, full proposal
Milwaukee Community Justice Council, au ee Co u ty Just ce Cou c ,unanimous support of IDEAS
Multiple stakeholder convening: Internal t k h ld t ti l f d d itstakeholders, potential funders and community
stakeholders meeting outlining need, potential, and KIDS example

F li i C i Formalizing Commitments◦ First grant announcement, Herzfeld Foundation
(June 2011)(June 2011)◦ Letters of support, e.g., WI Depts. of Children
and Families, Health Services, Public Instruction; Social Development Commission City ofSocial Development Commission, City of Milwaukee Health Department) (August-on-going)◦ Milwaukee City Atty’s Office assigns 2 staff to
work w/ MPS on MOUs for IDEAS (September 2011)2011) ◦ Additional funding support (in progress)◦ MOUs (in-progress)

Financial support◦ Creates legitimacy among other funders and
partners◦ Funds conferences, consultants
Technical expertise and leadership Technical expertise and leadership◦ Leverages UPenn experience in other cities◦ Leverages UW-Madison Value Added Research g
Center (VARC) technical expertise, proximity, and familiarity w/ MPS and our data systems

Primary research partner of MPS for over a decade
Embedded researcher model involves VARC researcher in-house 3 days per weekC d t d h d l ti Conducted research and program evaluation at district direction on initiatives/programs, e g literacy coaching READ 180 schoole.g., literacy coaching, READ 180, school configuration, ELL outcomes, etc.
Early warning system (modeled after CCSR in Early warning system (modeled after CCSR in CPS) to predict which secondary students are off-track for on-time graduation
Value-Added school growth analysis

Phase I: Vision Phase I: Vision◦ Establish governing body
Id tif k d t◦ Identify key data sources◦ Identify key stakeholders and working groups
l d h d◦ Develop data-sharing procedures Phase II: Build◦ Inventory existing data structures◦ Develop extraction routines and database refreshes◦ Design data structures to integrate data◦ Design data cleansing procedures to ensure data
litquality

Phase III and IV: Use IDEAS to Inform Policy
◦ Identify priorities for research
◦ Secure funding to support research
◦ Conduct research consistent with rigorous methods and ethical standards
◦ Disseminate results
◦ Incorporate findings into strategic decision-making procedures of partner organizations