Embed Size (px)
Citation preview
iii
An integrated geochemical and sedimentological analysis of a lacustrine Lagerstätten in the
Triassic Cow Branch Formation of the Dan River Basin
Samantha Rose Ritzer
Thesis submitted to the faculty of the Virginia Polytechnic Institute and State University in partial fulfillment of the requirements for the degree of
Master of Science
In Geology
B. Gill, Committee Chair B. Romans K. Eriksson
J. Beard
May 3, 2016 Blacksburg, VA
Keywords: Triassic, Lagerstätte, Iron Speciation, Rift Basin, Anoxia, Sedimentology,
Geochemistry
An integrated geochemical and sedimentological analysis of a lacustrine Lagerstätten in the Triassic Cow Branch Formation of the Dan River Basin
Samantha Rose Ritzer
ABSTRACT
The Triassic Cow Branch Formation of the Dan River Basin is host to a world-class
lagerstätte deposit of exceptionally preserved insects, among other organisms. The
lagerstätte occurs within a cyclic, lacustrine sedimentary succession, hypothesized to have
been driven by Milankovitch climate forcing. Through an integrated sedimentological and
geochemical investigation, I present evidence that the lagerstätte was deposited during a
lake transgression, under intermittently anoxic and ferruginous conditions.
Sedimentological evidence shows a deepening followed by shoaling through a broad fining
and subsequent coarsening of the sedimentary units of the sequence. This transition in
grain size occurs at the lagerstätte. Despite relatively quartz-rich sediments sourced to the
basin, silica-content in the studied cycle is exceptionally low. The replacement of silica by
the zeolite mineral analcime, coupled with primary dolomite precipitation suggests
alkaline lake water. Geochemical evidence, including total organic carbon (TOC), pyrite
sulfur and iron speciation data suggest anoxic, ferruginous waters. At the lagerstätte
interval, TOC content increases significantly, coinciding with the presence of darker, more
laminated sedimentary lithofacies. At the interval of the highest TOC content, a spike in
pyrite sulfur content occurs; likely the result of slowed sedimentation. Organic carbon-to-
pyrite sulfur ratios suggest however, that the lake water was sulfate-poor and the deep
waters never became euxinic (anoxic, H2S-containing). Iron proxy data show that the
studied portion of the Cow Branch Formation deposited under intermittent to persistent

iii
anoxic conditions. These data suggest a confluence of factors — lake transgression,
combined with alkaline and anoxic, ferruginous water chemistry — created an ideal
scenario that led to lagerstätte formation
iv
Table of Contents: Dedication Acknowledgements A. Introduction 1. Geologic Setting 2. Van Houten Cycles in the context of the Cow Branch Fm. 3. Models for the environment of formation of the lagerstätten B. Methods 1. Core acquisition and sampling 2. Total organic carbon (TOC) contents and isotope compositions (d13Corg) 3. Iron speciation analyses 4. Pyrite sulfur and iron contents 5. Total iron content C. Results 1. Cow Branch lithofacies descriptions i. Lithofacies 1 ii. Lithofacies 2a iii. Lithofacies 2b iv. Lithofacies 3 v. Lithofacies 4 vi. Lithofacies 5a vii. Lithofacies 5b viii. Lithofacies 6 ix. Lithofacies 7 x. Lithofacies 8 xi. Lithofacies 9 xii. Lithofacies 10a xiii. Lithofacies 10b 2. Dry Fork lithofacies descriptions 3. Interpretation of depositional processes 4. Geochemistry of Cow Branch Samples i. Total organic content and Corg isotopes ii. Pyrite sulfur content iii. Iron speciation 5. Geochemistry of Dry Fork Samples i. Total organic content and Corg isotopes ii. Iron speciation
vi vii 1 1 4 6 8 8 9 10 11 11 13 13 13 14 14 14 15 15 16 17 17 18 18 18 18 19 19 20 20 21 22 23 23 23

v
D. Discussion 1. Lithofacies succession and lake level history 2. Iron shuttle model and sedimentary redox in the Dan River Basin 3. Primary dolomite formation within the Dan River Basin 4. Organic carbon sources in the Dan River Basin 5. Model for formation of the lagerstätten E. Conclusions F. References Figure 1 Figure 2 Figure 3 Figure 4 Figure 5 Figure 6 Figure 7 Figure 8 Figure 9 Table 1 Appendix A Appendix B
24 24 27 31 33 34 36 37
41 42 43 48 51 52 53 54 55 44 56 57

vi
Dedication
I would like to dedicate this thesis to Dr. John Taylor.
Thank you for noticing my interest in Geo 101 and making it a point to gently nudge me toward changing my major. You hooked me with your genuine love for geology and
teaching. Without that, I don’t think I would have ever wandered back to science. Whether you realize it or not, you changed the course of my life to pursue a subject that never feels
like work. Enjoy your retirement, you deserve it!

vii
Acknowledgements: I’ve had a lot of help on this thesis over the last two years. I would first like to thank my committee for their helpful comments and discussion. I would especially like to thank my committee chair, Ben, for being the best advisor I could have ever asked for. Your understanding of the fact that sometimes life happens combined with the gentle prodding required to get me to write anything down has shaped me as a scientist and a person in the best way possible. Thanks for being both an advisor and a great friend. I would like to acknowledge the huge help that Scott Traenkner from the Eden Quarry was. Thank you for your genuine interest in the science we were doing, for the giant water trucks, and for access to the quarry. I would also like to thank the Virginia Museum of Natural History, for allowing me to help excavate the insect layer and not getting too mad when I drilled a hole right through it. I want to thank Paul Olsen for helpful discussion and sharing his years of expertise on the study area. Thank you Seddies, for distraction at the right times and support through the rest. Matt – you’re a great labmate and an even better friend. I’m looking forward to the opportunity to share science and stories with you in the future. Sarah – I probably would have crumbled in the office (and on lime duty) without you, thanks for being a great friend and a person to talk to about rocks and life. I’ll miss you buddies! I’d also like to thank my family, who thinks I’m the smartest person ever, even though they’ve all seen me struggle with simple math. Your support has been so important and I’d be lost without it. I’d also like to take this time to formally apologize for all of the family gatherings I’ve missed because of school. A big thanks to Krista, my best friend and soon-to-be Dr., go us! Your support over the last two years, and the 17 or so before that, has helped me through some of the toughest times I’ve ever experienced, especially this last year. Cheers to best friendship forever. Last but not least, Brandon. You are, and always have been, my biggest cheerleader. You deserve this degree as much as I do; putting up with my stress and my tears but always reminding me that I could and would pull this off. The last two years apart have been some of the toughest, but you’ve been there no matter what. I can’t wait to see what rocks the rest of life has in store for our mantle. I love you! Adios, Blacksburg, I’ll miss you. But as Biggie said best, I’m going, going back, back to Cali, Cali!
1
A. Introduction
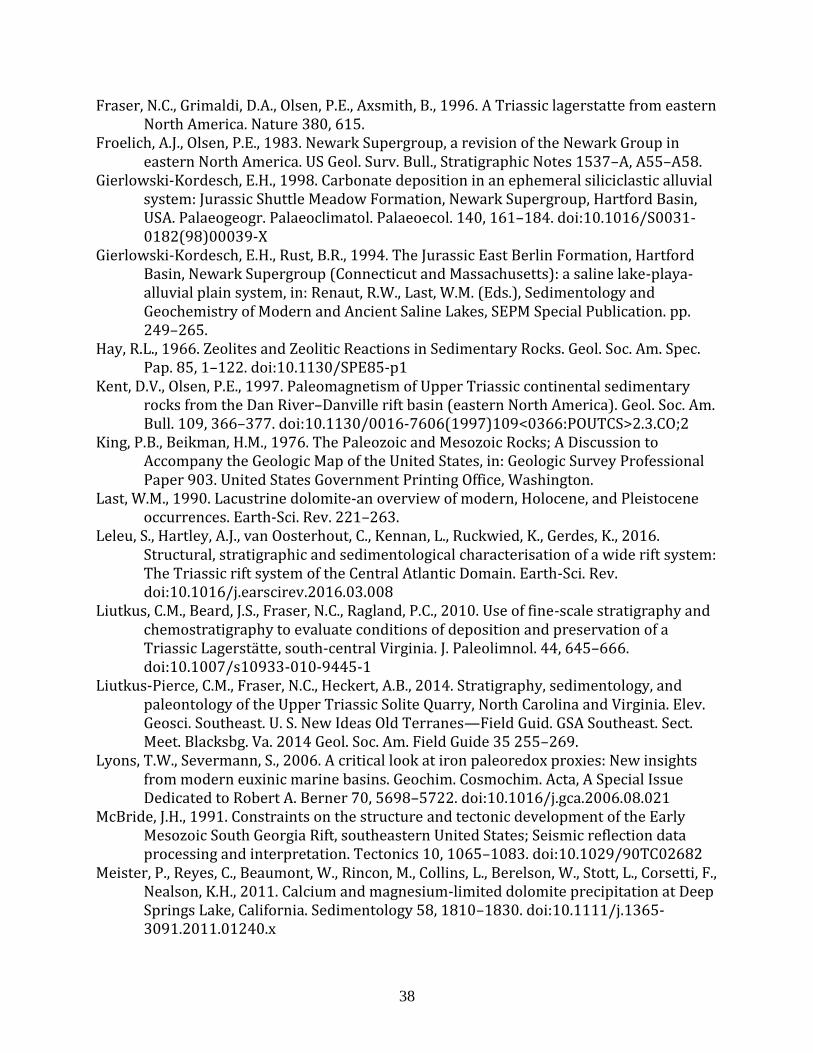
A world-class deposit of exceptionally preserved soft-tissue parts of organisms, a
Konservat-Lagerstätten, exists in the lacustrine Cow Branch Formation of the Dan River
Basin of southern Virginia and northern North Carolina (Figure 1A) (Kent and Olsen, 1997;
Olsen et al., 1991). This Triassic deposit contains an assemblage of exceptionally preserved
insects, as well as aquatic vertebrates and plant remains from a lake that once existed in
the Dan River Basin (Fraser et al., 1996). The insect fossils occur as silvery carbonaceous
compressions, preserving micrometer scale morphological detail, on the bedding planes of
a dolomitic, microlaminated black shale of the upper Cow Branch Formation. Sedimentary
layers immediately above and below the insect layer contain a variety of vertebrates
(reptiles and fish), arthropods (shrimp), and plant fossils. Despite nearly four decades of
research, geochemical and sedimentological conditions surrounding the deposition and
preservation of the Triassic Lagerstätte, including water chemistry and depth of deposition,
are still contentious. Here, I present a study to integrate fine scale chemical and
sedimentary changes across one climate cycle, including the Lagerstätte, to investigate the
environmental setting of this fossil deposit.
1. Geologic Setting
The Dan River Basin — also known as the Danville-Dan River Basin — is one of thirteen
Newark Supergroup Basins that formed in the middle to late Triassic during the rifting of
Pangaea. Structurally, these basins consist of an asymmetrical-half graben (McBride, 1991
and references therein). Specifically, in the Dan River Basin the Chatham fault zone borders
the basin on the northwest and dips to the southeast creating the northeast-southwest
2
trend of the basin (Ackerman et al., 2003). In the early Jurassic, after sedimentary infill, the
basin experienced inversion, probably a result of change in principal stress direction at the
onset of central Atlantic seafloor spreading and the emplacement of diabase dikes as a
result of CAMP (Central Atlantic Magmatic Province) (Withjack et al., 1998).
The Newark Supergroup collectively describes the continental sedimentary sequences of
late Triassic and early Jurassic age found in the North American East Coast rift basins
(Froelich and Olsen, 1983). During deposition of Newark Supergroup, the Dan River Basin
was located in the tropics close to the equator (Kent and Olsen, 1997). Water and sediment
flow into and through the North American rift basins was likely persistent, connecting
some basins hydrologically, however none of these basins ever opened enough to introduce
a marine component (Leleu et al., 2016). Each basin generally contains basal fluvial
sedimentary units, with some basins also containing a fluvio-lacustrine unit (Leleu et al.,
2016). The succession of formations in the Dan River Basin consist of, in ascending order,
the Pine Hall, Walnut Cove, Dry Fork, Cow Branch and Stoneville Formations (Figure 1B).
The units, like those of the Newark Supergroup elsewhere, are primarily comprised of
fluvial and lacustrine facies (Smoot, 1991). For this study I have focused on the fluvial Dry
Fork Formation and the lacustrine Cow Branch Formation.
Detailed investigation of the magnetostratigraphy of the Dry Fork-Cow Branch succession
has allowed for it to be correlated to a geomagnetic polarity sequence from the Newark
Basin (Kent and Olsen, 1997; Olsen et al., 2015). This correlation suggests that deposition
of the Dry Fork and Cow Branch Formations occurred during the Norian Stage of the Late
3
Triassic with deposition spanning 224 Ma to 216.5 Ma (Kent and Olsen, 1997; Olsen et al.,
2015).
The Cow Branch Formation, which hosts the insect lagerstätte, consists of primarily
lacustrine facies and is approximately 1900 meters thick near the basin depocenter (Van
Houten, 1962). The best exposure of this unit is found in the Eden Quarry, which is located
on the Virginia-North Carolina State Line (Figure 1A). Lacustrine lithofacies of the Cow
Branch display cyclicity consisting of 8-11 meter packages which contain organic-rich shale
that generally grades into siltstones and sandstones that contain mudcracks and ripple
cross bedding (Olsen, 1986; Smoot, 1991). These cyclic facies packages, termed Van Houten
cycles, have been related to astronomical forcings on the climate on the 21,000 year
precessional timescales that controlled the water balance of the lake (Olsen, 1986). While
the cyclicity of the lacustrine facies has been suggested to be driven by climate cycles
(evaporation vs. precipitation) (Olsen, 1986), the transition from fluvial to lacustrine facies
likely was also influenced by other factors including the topography of the sediment source
area and changing gradients of tributary streams, and sedimentary accretion within the
basin (Leleu et al., 2016; Smoot, 1991).
The Dry Fork Formation is found both below and interfingers laterally with the Cow
Branch Formation (Olsen et al., 2015; Smoot, 1991). Once considered a transition between
the coarser, fluvial Pine Hall and the more fine-grained, lacustrine Cow Branch Formation,
the Dry Fork is now considered to be a marginal fluvial facies (Olsen et al., 2015). The Dry
Fork Formation consists predominantly of red to purple, fine-grained, cross-bedded
4
sandstone, siltstones, and mudstones with less frequent lenses of finer, dark grey lenses of
mudstone (Olsen et al., 2015). Here we use the geochemistry of the lithofacies from the
marginal Dry Fork Formation to compare to those in the lacustrine Cow Branch Formation
that were deposited towards the basin depocenter in order to determine paleolake
chemistry and relative depth of deposition of the insect lagerstätte.
2. Van Houten Cycles in the context of the Cow Branch Fm.
As noted above, the cyclic facies of the Newark Supergroup, termed Van Houten cycles have
been linked astronomical forcings on the climate on the 21,000 year, precessional,
timescales (Olsen, 1986). In stratigraphic ascent, the classic Van Houten cycle, as originally
defined in the Newark Basin, begins with a relatively coarse red sandstone, often
containing reptile trace fossils and well-preserved flora, which are suggestive of a shallow,
playa-like lake environment. This red sandstone grades into fine sandstones and siltstones
with a purple color, containing similar fossils. These two facies have been defined as
Division 1 by Olsen et a. (1986), and are suggested to represent units deposited during a
lake level rise. This division is present in the Cow Branch Formation, however only cross-
bedded light grey, fine-grained sandstones are present within the cycle that contains the
lagerstätten. More ideal division 1 units, including coarse grained, red sandstones with
dessication features can be found elsewhere in the Cow Branch Formation. Above the
purple clastic units the cycle tends towards smaller grain sizes, including grey siltstone
intervals topped with dark grey to black mudrocks, containing aquatic vertebrate fossils
such as fish and the aquatic reptile Tanytrachelos, as well as an exceptionally well-
preserved flora. In the Eden Quarry this unit also contains the insect lagerstätten. These
5
facies have been defined by Olsen et al. (1986) as division 2 and represent a lake high-
stand. Moving further up within the cycle, the units tend back towards the grey siltstones
and purple and red coarser-grained facies, defined as division 3 that represents a lake-level
fall (Olsen, 1986). As described previously in Division 1, the grey siltstone to fine sandstone
facies characterize the beginning and end of the cycle investigated in this study (Figure 2).
In addition to the lithological changes associated with Van Houten Cycles, Olsen (1986 and
1989), noted several geochemical trends within these cycles. In the two studied cycles from
the Cow Branch Formation, carbonate content steadily decreases up section from the
laminated claystone facies (division 2; defined by Olsen, 1986) and only increases once
again with the next stratigraphic appearance of division 2 facies. There is also a short
interval of increased sulfur content at the initial transition to division 2 facies (Olsen 1986;
Olsen et al., 1989). The sulfur content throughout the cycles investigated never exceeds 1
wt % with an average abundance of 0.2 wt%. Also within the laminated claystone facies of
the Cow Branch formation cycles, there is an increase in total organic carbon abundance
from a baseline of 0.5-1.0 wt % to nearly 4.0 wt% (Olsen, 1986; Olsen et al., 1989).
Several lines of evidence suggest the lake was alkaline. Despite an abundance of quartz in
the shallow facies of Dan River Basin (Thayer et al. 1970) there is substantially less
preserved within the cycle containing the lagerstätten and the Cow Branch Formation as a
whole. Instead, there is an abundance of analcime, a zeolite (a sodium aluminum
tectosilicate mineral) commonly found in alkaline lakes (Hay, 1966) is present as a coarser
component, generally coarse sand and larger. Given the differing chemical stabilities of
analcime and quartz with pH, the mineralogy suggests that the lake chemistry was alkaline.
This is further supported by the presence of microsparry dolomite, which is present
6
throughout the cycle containing the lagerstätten (Liutkus et al., 2014; 2010). Dolomite is
known to precipitate in some alkaline lakes at pH values greater than 9 (Casado et al.,
2014), also suggesting that the Dan River lake was alkaline.
3. Models for the environment of formation of the lagerstätten
There are currently two competing hypotheses for the environment of preservation of the
Konservat-Lagerstätten at the Virginia Solite Quarry. Olsen et al., (2015, 1978) propose that
the preservation is a result of deposition of the fossils in a perennially chemically stratified
lake. They suggest that the anoxic environment below the chemocline in the lake inhibited
the scavenging and slowed microbial breakdown of the fossils. The initial transgression of
anoxic waters over more shallow sediments near the lake margins would have allowed for
the preservation of the soft tissue of the deposited organism (Olsen et al., 2015).
Like Olsen (1978), Litkus et al., (2010) suggest the preservation of the lagerstätte is also
product of a lake transgression. However in contrast, they suggest the environment of
preservation was a shallow, alkaline lake environment influenced by the chemistry of
groundwater seeps at the lake margins. In their model, Liutkus et al. (2010) note that the
deepest water, finely laminated, organic carbon-rich facies occur above the layer hosting
the insect lagerstätten. They cite occurrences of primary dolomite and analcime, as well as
the enrichment of F, Ca and Mg in the strata around the insect layer and the insect layer
itself as evidence of alkaline and potentially toxic waters that limited inhibited the
scavenging of the insects.
With the geochemical and sedimentological evidence presented here, I will thest the two
models. In a more basinward environment, as the Olsen (2015; 1978) hypothesis suggests,

7
data will show an active iron shuttle in the presence of anoxia, reflected as an enrichment
in highly reactive iron and increased organic carbon contents. In a more marginal and
alkaline environment as Liutkus et al. (2010) suggests, alkaline minerals will be present in
conjunction with variable organic carbon isotope values and little to no enrichment in
highly-reactive iron.
8
B. Methods
1. Core acquisition and sampling
Three 4 cm diameter cores totaling approximately 11 meters of material were taken from
Cow Branch Formation at Eden Quarry (36.540782°N, 79.672190°W; Figure 1A) using a
Shaw Backpack Drill. These cores sampled the sedimentary cycle that contains the insect
lagerstätte and part of the underlying cycle. The first core, Q1Pt, captured the 4.5 meters of
stratigraphy that included the lowest part of the cycle, including the horizon that contains
the insect lagerstätten, and the upper portion of the cycle below it. This core was drilled
into the exposed face previously excavated by the Virginia Museum of Natural History
during their excavation of the insect lagerstätten. Core Q1Md, captured the 3 meters of the
middle portion of the lagerstätte cycle and was drilled into an exposed face, approximately
9 meters from Q1Pt. Core Q1Br captured 4 meters of the upper portion of the cycle, was
drilled on the bench above the two exposed faces. It was drilled 5 meters from Q1Pt, on the
same line, perpendicular to strike. In total, these three cores sampled 11 meters of nearly
continuous stratigraphy. The two lower cores (Q1Pt and Q1Md) were correlated via a set of
fine-grained massive siltstone beds at 275 cm in the lower composite section (Figure 3).
Henceforth, the correlated core sections Q1Pt and Q1Md will be referred to as “Bottom
Core” and core section Q1Br will be referred to as “Top Core.”
After collection, the core material was cleaned and slabbed with a water-cooled rock saw.
The slabbed cores were then logged and described at the mm to cm scale, noting lithology
and mineralogy, color, sedimentary structures, trace fossils and bioturbation, and grain
size. Ultimately 33 intervals were selected for thin sections that were representative of
9
major facies and sedimentary structures. The cores were also sampled approximately
every 25 cm for geochemical analyses. The sample powders were obtained using a Dremel
tool with a diamond bit and homogenized using a mortar and pestle. Care was taken to
avoid sampling weathered portions of the cores and intervals with secondary veins, as well
as an observed fault zone. In total, 40 samples representative of facies and compositions
were selected for geochemical analysis.
Eleven hand samples from the fluvial Dry Fork formation were also collected from
exposures along Dry Creek, a tributary of the Dan River that flows through Eden, North
Carolina (36.488362°N, 79.758821°). The samples were collected from a ~225 m transect
along the bank of the creek and their stratigraphic order was noted, but distance from one
another stratigraphically was not logged. The Dry Fork hand samples were also sampled
via a Dremel tool and the resulting powders were homogenized.
2. Total organic carbon (TOC) contents and isotope compositions (13Corg)
Samples were acidified with 2N HCl for 24 hours to remove carbonate carbon from the
sample. The samples were then rinsed with doubly deionized (18 mΩ water until the pH
of the solution overlying the sample was neutral. Samples were then dried and loaded into
tin capsules for analysis. Determination of total organic carbon (TOC) contents and isotope
compositions were conducted on an Isoprime 100 continuous flow isotope ratio mass
spectrometer interfaced with an Elementar vario ISOTOPE elemental analyzer. Precision of
carbon content analyses was determined by replicate of samples and commercial elemental
All carbon isotope compositions are
10
reported in standard delta notation as per mil (‰) deviations from Vienna Pee Dee
Belemnite (V-PDB):
13C = ((13C/12Csample)/(13C/12CVPDB)-1)*1000
Replicate analyses of samples and international standards (IAEA CH-6 and CH-7 and
commercial standards) were equal to or better than 0.1‰ (1).
3. Iron speciation analyses
Iron speciation analyses are used here to evaluate redox conditions within the lake
(Poulton and Canfield, 2005). Iron is soluble and mobile in the Fe(II) valence state under
anoxic conditions, but readily forms oxide and hydroxide minerals and is thus immobile
when in the Fe(III) valence state under oxic conditions. Iron bound in minerals that are
reactive towards aqueous sulfide and will form pyrite during early diagenesis are termed
part of a pool termed highly reactive iron (FeHR). This includes iron found in carbonates,
iron hydroxides and oxyhydroxides, magnetite, as well as, in pyrite itself (Poulton and
Canfield, 2005; Canfield et al., 1986; 1996; Anderson and Raiswell, 2004). Remainder of the
sedimentary iron not found in the highly reactive is termed the unreactive iron pool (FeU)
and is predominately consists of silicate bound iron.
Samples were subjected to a sequential procedure that extracts iron from different
operationally defined, mineralogical pools in the sample following the procedures of
Poulton and Canfield (2005). Briefly, this sequential extraction consisted of: 1.) 1 M sodium
acetate heated at 50°C for 48 hours to extract iron from carbonate minerals (Fecarb) siderite
and ankerite; 2.) sodium dithionite (50 g L-1) for 24 hours to extract iron from oxides and
11
hydroxides (Feox); and 3.) 0.2 M ammonium oxalate and 0.17 M oxalic acid for 6 hours to
extract iron from magnetite (Femag).
After each extraction, an aliquot of the solution was taken for determination of its iron
contents. Iron contents of the solutions were determined via the ferrozine
spectrophotometer method (Stookey, 1970; Viollier et al., 2000) Replicate analyses of
samples using this method yielded a precision of 0.03% (1).
4. Pyrite sulfur and iron contents
Extraction and quantification of pyrite sulfur from the samples was achieved using the
chromium reduction method (Canfield et al., 1986). During the extraction, approximately
0.6 g of sample was reacted with 40 mL of 1 M chromous chloride solution and 20 mL of 12
N HCl and heated for two hours in a specialized distillation line under a nitrogen
atmosphere. This liberated hydrogen sulfide, which was then reacted in 0.24 M zinc acetate
solution recovering the sulfide as ZnS. The ZnS was then converted to Ag2S with the
addition of 0.18 M AgNO3 solution. The Ag2S precipitate was isolated by filtration (45μm)
and was dried. Pyrite sulfur concentrations were determined by gravimetry with a
precision of ±0.03 wt % (1) for repeat analyses. Pyrite iron contents were calculated using
the pyrite sulfur contents assuming the stoichiometry of pyrite.
5. Total iron content
The determination of total iron content followed the procedures of (Aller et al., 1986).
Samples were initially ashed in a furnace at 900°C for approximately 6 hours. The ashed

12
samples were then loaded into Savillex vials with 4 mL of 12 N HCl and heated at 150°C for
48 hours. After the reaction, aliquots of the solutions were taken to determine the total iron
content via the ferrozine spectrophotometer method (Stookey, 1970; Viollier et al., 2000).
Replicate analyses of samples using this method yielded a precision of ±0.02 wt % (1).
13
C. Results
1. Cow Branch lithofacies descriptions
Within the collected cycle, ten different lithofacies have been delineated. Two of the
lithofacies have also been divided into sub-lithofacies. I term these lithofacies “microfacies”
due to the fact that they are chosen on a cm-scale and can be found in units as thick as 60
cm down to 4 cm. Broadly the lithofacies correlate well with those described by (Smoot,
1991). Smoot (1991) noted that the Dan River Basin contains L1 through L4 lithofacies. In
the cycle of study, however, only lithofacies L1 through L3 are present and are described as
follows; L1 is described as flat, continuous laminations with some pinch and swell
structures, as well as more calcareous intervals. L2 is characteristically bioturbated and
massive. L3 indicates current reworking, often having scours and pinch and swell
structures. I have noted which of my lithofacies designations are equivalent to those of
Smoot (1991) in Table 1. It should also be noted that fractures were present throughout
the studied stratigraphy and were generally filled with calcite and minor amounts of iron
oxides. Soft sediment deformation and sedimentary dikes several centimeters in diameter
were also prevalent throughout the studied section.
i. Lithofacies 1
This lithofacies occurs in two units within the studied section (Figure 3; Table 1). The
intervals consist of medium grey shale to fine silt sized dolomite and clay, interbedded with
light grey to grey-blue fine to medium siltstone. These beds contain fine to medium
siltstones and often include white, relatively coarse (medium sand) grains of analcime.
Individual beds are roughly 0.5 to 1 cm thick and the contacts are generally deformed by
14
soft sediment deformation. Despite this, the contacts between the grey shale to fine silt
layers and the grey-blue fine to medium silt layers are sharp (Figure 4.1).
ii. Lithofacies 2a
Nine units consist of this lithofacies within the studied section (Figure 3; Table 1). These
intervals comprise of grey shale to very fine siltstone with fine scale (approx. 1-5mm)
convoluted interbeds of predominantly clay and dolomite. This lithofacies also contains
irregular structures that are generally lighter than the surrounding rock, but do not contain
noticeably coarser grains. Throughout the interval exist occasional white (fine to medium
sand size) grains, similar to Lithofacies 1. The very top of this lithofacies interval from
Bottom Core 110-117 cm displays upward fining. At the stratigraphic top of this small
scale fining up sequence there exists a large (approximately 3 mm x 5 mm) dark, angular
phosphatic fossil that is much larger than the surrounding grains (Figure 4.2).
iii. Lithofacies 2b
One example of this lithofacies is present within the section (Figure 3; Table 1). This
lithofacies consists of lithofacies 2a interbedded with lithofacies 3 at the 1-2 cm scale. The
contacts between the two lithofacies types are irregular or appear deformed (Figure 4.3).
iv. Lithofacies 3
This lithofacies is the most predominant within the studied stratigraphic section making up
13 defined units (Figure 3; Table 1). This lithofacies is medium grey in color and is made up
of primarily dolomite grains that range in size from clay to fine silt. The units are generally

15
massive with some occurences of soft sediment deformation, visible with color differences.
Typically, intervals associated with these lithofacies have unconformable or erosional
surfaces within them. Horizons containing 3-5mm thick accumulations of pyrite also are
visible within two units (Figure 4.4.a). The upper of these two intervals also include
phosphatic nodules. The interval between 414-448 cm in the top core includes a lighter
grey irregular shape similar to those described by (Pratt, 1998; Rodrı́guez-Pascua et al.,
2000; Smoot, 1991), visible by color difference and slight change in grain size, and possibly
represents an intrusion of another lithofacies into this lithofacies.
v. Lithofacies 4
This lithofacies occurs only once within the studied section (Figure 3; Table 1), but is the
longest continuous lithofacies unit, at nearly 60 cm thick. It is massive, blue/grey in color,
and appears to be bioturbated with no apparent grain-size trend. It is composed of very
fine silt with a heavy presence of medium sand sized white grains of analcime. This
lithofacies also includes medium to coarse silt sized black mineral grains (Figure 4.5).
vi. Lithofacies 5a
There are two occurrences of this lithofacies within the studied section and both are
relatively thick units, 22 and 52 cm (Figure 3; Table 1). The units are very dark grey to
black shale composed of microsparry dolomite and clay with very fine scale (sub-mm)
laminations. Laminations are carbonate rich, predominantly dolomitic and generally lighter
than the black shale and are not perfectly straight when viewed in thin section. The core in
these intervals is commonly chippy and fragmented. The intervals often contain coprolites

16
that deform the surrounding beds. White grains of fine sand size analcime are rare, as well
as larger, medium-coarse sand sized white nodules that appear to be aggregates of a
number of smaller (coarse silt to fine sand size) analcime and other black mineral grains
(Figure 4.6). These nodules are unreactive towards HCl. Compressed plant fossils are also
occasionally visible parallel to the bedding planes. The higher of the two intervals, Bottom
Core 375-427 cm includes bone fragments, as well as, "loop structures". These structures
have been interpreted elsewhere as being caused by syndepositional microfaulting that
interrupts the fine scale laminations and creating the look of looped lamination structures
(Calvo et al., 1998; Rodrı́guez-Pascua et al., 2000). The Bottom Core interval from 255-277
cm includes the insect layer.
vii. Lithofacies 5b
This lithofacies occurs in 6 intervals within the section (Figure 3; Table 1).
Sedimentologically, it is quite similar to lithofacies 5a. However it is slightly coarser
grained than lithofacies 5, however the grain sizes are still not silt sized. The color ranges
from very dark grey to dark grey with fine scale (sub-mm) wavy laminations similar to
those seen in 5a. Compressed plant fossils, preserved as silvery carbon compressions, are
visible on bedding planes. Loop structures are observed in most intervals of this lithofacies
(Figure 4.7.a). White analcime grains, as described in other lithofacies, are rare but
occasionally present, as well as, previously described black grains. The major differences
from lithofacies 5a are the slightly coarser grain size and the uncommon occurrence of
nodules. The top core interval from 84-130 cm includes a lighter (medium grey) and
somewhat coarser (fine silt) structure that appears similar to the one seen in lithofacies 3,
17
possibly the sedimentary intrusion of a different lithofacies like those described by Pratt,
1998; Rodrı́guez-Pascua et al., 2000; Smoot, 1991, (Figure 4.7.b).
viii. Lithofacies 6
This lithofacies occurs only once within the studied section (Figure 3; Table 1). It occurs in
fault zone and consists of a brecciated black shale with a coal-like texture and contains
fractures filled with white calcite veins.
ix. Lithofacies 7
There is one example of this lithofacies within the studied stratigraphy (Figure 3; Table 1).
It ranges from a very dark grey to black shale to very fine silt-sized clays and microsparry
dolomite with convoluted interbeds on the 2-5mm scale, noted by color change. The lower
part of the interval includes mm-scale pyrite nodules, a bone fragment, and unidentifiable
compressed fossils. Loop structures also occur, but are often hard to pick out due to the
consistent dark of this lithofacies. Occasional white analcime nodules (1-2 mm scale) and
grains (< 1mm) described in previous lithofacies are also present.
x. Lithofacies 8
There is one interval of this lithofacies type within the studied section (Figure 3; Table 1).
This lithofacies is generally a dark grey shale to very fine silt with mm scale ripple cross-
bedding (Figure 4.8). The intervals are otherwise very similar to lithofacies 7.
18
xi. Lithofacies 9
This lithofacies comprises small (1-2mm) massive dark brown beds of fine silt that occur in
four isolated intervals within the core cycle (Figure 3; Table 1). While these units are an
order of magnitude smaller in scale as compared to units of the other lithofacies they are
distinct and make unique marker beds that were used to correlate the Bottom Core
composite section (Figure 4.9).
xii. Lithofacies 10a
There are four intervals of this lithofacies within the core cycle (Figure 3; Table 1). These
are predominantly comprised of massive, weathered units that range from medium brown
to rust orange to light orange in color. Grain size ranges from very fine silt to fine sand. Fine
sand intervals may be a product of dissolution of smaller grains and give the appearance of
a larger grain size. I note this lithofacies separately because of its weathered nature and,
likely had they not been exposed to weathered, they may have fit into another lithofacies
designation (Figure 4.10).
xiii. Lithofacies 10b
There are two instances of this lithofacies within the core (Figure 3; Table 1). The intervals
are essentially the same as lithofacies 10 with respect to grain size and color, however
faint, fine scale (sub mm) laminations can be observed (Figure 4.11).
19
2. Dry Fork lithofacies descriptions
A detailed lithofacies analysis was not conducted on the samples from the Dry Fork
Formation. Hand samples collected from the Dry Fork range from red to orange brown,
massive coarse siltstones to very fine-grained sandstones. The Dry Fork interval from
which we sampled probably resides in F4 or F5 as defined by Smoot (1991). F4 includes
fining up sequences of sandstone to silty mudstone and F5 are inclined beds of fine
sandstone to mudstone, with mud being deposited during slack periods (Smoot, 1991).
3. Interpretation of depositional processes
Broadly, lithofacies can be divided into two main groups. Lithofacies 1-4 and 8 are
interpreted as having been deposited in a more marginal environment. While grain size
throughout the cycle remains relatively small, the coarsest grain sizes (medium-coarse silt
and fine sand) are seen in these lithofacies. Smaller-scale transitions can be seen in
lithofacies 3, suggesting a more shallow and dynamic depositional environment. Structures
throughout these lithofacies are also indicative of a more marginal environment, including
heavily bioturbated intervals like lithofacies 4, as well as ripple structures in lithofacies 8,
indicating reworking of sediment by currents. As a group, these lithofacies exhibit a broad
fining-up trend in the bottom of the core, indicating deepening, and a coarsening-up trend
in the top of the core, indicating shoaling. The second lithofacies group, lithofacies 5-7
separates the two grain-size trends as the more basinward depositional environment.
As previously stated, lithofacies 5-7 are interpreted to have been deposited in a more
basinward position. Evidence for this interpretation includes visible darkening of the
lithofacies, suggesting increased organic carbon content as well as presence of the finest
20
grains (clay to very fine silt size) within the cycle. Structures indicative of deposition in low
energy environments, such as fine-scale laminations and microbial mat-like structures are
present in all lithofacies within this group. The lack of any grain size trend suggests that
these lithofacies were deposited within a lake high-stand, potentially distally enough that
higher-order fluctuations in lake level or accommodation were not recorded as lithofacies
changes.
Lithofacies 9 is interpreted as having been deposited in a more marginal environment with
conditions favoring primary carbonate precipitation, as beds are thin but massive and
almost entirely dolomitic. This lithofacies was distinguished from the other marginal
lithofacies due to its use as a marker bed for correlation between core Q1Pt and core Q1Md
to form the composite “bottom core.”
Lithofacies 10a and 10b are separated from the marginal lithofacies group due to their
weathered nature. Remnant structures present within the lithofacies, such as ripple cross-
bedding and potential fluid escape structures suggest that if not for their weathering, they
would be included in the marginal lithofacies group.
4. Geochemistry of Cow Branch Samples
i. Total organic content and Corg isotopes
Stratigraphic trends of total organic carbon contents follow lithofacies changes to a high
degree. Low TOC (0.25-0.5 wt%) contents occur in the lighter, more coarse-grained
lithofacies (1-4) with few exceptions. Towards the middle of the core cycle with the first
transition into lithofacies 5a, the TOC rises sharply. Over approximately the next 60 cm, the
color of the lithofacies rapidly change from grey to dark grey to black and the color change
21
coincides with the rise in TOC from ~0.25 wt% to a peak abundance of 3.5 wt%. The insect
lagerstätte occurs in the early part of the lowest unit of lithofacies 5a (from Bottom Core
255-274) in this interval of increasing TOC contents. It is also noteworthy that the highest
TOC values occur in the darkest colored, finely laminated lithofacies (5a and b) (Figure 3).
These high TOC levels are sustained through the interval comprised of lithofacies 5-7. TOC
contents begin to decline up section with the transition back to intervals of lithofacies 1-4.
Towards the top of the cycle, around Top Core 285 cm in the last appearance of lithofacies
5b, the color is less dark than similar stratigraphically lower units, but TOC is still increased
above background at 1.5 wt % (Figure 3).
Organic carbon isotopes isotope values through the entire studied section range from
approximately -29‰ to -22‰. Carbon isotope values tend to be the most negative in
lithofacies 5-7 and have relatively narrow range isotope compositions; -29‰ to -27.5‰
with a few outliers. Conversely, organic carbon isotope compositions of lithofacies 1-4
show a broader range of compositions -27.5‰ to -21.7‰ (Figure 3).
ii. Pyrite sulfur content
Overall pyrite sulfur contents are low for the entirety of the cycle with the highest content
reaching 0.39 wt % sulfur. However there is there is an increase in pyrite sulfur that
coincides with the increase in TOC and first instance of lithofacies 5a. However, unlike the
TOC values, the sulfur content does not stay consistently high throughout the middle
22
section of the sedimentary cycle and rapidly decreases up section as you move out of
lithofacies 5a.
iii. Iron speciation
Iron speciation, as described in the methods section, was used to determine the
mineralogical pools where iron is bound. Four separate pools were determined; carbonate
iron (FeCARB), iron (oxy)hydroxides (FeOX), magnetite (FeMAG), and pyrite iron (FePY) (Figure
5). Carbonate-bound iron (FeCARB) was generally the most abundant and highly reactive
iron pool throughout the studied interval ranging from 1 to 1.3 wt%. This pool of iron
tended to compose 20% to 25% of the total iron pool. Iron bound in (oxy)hydroxides (FeOX)
do not make up an appreciable part of the total iron pool throughout the entire cycle with
values of less than <1 wt%, and make up typically between 3 to 6% of the total iron pool.
Oxy-hydroxide bound iron content does not correlate with any lithofacies type but did
become slightly more abundant in lithofacies adjacent to the weathered lithofacies
(weathered intervals within the core cycle were not sampled for geochemistry.).
Magnetite iron (FeMAG) is present in all of the core samples and tends to be the second most
abundant iron pool within the highly reactive iron pool. FeMAG values do not follow any
clear trends stratigraphically, but in many cases is more abundant when FeCARB is less
abundant. Magnetite makes up approximately 5 to 10% of the total iron. Compared to the
entire sample, magnetite makes up about 0.4 to 0.6 wt% with some exceptions in both
directions.
Iron bound in pyrite or sulfide minerals (FePY) is sparse throughout the entire core cycle.
Values are notably low, with FePY making up less than 4.5% of the total iron. FePY never
23
exceeds 0.35 wt % of the total sample and is generally around 0.05 wt% or less. However,
in samples that coincide with higher TOC contents and more negative 13Corg like lithofacies
5-7, FePY contents range from 7.1 to 9.6% of the total iron. Though pyrite lags were avoided
while sampling, higher FePY values do occur with lithofacies 3 that contain these lags
(Figure 3).
Geochemistry of the Dry Fork Samples
i. Total organic content and Corg isotopes
TOC contents for the Dry Fork samples low. Samples collected range in value from 0.04 to
0.07 wt% TOC. Through the stratigraphic progression of the sample set, there are no visible
trends. The TOC contents were also marginally lower than lowest content seen in the Cow
Branch samples. 13Corg values for the Dry Fork samples were range from -26.72‰ to -
28.16‰. Compared to the core values, the Dry Fork lithofacies are closer to the values of
Cow Branch Formation lithofacies 5-7 as described above, but are slightly less negative by
~1‰ (Figure 3).
ii. Iron speciation:
The Dry Fork samples are generally low in FeCARB and on average is less than 0.25 wt% of
the total sample and it makes up from 1 to 5% of the total iron pool. FeCARB abundance is
also an order of magnitude less than those of the Cow Branch. The Dry Fork samples are
appreciably lower than the Cow Branch in FeMAG as well, with all values less than 0.17 wt %
of the total sample and making up less than 2.7% of the total iron pool. FePY in the Dry Fork
samples matches the lowest values in the Cow Branch formation (lithofacies 1, 2, 4 and 5b),
24
roughly 0.00 to 0.05 wt % of the total sample and less than 0.7% of the total iron pool.
However, FeOX is more abundant compared to the Cow Branch samples, ranging from 0.53
to 0.80 wt % of the total sample and 11 to 16% of the total iron pool (Figure 5).
D. Discussion
1. Lithofacies succession and lake level history
To a large degree, the lithofacies data observed within the stratigraphic cycle collected
agrees with the previously investigations of the Cow Branch Formation (Smoot, 1991;
Olsen, 1986; Olsen et al., 1989; 2015; Van Houten, 1962; 1964). There is a notable
stratigraphic progression of lithofacies that suggests a deepening and subsequent shoaling
of the local lake environment. Lithofacies 1-4 make up the majority of the lower half of the
cycle. Lithofacies 1 and 2 are among the coarsest in the cycle with silt-sized grains.
Lithofacies 3 is the most common lithofacies in the cycle with respect to both stratigraphic
range and combined thickness of constituent packages. Its massive structure, intermediate
grain size (clay size to fine silt) and stratigraphic position may suggest this is a transitional
lithofacies between intervals dominated by lithofacies 1 and 2 and lithofacies 4. The fine-
grained matrix (with the exception of coarse silt to sand sized secondary grains) of
lithofacies 4 is massive, like lithofacies 3, suggesting that it is heavily bioturbated and
would then represent an environment conducive for benthic organisms to inhabit the lake
floor.
Within the lower half of the studied section there is a general up-section fining of grain
sizes. This portion of the section can be divided in lithofacies packages that also fine
upward: Lithofacies 1-2a transitioning into lithofacies 3. This pattern suggests high
25
frequency transgressive cycles that were the product of changes in lake level during this
interval.
Continuing up-section there is the relatively abrupt appearance of lithofacies (5-7) that
consist of darker, finer-grained lithologies, predominantly shales. These units have been
traditionally interpreted as deep water lithofacies (depth rank 4-6 of Olsen et al. 1986) and
their initial stratigraphic appearance with little to no interfingering (although lithofacies
2b could be considered the transition interval) suggests a local deepening of the
environment and marks a transgressive interval of the cycle followed by a lake highstand.
Notably, the insect lagerstätte occurs in this initial transgressive interval. Further evidence
for lake transgression is the short-lived relative enrichment in pyrite. This may be
reflective of slowed sedimentation rates compared to the rest of the cycle as a whole, which
allowed for a greater amount of authigenic pyrite formation.
I consider both subsets of lithofacies 5 to be deposited in a relatively deep environment
given the high TOC contents, preserved lamination and lack of bioturbation and lack of
current produced sedimentary structures. However there is a notable distinction between
the two subfacies of lithofacies 5 that may reflect changes within the lake environment:
a. Lithofacies 5a contains a greater abundance of larger secondary analcime grains,
which signals that the lake water or pore waters within the sediments were
saturated with respect to this mineral. This may reflect a higher salinity (and greater
contents of Ca and Mg) of the lake water during the deposition of this lithofacies.
26
b. Lithofacies 5b is essentially the same lithofacies as 5a, but the most striking
difference is the lack of large analcime grains and nodules. This could be because 5b
represents sediments deposited at lake high-stand, where the lake waters were
freshest and/or the supply of clastic silicate minerals or volcanic glass (that would
have supplied silica for the production of analcime) to the central part of the basin
was decreased. Both of these factors would have resulted in an overall decline in
analcime saturation.
Continuing up-section, with the stratigraphically highest instances of the more basinward
lithofacies 5b, lithofacies 3 begins to reappear and above which coarser grain lithofacies
once again begin to dominate the cycle. Within the upper half of the cycle there is a general
up-section coarsening of grain sizes. The lithofacies in this portion of the section can also
be divided in lithofacies packages that also coarsen upwards: Lithofacies 5b transitioning
into lithofacies 3 to 2a. This pattern is suggestive of higher frequency regressive cycles
within this interval.
While lithofacies 10a and 10b are designated as separate lithofacies due to their weathered
nature, it is likely, based on the few sedimentary structures preserved and their
stratigraphic position, that they would have originally represented lithofacies divisions 1, 2
and 3.
In summary, over the studied stratigraphic interval the lithofacies changes are interpreted
to show a gradual deepening and subsequent shallowing of the local lake environment.
Olsen (1986) and Olsen et al. (1989) linked the lithofacies changes on this scale to the 21
27
kyr precessional cycle using power spectra analysis of the thickness of lithofacies units
classified with their depth rank classification. It is also notable that superimposed on this
broader change, there are clear higher order cycles that likely reflect shorter-term changes
in lake level.
2. Iron shuttle model and sedimentary redox in the Dan River Basin
In modern anoxic basins like the Black Sea, there exists an active iron shuttle that enriches
the deep basinal sediments in highly reactive iron relative that shallow shelf sediments
deposited under oxic to suboxic waters (Raiswell and Canfield, 1998; Anderson and
Raiswell, 2004; Poulton and Raiswell, 2002; Lyons and Severmann, 2006). In the oxic
waters, iron is generally found as ferric iron, Fe (III), and is immobile and insoluble,
precipitating as iron oxide and hydroxide minerals. However, when these ferric iron
minerals are buried in shallow reducing sediments on the margins of an anoxic basin, they
can be subsequently reduced to ferrous iron, Fe(II) and released back into the water
column. This iron can then undergo a repetitive cycle of oxidation and reduction, with
Fe(II) in solution being reoxidized and redeposited back into the shelf sediments as iron
(oxy)hydroxide minerals. However some of the Fe(II) remains in solution and can be
eventually transported or ‘shuttled’ from the margin to the anoxic water column above the
deep basin. Without the capacity to become oxidized again, the iron eventually precipitates
as ferrous iron bearing minerals that are deposited in the deep basin sediments (Canfield et
al., 1996; Raiswell and Canfield, 1998; Anderson and Raiswell, 2004; Lyons and Severmann,
2006). This overall process causes an enrichment of highly reactive iron over the total iron
(reflected in the ratio: FeHR/FeTOT) in the deep basinal sediments as compared to the
28
shallow shelf sediments (Anderson and Raiswell, 2004; Canfield et al., 1996; Poulton and
Raiswell, 2002; Raiswell and Anderson, 2005). Hence this proxy can be used to identify the
presence of anoxic water columns in ancient settings (Figure 6).
This proxy has been most often applied to both modern and ancient marine basins, where
oxic sediment baseline values can or have been established (Canfield et al., 2008; Farrell et
al., 2013; Lyons and Severmann, 2006; Raiswell et al., 2011, 2001) However, in order for
this proxy to be applied in my study of the Dan River Basin, the FeHR/FeTOT of the oxic
environments that were the source of iron to the deep basin must be identified. In the case
of the Dan River Basin, I have utilized the fluvial Dry Fork Formation — the formation
directly underlies and is also laterally equivalent to the Cow Branch Formation (see
“Lithofacies Descriptions” above) — to establish oxic FeHR/FeTOT baseline for the Dan River
Basin (see oxic Figure 3).
The iron speciation data from the Cow Branch and Dry Fork Formations suggests that an
iron shuttle was active during the deposition of the studied section of the Cow Branch
Formation (Figures 2, 4, and 5). Throughout the section highly reactive iron is consistently
enriched in highly reactive iron over total (FeHR/FeT ≈ 0.40) as compared to the samples
from Dry Fork Formation (FeHR/FeT ≈ 0.20) (Figure 3). However, it is important to note
here that samples from Dry Fork Formation are not time equivalent to the Cow Branch
Formation as they are from the portion of the Dry Fork Formation that underlies the Cow
Branch; samples from what would be the time equivalent Dry Fork Formation were not
available to be sampled. However based on the consistency of the FeHR/FeT from Dry Fork
Formation over ~150 meters of the sampled stratigraphy and the large enrichment found
29
in the Cow Branch Formation suggests they are valid for establish the oxic baseline values
for the basin.
Thus based on this data, the studied sequence of the Cow Branch Formation was deposited
under anoxic waters, based on the enrichment of the highly reactive iron over that seen Dry
Fork Formation (Figure 3). Also, based on the proportion of pyrite bound iron to total
highly reactive iron (Fepy/FEHR), data suggest that water column was never euxinic (anoxic
and H2S-rich). In modern systems deposited under euxinic conditions, Fepy/FeHR exceeds
0.75, that is 75% of the highly reactive iron pool is found in pyrite (Raiswell et al., 1988).
Any instances of increased pyrite iron content appear to coincide with intervals of either
low sedimentation rates like lithofacies 5a and 5b or pyrite lags near unconformable
surfaces like those observed lithofacies 3 that likely accumulated by reworking and
winnowing of sediments.
By comparing organic carbon to the pyrite sulfur contents of the Cow Branch samples, it is
clear that the lake waters were relatively low in sulfate (Figure 7). All the samples fall well
below the ratio of organic carbon to pyrite sulfur contents of 2.8 that is typical of reducing
marine sediments deposited under sulfate-replete conditions (Berner et al., 1979). In these
sediments, microbial sulfate reduction and subsequent pyrite formation are limited by the
diffusion of sulfate into the sedimentary pore waters. In contrast, euxinic sediment
(deposited under anoxic, and hydrogen sulfide containing water columns) have C/S that
fall plot above this 2.8 threshold and are instead limited by availability of highly reactive
iron provided by the iron shuttle (Raiswell and Berner, 1985). Sediments deposited in
sulfate-poor systems, such as lakes and freshwater wetlands, plot below the 2.8 line where
microbial sulfate reduction and pyrite formation are limited by the overall availability of
30
sulfate (Berner and Raiswell, 1984). Together, the elevated FeHR/FeT and low Fepy/FeHR and
organic carbon-to-pyrite sulfur ratios indicate that deposition of the Cow Branch sediments
was under anoxic, iron-rich (ferruginous) waters (Figures 2, 4, and 6).
The interpretation that lithofacies like 5a and 5b were deposited under an anoxic water
column is consistent with the traditional deep water interpretation for these units (Arthur
et al., 1984; Calvert et al., 1996) and agrees with hypothesis of depositional environments
by Olsen (1986). Presence of laminations and elevated TOC content also suggest that they
were below wave influence under a stratified water column. However it should be noted
that the laminations can be biologically mediated (i.e. laminations created by benthic
microbial mats), which may be the case for the wavy lamination (lithofacies 5a and 5b).
This however does not refute the interpretation of a deep-water environment as microbial
mats can be found both above and below chemoclines in modern environments. CITE
The presence of enriched FeHR/FeT that indicate anoxic, ferruginous conditions in
lithofacies (1-4) that contain bioturbation and sedimentary structures indicative of current
energy are in apparent conflict. However, these signals may point to intermittent anoxia,
perhaps developing seasonally, where the substrate could have been colonized by benthic
fauna at times, but the sediment retained the geochemical fingerprint of anoxia.
Alternatively, these units may have been deposited at the base of the mixed layer, which at
times allowed for presence of organisms, but still remained reducing (dysaerobic) enough
for the iron shuttle to function and enrich the local highly reactive iron pool.
Overall, the iron speciation indicates that there was, indeed, at least intermittent and
possibly persistent stratification of the water column based on enrichment of highly
reactive iron throughout the cycle. This is further supported by the presence of high total
31
organic carbon contents through the middle portion of the section, including the insect
layer. I suggest that those lithofacies (5-7) were persistently anoxic and were deposited
during a lake transgression and high stand. Lithofacies near the top and bottom of the cycle
(1-4) where the TOC is closer to background levels were probably intermittently anoxic or
close enough to the chemocline to still enrich the highly reactive iron above fluvial Dry
Fork levels.
3. Primary dolomite formation within the Dan River Basin
The iron carbonate is the primary host for the FeHR enrichment in the Cow Branch
Formation (Figure 5) and dolomite is the dominant carbonate mineralogy throughout the
formation (Table 1). In the context of the iron shuttle model this dolomite would have been
formed syngenetically and/or during early diagenesis. This is in agreement with recent
studies that suggest the majority of the microsparry dolomite within the Cow Branch is
primary (Liutkus et al., 2010; Liutkus-Pierce et al., 2014).
Several models have been suggested for dolomite formation in lacustrine systems with high
pH, high-Mg, and low salinity. These include primary precipitation of dolomicrite, the
nodulization of dolomicrite, or local dissolution and replacement of Mg-rich clays during
early diagenesis within the sediments (Casado et al., 2014). Additionally, dolomite
precipitation in alkaline and saline lakes is thought to be mostly microbially mediated
(Meister et al., 2011; DeDeckker and Last, 1989). The concurrence of dolomite within
intervals with wavy laminations suggests a role for microbes in the formation of the Cow
Branch dolomites. Given the lack of quartz in the Cow Branch Formation combined with the
pseudosparry/microsparry dolomite associated with microbial laminites (Liutkus-Pierce et
32
al., 2014; Liutkus et al., 2010), it is likely that the dolomite within the basin is
predominantly primary, and if that is the case, it provides evidence for an alkaline
environment (Last, 1990). Carbonate accumulation in the alluvial formations of the
Hartford basin, another East coast Mesozoic rift basin, has been noted and hypothesized as
having resulted from a Ca-rich source rock, either from surface runoff or groundwater and
precipitating due to the ephemeral paleolake dynamics (Gierlowski-Kordesch, 1998;
Gierlowski-Kordesch and Rust, 1994). It follows that adjacent Paleozoic carbonates (King
and Beikman, 1976) could have been a similar source to the Dan River Basin (Liutkus et al.,
2010; Liutkus-Pierce et. al, 2014).
There is, as noted by Litukus et al. (2010; 2014), some secondary diagenetic dolomite
overgrowths and coarsening an observation that I also note. Liutkus et al. (2010; 2014)
observed that the dolomite cores are Ca-rich, while the secondary rims are predominantly
Fe- and Mn-rich. However, Liutkus et al., (2010; 2014) consider the majority of dolomite to
reflect syngenetic or early diagenetic dolomite due to: 1) the size of the microsparry
dolomite crystals in the Cow Branch sediments (5–20 m) which still fall within the range
of biologically mediated, primary dolomite, 1–120 m (Gierlowski- Kordesch 2010); 2) the
preservation of distinct dolomite bearing laminae, and 3) the high porosity and
permeability that would be needed for secondary dolomite precipitation. While I
hypothesize here that the dissolution and subsequent coarsening of the dolomite was an
early diagenetic process and the original highly reactive iron signature was preserved, the
observation of coarser relatively Fe-rich rims and their implications for the iron speciation
proxy warrants further investigation.
33
4. Organic carbon sources in the Dan River Basin
The relationship between the total organic carbon contents and their isotope composition
from the Dan River Basin lithofacies can be used to infer the sources organic matter to the
sediments the and processes that act on that organic matter (Meyers, 1994) In Figure 8, a
cross plot of TOC content with 13Corg, it is clear that lithofacies cluster together based on
their interpreted depositional environment (i.e shallow lithofacies 1-4 and deeper
lithofacies 5-7).
Lithofacies that are considered to be deep water (lithofacies 5-7) broadly tend to cluster
along a vertical arm of the 13Corg versus TOC (Figure 8). They span a range of TOC values,
but it is clear that they have a consistent and more negative 13Corg values than the
shallower lithofacies (1-4). Given these observations the organic matter was likely sourced
from primary production within the lake, coupled with a decreased input of terrigenous
organic matter (Deines, 1980). The anoxic conditions within the deeper waters of the lake
likely inhibited microbial degradation of the organic matter resulting in relatively higher
TOC contents and preserving more negative 13Corg values (Deines, 1980; Talbot and
Livingstone, 1989).
In contrast, lithofacies 1-4 cluster at lower TOC contents and have 13Corg span a range of
values that are generally less negative relative to lithofacies 5-7 (Figure 8). Based on
sedimentological observations these units were deposited under shallower waters under
intermittently anoxic conditions. Since these lithofacies have a range of 13Corg values they
may reflect the mixing of organic matter sources or the degraded organic matter, which
drives 13C of organic matter to less negative values (Peterson and Fry, 1987). In order to
34
distinguish between these two hypotheses we compare the 13Corg of the lithofacies 1-4 of
the Cow Branch to those of the Dry Fork Formation.
Organic matter in the Dry Fork Formation, since it is a fluvial unit, would be composed
primarily of terrigenous organic matter. Organic matter from the Dry Fork Formation has
slightly less negative 13Corg (~1‰) — as compared to the lithofacies 5-7 and the most
negative values of lithofacies 1-4 of the Cow Branch (Figure 8). Therefore, mixing of this
organic matter, of which degradation prior to deposition in the basin would only increase
its 13Corg by 1-2‰ (Burchardt and Fritz, 1980) with that of primary production within the
lake (i.e. 13Corg of lithofacies 5-7), cannot explain the full range of 13Corg values seen
lithofacies 1-4. Thus, this suggests that the range of 13Corg seen in lithofacies 1-4 were
caused by continual microbial degradation of organic matter during early diagenesis. This
makes sense in the context of the low TOC contents of these units and the sedimentary
observations that indicate the reworking of these units by bioturbation and current action;
these processes would increase the oxygen exposure time of the organic mater aiding in its
degradation.
5. Model for formation of the lagerstätten
Based on the data presented above, and in agreement with previous literature (Liutkus et
al., 2010; Liutkus-Pierce et al., 2014; Olsen et al., 1989) deposition of the insect lagerstätte
present in the studied cycle resides in an early to mid-lake transgression. The onset of the
transgression is signaled by decreased sedimentation rates and a trend to finer-grained
sediments. Bedding becomes gradually thinner until laminations dominate the
transgressive and high-stand lithofacies (5-7). Sedimentary structures present in
lithofacies below the lagerstätten, 1-4 and 8, like bioturbation, ripple cross-bedding and
35
scour marks signal an environment that was shallow and intermittently oxic enough to
allow habitation by organisms.
The lagerstätte occurs in the interval right after the transition to the thin beds of lithofacies
5a that suggest a calmer and less marginal environment. The early part of this lithofacies
transition also includes a short-lived spike in pyrite sulfur contents relative to both total
iron and highly reactive iron, which I invoke to be the product of a slowing sedimentation
rates, creating a condensed interval, often associated with transgression. The sulfur spike
occurs well into the onset of the increase and subsequent long-term enrichment in total
organic carbon, which suggests a transition of the depositional environment to a more
persistently anoxic water column in a deeper-basinal setting.
The deposition of the lagerstätte was presumably the product of a combination of several
environmental factors. The transgression of the lake was likely very important. In the
initial phase of deepening of the lake, the source of the insects and other organisms, the
shallow lake waters and lake margins, would have been relatively close to the spatial
location of the lagerstätten’s deposition, while the water column at the site of deposition
was deep enough to maintain persistent benthic anoxia. The anoxic and potentially alkaline
lake water chemistry at the site of fossil deposition inhibited scavenging of insects and
other organisms below the chemocline. The ferruginous conditions within the lake also
played role in the soft body preservation; a model for organic preservation has invoked a
role of the adsorption of Fe(II) organic biomolecules as protecting organic fossil remains
from decomposition by microbial enzymes (Petrovich, 2001). Thus, the unique chemistry
of the lake combined with right depositional setting and position within the lake resulted in
the formation of the lagerstätten-bearing interval.
36
E. Conclusions
The integration of sedimentological and geochemical data presented here point to
deposition of the Triassic lagerstätte under anoxic, ferruginous and alkaline conditions
during the initial phase of lake transgression. The relatively short time scale of lake level
change is illustrated by lithofacies and geochemical progression in three stages. Stage 1 is
composed of more marginal lithofacies 1-4 and broadly fines up towards Stage 2 (Figure
9A). Stage 2 is considered to be a more basinward depositional environment or lake high-
stand, where the finest grained lithofacies are deposited and anoxia is persistent. Stage 2
includes the insect lagerstätten (Figure 9B). Stage 3 is the subsequent shoaling of the deep
lake to more marginal sediments (Figure 9C). The shallow, half-graben style of the rift
basin allowed for rapid change of lake level by orbital driven climate cycles. The
predominantly dolomite- and analcime-rich mineralogy suggests that lake chemistry was
alkaline through the majority of the cycle. Enrichment of the highly reactive iron pool in the
Cow Branch Formation relative to the fluvial Dry Fork Formation points at least
intermittent anoxic conditions throughout the cycle. In the context of the lagerstätten,
these conditions may have eliminated or limited scavenging of the fossils. However the lake
appears to have been sulfate-poor and never developed euxinia. The deposition and
preservation of the lagerstätte was therefore likely a product of a goldilocks scenario
within the cycle, where these spatial, sedimentological, and geochemical factors worked
together to produce a world-class insect site.
37
F. References
Ackerman, R.V., Schlische, R.W., Patino, L.C., Johnson, L.A., 2003. A Lagerstatte of Rift-
Related Tectonic Structures from the Solite Quarry, Dan River–Danville Rift Basin, in: Le-Tourneau, P.M., Olsen, P.E. (Eds.), The Great Rift Valleys of Pangea. Columbia University Press, pp. 118–133.
Aller, R.C., Mackin, J.E., Cox Jr, R.T., 1986. Diagenesis of Fe and S in Amazon inner shelf muds: apparent dominance of Fe reduction and implications for the genesis of ironstones. Cont. Shelf Res., Sedimentary Processes on the Amazon Continental Shelf 6, 263–289. doi:10.1016/0278-4343(86)90064-6
Arthur, M.A., Dean, W.E., Stow, D. a. V., 1984. Models for the deposition of Mesozoic-Cenozoic fine-grained organic-carbon-rich sediment in the deep sea. Geol. Soc. Lond. Spec. Publ. 15, 527–560. doi:10.1144/GSL.SP.1984.015.01.34
Berner, R.A., Baldwin, T., Holdren, G.R., 1979. Authigenic iron sulfides as paleosalinity indicators. J. Sediment. Res. 49, 1345–1350. doi:10.1306/212F7923-2B24-11D7-8648000102C1865D
Berner, R.A., Raiswell, R., 1984. C/S method for distinguishing freshwater from marine sedimentary rocks. Geology 12, 365–368. doi:10.1130/0091-7613(1984)12<365:CMFDFF>2.0.CO;2
Burchardt, B., Fritz, P., 1980. Environmental isotopes as environmental and climatological indicators, in: Fritz, P., Fontes, J.C. (Eds.), Handbook of Environmental Isotope Geochemistry. Elsevier, Amsterdam, pp. 473–504.
Calvert, S.E., Bustin, R.M., Ingall, E.D., 1996. Influence of water column anoxia and sediment supply on the burial and preservation of organic carbon in marine shales. Geochim. Cosmochim. Acta 60, 1577–1593. doi:10.1016/0016-7037(96)00041-5
Calvo, J.P., Rodriguez-Pascua, M., Martin-Velazquez, S., Jimenez, S., Vicente, G.D., 1998. Microdeformation of lacustrine laminite sequences from Late Miocene formations of SE Spain: an interpretation of loop bedding. Sedimentology 45, 279–292. doi:10.1046/j.1365-3091.1998.00145.x
Canfield, D.E., Poulton, S.W., Knoll, A.H., Narbonne, G.M., Ross, G., Goldberg, T., Strauss, H., 2008. Ferruginous Conditions Dominated Later Neoproterozoic Deep-Water Chemistry. Science 321, 949–952. doi:10.1126/science.1154499
Canfield, D.E., Raiswell, R., Westrich, J.T., Reaves, C.M., Berner, R.A., 1986. The use of chromium reduction in the analysis of reduced inorganic sulfur in sediments and shales. Chem. Geol. 54, 149–155. doi:10.1016/0009-2541(86)90078-1
Casado, A.I., Alonso-Zarza, A.M., La Iglesia, Á., 2014. Morphology and origin of dolomite in paleosols and lacustrine sequences. Examples from the Miocene of the Madrid Basin. Sediment. Geol. 312, 50–62. doi:10.1016/j.sedgeo.2014.07.005
Deines, P., 1980. The isotopic composition of reduced organic carbon, in: Fritz, P., Fontes, J.C. (Eds.), Handbook of Environmental Isotope Geochemistry. Elsevier, Amsterdam, pp. 329–406.
Farrell, U.C., Briggs, D.E.G., Hammarlund, E.U., Sperling, E.A., Gaines, R.R., 2013. Paleoredox and pyritization of soft-bodied fossils in the Ordovician Frankfort Shale of New York. Am. J. Sci. 313, 452–489. doi:10.2475/05.2013.02
38
Fraser, N.C., Grimaldi, D.A., Olsen, P.E., Axsmith, B., 1996. A Triassic lagerstatte from eastern North America. Nature 380, 615.
Froelich, A.J., Olsen, P.E., 1983. Newark Supergroup, a revision of the Newark Group in eastern North America. US Geol. Surv. Bull., Stratigraphic Notes 1537–A, A55–A58.
Gierlowski-Kordesch, E.H., 1998. Carbonate deposition in an ephemeral siliciclastic alluvial system: Jurassic Shuttle Meadow Formation, Newark Supergroup, Hartford Basin, USA. Palaeogeogr. Palaeoclimatol. Palaeoecol. 140, 161–184. doi:10.1016/S0031-0182(98)00039-X
Gierlowski-Kordesch, E.H., Rust, B.R., 1994. The Jurassic East Berlin Formation, Hartford Basin, Newark Supergroup (Connecticut and Massachusetts): a saline lake-playa-alluvial plain system, in: Renaut, R.W., Last, W.M. (Eds.), Sedimentology and Geochemistry of Modern and Ancient Saline Lakes, SEPM Special Publication. pp. 249–265.
Hay, R.L., 1966. Zeolites and Zeolitic Reactions in Sedimentary Rocks. Geol. Soc. Am. Spec. Pap. 85, 1–122. doi:10.1130/SPE85-p1
Kent, D.V., Olsen, P.E., 1997. Paleomagnetism of Upper Triassic continental sedimentary rocks from the Dan River–Danville rift basin (eastern North America). Geol. Soc. Am. Bull. 109, 366–377. doi:10.1130/0016-7606(1997)109<0366:POUTCS>2.3.CO;2
King, P.B., Beikman, H.M., 1976. The Paleozoic and Mesozoic Rocks; A Discussion to Accompany the Geologic Map of the United States, in: Geologic Survey Professional Paper 903. United States Government Printing Office, Washington.
Last, W.M., 1990. Lacustrine dolomite-an overview of modern, Holocene, and Pleistocene occurrences. Earth-Sci. Rev. 221–263.
Leleu, S., Hartley, A.J., van Oosterhout, C., Kennan, L., Ruckwied, K., Gerdes, K., 2016. Structural, stratigraphic and sedimentological characterisation of a wide rift system: The Triassic rift system of the Central Atlantic Domain. Earth-Sci. Rev. doi:10.1016/j.earscirev.2016.03.008
Liutkus, C.M., Beard, J.S., Fraser, N.C., Ragland, P.C., 2010. Use of fine-scale stratigraphy and chemostratigraphy to evaluate conditions of deposition and preservation of a Triassic Lagerstätte, south-central Virginia. J. Paleolimnol. 44, 645–666. doi:10.1007/s10933-010-9445-1
Liutkus-Pierce, C.M., Fraser, N.C., Heckert, A.B., 2014. Stratigraphy, sedimentology, and paleontology of the Upper Triassic Solite Quarry, North Carolina and Virginia. Elev. Geosci. Southeast. U. S. New Ideas Old Terranes—Field Guid. GSA Southeast. Sect. Meet. Blacksbg. Va. 2014 Geol. Soc. Am. Field Guide 35 255–269.
Lyons, T.W., Severmann, S., 2006. A critical look at iron paleoredox proxies: New insights from modern euxinic marine basins. Geochim. Cosmochim. Acta, A Special Issue Dedicated to Robert A. Berner 70, 5698–5722. doi:10.1016/j.gca.2006.08.021
McBride, J.H., 1991. Constraints on the structure and tectonic development of the Early Mesozoic South Georgia Rift, southeastern United States; Seismic reflection data processing and interpretation. Tectonics 10, 1065–1083. doi:10.1029/90TC02682
Meister, P., Reyes, C., Beaumont, W., Rincon, M., Collins, L., Berelson, W., Stott, L., Corsetti, F., Nealson, K.H., 2011. Calcium and magnesium-limited dolomite precipitation at Deep Springs Lake, California. Sedimentology 58, 1810–1830. doi:10.1111/j.1365-3091.2011.01240.x

39
Meyers, P.A., 1994. Preservation of elemental and isotopic source identification of sedimentary organic matter. Chem. Geol. 114, 289–302. doi:10.1016/0009-2541(94)90059-0
Olsen, P.E., 1986. A 40-Million-Year Lake Record of Early Mesozoic Orbital Climatic Forcing. Science 234, 842–848.
Olsen, P.E., Froelich, A.J., Daniels, D.L., Smoot, J.P., Gore, P.J.W., 1991. Rift basins of early Mesozoic age. Horton W Ed Geol. Carol. 142–170.
Olsen, P.E., Kent, D.V., Cornet, B., Witte, W.K., Schlische, R.W., 1996. High-resolution stratigraphy of the Newark rift basin (early Mesozoic, eastern North America). Geol. Soc. Am. Bull. 108, 40–77. doi:10.1130/0016-7606(1996)108<0040:HRSOTN>2.3.CO;2
Olsen, P.E., Reid, J.C., Taylor, K.B., Whiteside, J.H., Kent, D.V., 2015. Revised Stratigrahphy of Late Triassic Age Strata of the Dan River Basin (Virginia and North Carolina, USA) Based on Drill Core and Outcrop Data. Southeast. Geol. 51, 1–31.
Olsen, P.E., Remington, C.L., Cornet, B., Thomson, K.S., 1978. Cyclic Change in Late Triassic Lacustrine Communities. Science 201, 729–733.
Peterson, B.J., Fry, B., 1987. Stable Isotopes in Ecosystem Studies. Annu. Rev. Ecol. Syst. 18, 293–320.
Petrovich, R., 2001. Mechanisms of Fossilization of the Soft-Bodied and Lightly Armored Faunas of the Burgess Shale and of Some Other Classical Localities. Am. J. Sci. 301, 683–726. doi:10.2475/ajs.301.8.683
Poulton, S.W., Canfield, D.E., 2005. Development of a sequential extraction procedure for iron: implications for iron partitioning in continentally derived particulates. Chem. Geol. 214, 209–221. doi:10.1016/j.chemgeo.2004.09.003
Pratt, B.R., 1998. Molar-tooth structure in Proterozoic carbonate rocks: Origin from synsedimentary earthquakes, and implications for the nature and evolution of basins and marine sediment. GSA Bull. 110, 1028–1045. doi:10.1130/0016-7606(1998)110<1028:MTSIPC>2.3.CO;2
Raiswell, R., Anderson, T.F., 2005. Reactive iron enrichment in sediments deposited beneath euxinic bottom waters: constraints on supply by shelf recycling. Geol. Soc. Lond. Spec. Publ. 248, 179–194. doi:10.1144/GSL.SP.2005.248.01.10
Raiswell, R., Berner, R.A., 1985. Pyrite formation in euxinic and semi-euxinic sediments. Am. J. Sci. 285, 710–724. doi:10.2475/ajs.285.8.710
Raiswell, R., Buckley, F., Berner, R.A., Anderson, T.F., 1988. Degree of pyritization of iron as a paleoenvironmental indicator of bottom-water oxygenation. J. Sediment. Res. 58, 812–819. doi:10.1306/212F8E72-2B24-11D7-8648000102C1865D
Raiswell, R., Newton, R., Wignall, P.B., 2001. An Indicator of Water-Column Anoxia: Resolution of Biofacies Variations in the Kimmeridge Clay (Upper Jurassic, U.K.). J. Sediment. Res. 71, 286–294. doi:10.1306/070300710286
Raiswell, R., Reinhard, C.T., Derkowski, A., Owens, J., Bottrell, S.H., Anbar, A.D., Lyons, T.W., 2011. Formation of syngenetic and early diagenetic iron minerals in the late Archean Mt. McRae Shale, Hamersley Basin, Australia: New insights on the patterns, controls and paleoenvironmental implications of authigenic mineral formation. Geochim. Cosmochim. Acta 75, 1072–1087. doi:10.1016/j.gca.2010.11.013
Rodrı́guez-Pascua, M.A., Calvo, J.P., De Vicente, G., Gómez-Gras, D., 2000. Soft-sediment deformation structures interpreted as seismites in lacustrine sediments of the
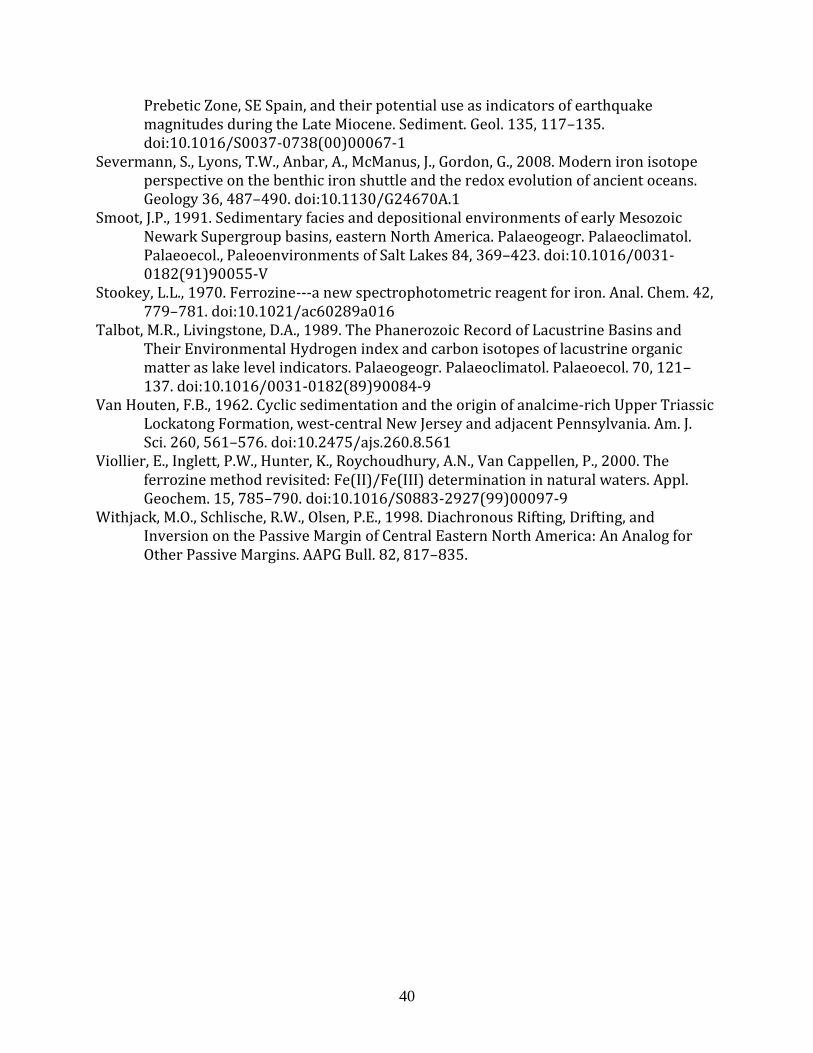
40
Prebetic Zone, SE Spain, and their potential use as indicators of earthquake magnitudes during the Late Miocene. Sediment. Geol. 135, 117–135. doi:10.1016/S0037-0738(00)00067-1
Severmann, S., Lyons, T.W., Anbar, A., McManus, J., Gordon, G., 2008. Modern iron isotope perspective on the benthic iron shuttle and the redox evolution of ancient oceans. Geology 36, 487–490. doi:10.1130/G24670A.1
Smoot, J.P., 1991. Sedimentary facies and depositional environments of early Mesozoic Newark Supergroup basins, eastern North America. Palaeogeogr. Palaeoclimatol. Palaeoecol., Paleoenvironments of Salt Lakes 84, 369–423. doi:10.1016/0031-0182(91)90055-V
Stookey, L.L., 1970. Ferrozine---a new spectrophotometric reagent for iron. Anal. Chem. 42, 779–781. doi:10.1021/ac60289a016
Talbot, M.R., Livingstone, D.A., 1989. The Phanerozoic Record of Lacustrine Basins and Their Environmental Hydrogen index and carbon isotopes of lacustrine organic matter as lake level indicators. Palaeogeogr. Palaeoclimatol. Palaeoecol. 70, 121–137. doi:10.1016/0031-0182(89)90084-9
Van Houten, F.B., 1962. Cyclic sedimentation and the origin of analcime-rich Upper Triassic Lockatong Formation, west-central New Jersey and adjacent Pennsylvania. Am. J. Sci. 260, 561–576. doi:10.2475/ajs.260.8.561
Viollier, E., Inglett, P.W., Hunter, K., Roychoudhury, A.N., Van Cappellen, P., 2000. The ferrozine method revisited: Fe(II)/Fe(III) determination in natural waters. Appl. Geochem. 15, 785–790. doi:10.1016/S0883-2927(99)00097-9
Withjack, M.O., Schlische, R.W., Olsen, P.E., 1998. Diachronous Rifting, Drifting, and Inversion on the Passive Margin of Central Eastern North America: An Analog for Other Passive Margins. AAPG Bull. 82, 817–835.
41
Figure 1 A.) Location map of Eden Quarry, Dan River Basin study area. Modified after Lyons and Severmann, 2006; Raiswell and Anderson, 2005 B.) Idealized stratigraphic cross-section of Dan River Basin fill modified after Olsen et al. (2015).
42
Figure 2 Idealized Van Houten Cycle for the Newark Basin, NJ. In the studied cycle within the Cow Branch Formation, no red clastic rocks are visible. Figure modified by Schlische, after Olsen et al., 1996.
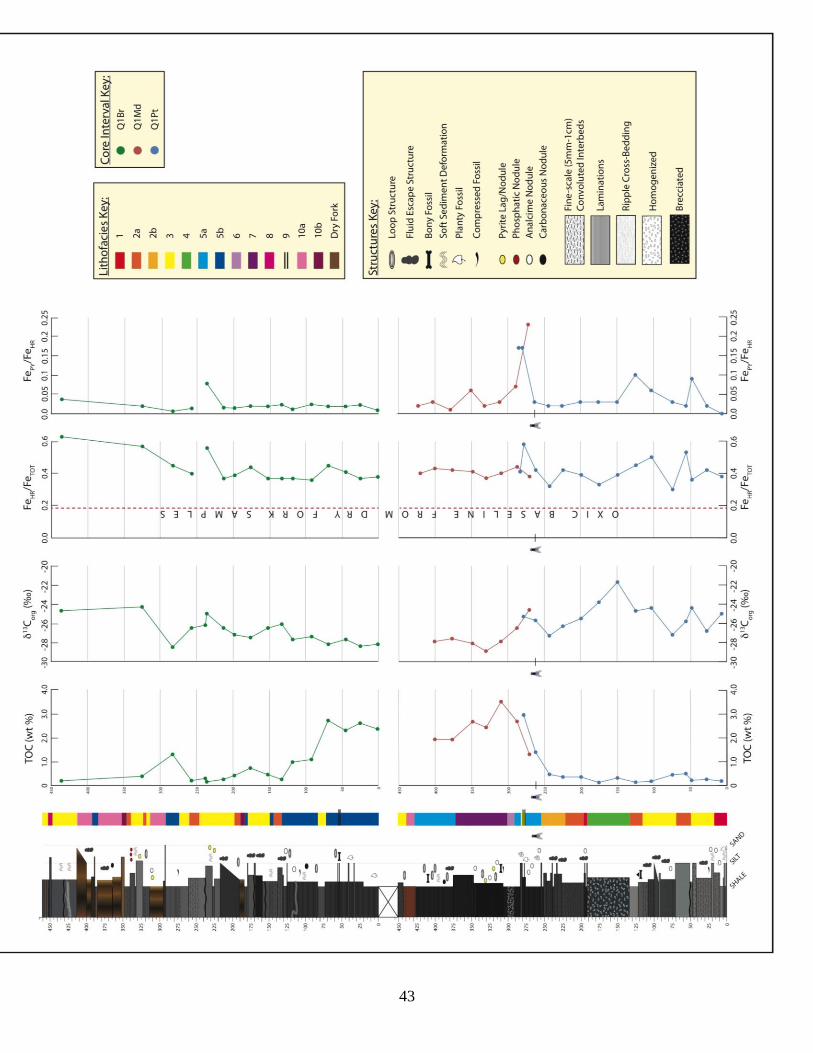
43

44
Figure 3 Stratigraphic column, lithofacies designations, and geochemistry of the studied succession of the Cow Branch Formation at the Eden Quarry. Geochemical data includes total organic carbon (TOC), organic carbon isotope data (13Corg), highly reactive iron to total iron ratio (FeHR/FeT), pyrite iron to highly reactive iron ratios (Fepy/FeHR). Dry Fork baseline (average of all samples) is represented by the dotted red line on the FeHR/FeT plot.
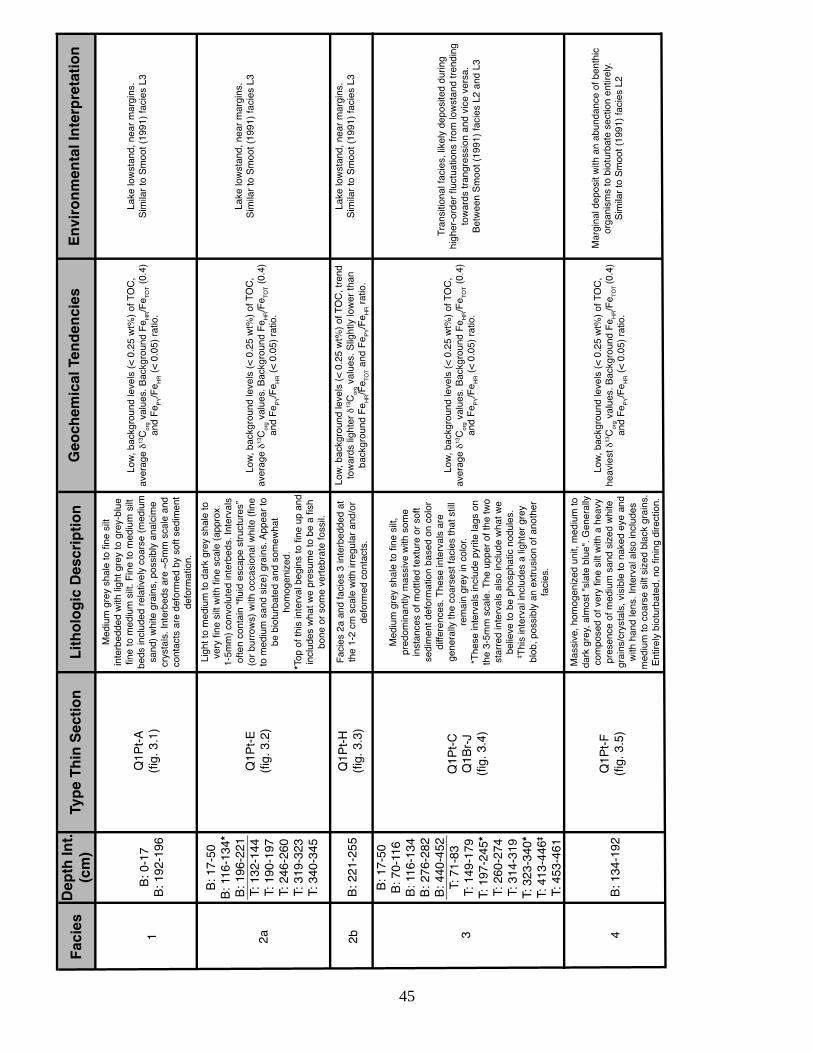
45
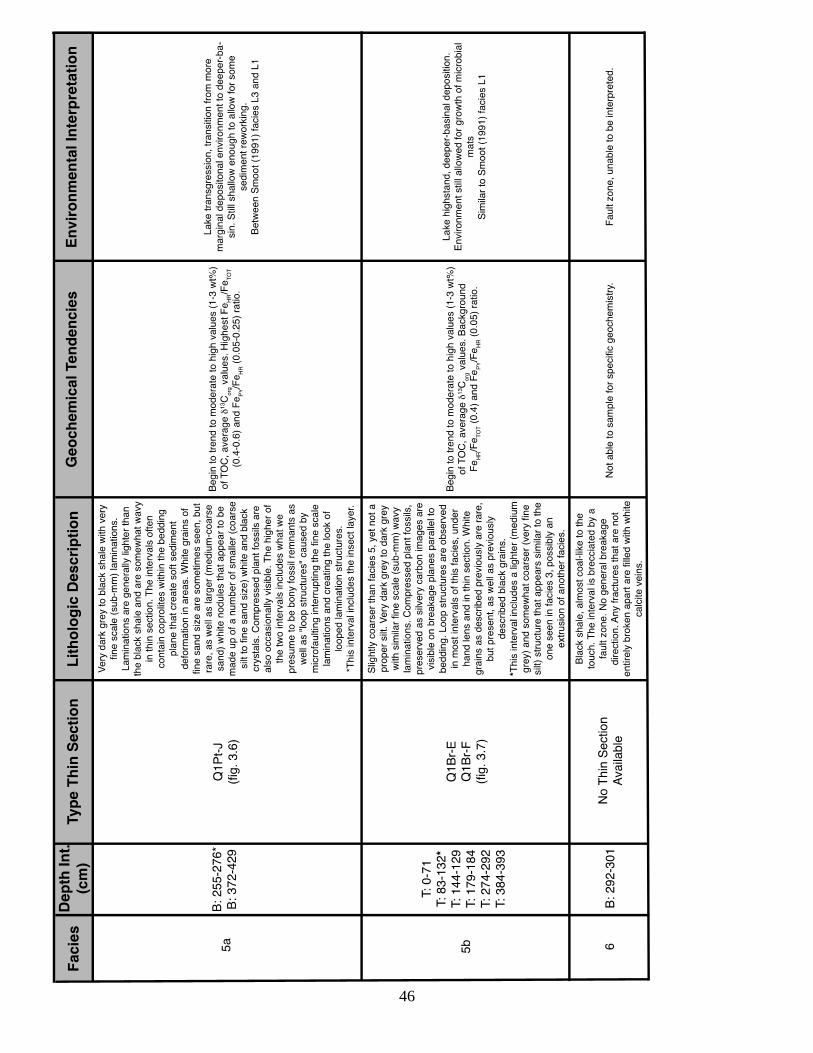
46
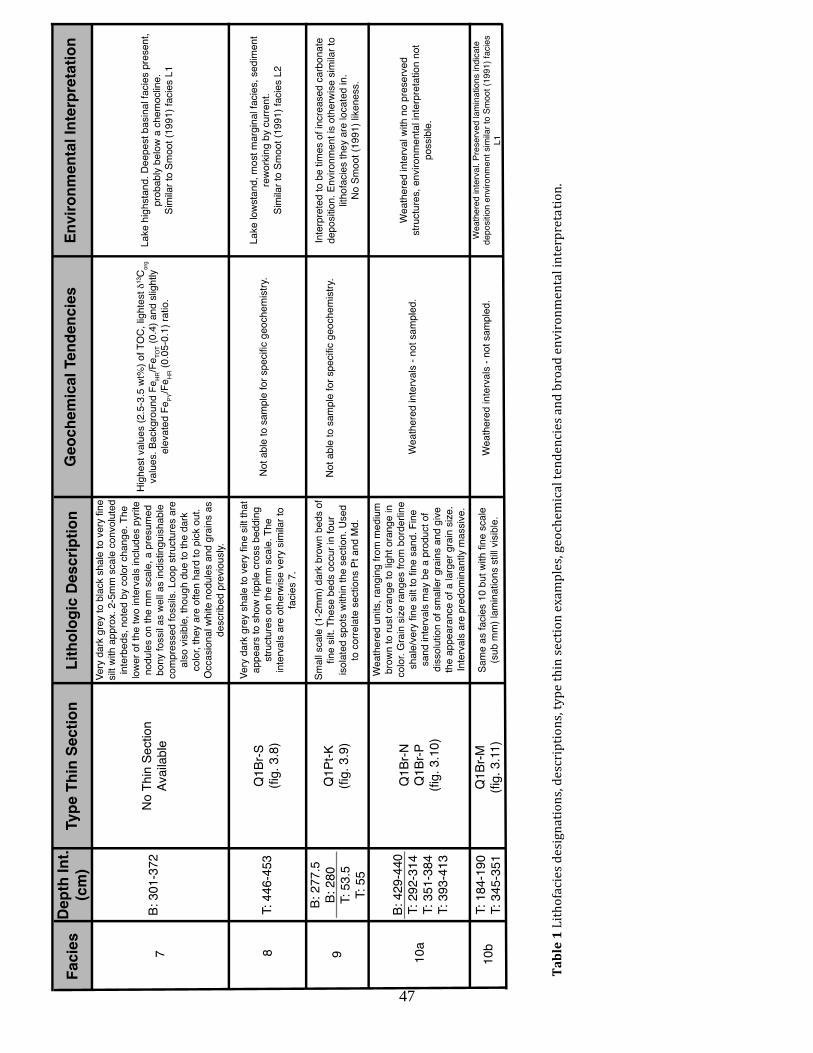
47
Ta
ble
1 L
ith
ofa
cies
des
ign
atio
ns,
des
crip
tio
ns,
ty
pe
thin
sec
tio
n e
xam
ple
s, g
eoch
emic
al t
end
enci
es a
nd
bro
ad e
nv
iro
nm
enta
l in
terp
reta
tio
n.
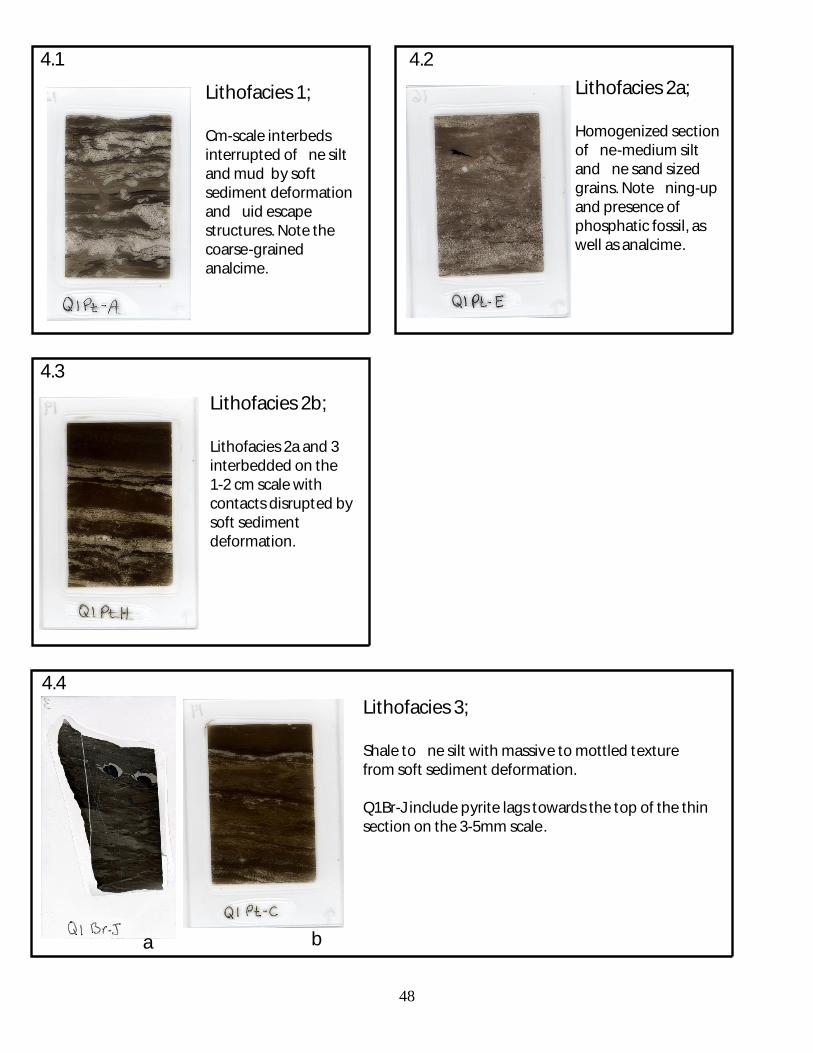
48
4.4
Lithofacies 3;
Shale to ne silt with massive to mottled texture
from soft sediment deformation.
Q1Br-J include pyrite lags towards the top of the thin
section on the 3-5mm scale.
a b
4.3
Lithofacies 2b;
Lithofacies 2a and 3
interbedded on the
1-2 cm scale with
contacts disrupted by
soft sediment
deformation.
4.2
Lithofacies 2a;
Homogenized section
of ne-medium silt
and ne sand sized
grains. Note ning-up
and presence of
phosphatic fossil, as
well as analcime.
4.1
Lithofacies 1;
Cm-scale interbeds
interrupted of ne silt
and mud by soft
sediment deformation
and uid escape
structures. Note the
coarse-grained
analcime.
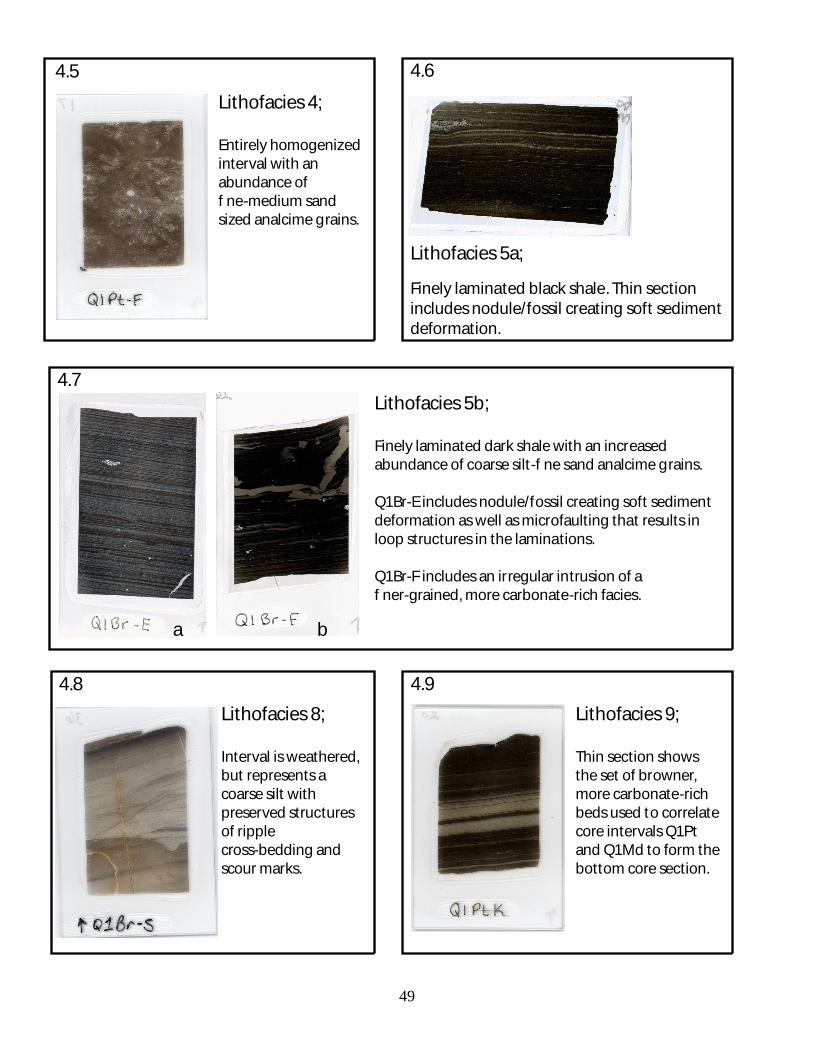
49
4.7
Lithofacies 5b;
Finely laminated dark shale with an increased
abundance of coarse silt-f ne sand analcime grains.
Q1Br-E includes nodule/fossil creating soft sediment
deformation as well as microfaulting that results in
loop structures in the laminations.
Q1Br-F includes an irregular intrusion of a
f ner-grained, more carbonate-rich facies.
a b
4.5
Lithofacies 4;
Entirely homogenized
interval with an
abundance of
f ne-medium sand
sized analcime grains.
4.6
Lithofacies 5a;
Finely laminated black shale. Thin section
includes nodule/fossil creating soft sediment
deformation.
4.8
Lithofacies 8;
Interval is weathered,
but represents a
coarse silt with
preserved structures
of ripple
cross-bedding and
scour marks.
4.9
Lithofacies 9;
Thin section shows
the set of browner,
more carbonate-rich
beds used to correlate
core intervals Q1Pt
and Q1Md to form the
bottom core section.
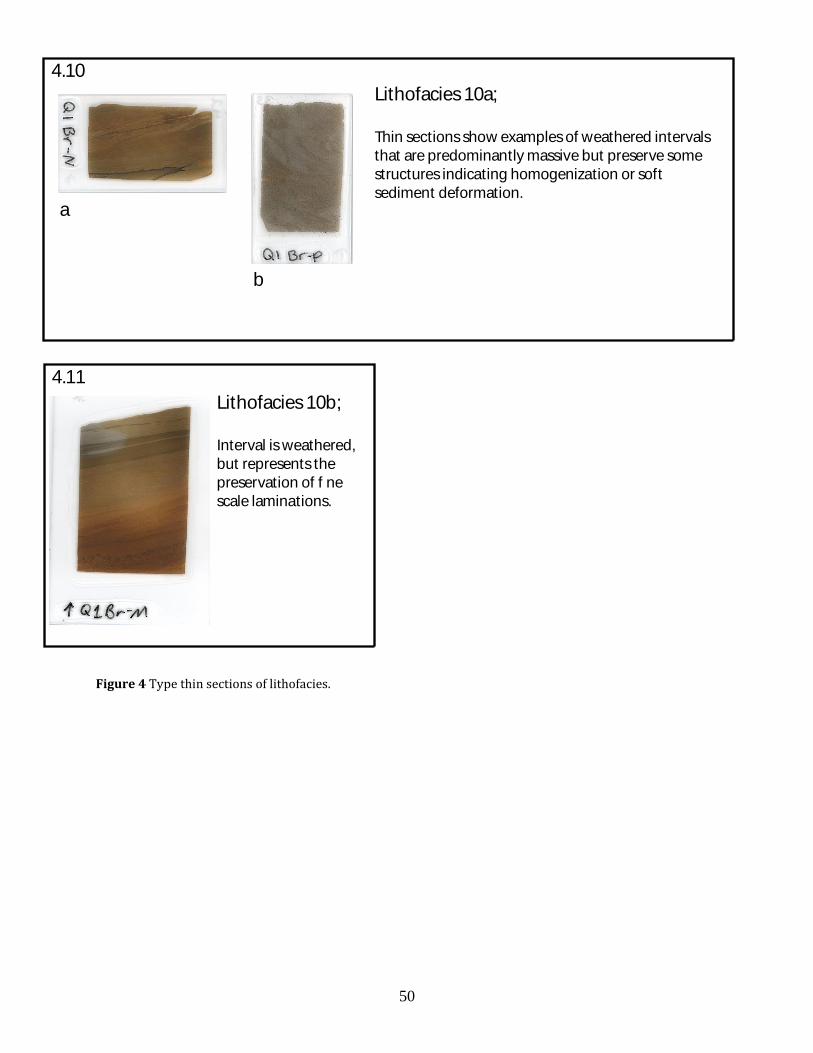
50
4.10
Lithofacies 10a;
Thin sections show examples of weathered intervals
that are predominantly massive but preserve some
structures indicating homogenization or soft
sediment deformation.a
b
4.11
Lithofacies 10b;
Interval is weathered,
but represents the
preservation of f ne
scale laminations.
Figure 4 Type thin sections of lithofacies.
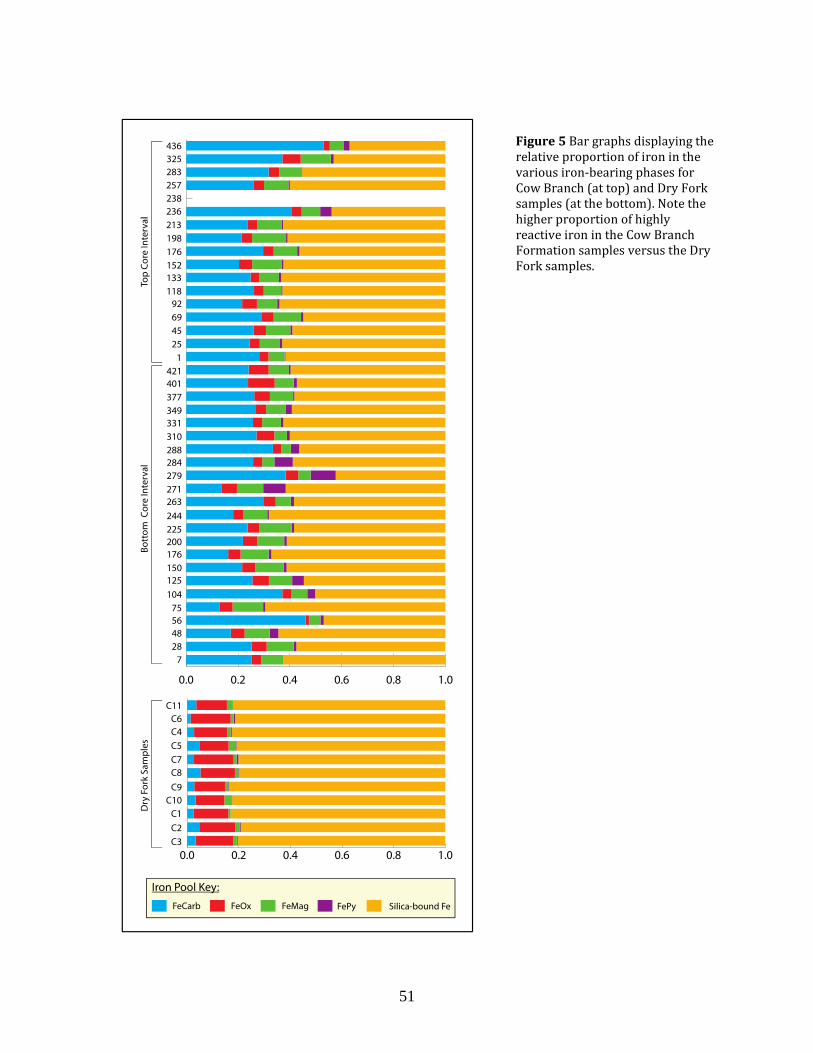
51
Figure 5 Bar graphs displaying the relative proportion of iron in the various iron-bearing phases for Cow Branch (at top) and Dry Fork samples (at the bottom). Note the higher proportion of highly reactive iron in the Cow Branch Formation samples versus the Dry Fork samples.
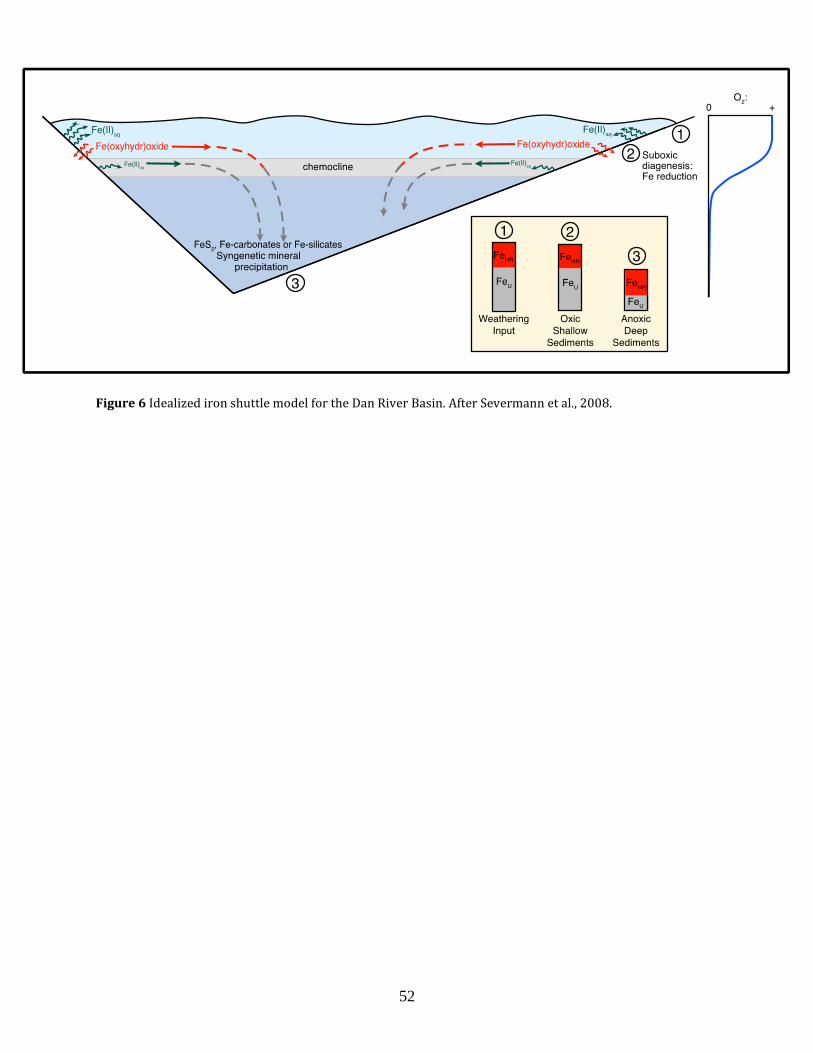
52
Figure 6 Idealized iron shuttle model for the Dan River Basin. After Severmann et al., 2008.
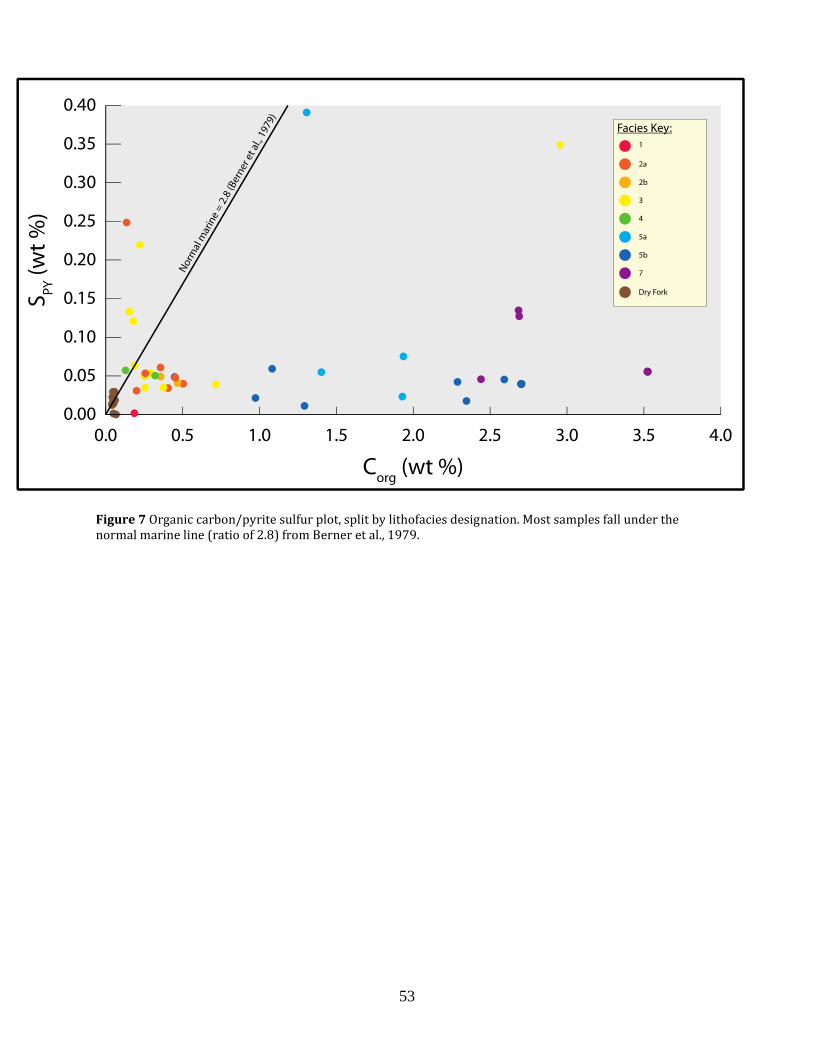
53
Figure 7 Organic carbon/pyrite sulfur plot, split by lithofacies designation. Most samples fall under the normal marine line (ratio of 2.8) from Berner et al., 1979.
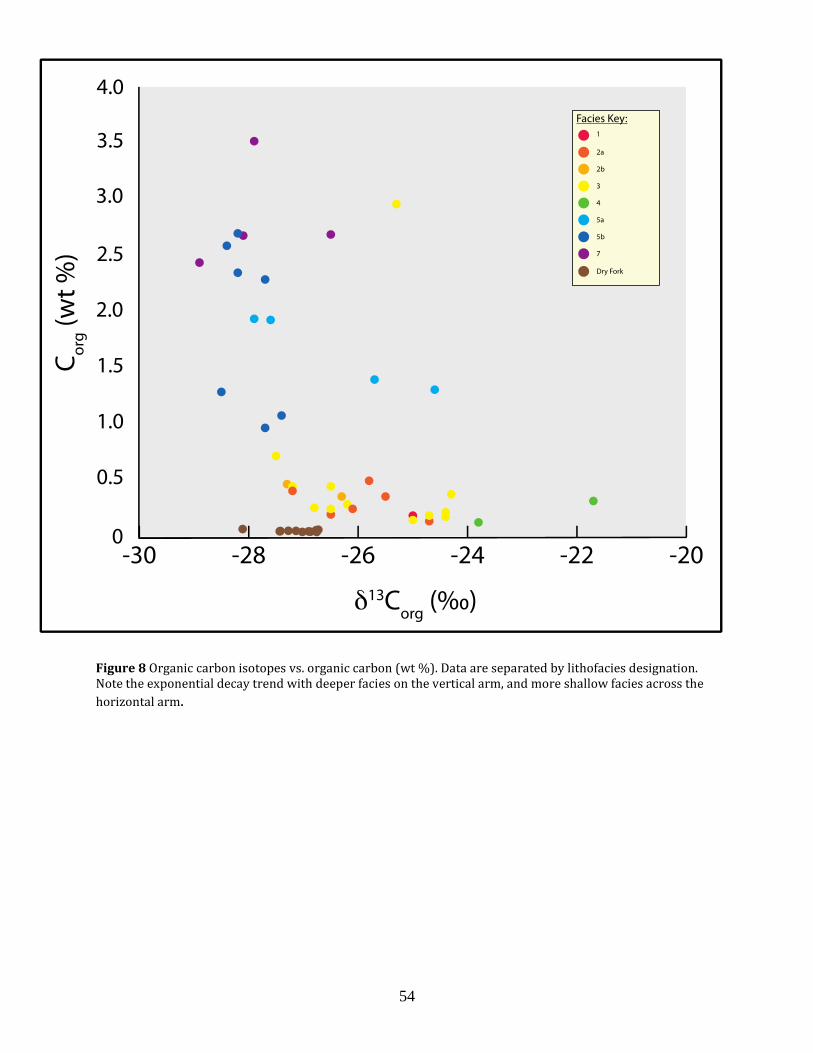
54
Figure 8 Organic carbon isotopes vs. organic carbon (wt %). Data are separated by lithofacies designation. Note the exponential decay trend with deeper facies on the vertical arm, and more shallow facies across the
horizontal arm.
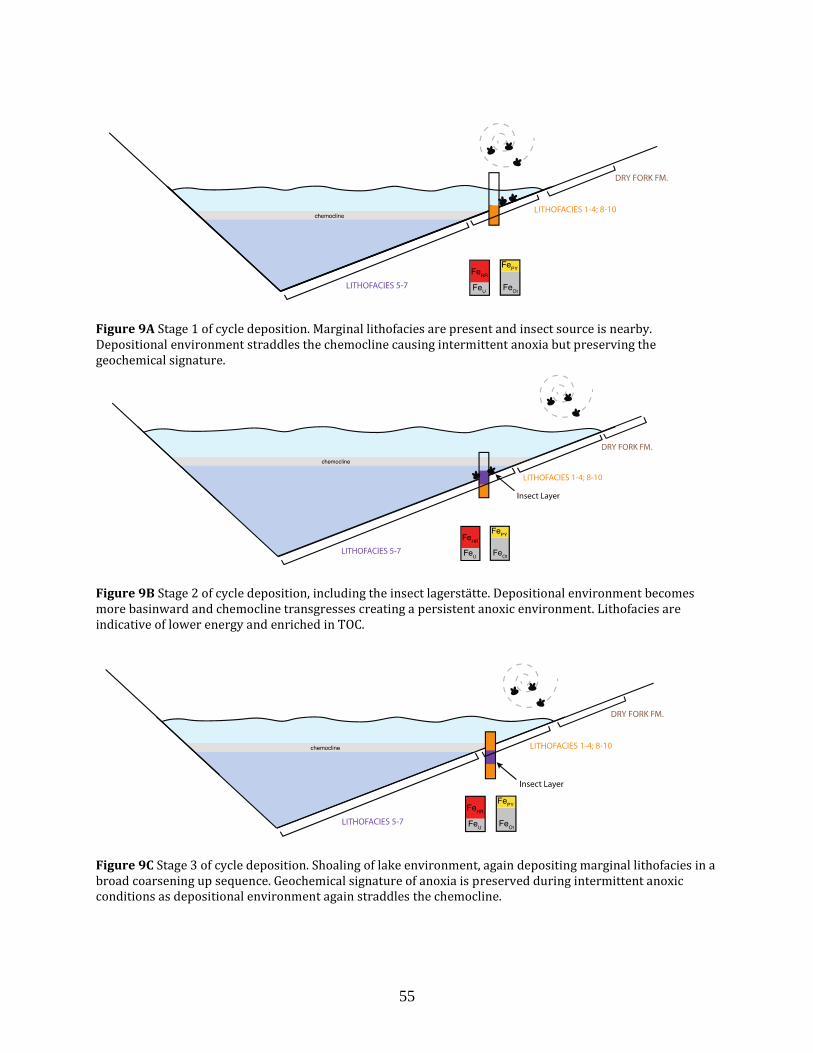
55
Figure 9A Stage 1 of cycle deposition. Marginal lithofacies are present and insect source is nearby. Depositional environment straddles the chemocline causing intermittent anoxia but preserving the geochemical signature.
Figure 9B Stage 2 of cycle deposition, including the insect lagerstätte. Depositional environment becomes more basinward and chemocline transgresses creating a persistent anoxic environment. Lithofacies are indicative of lower energy and enriched in TOC.
Figure 9C Stage 3 of cycle deposition. Shoaling of lake environment, again depositing marginal lithofacies in a broad coarsening up sequence. Geochemical signature of anoxia is preserved during intermittent anoxic conditions as depositional environment again straddles the chemocline.
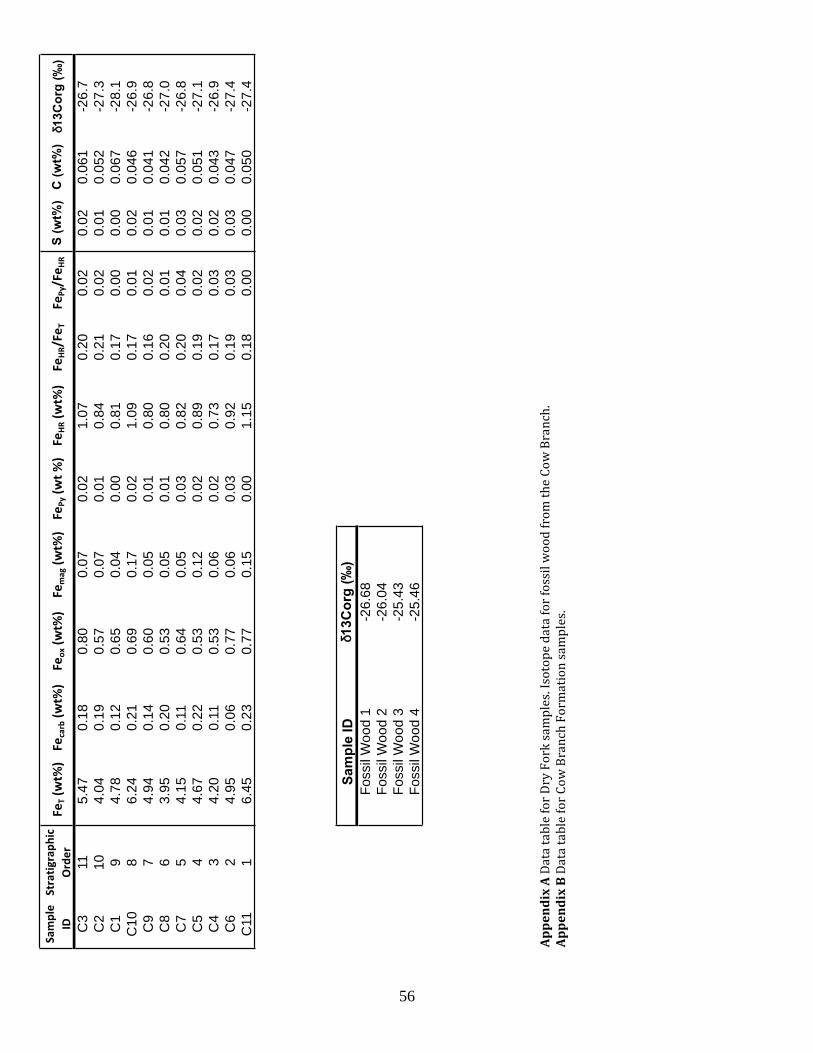
56
Sample
ID
Stratigrap
hic
Order
FeT(wt%
)Fe
carb(wt%
)Fe
ox(w
t%)
Femag(wt%
)Fe
Py(w
t%)
FeHR(wt%
)Fe
HR/FeT
FePy/Fe
HR
S (
wt%
)C
(w
t%)
d13
Co
rg (‰)
C3
11
5.4
70
.18
0.8
00
.07
0.0
21
.07
0.2
00
.02
0.0
20
.061
-26
.7
C2
10
4.0
40
.19
0.5
70
.07
0.0
10
.84
0.2
10
.02
0.0
10
.052
-27
.3
C1
94
.78
0.1
20
.65
0.0
40
.00
0.8
10
.17
0.0
00
.00
0.0
67
-28
.1
C1
08
6.2
40
.21
0.6
90
.17
0.0
21
.09
0.1
70
.01
0.0
20
.046
-26
.9
C9
74
.94
0.1
40
.60
0.0
50
.01
0.8
00
.16
0.0
20
.01
0.0
41
-26
.8
C8
63
.95
0.2
00
.53
0.0
50
.01
0.8
00
.20
0.0
10
.01
0.0
42
-27
.0
C7
54
.15
0.1
10
.64
0.0
50
.03
0.8
20
.20
0.0
40
.03
0.0
57
-26
.8
C5
44
.67
0.2
20
.53
0.1
20
.02
0.8
90
.19
0.0
20
.02
0.0
51
-27
.1
C4
34
.20
0.1
10
.53
0.0
60
.02
0.7
30
.17
0.0
30
.02
0.0
43
-26
.9
C6
24
.95
0.0
60
.77
0.0
60
.03
0.9
20
.19
0.0
30
.03
0.0
47
-27
.4
C11
16
.45
0.2
30
.77
0.1
50
.00
1.1
50
.18
0.0
00
.00
0.0
50
-27
.4
-25
.46
Sa
mp
le I
D
Fossil
Wo
od
1
Fossil
Wo
od
2
Fossil
Wo
od
3
Fossil
Wo
od
4
d1
3C
org
(‰)
-26
.68
-26
.04
-25
.43
Ap
pe
nd
ix A
Dat
a ta
ble
fo
r D
ry F
ork
sam
ple
s. I
soto
pe
dat
a fo
r fo
ssil
wo
od
fro
m t
he
Co
w B
ran
ch.
Ap
pe
nd
ix B
Dat
a ta
ble
fo
r C
ow
Bra
nch
Fo
rmat
ion
sam
ple
s.
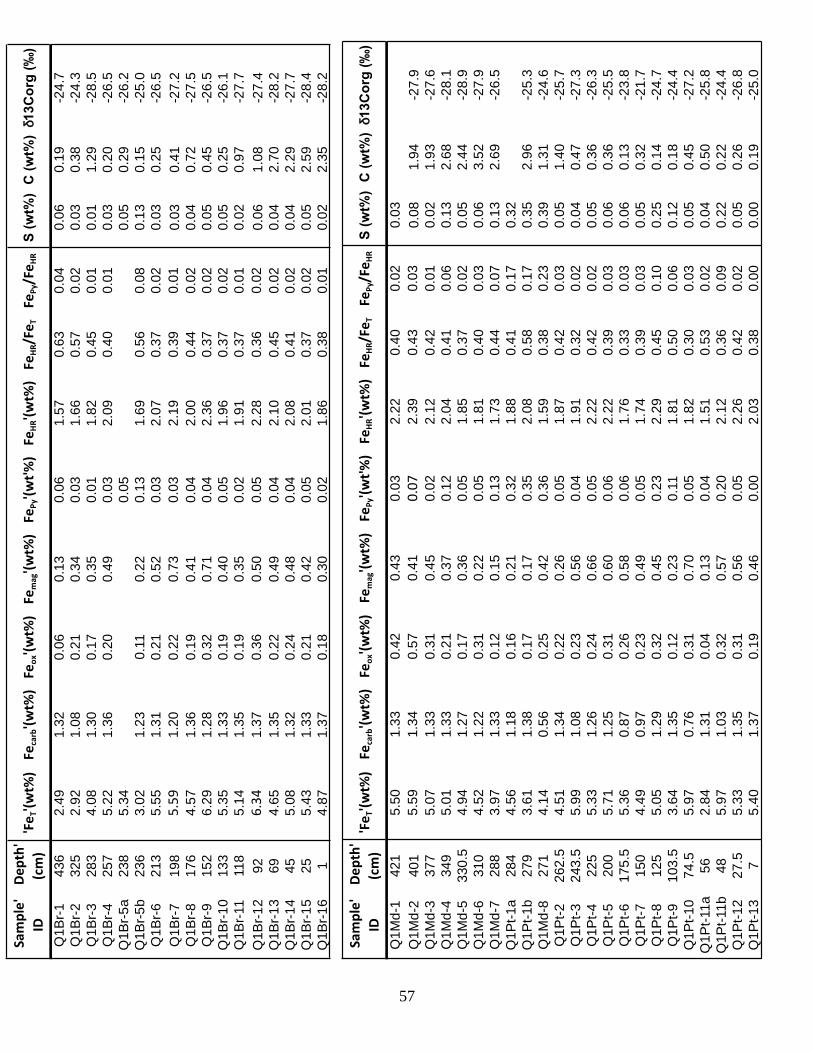
57
Sample'
ID
Depth'
(cm)
'FeT'(w
t%)
Fecarb'(wt%
)Fe
ox'(w
t%)
Femag'(wt%
)Fe
Py'(w
t'%)
FeHR'(wt%
)Fe
HR/FeT
FePy/Fe
HR
S (
wt%
)C
(w
t%)
d1
3C
org
(‰)
Q1
Br-
1436
2.4
91
.32
0.0
60
.13
0.0
61
.57
0.6
30
.04
0.0
60.1
9-2
4.7
Q1
Br-
2325
2.9
21
.08
0.2
10
.34
0.0
31
.66
0.5
70
.02
0.0
30.3
8-2
4.3
Q1
Br-
3283
4.0
81
.30
0.1
70
.35
0.0
11
.82
0.4
50
.01
0.0
11.2
9-2
8.5
Q1
Br-
4257
5.2
21
.36
0.2
00
.49
0.0
32
.09
0.4
00
.01
0.0
30.2
0-2
6.5
Q1B
r-5
a238
5.3
40.0
50.0
50.2
9-2
6.2
Q1B
r-5
b236
3.0
21
.23
0.1
10
.22
0.1
31
.69
0.5
60
.08
0.1
30.1
5-2
5.0
Q1
Br-
6213
5.5
51
.31
0.2
10
.52
0.0
32
.07
0.3
70
.02
0.0
30.2
5-2
6.5
Q1
Br-
7198
5.59
1.2
00
.22
0.7
30.0
32
.19
0.3
90
.01
0.0
30.4
1-2
7.2
Q1
Br-
8176
4.5
71
.36
0.1
90
.41
0.0
42
.00
0.4
40
.02
0.0
40.7
2-2
7.5
Q1
Br-
9152
6.2
91
.28
0.3
20
.71
0.0
42
.36
0.3
70
.02
0.0
50.4
5-2
6.5
Q1B
r-1
0133
5.3
51
.33
0.1
90
.40
0.0
51
.96
0.3
70
.02
0.0
50.2
5-2
6.1
Q1
Br-
11
11
85
.14
1.3
50
.19
0.3
50.0
21
.91
0.3
70
.01
0.0
20.9
7-2
7.7
Q1B
r-1
292
6.34
1.3
70
.36
0.5
00.0
52
.28
0.3
60
.02
0.0
61.0
8-2
7.4
Q1B
r-1
369
4.6
51
.35
0.2
20
.49
0.0
42
.10
0.4
50
.02
0.0
42.7
0-2
8.2
Q1B
r-1
445
5.0
81
.32
0.2
40
.48
0.0
42
.08
0.4
10
.02
0.0
42.2
9-2
7.7
Q1B
r-1
525
5.4
31
.33
0.2
10
.42
0.0
52
.01
0.3
70
.02
0.0
52.5
9-2
8.4
Q1B
r-1
61
4.8
71
.37
0.1
80
.30
0.0
21
.86
0.3
80
.01
0.0
22.3
5-2
8.2
Sample'
ID
Depth'
(cm)
'FeT'(w
t%)
Fecarb'(wt%
)Fe
ox'(w
t%)
Femag'(wt%
)Fe
Py'(w
t'%)
FeHR'(wt%
)Fe
HR/FeT
FePy/Fe
HR
S (
wt%
)C
(w
t%)
d1
3C
org
(‰)
Q1
Md
-1421
5.5
01
.33
0.4
20
.43
0.0
32
.22
0.4
00
.02
0.0
3
Q1
Md
-2401
5.5
91
.34
0.5
70
.41
0.07
2.3
90
.43
0.0
30
.08
1.9
4-2
7.9
Q1
Md
-3377
5.0
71
.33
0.3
10
.45
0.0
22
.12
0.4
20
.01
0.0
21
.93
-27
.6
Q1
Md
-4349
5.0
11
.33
0.2
10
.37
0.1
22
.04
0.4
10
.06
0.1
32
.68
-28
.1
Q1
Md
-53
30
.54
.94
1.2
70
.17
0.3
60
.05
1.8
50
.37
0.0
20
.05
2.4
4-2
8.9
Q1
Md
-6310
4.5
21
.22
0.3
10
.22
0.0
51
.81
0.4
00
.03
0.0
63
.52
-27
.9
Q1
Md
-7288
3.9
71
.33
0.1
20
.15
0.1
31
.73
0.4
40
.07
0.1
32
.69
-26
.5
Q1
Pt-
1a
284
4.5
61
.18
0.1
60
.21
0.3
21
.88
0.4
10
.17
0.3
2
Q1
Pt-
1b
279
3.6
11
.38
0.1
70
.17
0.3
52
.08
0.5
80
.17
0.3
52
.96
-25
.3
Q1
Md
-8271
4.1
40
.56
0.2
50
.42
0.3
61
.59
0.3
80
.23
0.3
91
.31
-24
.6
Q1
Pt-
22
62
.54
.51
1.3
40
.22
0.2
60
.05
1.8
70
.42
0.0
30
.05
1.4
0-2
5.7
Q1
Pt-
32
43
.55
.99
1.0
80
.23
0.5
60
.04
1.9
10
.32
0.0
20
.04
0.4
7-2
7.3
Q1
Pt-
4225
5.3
31
.26
0.2
40
.66
0.0
52
.22
0.4
20
.02
0.0
50
.36
-26
.3
Q1
Pt-
5200
5.7
11
.25
0.3
10
.60
0.0
62
.22
0.3
90
.03
0.0
60
.36
-25
.5
Q1
Pt-
61
75
.55
.36
0.8
70
.26
0.5
80
.06
1.7
60
.33
0.0
30
.06
0.1
3-2
3.8
Q1
Pt-
7150
4.4
90
.97
0.2
30
.49
0.0
51
.74
0.3
90
.03
0.0
50
.32
-21
.7
Q1
Pt-
8125
5.0
51
.29
0.3
20
.45
0.2
32
.29
0.4
50
.10
0.2
50
.14
-24
.7
Q1
Pt-
91
03
.53
.64
1.3
50
.12
0.2
30
.11
1.8
10
.50
0.0
60
.12
0.1
8-2
4.4
Q1
Pt-
10
74.5
5.9
70
.76
0.3
10
.70
0.0
51
.82
0.3
00
.03
0.0
50
.45
-27
.2
Q1
Pt-
11
a56
2.8
41
.31
0.0
40
.13
0.0
41
.51
0.5
30
.02
0.0
40
.50
-25
.8
Q1
Pt-
11
b48
5.9
71
.03
0.3
20
.57
0.2
02
.12
0.3
60
.09
0.2
20
.22
-24
.4
Q1
Pt-
12
27.5
5.3
31
.35
0.3
10
.56
0.0
52
.26
0.4
20
.02
0.0
50
.26
-26
.8
Q1
Pt-
13
75
.40
1.3
70
.19
0.4
60
.00
2.0
30
.38
0.0
00
.00
0.1
9-2
5.0

58