Embed Size (px)
Citation preview

International Journal of Science and Research (IJSR) ISSN (Online): 2319-7064
Index Copernicus Value (2013): 6.14 | Impact Factor (2015): 6.391
Volume 5 Issue 10, October 2016 www.ijsr.net
Licensed Under Creative Commons Attribution CC BY
An Integrated Geophysical Studies for Discovery of Lamproites near Ramaduugu Area, Nalgonda
District, Telangana State, India G. Sriramulu1, G. Ramadass2, Dubba Vijay Kumar3
1, 2, 3Centre of Exploration Geophysics, Osmania University, Hyderabad, Telangana State, India
Abstract: The very low frequency (VLF), total magnetic and radiometric precision measurements were performed along seven lamproite profiles, five at the Ramadugu (R1 to R5) and two at Yacharam (Y1 to Y2) lamproite bodies, in the north western margin of the Cuddapah basin, Nalgonda district, Telangana State, India have been mapped subsurface geological structures, i.e., dykes, faults and fractures. In particular, the disposition and extent of the dykes, contact between dykes and granitic rocks and bed rock topography was traced and its relation with the other geological members of the region examined. The VLF-EM results of 2-D inversion current density plots for profiles Ramadugu and Yacharam lamproites are presented in Figures (2 to 8). The data analysis revealed the presence of positive and negative amplitude of filtered real and imaginary components for identification of conductive body. High positive (red color) values indicate the presence of conductive subsurface structures while lows (black color) are indicates resistive formations. The cross-over of real and imaginary components along the profiles possibly indicating as fractures/fault related depression zones are sometimes recognizes as shear zones). The VLF-EM responses of lamproite bodies along with the magnetic and radiometric interpretation, are presented here as a case study.
Keywords: Topography, Cuddapah basin, Lamproites, VLF–EM, Conductive bodies
1. Introduction
Since last two decades geophysical methods have underground a phenomenal improvement in the design and development, of equipment, methods and precession sub data acquisition, processing and interpretation. Each geophysical method directly or indirectly related to one or other physical property contrast of the sub surface rock andthe target to the export. Due to in inherent draw backs effects on the quality of data, various noise factors, choice interpretation tools and techniques and above all the inherent limitation of the method itself. So, therefore combining two or more geophysical methods for particular investigations followed by right choice a processing on interpretation tools. This approach is called an integrated geophysical strategy evolves greater accuracy and highly reliable results.
Ramachandran et al., (1999) [1] reported both positive and negative gravity and magnetic responses over Kimberlite in India. Kimberlite / lamproite have generally high magnetic susceptibility than surrounding gneisses and granites and are additionally prone to retain remnant magnetism. Magnetic minerals occur naturally in geological environment associated with geo-logical features like geological contrast, veins, shear zones, now in particular mineral explo-ration Kimberlite / lamproites emplace along zones of basement within or margins of this (stable craton), Kimberlite /lamproites diatremes emplaced along zones of basement weakness within or on the margins of stable cartons often in groups of three or more. As a consequence, magnetic anomalies are commonly associated with Kimberlite intrusions although susceptibility relative to surrounding country rocks.
Radioactive method have relatively little use, although they should have some application in differentiating varieties of Kimberlite or Lamproite and provide near surface structural
features and also moreover, to evaluate the presence of radioactive mineralization, radio-metric survey is an essential aspect which can differentiate, with a better resolution, between a probable mineralization and that of an economic prospect their occurrences in outcrop enhance the background radiation of the area.
This dependent primarily on the prevailing geological structure and the diamond and lamproites such shallow structures can be delineated by VLF method due to its advantage detective in conductive structure, and also provides the most suitable recognize to tool be considered for the recognition of faults/fracture zones.
In the present work reports the results of electromagnetic (VLF), total magnetic and radiometric surveys carried out and analyzed for structural configuration along chosen seven profiles, over a part of Ramadugu lamproite field, Nalgonda district Telangana State. India.
2. Geological Setting of the Rama-Dugu Lamproite Field
The area of investigation is situated to the south of Nalgonda town and includes the Halia river basin is a part of the Indian Peninsular Shield Rocks of the Archaean, Late-Proterozoic Kurnool group of sedimentary rocks overlying the gneiss-granite Archaean basement with the enclaves and rafts of Dharwar rocks. The geology of Ramadugu area has shown in Fig.1 (GSI, 1999[2]) forms a part of peninsular gneissic complex comprising of migmatites and intrusive granitoid with enclave patches of older metamorp-hic rocks. Multiple sets of fractures trending N-S., E-W NW-SE and NE-SW trending dykes (Chalapathi Rao, 2014[3]), are common. A total of 14 (0.5-3 m thick), NW-SE trendingdykes were discovered (Sridhar and Rau , 2005[4]) ele-ven dykes, spread over an area of 26 sq.km on the right bank of
Paper ID: ART20162494 1525
International Journal of Science and Research (IJSR) ISSN (Online): 2319-7064
Index Copernicus Value (2013): 6.14 | Impact Factor (2015): 6.391
Volume 5 Issue 10, October 2016 www.ijsr.net
Licensed Under Creative Commons Attribution CC BY
Halia river in close vicinity of Ramadugu village and 3 of them in about three dykes, spread over an area of 3 sq.km occur near Somavarigudem village. The lamproites of Ramadugu (RLF) are very fine grained, yellowish green to greenish grey, dense, hard and com-pact. They show faint NW-SE trending foliate-on, which is parallel to the trends of these dykes. However we cloud locate only seven of these bodies-five near Ramadugu (R1 to R5) and two near Yacharam (Y1 to Y2), these lamproites occurs as dykes and trend essentially NW-SE discontinuous isolated out crops. The Yacharam lamproites occurrence shows intrusive contacts with the basement granitoid.
3. Data Base
The Ramadugu study area lies in between latitude 160 42′ to160 57′N and longitude 790 05′E to 79023′E. Very low frequency (EM), total magnetic and radiometric investigations carried out in detail using ABEM WADI VLF-EM equipment, Model 600 Proton precession magnetometer and ECIL- Scintillometer type SM141 instrument, along seven detailed pro-files with one (1) mstation to station distance were conducted at the Ramadugu (R1 to R5) and Yacharam (Y1 to Y2) lamproites field (Fig.1). The length of these profiles varied between 20m-50 m were taken perpendicular to the geological formations. The frequency use in the present investigation is 18 KHz Global Position System (GPS) was used to locate the observation points and elevation to ensure reliability and accuracy of the radiometric and GPS elevation, location of geographic coordinates several observations (20%) is repeated. The overall effective accuracy obtained for the magnetic data, radiometric data and VLF data is +/- 1nT, 2µR/hr and 2% respectively. The N-S and E-W extends of this area that falls under Survey of India (SOI) Topo sheet no. E44T1, E44T2 and E44T5, in Nalgonda district of Telangana state, India. The following sections, we briefly describe and interpret the measures VLF-(EM), total magnetic and radiometric anomalies along the seven profiles.
Figure 1: Location map of the VLF-EM profiles at Ramadugu Lamproite clusters and Geological map of the
Ramadugu Lamproite field in the Eastern Dharwar Craton, Telangana State, India.
4. Very Low Frequency (EM) Survey
Very low frequency method is a semi passive electromagnetic induction method which utilizes distant high power vertical transmitters as a source for the primary field. These transmiters are meant for long distance marine communications and situated on the coastal areas world-wide. They operate in the lower band (15-30 kHz) as the primary EM field. These signals travel a long distance and can be utilized for geophysical measurements several thousand kilometers away from transmitters. The transmitters generated the plane EM waves that can induce secondary eddy currents, particularly in electrically conductive elongate 2-D structures. It is emphasized that, in principle, VLF method uses the highest frequency compared to other electro-magnetic methods. The name “very low
frequency” comes from the transmitter used for long
distance marine communication. Indeed, 15-30 kHz is very low with regard to other communication frequencies used in radio, TV, and mobile communications, Paul (1965) [5]
observed that radio waves as VLF’s could be used to
prospect for conductive mineral deposits. Subsequently, VLF transmitters widely used as EM sources for near surface geological mapping (Ramesh Babu et al., 2007[6]).
The VLF data obtained were presented as profiles (Fig.2 to 8) by plotting of the filtered real and imaginary components against distance using Microsoft Excel package, while corresponding Karous-Hjelt filters processed using Ramag software version 1.04 (VLF-2010) the corresponding pseudo sections of the profiles are shown in Figures 2 (d) to 8 (d) and these sections for real and imaginary components are presented red color indicates the high current density and black color indicates low current density reflects the non-conductors or and resistive formations respectively.
The double plot of the filtered real and imaginary components enable qualitative identifications a qualitative interpretation of VLF-EM data is based on the cross-over point between the real and imaginary data which appears as positive peaks in the Fraser-filtered real curve, these regions constitute anomalous zones which can be attributed to the presence of vertical conductor or lateral contacts of different resistivity beneath the surface of the conductive or resist-ive bodies reflect on real component were done by considering the high amplitude signal.
5. Filtering Procedure
The VLF data (real and imaginary compo-nents) of the EM fields measured was subjected to Fraser (1969) [7] filtering to increase the signal to noise ratio of the data set and enhance the anomaly signatures. The Fraser Filter (Q) was computed using a filter operator as shown in the following relation.
Q = (𝑄4 + 𝑄3) - (𝑄2 + 𝑄1) … 1
Where Q is EM data and the subscript is station positions. This was applied to the real compo-nent VLF data to transform the data set to the filtered real VLF data to transform the data set to the filtered real and imaginary data (Karous and Hjelt, 1983[8]). The filtered real transform
Paper ID: ART20162494 1526
International Journal of Science and Research (IJSR) ISSN (Online): 2319-7064
Index Copernicus Value (2013): 6.14 | Impact Factor (2015): 6.391
Volume 5 Issue 10, October 2016 www.ijsr.net
Licensed Under Creative Commons Attribution CC BY
every genuine cross over or inflection points of the real anomaly to positive peaks while reverse cross over become negative peaks.
For quantitative interpretation, it is more useful to plot the real and imaginary data. The figure to the right illustrates a method of estimating depth to a linear conductor based on the peak to peak width of VLF vertical in-phase data. The depth is half the peak-to-peak width, less the instrument's elevation above ground. This procedure was developed by Karous and Hjelt (K&H, 1983[8]) made use of linear filtering filter proposed by Karous and Hjelt (1977[9], 1983[8]) allows geophysicists to filter the in-phase (Real) and out phase (Imaginary) data and generate an apparent current density pseudo-section and therefore image the geo-logical underground structure (Coney, 1977[10], Fisher, et al., 1993[11], Sundararajan et al., 2006[12], Fraser, 1966[13])in analyzing VLF real and imaginary data, which an extension of the Fraser filter. According to Ogilvy and Lee (1991) [13], the current density pseudo section provides good visualization of targets such as mineralized veins, fractures (Parker,1980[14]), and vertical Stratigraphy that produce vertical to sub vertical conductors. In this study, the computed current density pseudo sections of the real and imaginary components of profile R1 to R5 and Y1 to Y2 are given in figures 2 to 8, respectively. Small as well as localized conductors are well resolved in the psuedosections (Figures 2 d to 8 d) obtained from Karous-Hjelt filtering relative to the ones obtained from Fraser filtering. In the following section Figures from 2 d to 8 d is the pseudo-sections of imagi-nary components is the mirror image of the real components. The current density pseudo sections were obtained using Karous-Hjelt filters (1983)[8]
that is given by the following the equation.∆𝑧
2𝜋𝐼𝑎
∆𝑥
2 = 0.102 𝐻−3 – 0.059 𝐻−2+ 0.561 𝐻−1 – 0.561 𝐻1
+ 0.059 𝐻2 – 0.102 𝐻3 …2
Where ∆z is the assumed thickness of the cur-rent sheet, Ia isthe current density, and ∆x is the distance between data
points (and also the depth to the current sheet). The values H-2 through H3 are the normalized vertical magnetic field anom-aly at each of the six data points. The Location of the calculated current density is beneath the center of the six data points.
PROFILE-I (RAMADUGU R1)
Profile-I run along the R1 Lamproite body (16050′17.1″
latitude, 79016′40.1″ longitude) Fig.2 the total length of the
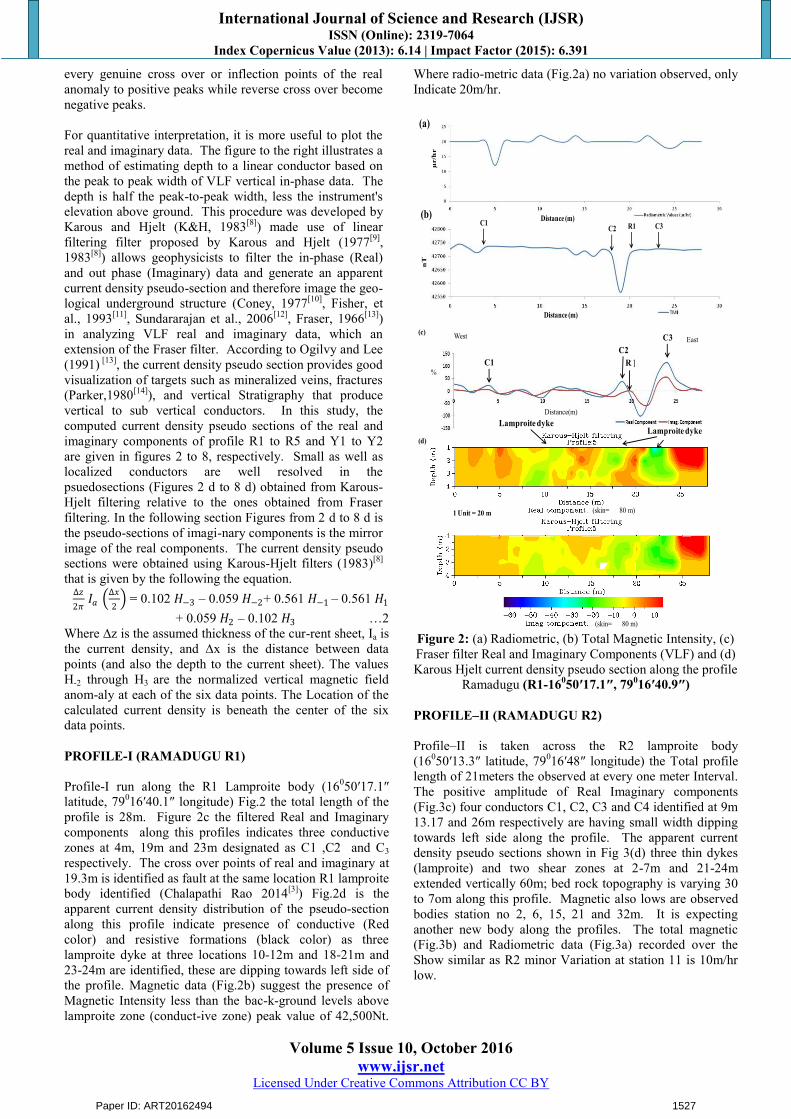
profile is 28m. Figure 2c the filtered Real and Imaginary components along this profiles indicates three conductive zones at 4m, 19m and 23m designated as C1 ,C2 and C3respectively. The cross over points of real and imaginary at 19.3m is identified as fault at the same location R1 lamproite body identified (Chalapathi Rao 2014[3]) Fig.2d is the apparent current density distribution of the pseudo-section along this profile indicate presence of conductive (Red color) and resistive formations (black color) as three lamproite dyke at three locations 10-12m and 18-21m and 23-24m are identified, these are dipping towards left side of the profile. Magnetic data (Fig.2b) suggest the presence of Magnetic Intensity less than the bac-k-ground levels above lamproite zone (conduct-ive zone) peak value of 42,500Nt.
Where radio-metric data (Fig.2a) no variation observed, only Indicate 20m/hr.
Figure 2: (a) Radiometric, (b) Total Magnetic Intensity, (c) Fraser filter Real and Imaginary Components (VLF) and (d) Karous Hjelt current density pseudo section along the profile
Ramadugu (R1-16050′17.1″, 79
016′40.9″)
PROFILE–II (RAMADUGU R2)
Profile–II is taken across the R2 lamproite body (160
50′13.3″ latitude, 79016′48″ longitude) the Total profile
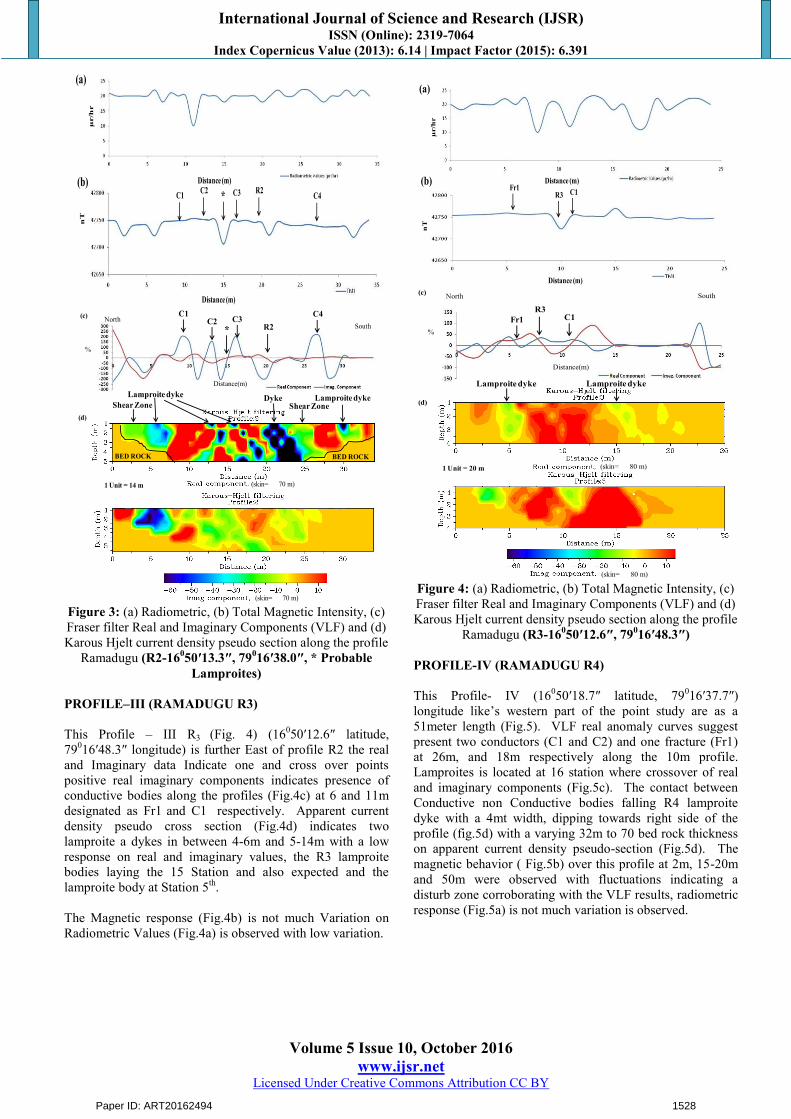
length of 21meters the observed at every one meter Interval. The positive amplitude of Real Imaginary components (Fig.3c) four conductors C1, C2, C3 and C4 identified at 9m 13.17 and 26m respectively are having small width dipping towards left side along the profile. The apparent current density pseudo sections shown in Fig 3(d) three thin dykes (lamproite) and two shear zones at 2-7m and 21-24m extended vertically 60m; bed rock topography is varying 30 to 7om along this profile. Magnetic also lows are observed bodies station no 2, 6, 15, 21 and 32m. It is expecting another new body along the profiles. The total magnetic (Fig.3b) and Radiometric data (Fig.3a) recorded over the Show similar as R2 minor Variation at station 11 is 10m/hr low.
Distance (m)
nT
µr/
hr
Distance (m)C1 R1
(a)
(b)C2 C3
Distance(m)
%
West East
R2
C3
C1C2
Lamproite dykeLamproite dyke
(skin= 80 m)
(skin= 80 m)1 Unit = 20 m
(c)
(d)
1
Paper ID: ART20162494 1527
International Journal of Science and Research (IJSR) ISSN (Online): 2319-7064
Index Copernicus Value (2013): 6.14 | Impact Factor (2015): 6.391
Volume 5 Issue 10, October 2016 www.ijsr.net
Licensed Under Creative Commons Attribution CC BY
Figure 3: (a) Radiometric, (b) Total Magnetic Intensity, (c) Fraser filter Real and Imaginary Components (VLF) and (d) Karous Hjelt current density pseudo section along the profile
Ramadugu (R2-16050′13.3″, 79
016′38.0″, * Probable
Lamproites)
PROFILE–III (RAMADUGU R3)
This Profile – III R3 (Fig. 4) (16050′12.6″ latitude,
79016′48.3″ longitude) is further East of profile R2 the real
and Imaginary data Indicate one and cross over points positive real imaginary components indicates presence of conductive bodies along the profiles (Fig.4c) at 6 and 11m designated as Fr1 and C1 respectively. Apparent current density pseudo cross section (Fig.4d) indicates two lamproite a dykes in between 4-6m and 5-14m with a low response on real and imaginary values, the R3 lamproite bodies laying the 15 Station and also expected and the lamproite body at Station 5th.
The Magnetic response (Fig.4b) is not much Variation on Radiometric Values (Fig.4a) is observed with low variation.
Figure 4: (a) Radiometric, (b) Total Magnetic Intensity, (c) Fraser filter Real and Imaginary Components (VLF) and (d) Karous Hjelt current density pseudo section along the profile
Ramadugu (R3-16050′12.6″, 79
016′48.3″)
PROFILE-IV (RAMADUGU R4)
This Profile- IV (16050′18.7″ latitude, 79
016′37.7″)
longitude like’s western part of the point study are as a
51meter length (Fig.5). VLF real anomaly curves suggest present two conductors (C1 and C2) and one fracture (Fr1) at 26m, and 18m respectively along the 10m profile. Lamproites is located at 16 station where crossover of real and imaginary components (Fig.5c). The contact between Conductive non Conductive bodies falling R4 lamproite dyke with a 4mt width, dipping towards right side of the profile (fig.5d) with a varying 32m to 70 bed rock thickness on apparent current density pseudo-section (Fig.5d). The magnetic behavior ( Fig.5b) over this profile at 2m, 15-20m and 50m were observed with fluctuations indicating a disturb zone corroborating with the VLF results, radiometric response (Fig.5a) is not much variation is observed.
µr/
hr
Distance (m)
nT
Distance (m)
* R2
(a)
(b)C1 C2 C3 C4
Distance(m)
%
South North
R2*
BED ROCK BED ROCK
C1 C4C2 C3
Lamproite dyke Lamproite dykeDykeShear Zone
(skin= 70 m)
(skin= 70 m)
1 Unit = 14 m
(c)
(d)
Shear Zone
Distance (m)
µr/
hr
nT
Distance (m)
R3
(a)
(b)Fr1 C1
Distance(m)
%
South North
R3C1Fr1
Lamproite dyke Lamproite dyke
(skin= 80 m)
(skin= 80 m)
1 Unit = 20 m
(c)
(d)
Paper ID: ART20162494 1528

International Journal of Science and Research (IJSR) ISSN (Online): 2319-7064
Index Copernicus Value (2013): 6.14 | Impact Factor (2015): 6.391
Volume 5 Issue 10, October 2016 www.ijsr.net
Licensed Under Creative Commons Attribution CC BY
Figure 5: (a) Radiometric, (b) Total Magnetic Intensity, (c) Fraser filter Real and Imaginary Components (VLF) and (d) Karous Hjelt current density pseudo section along the profile
Ramadugu (R4-16050′18.7″, 79
016′37.7″)
PROFILE-V (RAMADUGU R5)
This Profile –V (16049′50.2″ latitude, 79
017′17.8″
longitude), R5 is located near eastern part of the study area the total length is 30meter. Fig.6c VLF anomaly curve (Real and Imaginary curves) indicate the presence three conductive futures C1, C2 and C3 around station 3m, 8mand 12m. R5 lamproite is located at12m is reflecting on apparent current density pseudo section (Fig.6d) is characterized by, in between shear zone and thin dyke. They are dipping towards right side of the profile.
Magnetic data (Fig.6b) suggest cooperative the magnetic negative value along the profile the Station 14 and 15 lamproite bodies and R5.
The Radiometric data (Fig. 6a) fluctuation low value observed station 10 and 23, the total of over the resistive body.
Figure 6: (a) Radiometric, (b) Total Magnetic Intensity, (c) Fraser filter Real and Imaginary Components (VLF) and (d) Karous Hjelt current density pseudo section along the profile
Ramadugu (R5-16049′50.2″, 79
017′17.8″)
PROFILE–VI (YACHARAM Y1)
Profile-VI (16051′12.9″ latitude, 79
015′ 32.1″ longitude)
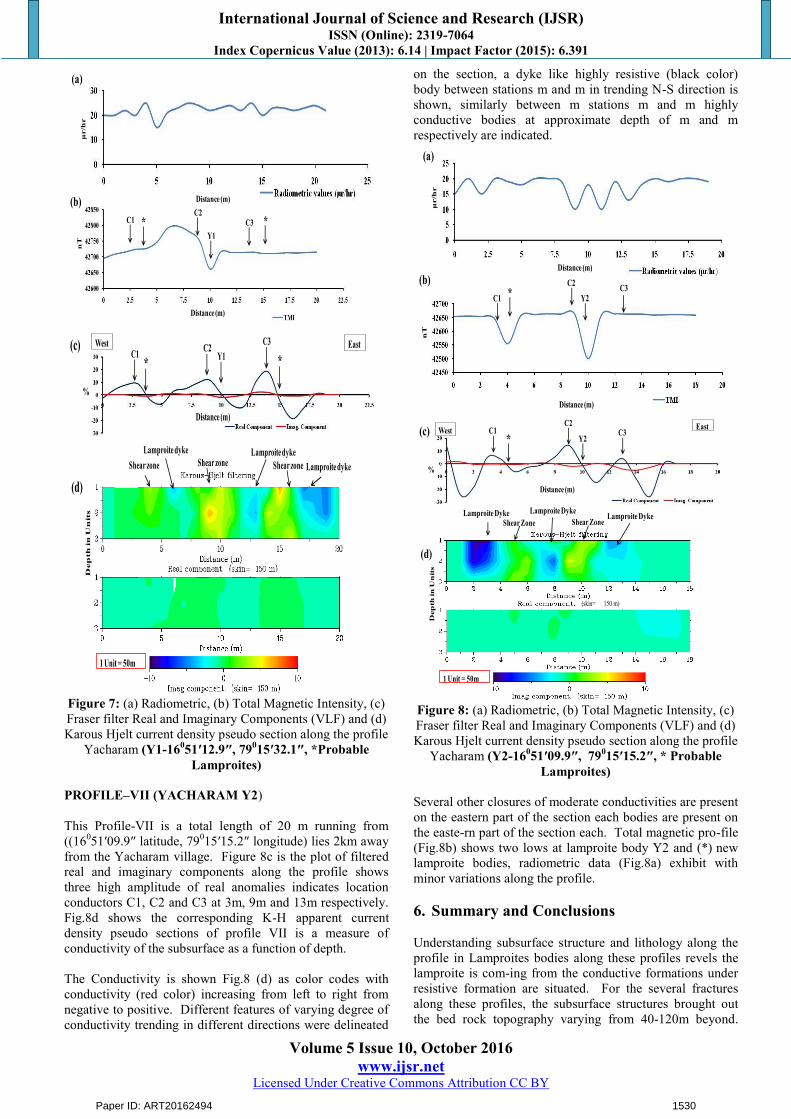
runs through the Y1 lamproite at Yacharam village (Fig.7c) real and imaginary component clearly brought out three conductive bodies at 3m, 8m and 13.5m are given C1, C2and C3 Fig.7 (d) is the current density distribu-tion indicate three dykes with a moderate current density, here also two probable zones are lampr-oite bodies at 3.5m and 15m are delineated.
Magnetic data (Fig.7b) suggest coopera-tive the magnetic negative value along the profile the station from 6m to 11m reflecting a fault model and radiometric data (7a) fluctuation low value observed Station 5m and 15m.
Distance (m)
nTµr
/hr
Distance (m)
Profile: 1 (R4)
R4
(a)
(b) C1 C2Fr1
Distance(m)
%
South NorthR4
C2C1
BED ROCK BED ROCK
Lamproite dyke
Fr1
Shear ZoneShear Zone
(skin= 70 m)
(skin= 70 m)
1 Unit = 8.75 m
(c)
(d)
µr/h
r
Distance (m)
Distance (m)
nT
R5C1
(a)
(b) C2 C3
Distance(m)
%
South North R5
BED ROCK BED ROCK
C3C1C2
Lamproite dykeShear ZoneShear Zone
(skin= 80 m)
(skin= 80 m)1 Unit = 16 m
(c)
(d)
Paper ID: ART20162494 1529
International Journal of Science and Research (IJSR) ISSN (Online): 2319-7064
Index Copernicus Value (2013): 6.14 | Impact Factor (2015): 6.391
Volume 5 Issue 10, October 2016 www.ijsr.net
Licensed Under Creative Commons Attribution CC BY
Figure 7: (a) Radiometric, (b) Total Magnetic Intensity, (c) Fraser filter Real and Imaginary Components (VLF) and (d) Karous Hjelt current density pseudo section along the profile
Yacharam (Y1-16051′12.9″, 790
15′32.1″, *Probable Lamproites)
PROFILE–VII (YACHARAM Y2)
This Profile-VII is a total length of 20 m running from ((160
51′09.9″ latitude, 79015′15.2″ longitude) lies 2km away
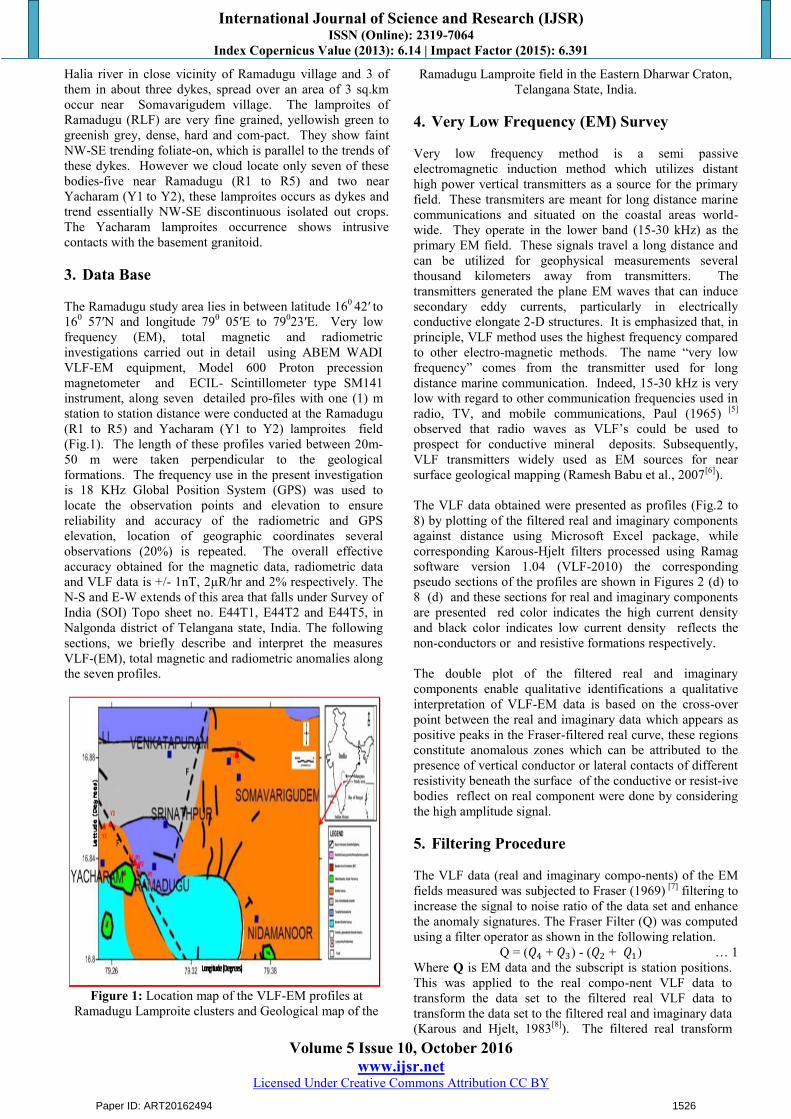
from the Yacharam village. Figure 8c is the plot of filtered real and imaginary components along the profile shows three high amplitude of real anomalies indicates location conductors C1, C2 and C3 at 3m, 9m and 13m respectively. Fig.8d shows the corresponding K-H apparent current density pseudo sections of profile VII is a measure of conductivity of the subsurface as a function of depth.
The Conductivity is shown Fig.8 (d) as color codes with conductivity (red color) increasing from left to right from negative to positive. Different features of varying degree of conductivity trending in different directions were delineated
on the section, a dyke like highly resistive (black color) body between stations m and m in trending N-S direction is shown, similarly between m stations m and m highly conductive bodies at approximate depth of m and m respectively are indicated.
Figure 8: (a) Radiometric, (b) Total Magnetic Intensity, (c) Fraser filter Real and Imaginary Components (VLF) and (d) Karous Hjelt current density pseudo section along the profile
Yacharam (Y2-16051′09.9″, 79
015′15.2″, * Probable
Lamproites)
Several other closures of moderate conductivities are present on the eastern part of the section each bodies are present on the easte-rn part of the section each. Total magnetic pro-file (Fig.8b) shows two lows at lamproite body Y2 and (*) new lamproite bodies, radiometric data (Fig.8a) exhibit with minor variations along the profile.
6. Summary and Conclusions
Understanding subsurface structure and lithology along the profile in Lamproites bodies along these profiles revels the lamproite is com-ing from the conductive formations under resistive formation are situated. For the several fractures along these profiles, the subsurface structures brought out the bed rock topography varying from 40-120m beyond.
nT
Distance (m)
Distance (m)
µr/
hr
(a)
(b)
Y1* *C1
C2C3
Dep
th in
Un
its
1 Unit = 50m
%
Distance (m)
West EastY1* *
(c)
(d)
C1 C2 C3
Lamproite dykeLamproite dykeLamproite dyke
Shear zone Shear zone Shear zone
Distance (m)
nT
µr/
hr
Distance (m)
(a)
(b)
Y2
* Y2C1C2 C3
Dep
th in
Un
its
1 Unit = 50m
%
Distance (m)
West EastY2*(c)
(d)
C1C2
C3
Lamproite DykeShear ZoneShear Zone
(skin= 150 m)
Lamproite Dyke Lamproite Dyke
Paper ID: ART20162494 1530
International Journal of Science and Research (IJSR) ISSN (Online): 2319-7064
Index Copernicus Value (2013): 6.14 | Impact Factor (2015): 6.391
Volume 5 Issue 10, October 2016 www.ijsr.net
Licensed Under Creative Commons Attribution CC BY
The conductive sub-surface structure brought out high conductive zone observed over younger granites and low conductive over lamproite body.
It is infer that the source for observed lamproites shows as a contact between high and low resistive intrusive features which might have created conditions favorable for thermogenic origin of the lamproites through this fracture zone essentially the involvement of distinct deep seated fault fractures in controlling their emplacement. From pseudo sections of real and imaginary components tectonically distur-bed zones are identified as faults / fracture zones.RLF lamproites bodies are essentially emplaced as hypabyssal dykes this would imply intrusion closer to the surface and this would additionally indicates that either only minor erosion or more uplift followed by erosion took place in the RLF (Chalapathi Rao et al., 2014) likewise while the RLF lamproites occur as dykes. The lamproite body at Ramadugu and Yacharam field occurred in close a specifically associate with NW-SE strike, trending dolerite dykes and fracture system and are mostly emp-lace at the contrast between dolerite (high resistivity) and grandiosities basement [condu-ctive] which is parallel to the trends of the dyke. Lamproite are emplacing along north east south east direction parallel oblique to the pollination joint dyke and regional fault.
The Ramadugu and Yacharam lamproites are ultrapotassic with molar ratios of K2O/Na2 O >3 (3.6-25.81), perpotassic with K2O >Al2 O3 (0.002-1.233) and peralkaline with K2O+Na2O / Al2 O 3 (o.65-1.14). Higher K2 O values in phlogopite and richterite lamproite and lower K2 O in the olivine lamproite are consistent with the mineralogy and also with lamproites described from Western Australia (Chalapathi Rao et al 2014[3]).
7. Acknowledgements
The authors are extremely grateful to the UGC New Delhi for the financial support exten-ded by them granting Emeritus Professor to Prof. G. Ramadass, and RFSMS fellowship to G. Sriramulu, Research scholar, Department of Geophysics, Osmania University, Hyderabad. The authors record their sincere thanks to Head of the department, Department of Geophysics, OU for providing facilities during the field work. We are thankful to Jagadish Research Scholar, CEG for helping during the fieldwork.
References
[1] Ramachandran, C, Kesavamani, M and Prasad, R.M.C.1999 a geophysical prong-ostication of primary diamond deposits in peninsular India. Jour. Geophysics, Vol20, No. 4, pp155-178
[2] GSI, 1999, District resource map of Nalgonda District, Andhra Pradesh, 1:250,000
[3] Chalapathi Rao, Alok kumar, Samarendra Sahoo, A. N,Dongre, Debojit Talukdar, 2014.Petrology and petrogenesis Mesopro-terozoic lamproites from the Ramadugu field, NW margin of the Cuddapah basin, Eastern Dharwar craton, southern India, Lithos, 196-197(2014) pp150-168
[4] Sridhar, M., and Rau, T.K 2005 Discovery of a new Kimberlite field Ramadugu lamproite Field (RLF), Nalgonda district, A.P. Proceedings of the group discussions on Kimberlite and related rocks of India .organized by the geological Society of Inida. Bangalore, Pp 55-57(extended abstract)
[5] Paul (1965) Ramag VLF processing software 1.04 versions 2010
[6] Ramesh Babu, V, Ram, S. Sundararajan, N, 2007, Modeling of magnetic and VLF-EM with an application to basement fractures- a case study from Raigad, India. Geophysics 71, 133-140
[7] Fraser, D.C., 1969. Contouring of VLF-EM data, Geophysics, 34, 958-967
[8] Karous, M., Hjelt, S.E.1983, Linear filtering of VLF dip-angle measurements, Geophysics Prosp.31. 31. No.782-794
[9] Karous, M., Hjelt, S.E.1977, Determina-tion of apparent current density from VLF measurements Report. Department of Geophysics, University of Oulu, Finland, Contribution No.89.p10
[10] Coney D.P, 1977 Model studies of the VLF-EM method geophysical prospecting Geoexploration, 15, p19-35
[11] Fisher, G., B, V. Le Quang and Muller, 1993, VLF ground surveys, a powerful tool for the study of shallow two-dimensi-onal structures Geophysical Prospecting 31.977-991
[12] Sundararajan, N, Ramesh Babu,V, Shiva Prasad ,N., Srinivas,Y,2006.VLPROS- a Matlab code for processing of VLF-EM data.Comput.Geosci.32,1806-1813
[13] Fraser, D.C., 1966, B.D. Fuller, S.H. Ward, Some numerical techniques for application in mining exploration, Geophysics. geoscienceworld.org/content/31/6/1066
[14] Ogilvy, R.D., Lee, A. C.1991, Interpreta-tion of VLF-EM in phase data using current density sections .Geophysics. Prosp.39.567-580
[15] Parker, M E., 1980 VLF electromagnetic mapping for strata-bound mineralization near Aberfeldy, Scotland, Trans. Inst. Min. Metall. Scot B 89, B123-B133
Author Profile
Dr. G. Ramadass is Emeritus Professor at Department of Geophysics, Osmania University, Hyderabad and has been taught PG students of Geophysics for the past 35 years. His research interest is in Integrated Geophysics, Gravity and
Magnetic, Remote Sensing, VLF-EM and Groundwater exploration and deep continental studies in peninsular India. Recently contribution is Kimberlite exploration in Eastern Dharwar Craton.
Dr. D. Vijay Kumar is Assistant Professor(c) at University College of Science, Department of Geophysics, Osmania University, Hyderabad. He is in teaching for PG students of Geophysics since 2010 and special interest in Groundwater exploration by
using Electromagnetic and Electrical Methods, and also doing research in Integrated Geophysical methods Gravity, Magnetic and Seismic data Processing and interpretation.
Paper ID: ART20162494 1531

International Journal of Science and Research (IJSR) ISSN (Online): 2319-7064
Index Copernicus Value (2013): 6.14 | Impact Factor (2015): 6.391
Volume 5 Issue 10, October 2016 www.ijsr.net
Licensed Under Creative Commons Attribution CC BY
G. Sriramulu is Research Scholar at Department of Geophysics, Osmania University, Hyderabad. He is doing his research on Investigation of Lamproites in parts of Nalgonda District, Telangana State, India. He
has also RFSMS fellowship awarded.
Paper ID: ART20162494 1532