Embed Size (px)
Citation preview
Ahmed Deif, Abdul-Wahab Janfawi, Rehab Ali An Integrated Metric to Assess Leanness Level Based on Efficiency, Flow and Variation
Journal of Supply Chain and Operations Management, Volume 13, Number 1, February 2015
44
An Integrated Metric to Assess Leanness Level
Based on Efficiency, Flow and Variation
Ahmed Deif * California Polytechnic State University, CA, USA
Abdul-Wahab Janfawi
University of Regina, SK, Canada
Rehab Ali Nile University, Cairo, Egypt
This paper presents a new integrated metric to assess the leanness level of a manufacturing system.
The new metric (EFV) is based on measuring the efficiency (E), the flow type (F) and the
variability level (V) within the system. The quantitative approach of the metric is augmented with
an expected range for the metric values to be able to visualize and position the relative performance
of the system and track its improvements. A case study illustrated the practical impact of the
developed metric and assessment approach. The results of leanness assessment in the case study
pointed to various areas of improvements in the facility leading to different focused lean initiatives
and plans. The developed EFV metric will enhance the existing leanness measurement literature,
help manufacturing managers and practitioners to measure the lean level of their organization, and
finally assist in tracking lean initiatives impact during their lean transformation journey.
Keywords: Lean assessment, Efficiency, Flow and Variation.
* Corresponding Author. Email address: [email protected]
I. INTRODUCTION
In the last few decades, many
organizations around the world use lean
philosophy, principles and tools in order to
enhance their competitiveness and reduce their
wastes. The implementation of lean
management in a system proved to support
practitioners in enhancing the processes,
workers and the overall system efficiency.
However, after applying lean tools and
techniques to a system, decision makers face
significant questions as to how lean their
system is, what is the lean level of their system,
and are there further opportunities to become
leaner? Practitioners may know their system is
leaner than before but they do not know how
much leaner they must become. In the practice
of lean management, the question is not only
how to transform into a lean manufacturing
system, but also how to measure the leanness
level of a company. Thus, decision makers need
a measurement tool or metric to assist them in
understanding the leanness of the system and
how much the system requires transferring to a
leaner target.
This paper proposes an integrated
metric to measure the leanness level of a
Ahmed Deif, Abdul-Wahab Janfawi, Rehab Ali An Integrated Metric to Assess Leanness Level Based on Efficiency, Flow and Variation
Journal of Supply Chain and Operations Management, Volume 13, Number 1, February 2015
45
manufacturing system from an efficiency, flow
type and variability (EFV) stand point. This
metric also highlights the weakness points from
a lean perspective in the system to allow for
further improvements. Additionally, it helps the
practitioners in tracking the system
improvement initiatives and feedback the
leanness level. The importance of the
developed metric lies in the opportunity to
assess concurrently efficiency, variability and
flow type of goods in one integrated measure.
Having the ability to measure the lean level can
assist an organization to be more
comprehensive in improving productivity and
facilitates the incorporation of the right tools
that develop the system. The reason for
choosing those three parameters in the
developed metric is the fact that they capture
three main characteristics in any of lean
systems which are waste reduction, continuous
flow and quality. Furthermore, the three
parameters are related to each other and affect
one another. This integrated metric will
enhance the implementation and assessment of
lean initiatives of a system in order to face the
global market competition.
II. LITERATURE REVIEW
With the existence of various lean tools,
few metrics exist to assess the leanness of
manufacturing systems. The metrics are either
used to evaluate the entire system or are
dedicated to a specific operation or unit within
the company. An early attempt towards a lean
manufacturing system assessment was through
the framework offered by MIT researchers
called the “Lean Enterprise Self-Assessment
Tool” (LESAT). It was used to evaluate the
current situation of leanness in an organization
(Hallam, 2003).
The manufacturing leanness was
defined as a unifying concept by (Bayou &
Korvin, 2008). They utilized a fuzzy-logic
approach to measure the leanness degree of a
manufacturing facility and compare the
measured leanness level to a benchmark
industry. Using another fuzzy approach, a
multi-grade fuzzy was used as a tool to assess
the leanness of an organization (Vinodh &
Kumar, 2010-a). They further combined the
fuzzy approach with the Quality Function
Deployment (QFD) technique in (2010-b) to
evaluate the degree of leanness in an
organization. An efficient method was found to
assess the lean of an organization using a
Leanness Measurement Team (LMT) by (Singh
& et al, 2010). Subsequently they tried to
enhance the system’s performance by figuring
out the leanness level of the system and the
requirements to increase the level of leanness.
Also, a fuzzy approach was proposed by
(Behrouzi & Wong, 2011) to evaluate lean
systems based on questionnaire capturing main
lean parameters. Furthermore, leanness
assessment tool (LAT) was proposed by (Pakdil
& Leonard, 2014) using both fuzzy based
quantitative (directly measurable and objective)
and qualitative (perceptions of individuals)
approaches to assess lean implementation. The
LAT measures leanness using eight quantitative
performance dimensions: time effectiveness,
quality, process, cost, human resources,
delivery, customer and inventory. The LAT
also uses five qualitative performance
dimensions: quality, process, customer, human
resources and delivery.
A unit-invariant leanness measure with
a self-contained benchmark was proposed by
(Wan & Chen, 2008) to quantify the leanness
level of manufacturing systems. They used
Data Envelopment Analysis (DEA) to
determine the leanness frontier as a benchmark
with which to make lean decisions and then
measure the cost, time and value-adding
investments of the decisions based on
improvement outputs. In the same direction and
unlike traditional systems which consider the
accumulation of costs or timing and not both,
Cost Time Profile (CTP) was used by (Rivera
& Chen, 2007) as a tool to indicate Cost-Time
Investments (CTI) in an organization and then
Ahmed Deif, Abdul-Wahab Janfawi, Rehab Ali An Integrated Metric to Assess Leanness Level Based on Efficiency, Flow and Variation
Journal of Supply Chain and Operations Management, Volume 13, Number 1, February 2015
46
measure the lean level of an organization. By
focusing on cost and time, the proposed tool
evaluated the impact of implementing lean tools
and techniques on the system’s performance. A
typical performance measures such as work-in-
process (WIP) level and lead time was used by
(Abdulmalek & Rajgopal, 2007) in their
attempt to prove the applicability of lean tools
in continuous manufacturing industries. They
used a current state of value stream map and a
future state of value stream map to distinguish
the differences between the two states. Multiple
industrial studies were conducted by (Serrano
et al., 2010) to investigate the use of the value
stream map, not only as a tool in regard to
processing improvement, but also as a system
assessment tool.
A qualitative approach was used by
(Soriano-Meier & Forrester, 2001) based on a
questionnaire and interviews in order to assess
the potential of applying lean tools to enhance
a short-term competitive strategy. In addition,
they used the Degree of Adoption (DOA)
technique to illustrate the degree of lean
production practices with work organization in
the production and operation function. The
same qualitative approach was employed by
(Shetty et al., 2010) of a structured
questionnaire to develop a score based lean
metric. They designed an inclusive numerical
lean evaluation for manufacturing
organizations. Another survey approach was
used by (Shetty et al., 2010) to assess the
implementation of lean Six Sigma in an
organization. They used software as an analyzer
and then used Cornball’s alpha to show the
experimental results. The level of
implementation of lean practices was illustrated
by (Doolen & Hacker, 2005) using a structured
survey in several small and large organizations.
They reviewed five surveys focusing on
evaluating a set of lean practices such as Just-
in-time (JIT) and Total Quality Management
(TQM).
A web-based Decision Support (DS)
tool was used by (Wan & Chen, 2009) as an
adaptive lean assessment. The purpose of the
(DS) tool is to fulfill lean practitioners’ needs
by evaluating system performance and
identifying the weaknesses within a system. A
set of integrated metrics was proposed by
(Duque & Rivera, 2007) such as monitoring the
progress of a lean implementation, continuous
monitoring, and benchmarking which were
proposed individually by different authors.
However, the proposed metric has limitations
due to the requirement of conducting a
technical investigation to confirm the results.
The Mahalanobis Distance (MD) was used by
(Srinivasaraghavan & Allada, 2005) as an
evaluation tool with which to provide a
quantitative measure of leanness. The
mahalanobis distance method is a technique
that distinguishes the pattern between two
groups. A lean assessment tool was proposed by
(Deif, 2012) focusing only on variability
mapping as an extension for the known value
stream mapping introducing variability index
(VI) as a quantitative metric.
From the analysis of the previous work,
it was shown that some work employed
qualitative approaches that failed to quantify
and track the real leanness of the system. In
addition, some of the quantitative approaches
(based mainly on fuzzy tools and surveyed
data) suffered from various degrees of
subjectivity that question the generality of the
assessment tools in terms of relevance and
applicability. A few other assessment
approaches were computationally exhaustive
making them difficult to fit within the lean
paradigm that requires effectiveness and ease of
application. A need to quantitatively capture the
main aspects of a leanness level is required.
Metrics developed for this task must be
effective and able to measure and track the
overall leanness of the system during and after
lean implementation. The developed EFV
metric is proposed to fulfill this need.
III. EFV LEAN ASSESSMENT METRIC
Ahmed Deif, Abdul-Wahab Janfawi, Rehab Ali An Integrated Metric to Assess Leanness Level Based on Efficiency, Flow and Variation
Journal of Supply Chain and Operations Management, Volume 13, Number 1, February 2015
47
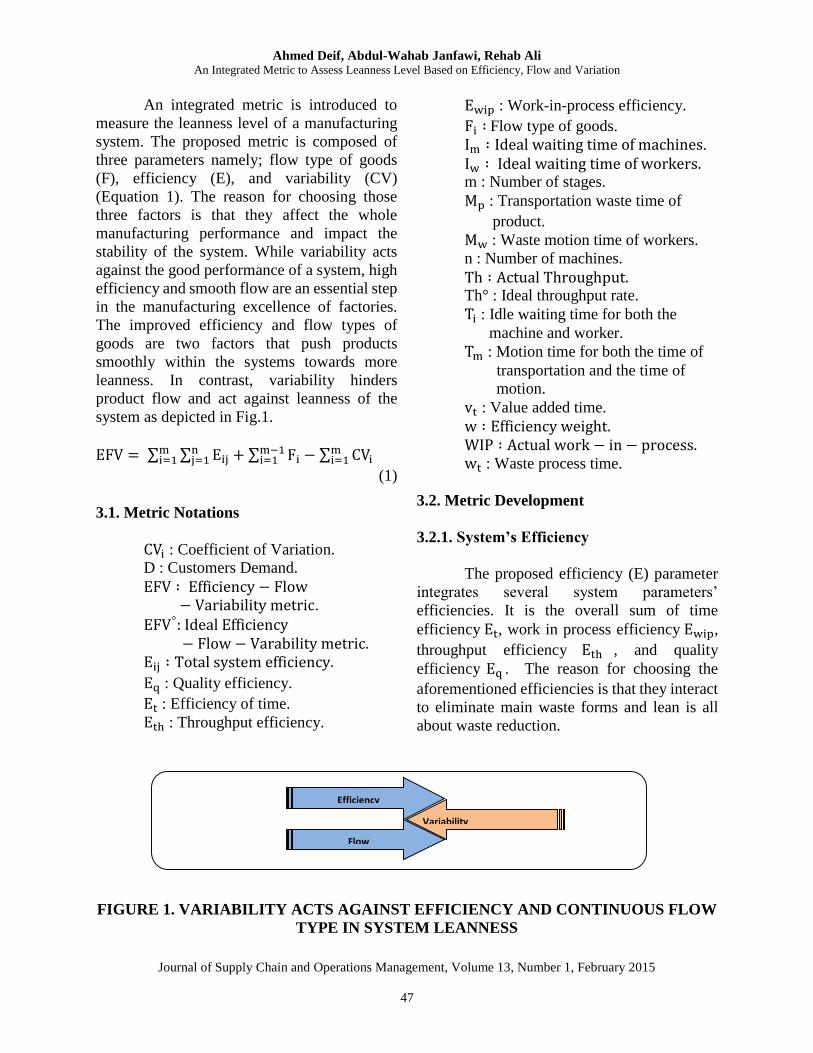
An integrated metric is introduced to
measure the leanness level of a manufacturing
system. The proposed metric is composed of
three parameters namely; flow type of goods
(F), efficiency (E), and variability (CV)
(Equation 1). The reason for choosing those
three factors is that they affect the whole
manufacturing performance and impact the
stability of the system. While variability acts
against the good performance of a system, high
efficiency and smooth flow are an essential step
in the manufacturing excellence of factories.
The improved efficiency and flow types of
goods are two factors that push products
smoothly within the systems towards more
leanness. In contrast, variability hinders
product flow and act against leanness of the
system as depicted in Fig.1.
EFV = ∑ ∑ Eij + ∑ Fim−1i=1 − ∑ CVi
mi=1
nj=1
mi=1
(1)
3.1. Metric Notations
CVi : Coefficient of Variation.
D : Customers Demand.
EFV ∶ Efficiency − Flow
− Variability metric.
EFV°: Ideal Efficiency
− Flow − Varability metric. Eij ∶ Total system efficiency.
Eq : Quality efficiency.
Et : Efficiency of time.
Eth : Throughput efficiency.
Ewip : Work-in-process efficiency.
Fi ∶ Flow type of goods.
Im ∶ Ideal waiting time of machines.
Iw ∶ Ideal waiting time of workers. m : Number of stages.
Mp : Transportation waste time of
product.
Mw : Waste motion time of workers.
n : Number of machines.
Th ∶ Actual Throughput. Th° : Ideal throughput rate.
Ti : Idle waiting time for both the
machine and worker.
Tm : Motion time for both the time of
transportation and the time of
motion.
vt : Value added time.
w ∶ Efficiency weight. WIP ∶ Actual work − in − process. wt : Waste process time.
3.2. Metric Development
3.2.1. System’s Efficiency
The proposed efficiency (E) parameter
integrates several system parameters’
efficiencies. It is the overall sum of time
efficiency Et, work in process efficiency Ewip,
throughput efficiency Eth , and quality
efficiency Eq . The reason for choosing the
aforementioned efficiencies is that they interact
to eliminate main waste forms and lean is all
about waste reduction.
FIGURE 1. VARIABILITY ACTS AGAINST EFFICIENCY AND CONTINUOUS FLOW
TYPE IN SYSTEM LEANNESS
Efficiency
Flow
Variability
Ahmed Deif, Abdul-Wahab Janfawi, Rehab Ali An Integrated Metric to Assess Leanness Level Based on Efficiency, Flow and Variation
Journal of Supply Chain and Operations Management, Volume 13, Number 1, February 2015
48
3.2.1.1. Time Efficiency 𝐄𝐭
To determine the system’s time
efficiency, it is necessary to calculate the
efficiency of the process by giving the relative
measure of the sum of value added time (𝑉𝑡),
over the sum of the overall process time, which
is the summation of both waste process times
(𝑊𝑡) and value added process time (𝑉𝑡)
(Equation 2).
Et = ∑ 𝑉𝑡
∑ 𝑊𝑡+∑ 𝑉𝑡
(2)
Waste time is composed of idle waiting
time (Ti) and motion time (Tm) (Equation 3).
Combining worker waiting time and machine
waiting time into one parameter will give the
overall idle wasted time (first parameter in
equation 3). Additionally, the motion wasted
times; the moving time for workers and lastly
the transportation time of products are
combined into one parameter that reflects
overall motion waste time (second parameter in
equation 3)
∑ wt = ∑[Ti + Tm] (3)
a) Idle Waiting Time (𝑻𝒊)
Ti = ∑ Immi=1 + ∑ ∑ Iw
mi=1
nj=1
(4)
Equation 4 represents idle waiting time,
which consists of both machine (Im) and
workers (Iw) idle waiting times.
b) Motion Waste Time (𝐓𝒎)
Tm = ∑ Mwmi=1 + ∑ Mp
mi=1
(5)
The waste of moving time is the wasted
time due to worker movement (Mw) (Equation
5). In addition, the transportation waste time is
the wasted time of any form of product
transportation (Mp ) such as being transported
by forklift. Summing workers moving waste
time and product transportation waste time
results in the total motion waste time.
3.2.1.2. Work in Process Efficiency (𝐄𝐰𝐢𝐩)
Ewip = ∑ ∑ TH°m
i=1nj=1 ×∑ ∑ vt
mi=1
nj=1
∑ ∑ WIPmi=1
nj=1
Where is Ewip ≤ 1
(6)
The work in process efficiency (Ewip)
is a relative measure of the ideal WIP which is
calculated based on little’s law (Hopp &
Spearman, 2007) as the sum throughput of all
machines at all stages multiplied by the sum
value of time of all machines at all stages, over
current WIP level of all machines at all stages
(Equation 6).
3.2.1.3. Throughput Efficiency (𝐄𝐭𝐡)
Eth = min {Th,D}
max {Th,D}
(7)
Throughput efficiency is a relative
measure of the minimum of either the overall
process throughput or customer’s demand
(whichever is less), over the maximum of the
overall process throughput or customer’s
demand (Equation 7). The difference between
throughput and demand creates fluctuation in
the throughput efficiency and it is a measure of
the gap between the customer’s demand and the
throughput (production rate). This measure will
capture any form of overproduction as a typical
lean waste.
3.2.1.4. Quality Efficiency (𝐄𝐪)
Ahmed Deif, Abdul-Wahab Janfawi, Rehab Ali An Integrated Metric to Assess Leanness Level Based on Efficiency, Flow and Variation
Journal of Supply Chain and Operations Management, Volume 13, Number 1, February 2015
49
Eq = ∑ parts with no defectsm
i=1
∑ parts with no defectsmi=1 + ∑ parts with defectsm
i=1
(8)
The quality efficiency is the relative
measure of the parts without defects over all
produced parts (parts with no defects plus parts
with defects as shown in Equation 8).
3.2.1.5. The Efficiencies Weights
E=
w1Et+ w2Ewip+ w3Eth+ (1−w1 – w2 − w3) Eq
where 0 ≤ E ≤ 1 , w1=w2=w3=0.25
(9)
The calculation of the overall efficiency
is simplified by multiplying the selected
efficiencies by equal weights (Equation 9).
Different values of the weights can be assigned
based on the adapted marketing and production
policies.
3.2.2. System’s Variability
The process variability level is
captured by sum of the coefficients of
variations for every stage/process in the system
(Equation 10). The CV is calculated by dividing
the standard deviation over the mean of the
cycle time for each stage (Equation 11). The
coefficient of variation is considered the second
moment of variation and is better in capture
variability within the system (Hopp &
Spearman, 2007) and (Deif, 2012). In this
developed metric, the CV will range from 0 to
1. The reason for establishing a cap of 1 is based
upon the authors actual industrial experience
that indicates that the majority of industrial
cases will fall within this range before going to
a sever instability for values beyond one.
Overall system variability = ∑ CVimi=1
(10)
CV= σ
μ =
standard deviation
mean
(11)
3.2.3 System’s Flow Types
The assigned values for the flow type
parameter in the developed metric is based on
viewing the push flow type of goods as worst
scenario from a lean perspective, while
continuous flow types of goods are viewed as
the best scenario from a lean perspective and
finally the pull flow types of goods as an
intermediate between the two policies (famous
lean principle: if you cannot flow then pull).
Therefore, flow type at each stage/process of
the assessed system will be analyzed and then
assigned a value of one if the flow was
continuous, pull flow type will be assigned 0.5,
and push flow type will be assigned zero. The
sum of flow types at all stages is calculated as
shown in Equation 12.
∑ Fi
m−1i=1
m−1
Where 0 ≤ Fi ≤ 1
(12)
3.3 Metric Target
Effective metrics and assessment tools
are preferred to have targets that reflect the
ideal state of the measured system. If there is a
clear and visible target, the employees in a
company will strive and work hard to
accomplish their target (Liker & Franz, 2011).
The target in the developed integrated EFV
metric is to reach the highest level of efficiency
with minimal variation while having a
continuous flow. The EFV target will help
quantify how far the system’s lean level is from
the expected best leanness level defined by the
developed approach. Based on the previous
metric development, the target should be equal
to two resulting from an ideal efficiency of
Ahmed Deif, Abdul-Wahab Janfawi, Rehab Ali An Integrated Metric to Assess Leanness Level Based on Efficiency, Flow and Variation
Journal of Supply Chain and Operations Management, Volume 13, Number 1, February 2015
50
100% when is E = 1 and a continuous flow
scoring also F = 1 on the metric range and with
no variation where CV = 0. Using equation 1
the ideal EFV should be 1 + 1 – 0 = 2. In order
to assess the relative performance of the overall
leanness level of the system, the calculated
overall EFV of the system will be divided by
the ideal EFV target and then multiplied by 100
to illustrate the percentage of lean level and
how lean the system is (Equation 13).
EFV= (EFV)
(2) × 100 = Leanness level %
(13)
3.4. EFV Metric Application Methodology
Step one:
Measuring current leanness level.
This is achieved by collecting the
system’s data and using it in the developed the
EFV metric, The manufacturers will thus
determine the level of leanness in their
organizations and will able to figure out how far
they are from the target of leanness level
defined by the developed metric.
As mentioned earlier, the theoretical
best value of the EFV metric is two. In contrast,
the theoretical worst value of the overall
efficiency is zero, the flow type of goods is zero
in the case of full push system, and for the
variability in the whole system is one (where
system is in real chaos). Thus the nominal
lowest value of the EFV metric is minus one.
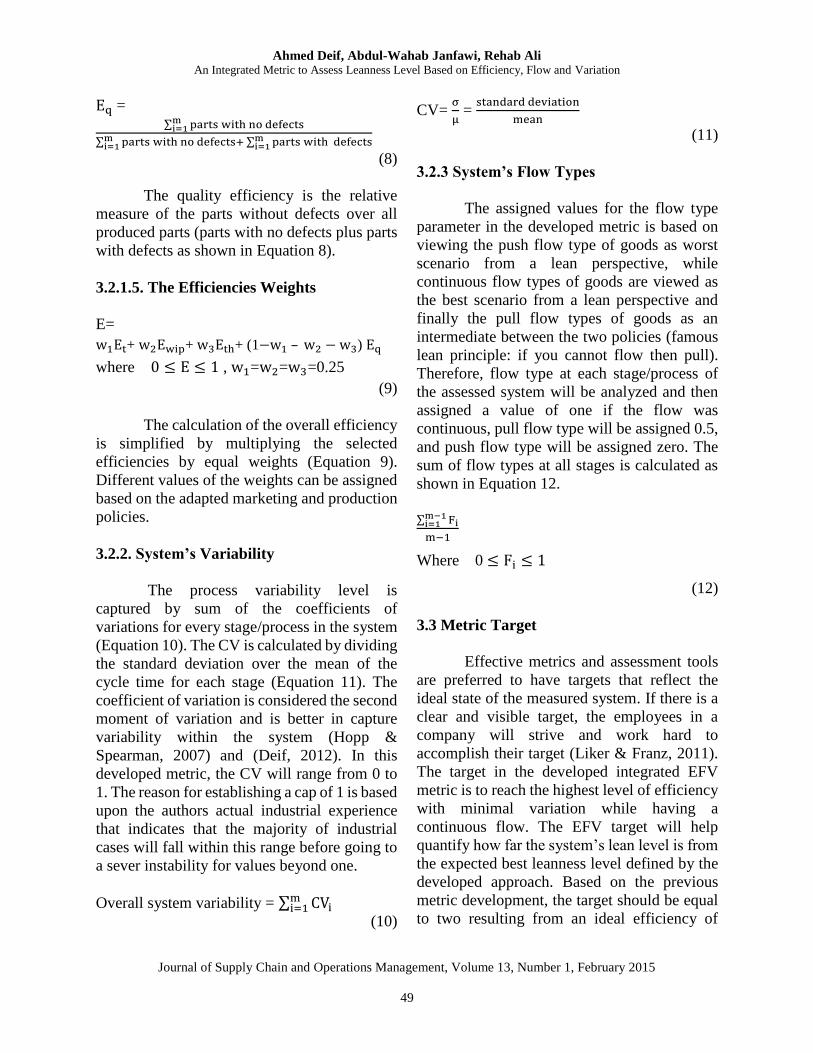
Therefore, the expected range of the EFV
metric is between minus one and two. In this
paper, the range between the two limits will be
divided into three zones to help the lean
practitioners to assess their leanness level. The
three zones are; Inefficient Performance (zone
1), Potential Improvement (zone 2), and Good
Performance (zone 3). Further division of the
range is also acceptable, however for simplicity
and illustration the EFV range is divided into
these three zones. Fig. 2 illustrates the three
zones within the EFV range.
Step two:
Identifying improvement opportunities.
In step two, the manufacturer will study
which zone their system fell into and in light of
the values offered by EFV metric they will
identify various weakness points within the
system. This will open the door to improvement
opportunities where manufacturers must focus
on eliminating waste, converting process from
push to pull, increasing the process efficiency,
and reducing the process variability.
Inefficient Performance Potential Improvement Good Performance
Zone 1 Zone 2 Zone 3
-1 0 1 2
FIGURE 2. EFV METRIC RANGE
Ahmed Deif, Abdul-Wahab Janfawi, Rehab Ali An Integrated Metric to Assess Leanness Level Based on Efficiency, Flow and Variation
Journal of Supply Chain and Operations Management, Volume 13, Number 1, February 2015
51
Step three:
Tracking leanness level improvement.
In step three, lean practitioners measure
the system again after improvements to track
the impact of these improvements on the
leanness level with respect to the initial level of
the system. They will also mark their new
position on the EFV metric’s range. The visual
illustration given by the EFV metric range
aligns with the visual control principle dictated
by lean philosophy and thus helps mangers to
easily spot their leanness level improvement.
Furthermore, if there is any limitation in the
system, it will be clear where the limitation is
and where the areas requiring improvement are
located.
IV. CASE STUDY
To demonstrate the application of the
developed integrated lean assessment metric, a
practical industrial case study is presented.
4.1. Factory’s Background
The selected company is one of the
largest steel pipe making companies in North
America. A subsidiary of the manufacturing
company, Tubular factory, was chosen for the
leanness assessment and further improvement.
Size of workforce in the factory is 55 with
moderate level of automation. The factory
produces a range of pipes - 30 inches in
diameter to 60 inches in diameter and the rate
of production is 150-200 pipes per day. The
plant operates twenty-four hours a day, seven
days a week, and 365 days a year. During each
shift there is a 30 minutes break. Additionally,
there is a coffee break which a worker can take
at any time if the worker is not busy (free
break).
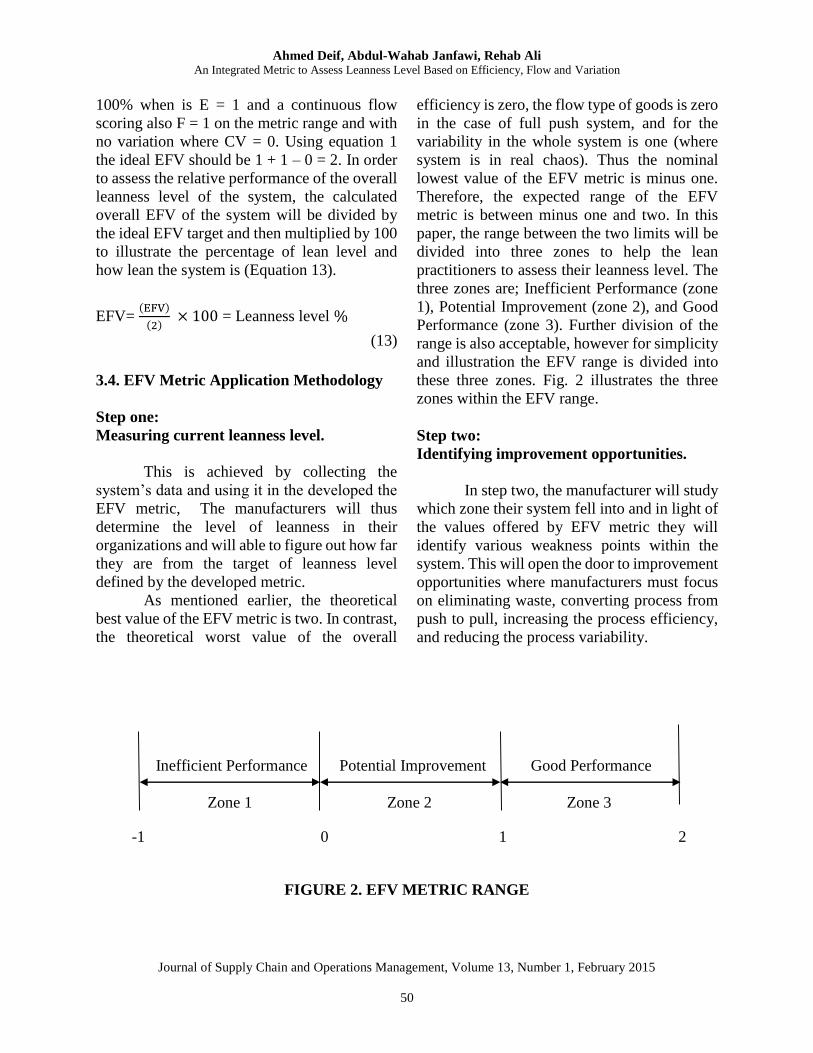
Every pipe from the production line, if
not defective, goes through eleven stages of
process as shown in Fig. 3. The eleven stages
are pipe making (using the technology of hot
rolling), pipe cleaning, preliminary sonic
inspection (PSI), internal inspection (ID),
outside inspection (OD), X-ray inspection, final
finishing, final visual inspection (FVI), final
sonic inspection (FSI), scale, and the customer
inspection stage. The pipes move from stage to
stage via conveyors.
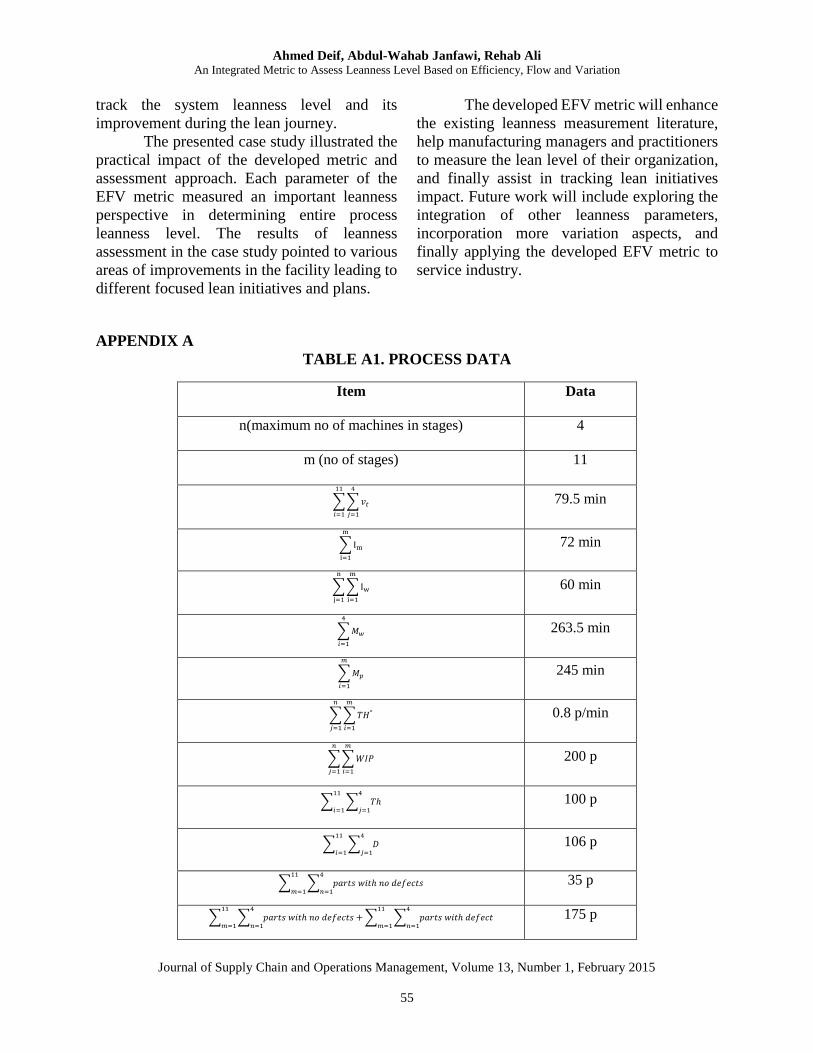
The process data was collected through
multiple field visits over more than a year.
Several random pipes were chosen to be
analyzed. It is also important to note that all
measurements were for a twelve hour shift. (See
Appendix A, Table A1 for all measurements)
FIGURE 3. CONSIDERED STEEL PIPE FACTORY PROCESSES
Pipe Making
Pipe Cleaning
Prelim. Sonic
Inspection
Internal Inspection
Outside Inspection
X-ray inspecti
on
final finishing
final visual inspection
final sonic inspection
scalecustomer inspection
stage
Ahmed Deif, Abdul-Wahab Janfawi, Rehab Ali An Integrated Metric to Assess Leanness Level Based on Efficiency, Flow and Variation
Journal of Supply Chain and Operations Management, Volume 13, Number 1, February 2015
52
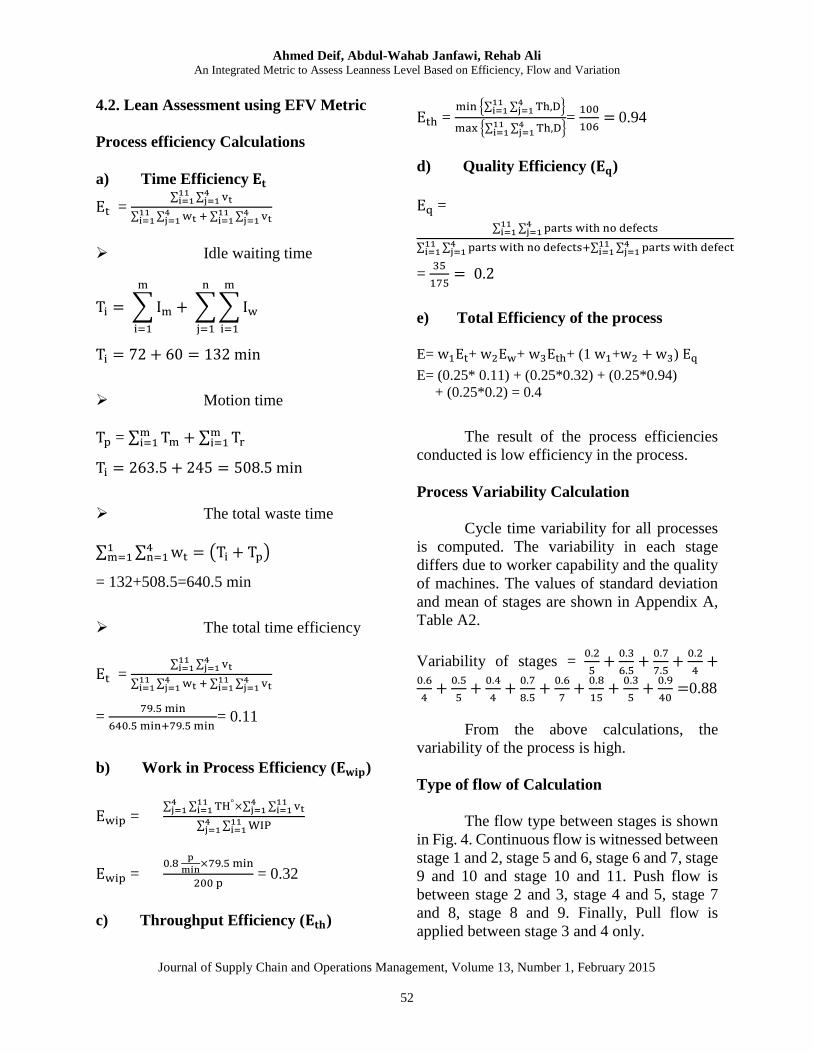
4.2. Lean Assessment using EFV Metric
Process efficiency Calculations
a) Time Efficiency 𝐄𝐭
Et = ∑ ∑ vt
4j=1
11i=1
∑ ∑ wt + ∑ ∑ vt4j=1
11i=1
4j=1
11i=1
Idle waiting time
Ti = ∑ Im
m
i=1
+ ∑ ∑ Iw
m
i=1
n
j=1
Ti = 72 + 60 = 132 min
Motion time
Tp = ∑ Tmmi=1 + ∑ Tr
mi=1
Ti = 263.5 + 245 = 508.5 min
The total waste time
∑ ∑ wt4n=1
1m=1 = (Ti + Tp)
= 132+508.5=640.5 min
The total time efficiency
Et = ∑ ∑ vt
4j=1
11i=1
∑ ∑ wt + ∑ ∑ vt4j=1
11i=1
4j=1
11i=1
= 79.5 min
640.5 min+79.5 min = 0.11
b) Work in Process Efficiency (𝐄𝐰𝐢𝐩)
Ewip = ∑ ∑ TH°11
i=14j=1 ×∑ ∑ vt
11i=1
4j=1
∑ ∑ WIP11i=1
4j=1
Ewip = 0.8
p
min×79.5 min
200 p = 0.32
c) Throughput Efficiency (𝐄𝐭𝐡)
Eth = min {∑ ∑ Th,D4
j=111i=1 }
max {∑ ∑ Th,D4j=1
11i=1 }
= 100
106= 0.94
d) Quality Efficiency (𝐄𝐪)
Eq =
∑ ∑ parts with no defects4j=1
11i=1
∑ ∑ parts with no defects4j=1
11i=1 +∑ ∑ parts with defect4
j=111i=1
= 35
175= 0.2
e) Total Efficiency of the process
E= w1Et+ w2Ew+ w3Eth+ (1 w1+w2 + w3) Eq
E= (0.25* 0.11) + (0.25*0.32) + (0.25*0.94)
+ (0.25*0.2) = 0.4
The result of the process efficiencies
conducted is low efficiency in the process.
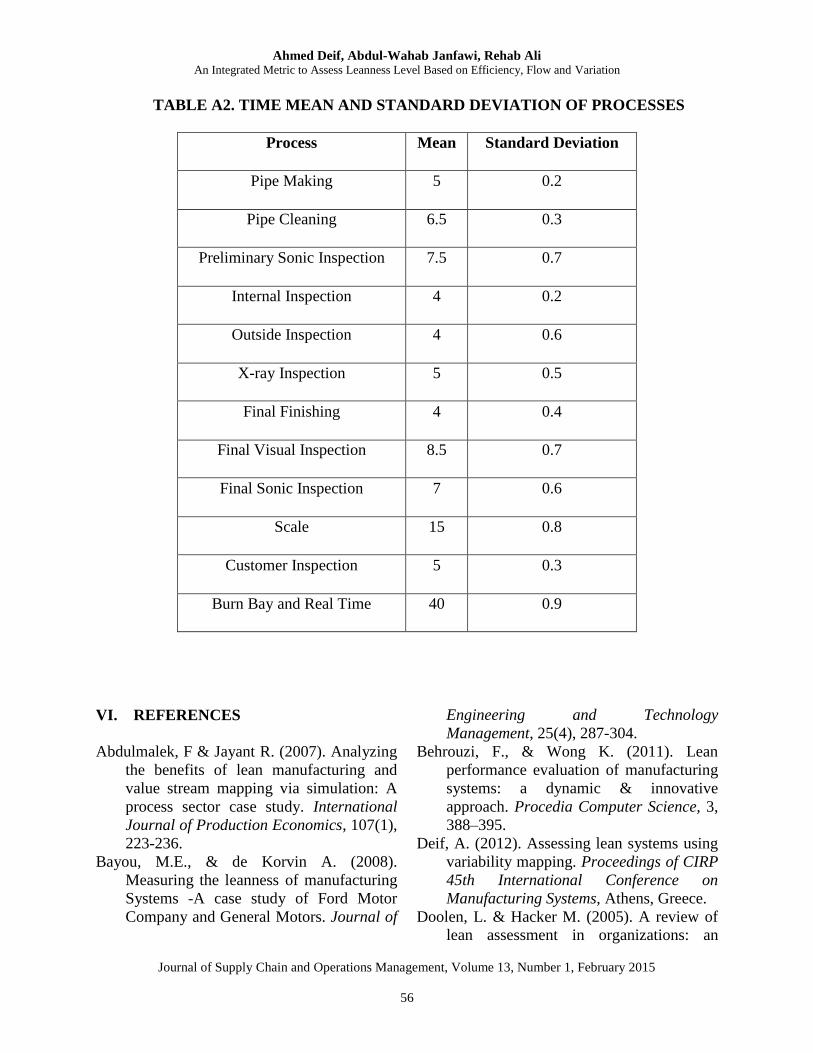
Process Variability Calculation
Cycle time variability for all processes
is computed. The variability in each stage
differs due to worker capability and the quality
of machines. The values of standard deviation
and mean of stages are shown in Appendix A,
Table A2.
Variability of stages = 0.2
5+
0.3
6.5+
0.7
7.5+
0.2
4+
0.6
4+
0.5
5+
0.4
4+
0.7
8.5+
0.6
7+
0.8
15+
0.3
5+
0.9
40=0.88
From the above calculations, the
variability of the process is high.
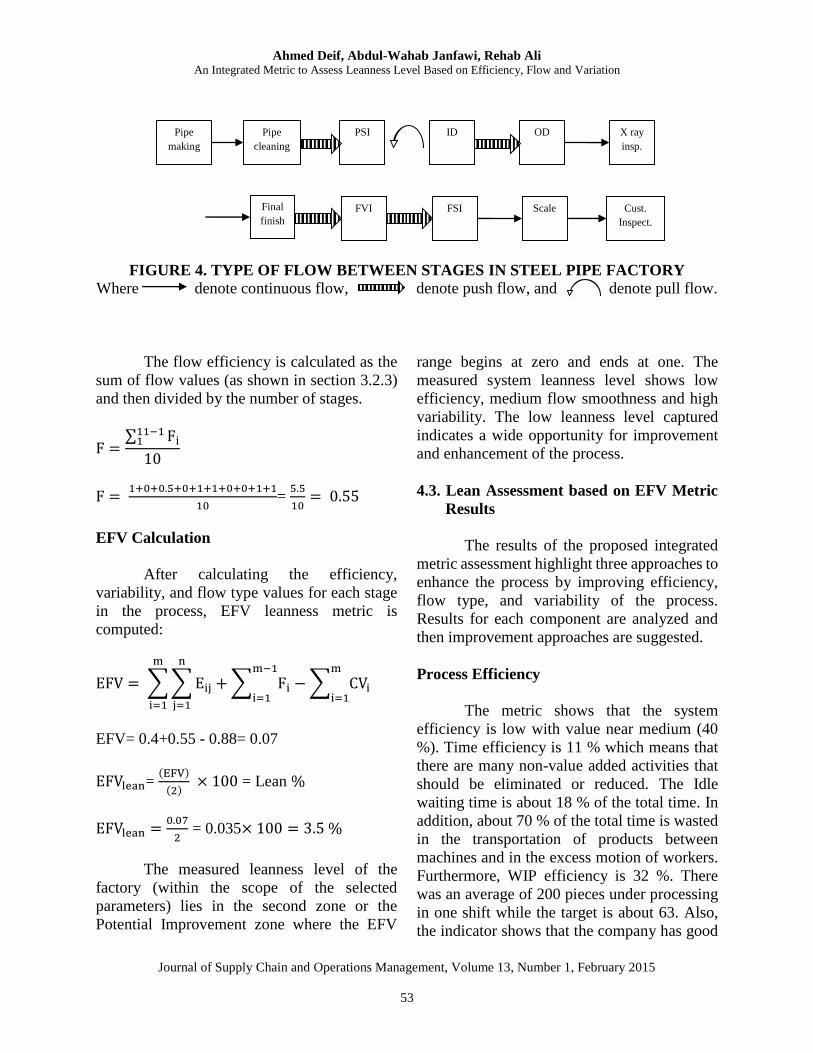
Type of flow of Calculation
The flow type between stages is shown
in Fig. 4. Continuous flow is witnessed between
stage 1 and 2, stage 5 and 6, stage 6 and 7, stage
9 and 10 and stage 10 and 11. Push flow is
between stage 2 and 3, stage 4 and 5, stage 7
and 8, stage 8 and 9. Finally, Pull flow is
applied between stage 3 and 4 only.
Ahmed Deif, Abdul-Wahab Janfawi, Rehab Ali An Integrated Metric to Assess Leanness Level Based on Efficiency, Flow and Variation
Journal of Supply Chain and Operations Management, Volume 13, Number 1, February 2015
53
FIGURE 4. TYPE OF FLOW BETWEEN STAGES IN STEEL PIPE FACTORY
Where denote continuous flow, denote push flow, and denote pull flow.
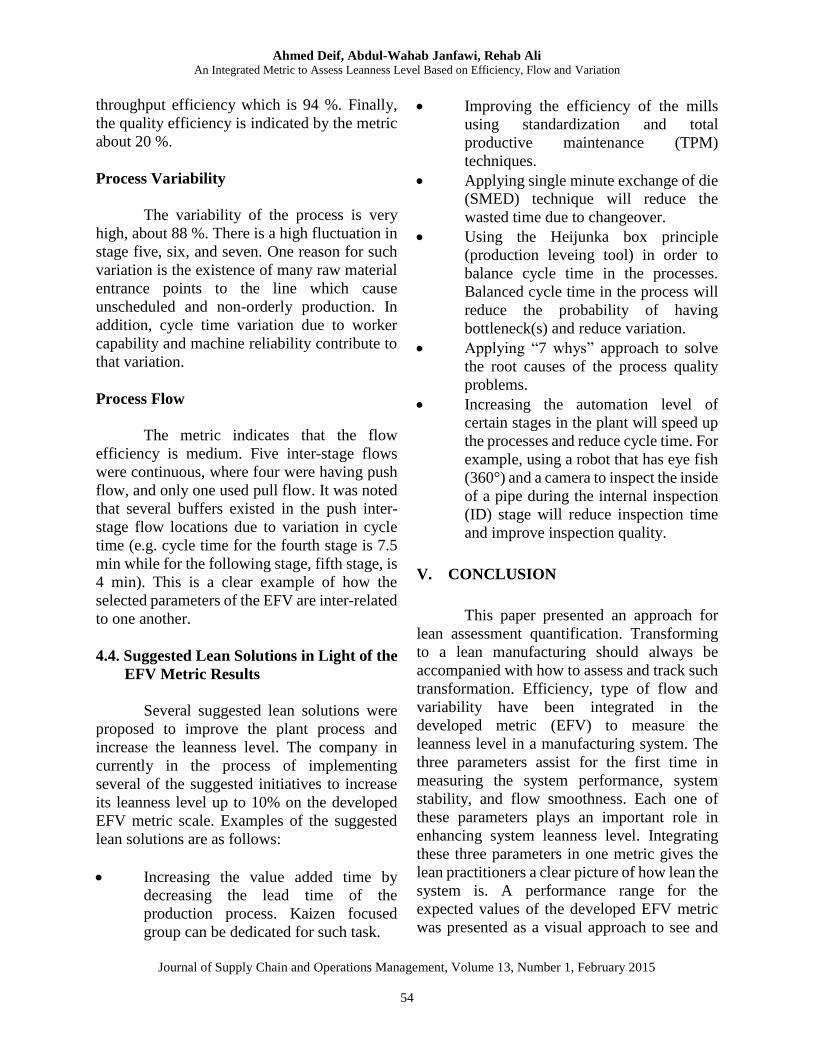
The flow efficiency is calculated as the
sum of flow values (as shown in section 3.2.3)
and then divided by the number of stages.
F =∑ Fi
11−11
10
F = 1+0+0.5+0+1+1+0+0+1+1
10=
5.5
10= 0.55
EFV Calculation
After calculating the efficiency,
variability, and flow type values for each stage
in the process, EFV leanness metric is
computed:
EFV = ∑ ∑ Eij + ∑ Fi
m−1
i=1− ∑ CVi
m
i=1
n
j=1
m
i=1
EFV= 0.4+0.55 - 0.88= 0.07
EFVlean= (EFV)
(2) × 100 = Lean %
EFVlean =0.07
2 = 0.035× 100 = 3.5 %
The measured leanness level of the
factory (within the scope of the selected
parameters) lies in the second zone or the
Potential Improvement zone where the EFV
range begins at zero and ends at one. The
measured system leanness level shows low
efficiency, medium flow smoothness and high
variability. The low leanness level captured
indicates a wide opportunity for improvement
and enhancement of the process.
4.3. Lean Assessment based on EFV Metric
Results
The results of the proposed integrated
metric assessment highlight three approaches to
enhance the process by improving efficiency,
flow type, and variability of the process.
Results for each component are analyzed and
then improvement approaches are suggested.
Process Efficiency
The metric shows that the system
efficiency is low with value near medium (40
%). Time efficiency is 11 % which means that
there are many non-value added activities that
should be eliminated or reduced. The Idle
waiting time is about 18 % of the total time. In
addition, about 70 % of the total time is wasted
in the transportation of products between
machines and in the excess motion of workers.
Furthermore, WIP efficiency is 32 %. There
was an average of 200 pieces under processing
in one shift while the target is about 63. Also,
the indicator shows that the company has good
Pipe
making
Cust.
Inspect.
FSI
X ray
insp.
Pipe
cleaning
Final
finish
ID
FVI
vvv
PSI
OD
Scale
Ahmed Deif, Abdul-Wahab Janfawi, Rehab Ali An Integrated Metric to Assess Leanness Level Based on Efficiency, Flow and Variation
Journal of Supply Chain and Operations Management, Volume 13, Number 1, February 2015
54
throughput efficiency which is 94 %. Finally,
the quality efficiency is indicated by the metric
about 20 %.
Process Variability
The variability of the process is very
high, about 88 %. There is a high fluctuation in
stage five, six, and seven. One reason for such
variation is the existence of many raw material
entrance points to the line which cause
unscheduled and non-orderly production. In
addition, cycle time variation due to worker
capability and machine reliability contribute to
that variation.
Process Flow
The metric indicates that the flow
efficiency is medium. Five inter-stage flows
were continuous, where four were having push
flow, and only one used pull flow. It was noted
that several buffers existed in the push inter-
stage flow locations due to variation in cycle
time (e.g. cycle time for the fourth stage is 7.5
min while for the following stage, fifth stage, is
4 min). This is a clear example of how the
selected parameters of the EFV are inter-related
to one another.
4.4. Suggested Lean Solutions in Light of the
EFV Metric Results
Several suggested lean solutions were
proposed to improve the plant process and
increase the leanness level. The company in
currently in the process of implementing
several of the suggested initiatives to increase
its leanness level up to 10% on the developed
EFV metric scale. Examples of the suggested
lean solutions are as follows:
Increasing the value added time by
decreasing the lead time of the
production process. Kaizen focused
group can be dedicated for such task.
Improving the efficiency of the mills
using standardization and total
productive maintenance (TPM)
techniques.
Applying single minute exchange of die
(SMED) technique will reduce the
wasted time due to changeover.
Using the Heijunka box principle
(production leveing tool) in order to
balance cycle time in the processes.
Balanced cycle time in the process will
reduce the probability of having
bottleneck(s) and reduce variation.
Applying “7 whys” approach to solve
the root causes of the process quality
problems.
Increasing the automation level of
certain stages in the plant will speed up
the processes and reduce cycle time. For
example, using a robot that has eye fish
(360°) and a camera to inspect the inside
of a pipe during the internal inspection
(ID) stage will reduce inspection time
and improve inspection quality.
V. CONCLUSION
This paper presented an approach for
lean assessment quantification. Transforming
to a lean manufacturing should always be
accompanied with how to assess and track such
transformation. Efficiency, type of flow and
variability have been integrated in the
developed metric (EFV) to measure the
leanness level in a manufacturing system. The
three parameters assist for the first time in
measuring the system performance, system
stability, and flow smoothness. Each one of
these parameters plays an important role in
enhancing system leanness level. Integrating
these three parameters in one metric gives the
lean practitioners a clear picture of how lean the
system is. A performance range for the
expected values of the developed EFV metric
was presented as a visual approach to see and
Ahmed Deif, Abdul-Wahab Janfawi, Rehab Ali An Integrated Metric to Assess Leanness Level Based on Efficiency, Flow and Variation
Journal of Supply Chain and Operations Management, Volume 13, Number 1, February 2015
55
track the system leanness level and its
improvement during the lean journey.
The presented case study illustrated the
practical impact of the developed metric and
assessment approach. Each parameter of the
EFV metric measured an important leanness
perspective in determining entire process
leanness level. The results of leanness
assessment in the case study pointed to various
areas of improvements in the facility leading to
different focused lean initiatives and plans.
The developed EFV metric will enhance
the existing leanness measurement literature,
help manufacturing managers and practitioners
to measure the lean level of their organization,
and finally assist in tracking lean initiatives
impact. Future work will include exploring the
integration of other leanness parameters,
incorporation more variation aspects, and
finally applying the developed EFV metric to
service industry.
APPENDIX A
TABLE A1. PROCESS DATA
Item Data
n(maximum no of machines in stages) 4
m (no of stages) 11
∑ ∑ 𝑣𝑡
4
𝑗=1
11
𝑖=1
79.5 min
∑ Im
m
i=1
72 min
∑ ∑ Iw
m
i=1
n
j=1
60 min
∑ 𝑀𝑤
4
𝑖=1
263.5 min
∑ 𝑀𝑝
𝑚
𝑖=1
245 min
∑ ∑ 𝑇𝐻°
𝑚
𝑖=1
𝑛
𝑗=1
0.8 p/min
∑ ∑ 𝑊𝐼𝑃
𝑚
𝑖=1
𝑛
𝑗=1
200 p
∑ ∑ 𝑇ℎ4
𝑗=1
11
𝑖=1 100 p
∑ ∑ 𝐷4
𝑗=1
11
𝑖=1 106 p
∑ ∑ 𝑝𝑎𝑟𝑡𝑠 𝑤𝑖𝑡ℎ 𝑛𝑜 𝑑𝑒𝑓𝑒𝑐𝑡𝑠4
𝑛=1
11
𝑚=1 35 p
∑ ∑ 𝑝𝑎𝑟𝑡𝑠 𝑤𝑖𝑡ℎ 𝑛𝑜 𝑑𝑒𝑓𝑒𝑐𝑡𝑠4
𝑛=1
11
𝑚=1+ ∑ ∑ 𝑝𝑎𝑟𝑡𝑠 𝑤𝑖𝑡ℎ 𝑑𝑒𝑓𝑒𝑐𝑡
4
𝑛=1
11
𝑚=1 175 p
Ahmed Deif, Abdul-Wahab Janfawi, Rehab Ali An Integrated Metric to Assess Leanness Level Based on Efficiency, Flow and Variation
Journal of Supply Chain and Operations Management, Volume 13, Number 1, February 2015
56
TABLE A2. TIME MEAN AND STANDARD DEVIATION OF PROCESSES
Process Mean Standard Deviation
Pipe Making 5 0.2
Pipe Cleaning 6.5 0.3
Preliminary Sonic Inspection 7.5 0.7
Internal Inspection 4 0.2
Outside Inspection 4 0.6
X-ray Inspection 5 0.5
Final Finishing 4 0.4
Final Visual Inspection 8.5 0.7
Final Sonic Inspection 7 0.6
Scale 15 0.8
Customer Inspection 5 0.3
Burn Bay and Real Time 40 0.9
VI. REFERENCES
Abdulmalek, F & Jayant R. (2007). Analyzing
the benefits of lean manufacturing and
value stream mapping via simulation: A
process sector case study. International
Journal of Production Economics, 107(1),
223-236.
Bayou, M.E., & de Korvin A. (2008).
Measuring the leanness of manufacturing
Systems -A case study of Ford Motor
Company and General Motors. Journal of
Engineering and Technology
Management, 25(4), 287-304.
Behrouzi, F., & Wong K. (2011). Lean
performance evaluation of manufacturing
systems: a dynamic & innovative
approach. Procedia Computer Science, 3,
388–395.
Deif, A. (2012). Assessing lean systems using
variability mapping. Proceedings of CIRP
45th International Conference on
Manufacturing Systems, Athens, Greece.
Doolen, L. & Hacker M. (2005). A review of
lean assessment in organizations: an
Ahmed Deif, Abdul-Wahab Janfawi, Rehab Ali An Integrated Metric to Assess Leanness Level Based on Efficiency, Flow and Variation
Journal of Supply Chain and Operations Management, Volume 13, Number 1, February 2015
57
exploratory study of lean practices by
electronics manufacturers. Journal of
manufacturing system, 24(1), 55-67.
Duque, D. & Rivera C. (2007). Lean
manufacturing measurement: the
relationship between lean activities and
lean metrics. Estudios Gerenciales,
23(105), 69-83.
Hallam C. (2003). Lean enterprise self-
assessment as a leading indicator for
accelerating transformation in the
aerospace industry, PhD Thesis
Massachusetts Institute of Technology.
Hopp, W., & Spearman (2007) Factory
Physics, McGraw-Hill/Irwin, New York.
Horacio S. M. & Forrester P. (2001). A model
for evaluating the degree of leanness of
manufacturing firms. Integrated
Manufacturing Systems, 13(2), 104-109.
Hung W. & Chen. F. (2008). A leanness
measure of manufacturing systems for
quantifying impacts of lean initiatives.
International Journal of Production
Research, 46(23), 6567-6584.
Hung W., & Chen, F. (2009). Decision support
for lean practitioners: a web-based
adaptive assessment approach. Computers
in Industry, 60(4), 277-283.
Ibon, S., Ochoa, C., & De Castro, R. (2010).
Evaluation of value stream mapping in
manufacturing system redesign.
International Journal of Production
Research, 46(16), 4409- 4430.
Liker, J. K., & Franz, J. K. (2011). Lean
Processes Start with a Purpose: The
Toyota way to continuous improvement
linking strategy with operational
excellence to achieve superior
performance, McGraw-Hill, New York.
Pakdil, F. & Leonard, K. (2014). Criteria for a
lean organization: development of a lean
assessment tool. International Journal of
Production Research. 52(15), 4587-4607.
Rivera, L & Chen F. (2007). Measuring the
impact of lean tools on the cost time
investment of a product using cost–time
profiles. Robotics and Computer-
Integrated Manufacturing, 23(6), 684-689.
Shetty, D., Ali, A. & Cummings, R. (2010). A
Model to Assess Lean Thinking
Manufacturing Initiatives. International
Journal of Lean Six Sigma, 1(4), 310-334.
Shetty, D., Ali, A., & Cummings R. (2010).
Assess Lean Model for Thinking
Manufacturing Initiatives. Proceedings of
the 2010 industrial Engineering Research
Conference.
Shetty, S., Paul C., Sampson G. & Dawn U.
(2010). Assessing the extent of Lean
Implementation in an
Organization. Proceedings of the 2010
industrial Engineering Research
Conference.
Singh, B, Garg, S., & S.K. Sharma. (2010).
Development of index for measuring
leanness: study of an Indian auto
Component industry. Measuring Business
Excellence, 14 (20), 46-53.
Srinivasraghavan, J., & Allada, V. (2005).
Application of mahalanobis distance as a
lean assessment metric. The International
Journal of Advanced Manufacturing
Technology, 29(11), 1159-168.
Vinodh, S. & Chintha, K. (2010). Application
of fuzzy QFD for enabling leanness in a
manufacturing organization, International
Journal of Production Research, 49 (6),
1627-1644.
Vinodh, S. & Chintha, K. (2010). Leanness
assessment using multi-grade fuzzy
approach. International Journal of
Production Research, 49(2), 431–445.