Embed Size (px)
Citation preview
HAL Id: hal-01632276https://hal.archives-ouvertes.fr/hal-01632276
Submitted on 9 Nov 2017
HAL is a multi-disciplinary open accessarchive for the deposit and dissemination of sci-entific research documents, whether they are pub-lished or not. The documents may come fromteaching and research institutions in France orabroad, or from public or private research centers.
L’archive ouverte pluridisciplinaire HAL, estdestinée au dépôt et à la diffusion de documentsscientifiques de niveau recherche, publiés ou non,émanant des établissements d’enseignement et derecherche français ou étrangers, des laboratoirespublics ou privés.
An integrated modeling framework for quantitativebusiness continuity assessment
Zhiguo Zeng, Enrico Zio
To cite this version:Zhiguo Zeng, Enrico Zio. An integrated modeling framework for quantitative business continu-ity assessment. Process Safety and Environmental Protection, Elsevier, 2017, 106, pp.76 - 88.�10.1016/j.psep.2016.12.002�. �hal-01632276�
An integrated modeling framework for
quantitative business continuity assessmentZhiguo Zeng,† Enrico Zio (*),†‡
†Chair on System Science and the Energy Challenge, Fondation Electricite de France (EDF),
CentraleSupelec, Universite Paris-Saclay, Grande Voie des Vignes, 92290 Chatenay-Malabry, France‡Energy Department, Politecnico di Milano, Milano, Italy
Abstract
Systems are increasingly exposed to threats of disruptive events, e.g., failures, natural disasters, terrorist
attacks, etc. A proactive approach is needed to protect the business and reduce the potential losses caused by these
disruptive events. Business Continuity Management (BCM) is a way to integrate the recovery process within
the preventive framework of risk assessment. Such integrated risk management strategy offers great potential
benefits. However, the complexity of applying it in practice is such that existing BCM strategies are mainly
based on qualitative methods only, which limits the potential added values. To support quantitative BCM, in this
paper we define a set of quantitative business continuity metrics. The defined metrics are based on the estimated
losses incurred by the disruptive event in the whole business process. For this, the business process is divided
into four sequential phases, i.e., protection phase, mitigation phase, emergency phase and recovery phase. For
each phase, a specific modeling method is developed and an integrated modeling framework is constructed for
the business continuity. Simulation can, then, be used to quantify the business continuity metrics. The developed
methods are applied to assess the business continuity of an oil storage tank farm.
Index Terms
Business continuity management, risk analysis, event tree, event consequence diagram, semi-Markovian model
∗ Email of the corresponding author: [email protected], [email protected]
December 31, 2016 DRAFT
1
An integrated modeling framework for
quantitative business continuity assessment
I. INTRODUCTION1
Nowadays, systems, especially critical infrastructures in process industries, are increasingly exposed to threats2
from disruptive events [1], e.g., unexpected system failures [2], natural disasters [3], terrorist attacks [4], etc.3
Usually, organizations rely on risk analysis and management methods to protect them from the potential losses4
caused by the disruptive events [5–8]. Khan et al. [9] presented a thorough review of the commonly applied5
safety and risk management methods in process industries. Most of the existing risk analysis and management6
methods focus on damage processes by analyzing the possible consequences of a disruptive event and their7
likelihoods [10]. The recovery process, however, is not considered by these methods. In practice, the potential8
losses that an organization might suffer also depend on the recovery process. According to a survey by IBM9
Global Services [11], in 2008, enterprises in IT sectors have been estimated to suffer from an average revenue10
cost of 2.8 million US dollars per hour for an unplanned application outage. Another report from Ponemon11
Institute reveals that for a company that operates data centers, the average downtime cost per minute has exceeded12
$5, 000 [12]. For these systems, conventional risk analysis and management methods should be extended, so13
that the recovery process can be integrated in risk management.14
Business Continuity Management (BCM) is a way to integrate the recovery process within the preventive15
view of risk assessment [13]. It is defined by the International Organization of Standards (ISO) as “holistic16
management process that identifies the potential threats to an organization and the impacts to business operations17
that those threats, if realized, might cause, which provides a framework for building organizational resilience18
with the capability of an effective response that safeguards the interests of its key stakeholders, reputation, brand19
and value-creating activities ” [14]. As an integrated management strategy aiming at reducing the technological20
and operational risks that threaten an organization’s recovery from hazards and interruptions, BCM has attracted21
a lot of attention in the last decade [15].22
Cerullo et al. [13] proposed a comprehensive approach to BCM planning, with particular focuses on internal23
and external information security threats. Zsidisin et al. [16] discussed the necessity and benefit of implementing24
BCM in an organization. Castillo [17] surveyed the application of BCM planning to achieve organizational25
disaster preparedness at Boeing. Gibb and Buchanan [18] presented an integrated framework to support BCM26
planning. Herbane et al. [15] reviewed the historical evolution of BCM and summarized critical events that27
motivate its development. Snedaker [19] compared BCM to the conventional risk management methods and28
pointed out that BCM not only focuses on the protection of the system before the crisis, but also the recovery29
process during and after the crisis. Randeree et al. [20] developed a model to assess the maturity of the BCM30
programs and applied it on a case study from UAE banking sector. Faertes [21] used system reliability models31
to plan BCM. Sahebjamnia et al. [22] proposed a framework to integrate BCM and disaster recovery planning,32
to ensure that the system would resume and recover its operation in an efficient and effective way. Parise et33
December 31, 2016 DRAFT
2
al. [23] discussed methods that are used to ensure the business continuity of a safety-related power supply1
system. Torabi et al. [24] developed an enhanced risk assessment framework to support business continuity2
management. Rabbani et al. [25] presented a fuzzy cost-benefit analysis method for planning BCM strategies.3
As a holistic, integrated risk management strategy, BCM offers great potential benefits but the complexity4
of the problem is such that most currently existing BCM strategies are based on qualitative methods only, and5
this limits practical application. Very few works concern the quantitative modeling and analysis of business6
continuity. Boehmer et al. [26] presented an approach, which is based on process algebra and modal logic, to7
model the system behavior in the business continuity process. Similar models have been applied in Brandt et al.8
[27] to describe the business continuity process of a credit card company. A multi-layer model is developed in9
Asnar [28] to model the business continuity of a loan originating process. Bonafede et al. [29] combined Cox’s10
model and Bayesian networks to model the business continuity process. Tan and Takakuwa [30] developed a11
simulation model to investigate the business continuity of a company considering the outbreak of a pandemic12
disease, where the business continuity is characterized by the operation rate and the plant-utilization rate. These13
models describe the post-crisis behavior of the system. However, no clearly-defined business metrics have been14
defined from these models, which prohibits the quantitative analysis of business continuity based on these15
models and therefore, limits their application in practice.16
This paper focuses on the modeling and quantitative analysis of business continuity. The contributions of this17
paper are summarized as follows.18
• Four quantitative metrics for business continuity are defined, based on the potential losses caused by the19
disruptive events.20
• An integrated modeling framework is developed to model the whole business process.21
• A simulation-based method is presented to calculate the defined business continuity metrics based on the22
integrated model.23
The rest of the paper is organized as follows. In Section II, we present a four-phase conceptual model for24
business processes. Based on the conceptual model, the definition of the quantitative business continuity metrics25
are presented in Section III. An integrated modeling framework is developed in Section IV for the modeling26
and assessment of business continuity. The developed methods are applied in Section V to assess the business27
continuity of an oil storage tank farm. Finally, the paper is concluded in Section VI with a discussion on28
potential future works.29
II. A CONCEPTUAL MODEL FOR BUSINESS CONTINUITY PROCESS30
In this section, we present a conceptual model that describes the business continuity process and identifies31
its major contributing factors. Business continuity is defined as the capability of an organization to continue32
delivery of products or services at acceptable levels following disruptive events [14]. It measures the capability33
of an organization to remain at or quickly recover to operational states after being affected by disruptive events.34
Usually, the business process of an organization can be characterized by a performance indicator, denoted by35
PPIB , whose value reflects the degree to which the objective of the organization is satisfied. For example, for36
an oil refinery, the PPIB is its daily production yield; for a manufacturing factory, the PPIB is the products37
produced per day. The values of PPIB are determined by the operation state of the organization: the PPIB38
December 31, 2016 DRAFT
3
remains at its nominal value when the system is under normal operation and drops to a degraded value when1
the normal operation of the system is disrupted. In practice, an organization is susceptible to various disruptive2
events, which might jeopardize its business continuity. Commonly encountered disruptive events include3
• technological disruptions, caused by component or system failures;4
• natural disruptions, caused by natural disasters, e.g., floods, earthquakes, lightening, etc.;5
• social disruptions, caused by social movements, e.g., terrorist attacks, strikes, supply chain disruptions,6
etc.7
When one or some of these disruptive events occur, the normal operation is disrupted and PPIB drops to a8
degraded value, as a consequence of the disruptive events. The organization and its stakeholders, then, suffer9
from losses caused by the business interruption. To reduce such losses, various business continuity measures10
can be taken to guarantee the continuity of the business process. Generally speaking, those measures can be11
divided into four categories, i.e.,12
• protection measures, for defending the system from the disruptive events and preventing them from13
damaging the system. If protection measures succeed, the business process is not interrupted;14
• mitigation measures, which are automatically activated when the protection measures fail and initial damage15
has been caused by the disruptive events. The aim of the mitigation measures is to contain the evolution16
of the disruptive events at the early stages of development, so that damages can be mitigated;17
• emergency measures, which happen when the mitigation measures fail to contain the damage, and often18
require significant human intervention;19
• recovery measures, which aim at re-establishing normal operation.20
For example, lightning is a severe threat to oil & gas systems [31]. Often, a lightening protection mast is installed21
at oil and gas tank farms as a protection measure against the threat of lightning [32]. If the protection mast fails22
to protect the system, the oil storage tank might catch fire [33]. Mitigation measures, such as the automatic fire23
extinguishing system, are automatically activated to fight the fire in order to prevent it from spreading to other24
tanks, causing a domino effect [33]. Emergency measures, e.g., the intervention of a fire brigade, are needed25
when the mitigation measures fail to stop the propagation of the accident [34]. Then, recovery measures, e.g.,26
the repair and restoration of the affected tanks, are carried out to recover operation and minimize the losses27
caused by the business interruption.28
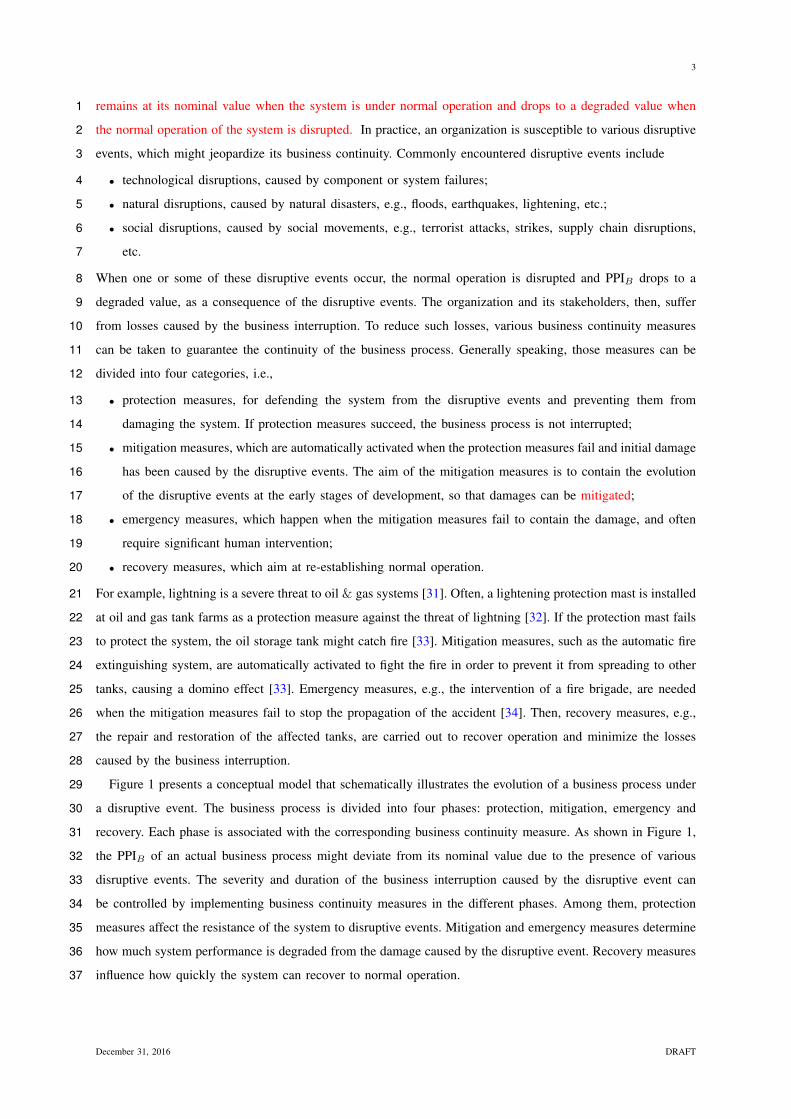
Figure 1 presents a conceptual model that schematically illustrates the evolution of a business process under29
a disruptive event. The business process is divided into four phases: protection, mitigation, emergency and30
recovery. Each phase is associated with the corresponding business continuity measure. As shown in Figure 1,31
the PPIB of an actual business process might deviate from its nominal value due to the presence of various32
disruptive events. The severity and duration of the business interruption caused by the disruptive event can33
be controlled by implementing business continuity measures in the different phases. Among them, protection34
measures affect the resistance of the system to disruptive events. Mitigation and emergency measures determine35
how much system performance is degraded from the damage caused by the disruptive event. Recovery measures36
influence how quickly the system can recover to normal operation.37
December 31, 2016 DRAFT
4
Fig. 1. A conceptual model for the business continuity process
III. LOSS-BASED BUSINESS CONTINUITY METRICS1
In this section, we define a set of quantitative business continuity metrics to cover the whole business2
continuity process. Evidently, business (performance) continuity is inversely related to the losses caused by3
the disruptive event, i.e., a higher value of business continuity indicates less losses caused by the business4
interruption. Therefore, we define the business continuity metrics as a function of the losses due to the disruptive5
event.6
Two kinds of losses are considered in this paper, i.e., direct losses and indirect losses. Direct losses, denoted7
by LD, are those caused directly by the disruptive event. For example, when a lightning strike hits an oil8
storage tank, LD might include the structural damage of the tank, the loss of the oil contained in the tank9
due to leakages in the damaged structure, and other possible losses that occur right after the lightning strikes.10
Indirect losses, denoted by LI , are those incurred during the recovery process. In the previous example of the11
storage tank, the tank needs to be shutdown or at least operated at degraded performances during the recovery12
process, which causes revenue losses to the organization. Besides, LI also includes the costs of replacing or13
restoring the affected tank, e.g., the costs of spare parts, maintenance personnel, etc.14
Let Li denote the losses caused by the ith disruptive event. The loss Li includes direct loss and indirect loss.15
Therefore, we have16
Li = LD,i + LI,i, (1)
where LD,i and LI,i are the direct loss and indirect loss caused by the ith disruptive event, respectively. The17
indirect loss, LI,i, measures the lost profits due to the degraded performance and the potential system downtime18
in the recovery process. To further quantify LI,i, it is assumed that19
LI,i = k · trecv,i · (PPIB,N − PPIB,i), (2)
December 31, 2016 DRAFT
5
where k is the indirect loss caused by the disruptive event per unit time per unit PPIB ; trecv,i is the time that is1
taken to recover the business process to its nominal performance; PPIB,N is the nominal PPIB for the business2
process and PPIB,i is the performance indicator of the business process after the damage of the ith disruptive3
event.4
We are interested in the business continuity over a time interval [0, T ] (e.g., the life of the system). Suppose5
that the number of disruptive events that occur in [0, T ] is n(T ). From (1), the loss due to the disruptive events6
that occur in [0, T ], denoted by LT , is7
LT =
n(T )∑i=1
(LD,i + LI,i) , (3)
where LD,i and LI,i are the direct loss and indirect loss of the ith disruptive event, respectively, and LI,i8
is calculated using (2). It should be noted that due to various uncertainties, the n(T ), LD,i and LI,i are9
random variables; therefore, LT is also a random variable. Based on (3), we can define quantitative metrics for10
business continuity.11
Definition 1. We define the Business Continuity Value (BCV) as12
BCV = 1− LT
Ltol(4)
where Ltol is the maximum loss that an organization can withstand.13
It is easy to verify that that BCV ∈ (−∞, 1] and a high value of BCV indicates high business continuity. The14
physical meaning of (4) is the relative difference between the losses caused by the disruptive events and the15
maximum losses that an organization could stand. Since Ltol represents the maximum tolerable losses for an16
organization, BCV = 0 is a borderline case: a BCV whose value less than zero indicates that the organization17
might have trouble in recovering after the occurrence of the disruptive events.18
The relationship between BCV and PPIB is that, the BCV is defined based on the expected losses LT , which19
includes both direct losses and indirect losses, as shown in (3). The indirect losses LI,i are, then, determined20
by the value of PPIB , according to (2). The physical meaning of (2) is to measure the revenue losses due to21
the potential partial operation period of the system (i.e., operating at a reduced capacity) after the strike of the22
disruptive events.23
The BCV defined in (4) is conceptually similar to a widely applied resilience metric, the resilience triangle:24
if we let k = 1 and trecv,i = 1 in (2), the LT in (4) is, then, equivalent to the resilience triangle metric defined25
in [35]. Although seems similar, the BCV differs from resilience since the concept of resilience mainly focuses26
on the performance degradation and recovery process, but does not relate the process to the losses suffered by27
the organization. The BCV, on the other hand, explicitly considers the losses and therefore, allows to evaluate28
the possibility of recovery from financial perspectives.29
Since BCV is a random variable, for practical applicability, four numerical metrics, i.e., Expected Business30
Continuity Value (EBCV), Standard Deviation of Business Continuity Value (SDBCV), PBI and PBF , are31
derived based on the probability distribution of BCV. EBCV is calculated as the expected value of BCV.32
SDBCV is calculated as the standard deviation of BCV, to measure the variability in the BCV values.33
December 31, 2016 DRAFT
6
The probability that disruptive events causes business interruption in the considered time interval, denoted1
by PBI , is the third numerical metrics defined in this paper:2
PBI = Pr (BCV < 1) . (5)
It measures the likelihood of business interruption caused by the disruptive events.3
When the losses caused by the disruptive events are beyond tolerable, the organization might have trouble4
recovering: this situation is called Business Failure (BF), in this paper. The probability of business failure,5
denoted by PBF , is calculated by6
PBF = Pr (BCV < 0) . (6)
The value of PBF measures the capability that an organization cannot recover from potential disruptive events.7
It should be noted that the four numerical metrics can be explained in financial terms using monetary values8
(e.g., in U.S. dollars). For example, suppose that the organization objective of the analysis can withstand financial9
losses up to $100, 000 (i.e., LT = $100, 000) and EBCV = 0.8,SDBCV = 0.01, PBI = 0.8, PBF = 0.1:10
• EBCV = 0.8 indicates that the organization can accept to suffer on average a financial loss of 100, 000×11
(1− 0.8) = $20, 000;12
• SDBCV measures the variations in the acceptable expected losses: a larger SDBCV indicates that the13
expected losses are subject to large variations and vice versa;14
• PBI = 0.8 indicates that with probability 0.8, the organization could suffer financial losses;15
• PBF = 0.1 indicates that with probability 0.1, the organization could suffer financial losses larger than16
$100, 000.17
IV. AN INTEGRATED MODELING FRAMEWORK FOR BUSINESS CONTINUITY ASSESSMENT18
In this section, we first present an integrated modeling framework for business continuity (Section IV-A).19
Then, a simulation-based method is developed to calculate the defined business continuity metrics (Section20
IV-B).21
A. The integrated modeling framework22
To model the business process, we make the following assumptions to capture its characteristics:23
1) The occurrence of disruptive events follows a homogeneous Poisson process with a rate parameter λDE .24
2) The consequences of the disruptive event are classified into n discrete states with increasing degree of25
severity, denoted by CDE,0, CDE,1, · · · , CDE,n, where CDE,0 represents the consequence state that no26
damage is caused by the disruptive event.27
3) The times it takes to recover the business process from state CDE,i to CDE,i−1, denoted by trecv,i, i =28
1, 2, · · · , n are independent and identically distributed random variables, with probability density func-29
tions frecv,i(t).30
4) The reliability of the business continuity measures does not change with time.31
As shown in Figure 1, the business process comprises of the protection, mitigation, emergency and recovery32
phases. Since each phase has its own characteristics, different modelling approaches are needed for different33
December 31, 2016 DRAFT
7
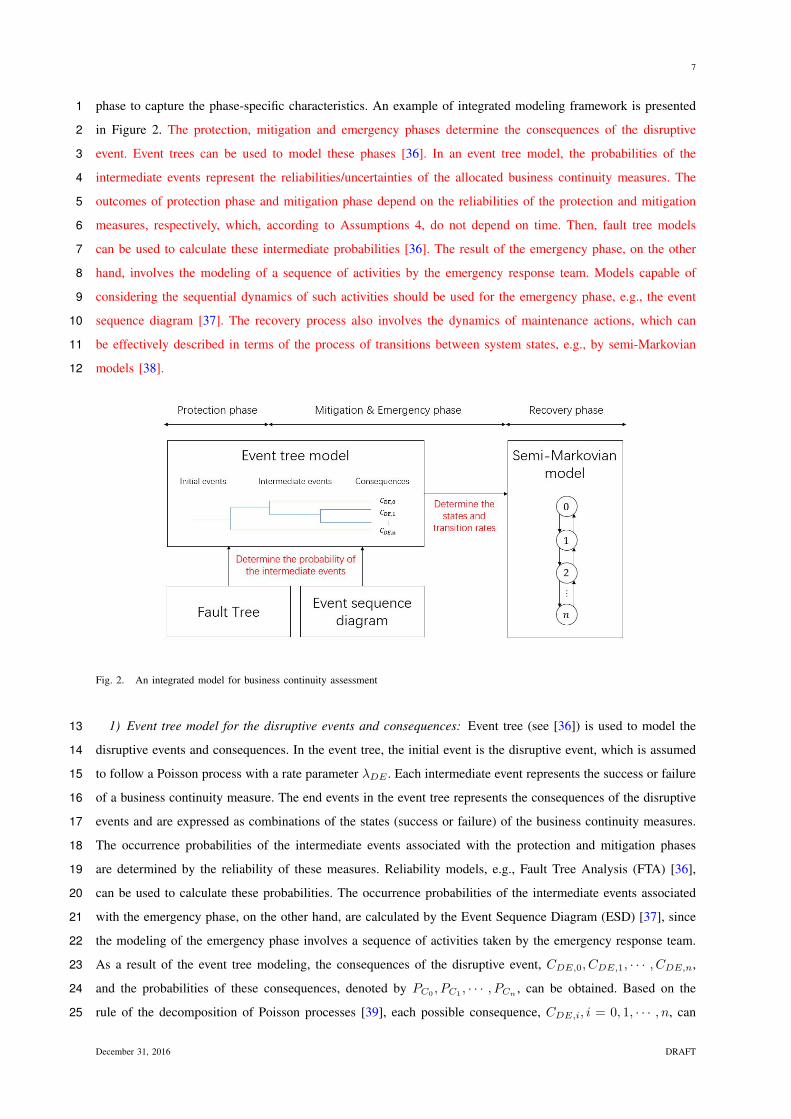
phase to capture the phase-specific characteristics. An example of integrated modeling framework is presented1
in Figure 2. The protection, mitigation and emergency phases determine the consequences of the disruptive2
event. Event trees can be used to model these phases [36]. In an event tree model, the probabilities of the3
intermediate events represent the reliabilities/uncertainties of the allocated business continuity measures. The4
outcomes of protection phase and mitigation phase depend on the reliabilities of the protection and mitigation5
measures, respectively, which, according to Assumptions 4, do not depend on time. Then, fault tree models6
can be used to calculate these intermediate probabilities [36]. The result of the emergency phase, on the other7
hand, involves the modeling of a sequence of activities by the emergency response team. Models capable of8
considering the sequential dynamics of such activities should be used for the emergency phase, e.g., the event9
sequence diagram [37]. The recovery process also involves the dynamics of maintenance actions, which can10
be effectively described in terms of the process of transitions between system states, e.g., by semi-Markovian11
models [38].12
Fig. 2. An integrated model for business continuity assessment
1) Event tree model for the disruptive events and consequences: Event tree (see [36]) is used to model the13
disruptive events and consequences. In the event tree, the initial event is the disruptive event, which is assumed14
to follow a Poisson process with a rate parameter λDE . Each intermediate event represents the success or failure15
of a business continuity measure. The end events in the event tree represents the consequences of the disruptive16
events and are expressed as combinations of the states (success or failure) of the business continuity measures.17
The occurrence probabilities of the intermediate events associated with the protection and mitigation phases18
are determined by the reliability of these measures. Reliability models, e.g., Fault Tree Analysis (FTA) [36],19
can be used to calculate these probabilities. The occurrence probabilities of the intermediate events associated20
with the emergency phase, on the other hand, are calculated by the Event Sequence Diagram (ESD) [37], since21
the modeling of the emergency phase involves a sequence of activities taken by the emergency response team.22
As a result of the event tree modeling, the consequences of the disruptive event, CDE,0, CDE,1, · · · , CDE,n,23
and the probabilities of these consequences, denoted by PC0, PC1
, · · · , PCn, can be obtained. Based on the24
rule of the decomposition of Poisson processes [39], each possible consequence, CDE,i, i = 0, 1, · · · , n, can25
December 31, 2016 DRAFT
8
be characterized by a Poisson process with the rate λDE · PCi.1
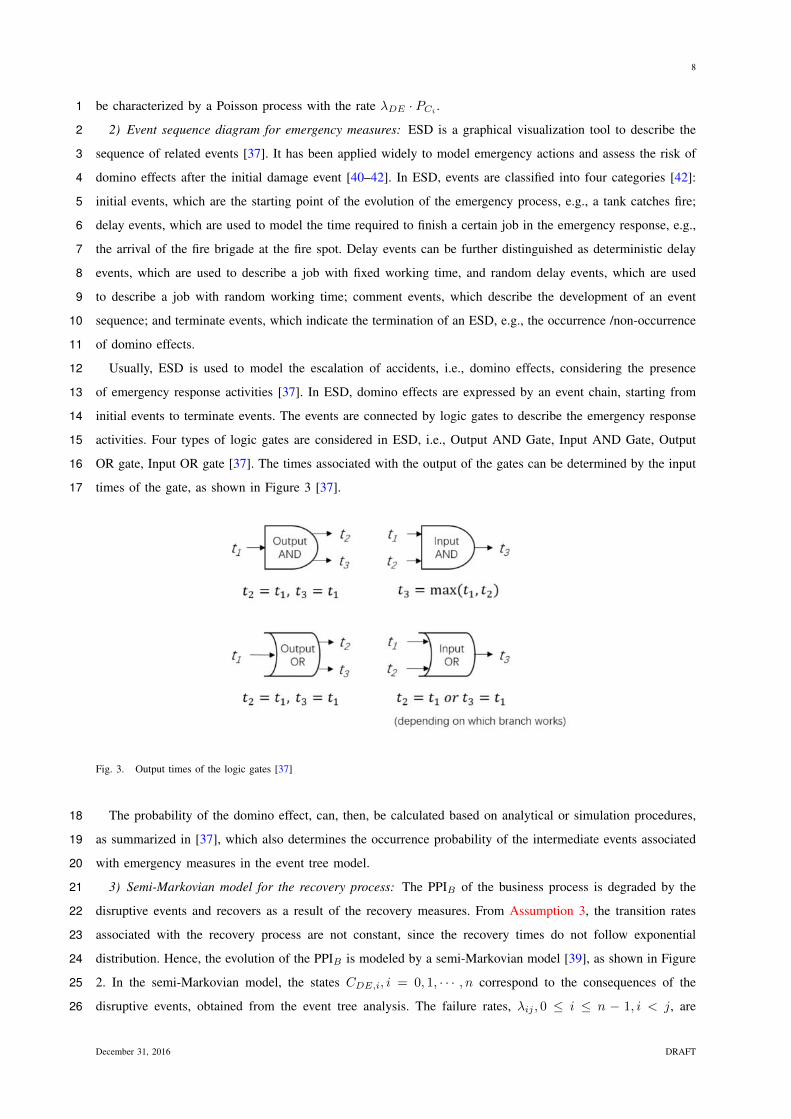
2) Event sequence diagram for emergency measures: ESD is a graphical visualization tool to describe the2
sequence of related events [37]. It has been applied widely to model emergency actions and assess the risk of3
domino effects after the initial damage event [40–42]. In ESD, events are classified into four categories [42]:4
initial events, which are the starting point of the evolution of the emergency process, e.g., a tank catches fire;5
delay events, which are used to model the time required to finish a certain job in the emergency response, e.g.,6
the arrival of the fire brigade at the fire spot. Delay events can be further distinguished as deterministic delay7
events, which are used to describe a job with fixed working time, and random delay events, which are used8
to describe a job with random working time; comment events, which describe the development of an event9
sequence; and terminate events, which indicate the termination of an ESD, e.g., the occurrence /non-occurrence10
of domino effects.11
Usually, ESD is used to model the escalation of accidents, i.e., domino effects, considering the presence12
of emergency response activities [37]. In ESD, domino effects are expressed by an event chain, starting from13
initial events to terminate events. The events are connected by logic gates to describe the emergency response14
activities. Four types of logic gates are considered in ESD, i.e., Output AND Gate, Input AND Gate, Output15
OR gate, Input OR gate [37]. The times associated with the output of the gates can be determined by the input16
times of the gate, as shown in Figure 3 [37].17
Fig. 3. Output times of the logic gates [37]
The probability of the domino effect, can, then, be calculated based on analytical or simulation procedures,18
as summarized in [37], which also determines the occurrence probability of the intermediate events associated19
with emergency measures in the event tree model.20
3) Semi-Markovian model for the recovery process: The PPIB of the business process is degraded by the21
disruptive events and recovers as a result of the recovery measures. From Assumption 3, the transition rates22
associated with the recovery process are not constant, since the recovery times do not follow exponential23
distribution. Hence, the evolution of the PPIB is modeled by a semi-Markovian model [39], as shown in Figure24
2. In the semi-Markovian model, the states CDE,i, i = 0, 1, · · · , n correspond to the consequences of the25
disruptive events, obtained from the event tree analysis. The failure rates, λij , 0 ≤ i ≤ n − 1, i < j, are26
December 31, 2016 DRAFT
9
determined based on the conditional probabilities of the consequences given the occurrence of the initial event1
of the event tree, which can also be yielded by the event tree analysis. According to Assumption 3, the recovery2
process is characterized by the probability density distribution of the recovery times, which should be estimated3
based on historical data or expert judgements.4
Based on the developed models, the evolution of the PPIB in the entire business process, which covers the5
protection, mitigation, emergency and recovery phases, can be simulated using Monte Carlo simulations [43].6
The business continuity metrics can, then, be estimated by further considering the losses incurred in the business7
process, as described in (1) - (3).8
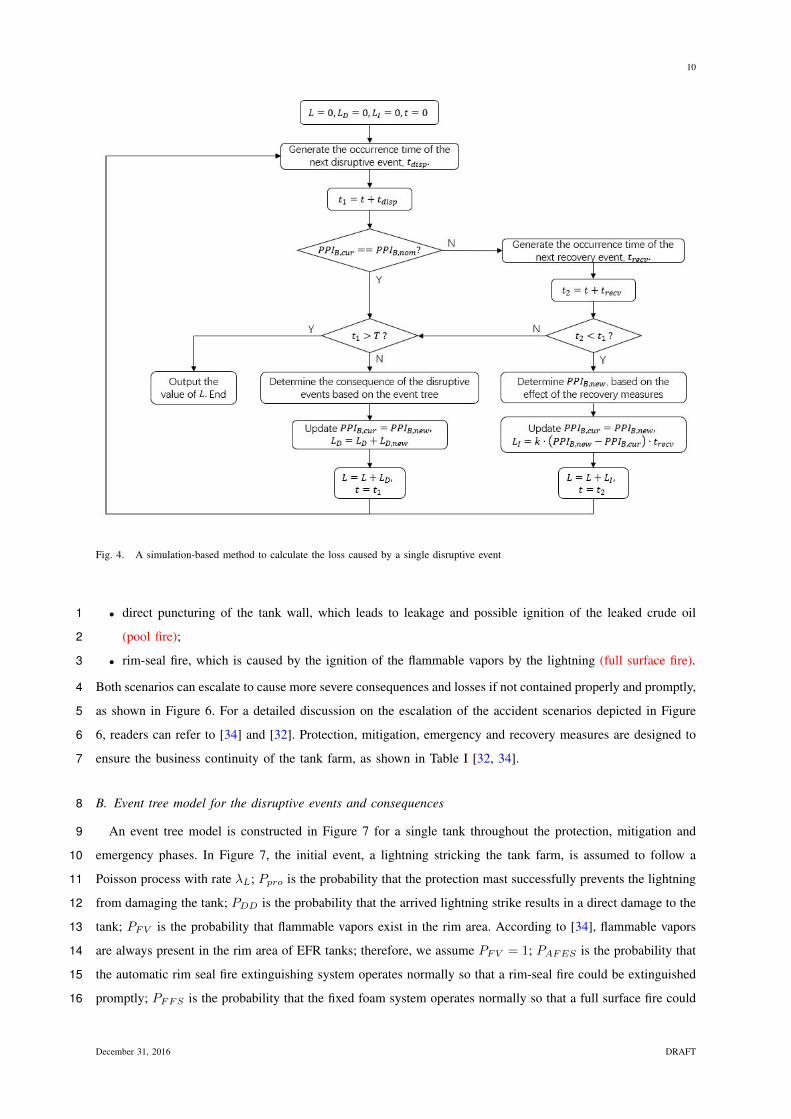
B. A simulation-based method for business continuity assessment9
Figure 4 demonstrates how to calculate the loss L associated with the ith disruptive event by simulating the10
developed integrated model. In Figure 4, PPIB,cur and PPIB,nom represent the PPIB at current time and its11
nominal value, respectively. From Assumption 1, the arrival of the disruptive events follows a homogeneous12
Poisson process with rate parameter λDE . Therefore, tdisp is generated by simulating the next arrival time13
of a Poisson process with the parameter λDE . When a simulated disruptive event arrives, its consequence is14
determined based on the consequence probabilities calculated from event tree analysis. Based on the direct15
damage corresponding to each consequence, the values of PPIB,cur and LD are updated. From Assumption 3,16
the recovery time trecv can be generated from the probability density function frecv,i(t). When a recovery event17
occurs, the PPIB,cur is updated first, based on the effectiveness of the recovery process. Then, the indirect18
loss, LI , is updated by considering the time spent in the previous degraded state.19
The algorithm in Figure 4 is repeated N times and the empirical distribution of the BCV can be estimated20
based on these samples using (4). The numerical business continuity metrics defined in Section III can, then,21
be calculated from the empirical distribution of the BCV.22
V. APPLICATION23
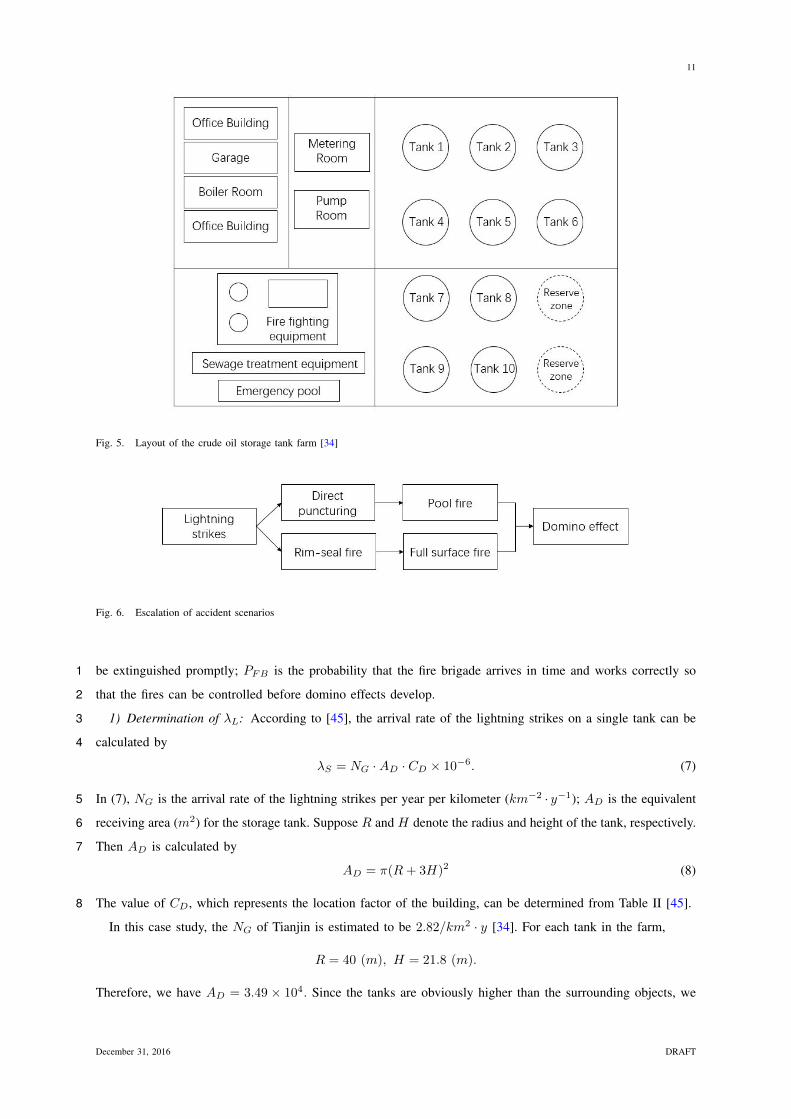
A. System descriptions24
In this section, we consider the crude oil storage tank farm originally reported in [34] as a case study, and25
apply the developed modeling framework to assess its business continuity. The tank farm is located in Tianjin,26
China, and its layout is illustrated in Figure 5 [34]. Ten External Floating Roof (EFR) storage tanks make up27
the tank farm, which is used to store crude oil. Each tank is 21.8 (m) in height and has a diameter of 80 (m).28
The main material of the floating roof and tank wall is #16 steel, whose thicknesses are 5 (mm) and 35 mm,29
respectively. The capacity of a single tank is 1 × 10⁵ (m3) and therefore, the tank farm has a total capacity30
of 1 × 10⁶ (m3) [34]. To remain operational at full capacity, all of the ten tanks must be in working state.31
Therefore, the number of working tanks is used as the PPIB of the tank farm.32
The business continuity assessment starts from the identification of potential disruptive events. According to33
[31, 44], lightning is the most frequently encountered disruptive event that could damage storage tanks. Hence,34
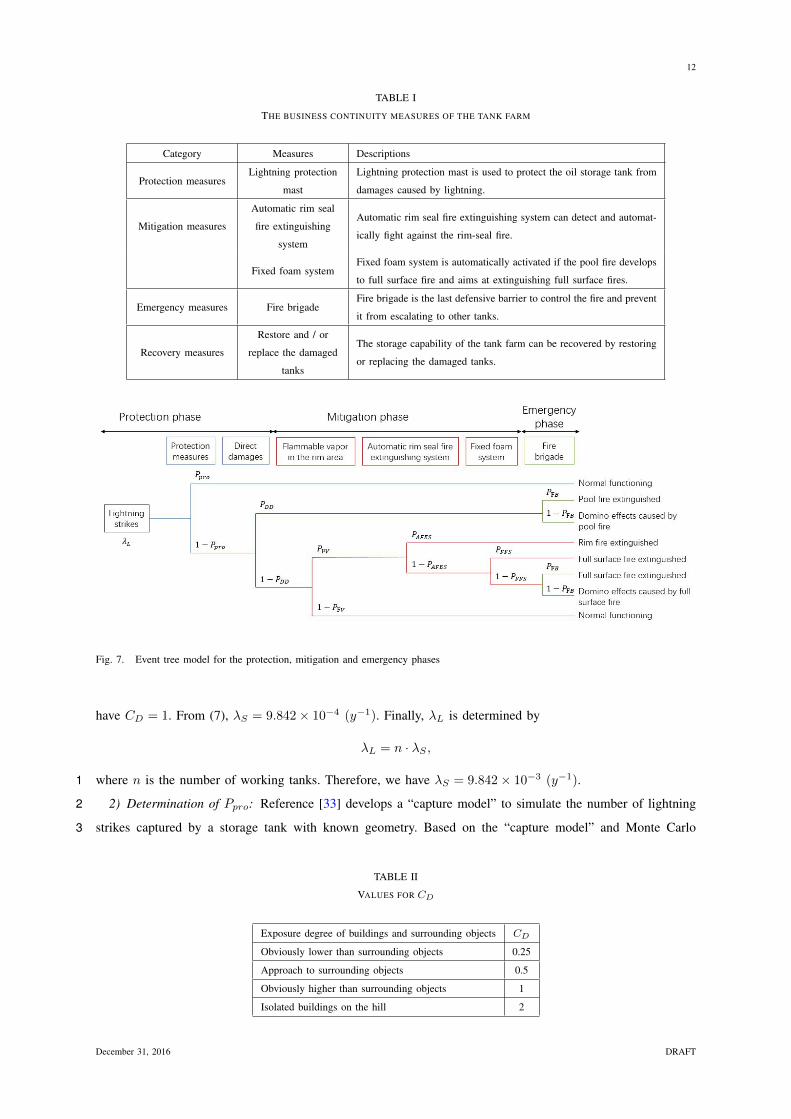
for illustrative purposes, we only consider lightning as the potential disruptive event in this paper. For an EFR35
tank that stores crude oil, two typical accident scenarios might be caused by lightning [34]:36
December 31, 2016 DRAFT
10
Fig. 4. A simulation-based method to calculate the loss caused by a single disruptive event
• direct puncturing of the tank wall, which leads to leakage and possible ignition of the leaked crude oil1
(pool fire);2
• rim-seal fire, which is caused by the ignition of the flammable vapors by the lightning (full surface fire).3
Both scenarios can escalate to cause more severe consequences and losses if not contained properly and promptly,4
as shown in Figure 6. For a detailed discussion on the escalation of the accident scenarios depicted in Figure5
6, readers can refer to [34] and [32]. Protection, mitigation, emergency and recovery measures are designed to6
ensure the business continuity of the tank farm, as shown in Table I [32, 34].7
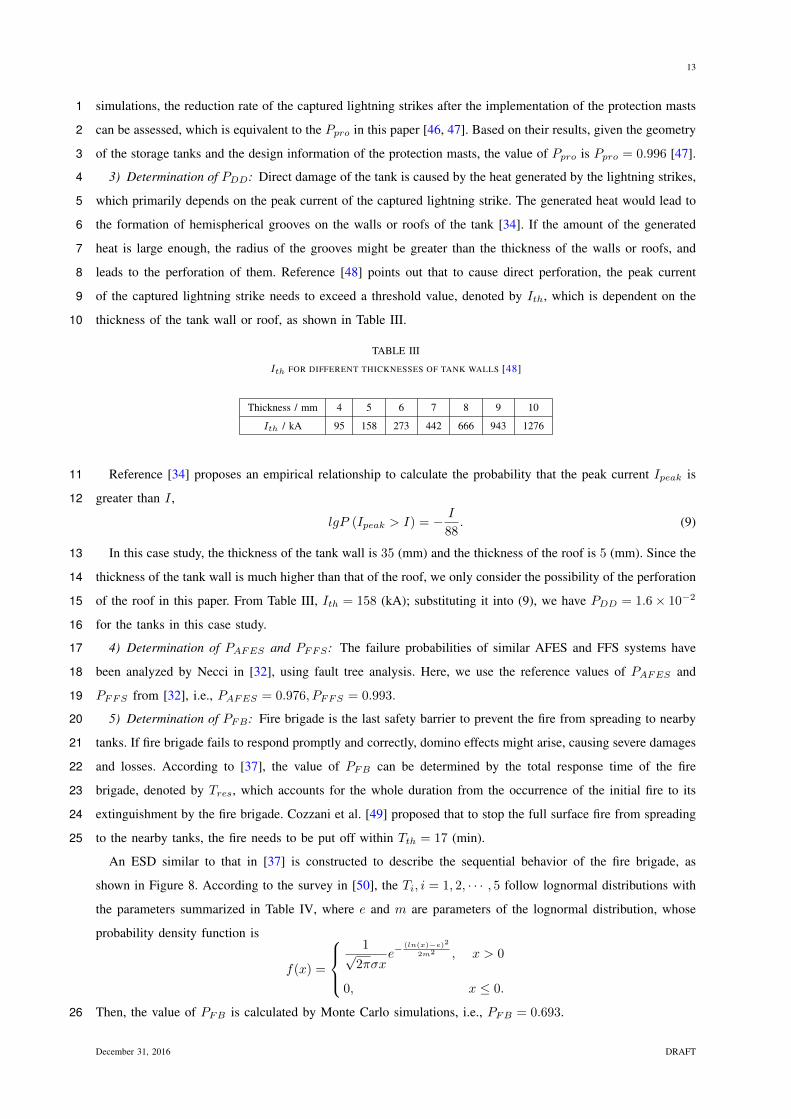
B. Event tree model for the disruptive events and consequences8
An event tree model is constructed in Figure 7 for a single tank throughout the protection, mitigation and9
emergency phases. In Figure 7, the initial event, a lightning stricking the tank farm, is assumed to follow a10
Poisson process with rate λL; Ppro is the probability that the protection mast successfully prevents the lightning11
from damaging the tank; PDD is the probability that the arrived lightning strike results in a direct damage to the12
tank; PFV is the probability that flammable vapors exist in the rim area. According to [34], flammable vapors13
are always present in the rim area of EFR tanks; therefore, we assume PFV = 1; PAFES is the probability that14
the automatic rim seal fire extinguishing system operates normally so that a rim-seal fire could be extinguished15
promptly; PFFS is the probability that the fixed foam system operates normally so that a full surface fire could16
December 31, 2016 DRAFT
11
Fig. 5. Layout of the crude oil storage tank farm [34]
Fig. 6. Escalation of accident scenarios
be extinguished promptly; PFB is the probability that the fire brigade arrives in time and works correctly so1
that the fires can be controlled before domino effects develop.2
1) Determination of λL: According to [45], the arrival rate of the lightning strikes on a single tank can be3
calculated by4
λS = NG ·AD · CD × 10−6. (7)
In (7), NG is the arrival rate of the lightning strikes per year per kilometer (km−2 · y−1); AD is the equivalent5
receiving area (m2) for the storage tank. Suppose R and H denote the radius and height of the tank, respectively.6
Then AD is calculated by7
AD = π(R+ 3H)2 (8)
The value of CD, which represents the location factor of the building, can be determined from Table II [45].8
In this case study, the NG of Tianjin is estimated to be 2.82/km2 · y [34]. For each tank in the farm,
R = 40 (m), H = 21.8 (m).
Therefore, we have AD = 3.49 × 10⁴. Since the tanks are obviously higher than the surrounding objects, we
December 31, 2016 DRAFT
12
TABLE I
THE BUSINESS CONTINUITY MEASURES OF THE TANK FARM
Category Measures Descriptions
Protection measuresLightning protection
mast
Lightning protection mast is used to protect the oil storage tank from
damages caused by lightning.
Mitigation measures
Automatic rim seal
fire extinguishing
system
Automatic rim seal fire extinguishing system can detect and automat-
ically fight against the rim-seal fire.
Fixed foam systemFixed foam system is automatically activated if the pool fire develops
to full surface fire and aims at extinguishing full surface fires.
Emergency measures Fire brigadeFire brigade is the last defensive barrier to control the fire and prevent
it from escalating to other tanks.
Recovery measures
Restore and / or
replace the damaged
tanks
The storage capability of the tank farm can be recovered by restoring
or replacing the damaged tanks.
Fig. 7. Event tree model for the protection, mitigation and emergency phases
have CD = 1. From (7), λS = 9.842× 10⁻⁴ (y−1). Finally, λL is determined by
λL = n · λS ,
where n is the number of working tanks. Therefore, we have λS = 9.842× 10⁻³ (y−1).1
2) Determination of Ppro: Reference [33] develops a “capture model” to simulate the number of lightning2
strikes captured by a storage tank with known geometry. Based on the “capture model” and Monte Carlo3
TABLE II
VALUES FOR CD
Exposure degree of buildings and surrounding objects CD
Obviously lower than surrounding objects 0.25
Approach to surrounding objects 0.5
Obviously higher than surrounding objects 1
Isolated buildings on the hill 2
December 31, 2016 DRAFT
13
simulations, the reduction rate of the captured lightning strikes after the implementation of the protection masts1
can be assessed, which is equivalent to the Ppro in this paper [46, 47]. Based on their results, given the geometry2
of the storage tanks and the design information of the protection masts, the value of Ppro is Ppro = 0.996 [47].3
3) Determination of PDD: Direct damage of the tank is caused by the heat generated by the lightning strikes,4
which primarily depends on the peak current of the captured lightning strike. The generated heat would lead to5
the formation of hemispherical grooves on the walls or roofs of the tank [34]. If the amount of the generated6
heat is large enough, the radius of the grooves might be greater than the thickness of the walls or roofs, and7
leads to the perforation of them. Reference [48] points out that to cause direct perforation, the peak current8
of the captured lightning strike needs to exceed a threshold value, denoted by Ith, which is dependent on the9
thickness of the tank wall or roof, as shown in Table III.10
TABLE III
Ith FOR DIFFERENT THICKNESSES OF TANK WALLS [48]
Thickness / mm 4 5 6 7 8 9 10
Ith / kA 95 158 273 442 666 943 1276
Reference [34] proposes an empirical relationship to calculate the probability that the peak current Ipeak is11
greater than I ,12
lgP (Ipeak > I) = − I
88. (9)
In this case study, the thickness of the tank wall is 35 (mm) and the thickness of the roof is 5 (mm). Since the13
thickness of the tank wall is much higher than that of the roof, we only consider the possibility of the perforation14
of the roof in this paper. From Table III, Ith = 158 (kA); substituting it into (9), we have PDD = 1.6× 10−215
for the tanks in this case study.16
4) Determination of PAFES and PFFS: The failure probabilities of similar AFES and FFS systems have17
been analyzed by Necci in [32], using fault tree analysis. Here, we use the reference values of PAFES and18
PFFS from [32], i.e., PAFES = 0.976, PFFS = 0.993.19
5) Determination of PFB: Fire brigade is the last safety barrier to prevent the fire from spreading to nearby20
tanks. If fire brigade fails to respond promptly and correctly, domino effects might arise, causing severe damages21
and losses. According to [37], the value of PFB can be determined by the total response time of the fire22
brigade, denoted by Tres, which accounts for the whole duration from the occurrence of the initial fire to its23
extinguishment by the fire brigade. Cozzani et al. [49] proposed that to stop the full surface fire from spreading24
to the nearby tanks, the fire needs to be put off within Tth = 17 (min).25
An ESD similar to that in [37] is constructed to describe the sequential behavior of the fire brigade, as
shown in Figure 8. According to the survey in [50], the Ti, i = 1, 2, · · · , 5 follow lognormal distributions with
the parameters summarized in Table IV, where e and m are parameters of the lognormal distribution, whose
probability density function is
f(x) =
1√2πσx
e−(ln(x)−e)2
2m2 , x > 0
0, x ≤ 0.
Then, the value of PFB is calculated by Monte Carlo simulations, i.e., PFB = 0.693.26
December 31, 2016 DRAFT
14
Fig. 8. Event sequence diagram of the emergency responses
TABLE IV
THE DISTRIBUTION OF THE EVENTS IN THE EVENT SEQUENCE DIAGRAM [50]
Event e m
T1 1.30 0.40
T2 0.88 0.78
T3 1.56 0.31
T4 / T5 1.20 0.34
6) Calculate the probability of the consequences: Following the rules of event tree analysis [36], the1
conditional probability of each consequence given the occurrence of the initial event can be calculated, as2
shown in Table V.3
C. Semi-Markovian model for the recovery process4
The consequences C1, C2, · · · , C6, listed in Table V, can be further grouped into three categories, based on5
the number of affected storage tanks, as shown in Table VI. When the consequence of the lightning strike is6
C6, there is no storage tank affected by the lightning. When the consequence of the lightning strike is C1, C37
or C4, there are local damages to the hit tank, without spreading to domino effects: therefore, only one tank8
December 31, 2016 DRAFT
15
TABLE V
THE PROBABILITIES OF THE CONSEQUENCES
Symbols Consequence Descriptions Pi = P (Ci|a lightning strike has occurred)
C1 Pool fire extinguished
A pool fire has occurred and
extinguished; Local damage is caused to
the tank hit by the lightning.
P1 = (1− Ppro)PDDPFB
C2
Domino effect caused
by pool fire
Fire spread to the neighboring tanks;
Damages are caused to the tank where
the fire started and the four neighboring
tanks.
P2 = (1− Ppro)PDD(1− PFB)
C3
Rim seal fire
extinguished
A rim seal fire has occurred and
extinguished; Local damage is caused to
the tank where the incident occurs.
P3 = (1− Ppro)(1− PDD)PFV PAFES
C4
Full surface fire
extinguished
A full surface fire has occurred and
extinguished; Local damage is caused to
the tank where the incident occurs.
P4 = (1 − Ppro)(1 − PDD)PFV (1 −PAFES)(PFFS + (1− PFFSPFB))
C5
Domino effect caused
by full surface fire
Fire spread to the neighboring tanks;
Damages are caused to the tank where
the fire started and the four neighboring
tanks.
P5 = (1− Ppro)(1− PDD)PFV (1− PAFES)(1−PFFS(1− PFB))
C6 Normal functioning No damages are caused to any tank. P6 = Ppro + (1− Ppro)(1− PDD)(1− PFV )
is affected. When the consequence of the lightning strike is C2 or C5, the fire caused by the lightning spreads1
to the nearby tanks and domino effects are caused. In this paper, we assume that if domino effects occur, the2
number of affected tanks is 5.3
TABLE VI
CLASSIFICATION OF THE CONSEQUENCES
Category Consequences Descriptions Affected tanks
S1 C6 Normal functioning 0
S2 C1, C3, C4 Pool fire extinguished; rim seal fire extinguished; full surface fire extinguished 1
S3 C2, C5 Domino effects caused by pool fire; domino effects caused by full surface fire 5
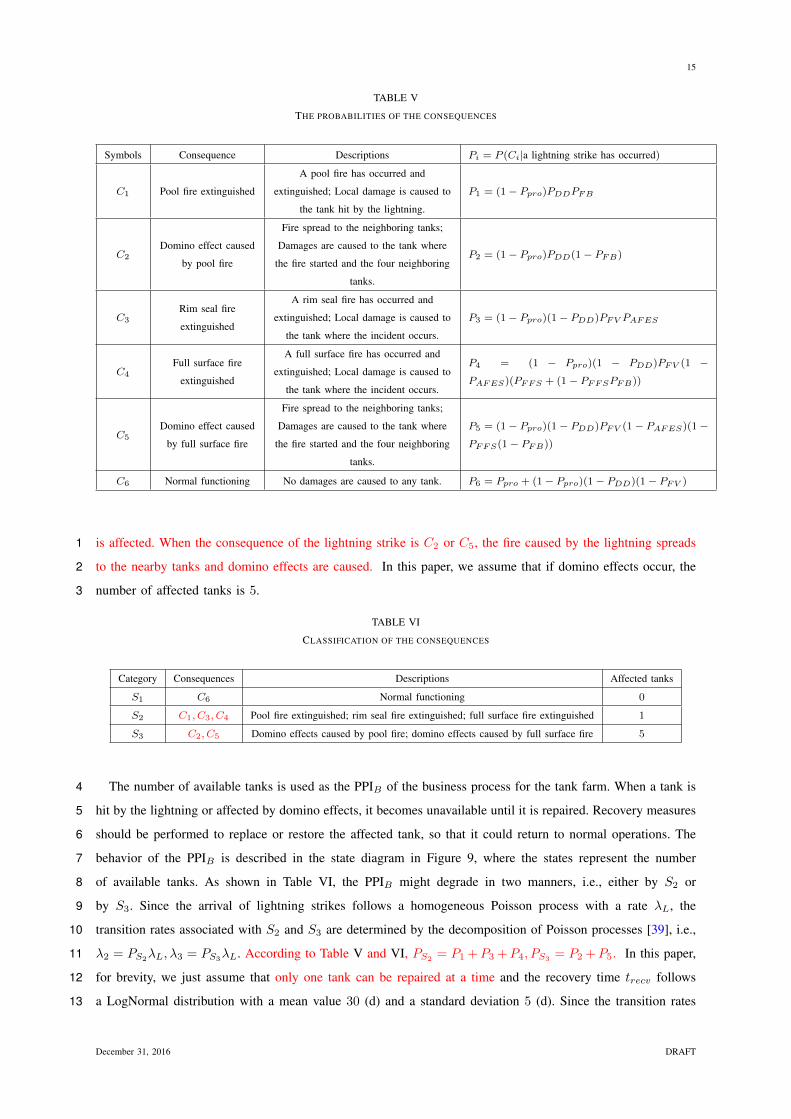
The number of available tanks is used as the PPIB of the business process for the tank farm. When a tank is4
hit by the lightning or affected by domino effects, it becomes unavailable until it is repaired. Recovery measures5
should be performed to replace or restore the affected tank, so that it could return to normal operations. The6
behavior of the PPIB is described in the state diagram in Figure 9, where the states represent the number7
of available tanks. As shown in Table VI, the PPIB might degrade in two manners, i.e., either by S2 or8
by S3. Since the arrival of lightning strikes follows a homogeneous Poisson process with a rate λL, the9
transition rates associated with S2 and S3 are determined by the decomposition of Poisson processes [39], i.e.,10
λ2 = PS2λL, λ3 = PS3
λL. According to Table V and VI, PS2= P1 +P3 +P4, PS3
= P2 +P5. In this paper,11
for brevity, we just assume that only one tank can be repaired at a time and the recovery time trecv follows12
a LogNormal distribution with a mean value 30 (d) and a standard deviation 5 (d). Since the transition rates13
December 31, 2016 DRAFT
16
Fig. 9. Behavior of the PPIB under the threat of lightning
of the recovery process are not constant while the transition rates of the degradation process are, the dynamics1
of the PPIB , as described in Figure 9, follow a Semi-Markovian process. Simulation-based methods, such as2
those in [38], can be exploited to investigate the time-dependent behavior of the PPIB .3
D. Loss modeling and business continuity assessment4
The losses an organization might suffer from the disruptive events include the direct losses and the indirect5
losses. In this case study, the direct losses depend on the number of affected tanks, denoted by n:6
LD,i = n · kLD, (10)
where kLDis the average direct damage per tank caused by lightning and domino effect. In this case study,7
for illustrative purposes, we assume that kLD= 6 (in arbitrary units) per tank.8
The indirect losses are calculated using (2), where the number of available tanks is used as the PPIB of the9
tank farm and the nominal PPIB is 10. The indirect constant k is assumed to be 0.25 units per day per tank.10
That is, if n tanks are unavailable for N days, the organization would suffer 0.25 × (10 − n) × N units of11
indirect losses. The value of Ltol, which represents the maximum loss that an organization could withstand,12
should be determined considering the financial conditions of the organization. For the tank farm, we assume13
Ltol = 15 units for illustrative purposes. The simulation-based methods that are developed in Section IV-B14
are used to calculate the quantitative business continuity metrics, with a sample size of 106. The results and15
discussions are given in the next subsection.16
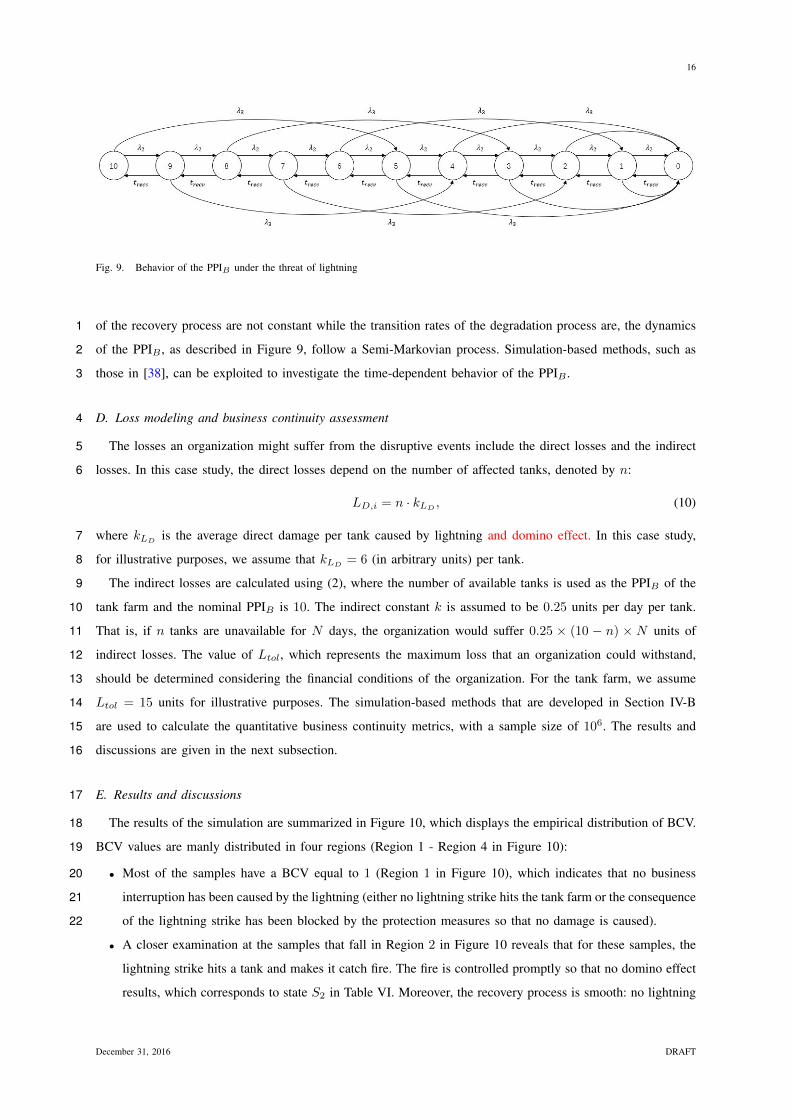
E. Results and discussions17
The results of the simulation are summarized in Figure 10, which displays the empirical distribution of BCV.18
BCV values are manly distributed in four regions (Region 1 - Region 4 in Figure 10):19
• Most of the samples have a BCV equal to 1 (Region 1 in Figure 10), which indicates that no business20
interruption has been caused by the lightning (either no lightning strike hits the tank farm or the consequence21
of the lightning strike has been blocked by the protection measures so that no damage is caused).22
• A closer examination at the samples that fall in Region 2 in Figure 10 reveals that for these samples, the
lightning strike hits a tank and makes it catch fire. The fire is controlled promptly so that no domino effect
results, which corresponds to state S2 in Table VI. Moreover, the recovery process is smooth: no lightning
December 31, 2016 DRAFT
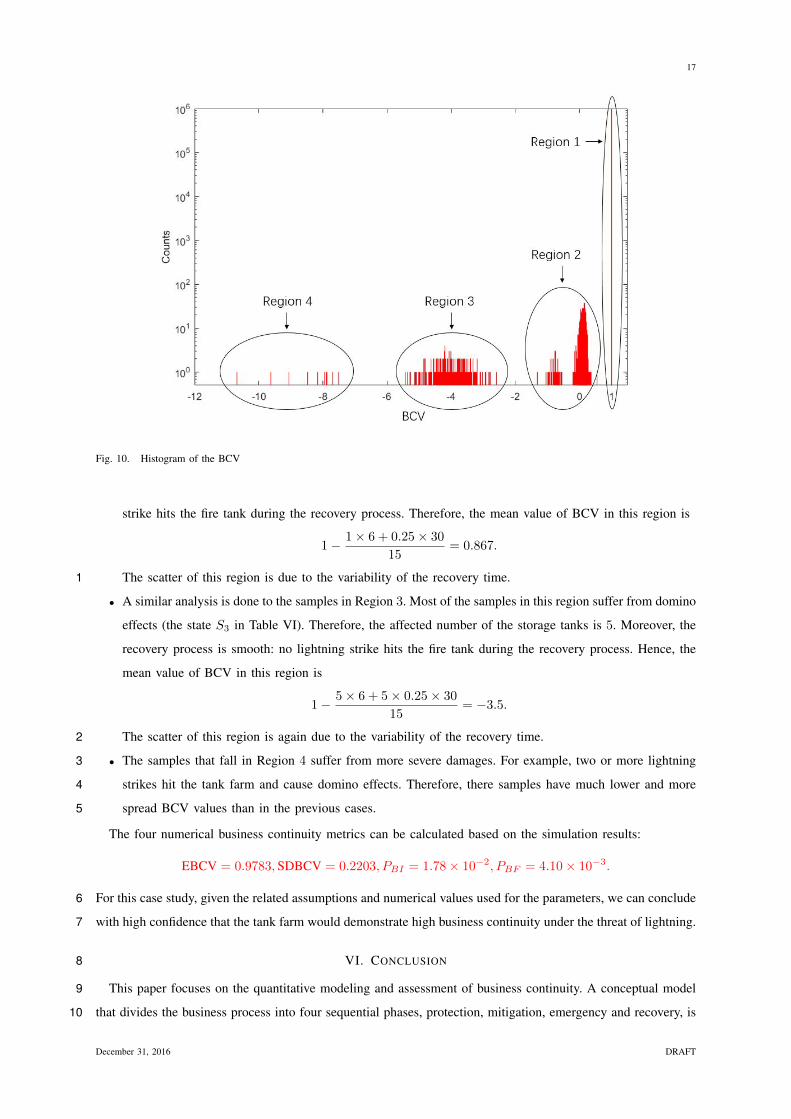
17
Fig. 10. Histogram of the BCV
strike hits the fire tank during the recovery process. Therefore, the mean value of BCV in this region is
1− 1× 6 + 0.25× 30
15= 0.867.
The scatter of this region is due to the variability of the recovery time.1
• A similar analysis is done to the samples in Region 3. Most of the samples in this region suffer from domino
effects (the state S3 in Table VI). Therefore, the affected number of the storage tanks is 5. Moreover, the
recovery process is smooth: no lightning strike hits the fire tank during the recovery process. Hence, the
mean value of BCV in this region is
1− 5× 6 + 5× 0.25× 30
15= −3.5.
The scatter of this region is again due to the variability of the recovery time.2
• The samples that fall in Region 4 suffer from more severe damages. For example, two or more lightning3
strikes hit the tank farm and cause domino effects. Therefore, there samples have much lower and more4
spread BCV values than in the previous cases.5
The four numerical business continuity metrics can be calculated based on the simulation results:
EBCV = 0.9783,SDBCV = 0.2203, PBI = 1.78× 10⁻², PBF = 4.10× 10⁻³.
For this case study, given the related assumptions and numerical values used for the parameters, we can conclude6
with high confidence that the tank farm would demonstrate high business continuity under the threat of lightning.7
VI. CONCLUSION8
This paper focuses on the quantitative modeling and assessment of business continuity. A conceptual model9
that divides the business process into four sequential phases, protection, mitigation, emergency and recovery, is10
December 31, 2016 DRAFT
18
proposed as a foundation of the metrics and models for business continuity assessment. An integrated framework1
is developed to model business continuity. In the integrated model, the protection, mitigation and emergency2
phases are modeled by event tree models, where fault trees and event sequence diagrams are exploited for the3
characterization of the probabilities associated with the intermediate events. The recovery phase is modeled by4
a semi-Markovian model. A simulation-based method is developed to calculate the business continuity metrics5
based on the developed models. A case study on a crude oil storage tank farm demonstrates the applicability6
of the modeling framework.7
In this paper, we only considered the system subject to a single disruptive event. In the future, the framework8
should be extended to multiple disruptive events. Moreover, we rely on event trees to describe the protection,9
mitigation and emergency phases. Since the event tree is a static model, it cannot capture the time-dependent10
dynamics and the dependencies among the events. In the future, more advanced models, such as Bayesian11
Networks, can be integrated into the framework to more realistically model some aspects of the business12
continuity. A framework can also be developed to identify major contributors to business continuity and13
determine optimal design solutions, so that the required business continuity can be achieved under the constraint14
of time and resources.15
REFERENCES16
[1] E. Zio, “Challenges in the vulnerability and risk analysis of critical infrastructures,” Reliability Engineering17
and System Safety, vol. 152, pp. 137–150, 2016.18
[2] A. Hameed, F. Khan, and S. Ahmed, “A risk-based shutdown inspection and maintenance interval esti-19
mation considering human error,” PROCESS SAFETY AND ENVIRONMENTAL PROTECTION, vol. 100,20
pp. 9–21, MAR 2016.21
[3] Y. Meng, C. Lu, Y. Yan, L. Shi, and J. Liu, “Method to analyze the regional life loss risk by airborne22
chemicals released after devastating earthquakes: A simulation approach,” PROCESS SAFETY AND23
ENVIRONMENTAL PROTECTION, vol. 94, pp. 366–379, MAR 2015.24
[4] G. L. L. Reniers and A. Audenaert, “Preparing for major terrorist attacks against chemical clusters: Intel-25
ligently planning protection measures w.r.t. domino effects,” PROCESS SAFETY AND ENVIRONMENTAL26
PROTECTION, vol. 92, pp. 583–589, NOV 2014.27
[5] T. Aven and L. A. Cox, “National and global risk studies: How can the field of risk analysis contribute?,”28
Risk Analysis, vol. 36, no. 2, pp. 186–190, 2016.29
[6] E. Zio, “Critical infrastructures vulnerability and risk analysis,” European Journal for Security Research,30
pp. 1–18, 2016.31
[7] M. Yang, F. Khan, L. Lye, and P. Amyotte, “Risk assessment of rare events,” PROCESS SAFETY AND32
ENVIRONMENTAL PROTECTION, vol. 98, pp. 102–108, NOV 2015.33
[8] M. Yang, F. Khan, and P. Amyotte, “Operational risk assessment: A case of the Bhopal disaster,” PROCESS34
SAFETY AND ENVIRONMENTAL PROTECTION, vol. 97, pp. 70–79, SEP 2015.35
[9] F. Khan, S. Rathnayaka, and S. Ahmed, “Methods and models in process safety and risk management: Past,36
present and future,” PROCESS SAFETY AND ENVIRONMENTAL PROTECTION, vol. 98, pp. 116–147,37
NOV 2015.38
December 31, 2016 DRAFT
19
[10] T. Bjerga and T. Aven, “Some perspectives on risk management: A security case study from the oil and gas1
industry,” Proceedings of the Institution of Mechanical Engineers, Part O: Journal of Risk and Reliability,2
2016.3
[11] “Costs and scope of unplanned outages.” http://http://www.evolven.com/blog/4
costs-and-scope-of-unplanned-outages.html.5
[12] “Downtime, outages and failures - understanding their true costs.” http://http://www.evolven.com/blog/6
downtime-outages-and-failures-understanding-their-true-costs.html.7
[13] V. Cerullo and M. J. Cerullo, “Business continuity planning: a comprehensive approach,” Information8
Systems Management, vol. 21, no. 3, pp. 70–78, 2004.9
[14] International Organization for Standardization (ISO), “Societal security – business continuity management10
systems,” 2012.11
[15] B. Herbane, “The evolution of business continuity management: A historical review of practices and12
drivers,” Business history, vol. 52, no. 6, pp. 978–1002, 2010.13
[16] G. A. Zsidisin, S. A. Melnyk, and G. L. Ragatz, “An institutional theory perspective of business continuity14
planning for purchasing and supply management,” International journal of production research, vol. 43,15
no. 16, pp. 3401–3420, 2005.16
[17] C. Castillo, “Disaster preparedness and business continuity planning at boeingan integrated model,” Journal17
of Facilities Management, vol. 3, no. 1, pp. 8–26, 2005.18
[18] F. Gibb and S. Buchanan, “A framework for business continuity management,” International Journal of19
Information Management, vol. 26, no. 2, pp. 128–141, 2006.20
[19] S. Snedaker, Business continuity and disaster recovery planning for IT professionals. Newnes, 2013.21
[20] K. Randeree, A. Mahal, and A. Narwani, “A business continuity management maturity model for the uae22
banking sector,” Business Process Management Journal, vol. 18, no. 3, pp. 472–492, 2012.23
[21] D. Faertes, “Reliability of supply chains and business continuity management,” Procedia Computer Science,24
vol. 55, pp. 1400–1409, 2015.25
[22] N. Sahebjamnia, S. A. Torabi, and S. A. Mansouri, “Integrated business continuity and disaster recovery26
planning: Towards organizational resilience,” European Journal of Operational Research, vol. 242, no. 1,27
pp. 261–273, 2015.28
[23] G. Parise, E. Hesla, L. Parise, and R. Pennacchia, “Switching procedures and business continuity29
management: The flock logic of multiple source systems,” IEEE TRANSACTIONS ON INDUSTRY30
APPLICATIONS, vol. 52, no. 1, pp. 60–66, 2016.31
[24] S. A. Torabi, R. Giahi, and N. Sahebjamnia, “An enhanced risk assessment framework for business32
continuity management systems,” Safety Science, vol. 89, pp. 201–218, 2016.33
[25] M. Rabbani, H. R. Soufi, and S. A. Torabi, “Developing a two-step fuzzy costbenefit analysis for strategies34
to continuity management and disaster recovery,” Safety Science, vol. 85, pp. 9–22, 2016.35
[26] W. Boehmer, C. Brandt, and J. F. Groote, “Evaluation of a business continuity plan using process algebra36
and modal logic,” in Science and Technology for Humanity (TIC-STH), 2009 IEEE Toronto International37
Conference, Science and Technology for Humanity (TIC-STH), 2009 IEEE Toronto International Confer-38
ence, pp. 147–152, IEEE, 2009.39
December 31, 2016 DRAFT
20
[27] C. Brandt, F. Hermann, and T. Engel, “Modeling and reconfiguration of critical business processes for1
the purpose of a business continuity management respecting security, risk and compliance requirements at2
credit suisse using algebraic graph transformation,” in Enterprise Distributed Object Computing Conference3
Workshops, 2009. EDOCW 2009. 13th, Enterprise Distributed Object Computing Conference Workshops,4
2009. EDOCW 2009. 13th, pp. 64–71, IEEE, 2009.5
[28] Y. Asnar and P. Giorgini, “Analyzing business continuity through a multi-layers model,” in Business6
Process Management, Business Process Management, pp. 212–227, Springer, 2008.7
[29] E. C. Bonafede, P. Cerchiello, and P. Giudici, “Statistical models for business continuity management,”8
Journal of Operational Risk, vol. 2, no. 4, pp. 79–96, 2007.9
[30] Y. Tan and S. Takakuwa, “Use of simulation in a factory for business continuity planning,” International10
Journal of Simulation Modelling, vol. 10, no. 1, pp. 17–26, 2011.11
[31] J. I. Chang and C.-C. Lin, “A study of storage tank accidents,” Journal of loss prevention in the process12
industries, vol. 19, no. 1, pp. 51–59, 2006.13
[32] A. Necci, F. Argenti, G. Landucci, and V. Cozzani, “Accident scenarios triggered by lightning strike on14
atmospheric storage tanks,” Reliability Engineering and System Safety, vol. 127, pp. 30–46, 2014.15
[33] A. Necci, G. Antonioni, V. Cozzani, E. Krausmann, A. Borghetti, and C. Alberto Nucci, “A model for16
process equipment damage probability assessment due to lightning,” Reliability Engineering and System17
Safety, vol. 115, pp. 91–99, 2013.18
[34] D. Wu and Z. Chen, “Quantitative risk assessment of fire accidents of large-scale oil tanks triggered by19
lightning,” Engineering Failure Analysis, vol. 63, pp. 172–181, 2016.20
[35] M. Bruneau, S. E. Chang, R. T. Eguchi, G. C. Lee, T. D. O’Rourke, A. M. Reinhorn, M. Shinozuka,21
K. Tierney, W. A. Wallace, and D. von Winterfeldt, “A framework to quantitatively assess and enhance22
the seismic resilience of communities,” Earthquake spectra, vol. 19, no. 4, pp. 733–752, 2003.23
[36] E. Zio, An introduction to the basics of reliability and risk analysis, vol. 13. World scientific, 2007.24
[37] J. Zhou, G. Reniers, and N. Khakzad, “Application of event sequence diagram to evaluate emergency25
response actions during fire-induced domino effects,” Reliability Engineering and System Safety, vol. 150,26
pp. 202–209, 2016.27
[38] M. Compare, F. Martini, S. Mattafirri, F. Carlevaro, and E. Zio, “Semi-markov model for the oxidation28
degradation mechanism in gas turbine nozzles,” IEEE Transactions on Reliability, vol. 65, no. 2, pp. 574–29
581, 2016.30
[39] S. M. Ross, Introduction to probability models. Academic press, 2014.31
[40] A. Necci, V. Cozzani, G. Spadoni, and F. Khan, “Assessment of domino effect: State of the art and research32
needs,” Reliability Engineering and System Safety, vol. 143, pp. 3–18, 2015.33
[41] B. Abdolhamidzadeh, C. R. C. Hassan, M. D. Hamid, S. FarrokhMehr, N. Badri, and D. Rashtchian,34
“Anatomy of a domino accident: Roots, triggers and lessons learnt,” Process Safety and Environmental35
Protection, vol. 90, no. 5, pp. 424–429, 2012.36
[42] S. Swaminathan and C. Smidts, “The event sequence diagram framework for dynamic probabilistic risk37
assessment,” Reliability Engineering and System Safety, vol. 63, no. 1, pp. 73–90, 1999.38
[43] E. Zio, The Monte Carlo simulation method for system reliability and risk analysis. Springer, 2013.39
December 31, 2016 DRAFT

21
[44] E. Renni, E. Krausmann, and V. Cozzani, “Industrial accidents triggered by lightning,” Journal of1
Hazardous Materials, vol. 184, no. 1-3, pp. 42–48, 2010.2
[45] International Electrotechnical Commission (IEC), “Protection against lightning,” 2010.3
[46] A. Necci, G. Antonioni, V. Cozzani, A. Borghetti, and C. A. Necci, “Reduction of natech risk due to4
lightning by the use of protection systems,” Chemical Engineering Transactions, 2014.5
[47] A. Necci, G. Antonioni, V. Cozzani, A. Borghetti, and C. A. Nucci, “Quantification of risk reduction due6
to the installation of different lightning protection solutions for large atmospheric storage tanks,” Chemical7
Engineering Transactions, 2013.8
[48] DEHN, “Lightening protection guide, 2nd edition,” 2014.9
[49] V. Cozzani, G. Gubinelli, G. Antonioni, G. Spadoni, and S. Zanelli, “The assessment of risk caused by10
domino effect in quantitative area risk analysis,” Journal of hazardous Materials, vol. 127, no. 1, pp. 14–30,11
2005.12
[50] P. Chen, “The statistics law of fire response time and its correlation with the scale of urban fire,” University13
of Science and Technology of China, 2010.14
December 31, 2016 DRAFT