Embed Size (px)
Citation preview

An Integrated Urban Model of Transportation, Land-Use, Energy, and Environment
Kouros Mohammadian Department of Civil and Materials Engineering
University of Illinois at Chicago

Why an Integrated Urban Model?
More than 50% of the world’s population live in urban areas
By 2050, 70% of people are likely to be city dwellers – compared with less than 30% in 1950
Cities consume over 2/3 of the world’s energy and account for more than 70% of global CO2 emissions
This trend brings with it challenges and threats in urban areas
Need to consider a comprehensive, multi‐faceted, approach for an enhanced , efficient, resilience, and sustainable urban built infrastructure
To date, a comprehensive and holistic approach to study large-scale and inter-dependent urban infrastructures has not been developed thoroughly

An Integrated and Holistic Approach to Urban Infrastructure Development
Source: sklinternational.se

Transportation and urban form are fundamentally linked. How we build our city directly determines travel needs, viability of alternative travel modes, etc.
Transportation, in turn, influences land development and location choices of people & firms.

PhD Dissertation Proposal 5/10/2013
Overall Integrated Urban Model Framework
Population Synthesis
Vehicle Ownership Home/Work Location choice
Work/Home Change and Choice Vehicle Transaction
Household Composition
Transportation System
Regional Economy Land/Job Markets
Household Long-Term Context
Long-term Decision Making
Short-term Simulation
Activity/Travel Model
Network Simulation ADAPTS Model
Freight Model
Environment Energy Water Waste Health
FAME Model

6
Criticisms of Current Travel Demand Models
Unrealistic behavioral assumptions – Utility maximization
Artificially restrict activity scheduling to predefined choices – Can not represent full range of
“scheduling behavior” – No consideration of “dynamics” (full
day selected at one time)
Limitations on time-scale of analysis

Research Gaps in ABM
Simplification of scheduling process – Priority rules, fixed order of choices – Only out of home activities – Interactions between in-home and out-of-home activities
are ignored
No representation of planning dynamics – Impact of planning time on choices made
Short-term, diary data used – Most rule-based models implemented using 1-2 day
diary data
Limited integration with traffic simulation – Static assignment for fixed time-periods
Limited policy/scenario analysis capability
7/60

Scheduling Order Example A) Impulsive Shop - Preplan Eat Out Before Change
After Change
B) Preplan Shop - Impulsive Eat out Before Change
After Change
8

Motivation Hypothesis: When and how activity planning decisions are
made can impact final daily activity pattern
ADAPTS: – Next generation ABM paradigm accounting for “behavioral processes” – Retains link b/w activities and travel at the individual level – Adds element of activity planning, to activity generation and activity
scheduling, rather than relying on sequential series of models
Account for planning dynamics – when is each decision made in relation to other decisions,
activities, schedule, etc. – Planning and scheduling occurring in time-dependent manner,
also impacted by time-dependent traffic network – Within day and en-route re-planning
Represent macro-level changes from impacts of policies on planning dynamics at individual level
9

ADAPTS Simulation Framework
Household Planning
Individual Planning
Household Schedule
Household Memory
Social Network
Individual Schedules
Individual Memory
Land Use
Historical Network LOS
Institutional Constraints
Initialize Simulation •Initialize World •Synthesize Population •Generate routines
For each timestep
Trip Vector
Least Cost Routes
Information Flow Simulation Flow
Vehicles Movements
New Travel Times
Add to Historical Travel Times for Next Iteration
For each timestep
Prevailing Network LOS
Network Assignment
Household Socioeconomic
10

ADAPTS Planner/Scheduler ADAPTS planning and
scheduling framework
Handles at each timestep:
– Generation – Planning – Scheduling
Generation, planning and scheduling can occur at different times for same activity
Core of the framework is the Attribute Plan Order Model
Operationalized using multiple scheduling process surveys
At timestep t
Generate new activity
Update existing activity(s)
Execute activity
Attribute Planning Order model
Planned Activity Schedule
Time-of-Day
t = Ttime
Party
t = Twith
Mode Choice
t = Tmod
Destination choice
t = Tloc
Executed Schedule
Resolve Conflicts
Conflict Resolution Model
Set Plan Flags: (Ttime,Tloc, etc.)
Yes
Decision Logical test Model Simulated events
Yes
No
Yes
No
No
Activity G
eneration Activity
Planning Activity
Scheduling
11

ADAPTS Components

Activity Generation Activity generation with joint hazard-duration equations
– Significant socio-economic variables – Impact of hazard rate from other activities
Failure probability (generation) calculated each timestep – Based on time-since-last activity – Calculated using observed UTRACS data (14-day survey) – Fit to Chicago 1-day survey through updating
13

Activity Planning Order Framework
Assign plan horizon to each attribute
– After activity generated
Plan order model process – Assigns attribute flexibility – Get activity plan horizon – Attribute plan horizons
Plan horizons for each attribute based on:
– Attribute flexibilities – Activity plan horizon – General activity attributes – Socio-demographics, etc.
Defines the meta-attributes of the activity attributes
Generate New Activity (Auld and Mohammadian 2009)
Attribute Flexibility Model
Attribute Plan Horizon Model
Demographic Characteristics
Activity/Travel History
Flex Person
Flex location
Flex Start
Flex Duration
Plan Person
Plan location
Plan Start
Plan Duration
Plan Mode
Activity Plan Horizon Model
Plan Activity
Data source
Model
Model result
Flex Mode
14

Scheduling Heuristics
Set of rules for scheduling activities – Attempts to resolve conflicts by modifying each activity
Includes results of conflict resolution model: – TASHA – conflict resolution based on heuristic rules – New rules – heuristic rules determine how conflict resolution
strategy is implemented New rules allow for the consideration of more complicated
conflict types and deletion operations A new optimization model is developed
15

Traffic Assignment and Simulation

Zone
System
Econ
omic
Activ
ity
Logis
tics D
ecisi
ons
Zone System Socio-
Economic Factors
Economic Activity
Data
Freight Generation
Model
Commodity Production
Consumption
Supplier Selection Model
Network Assignment
Establishment Survey
Annual Commodity Flow
(firm-to-firm)
GPS-based data
Supplier Evaluation
Model
IO accounts/ Industry-commodity
crosswalk
Establishment Freight Survey
Transportation Performance
Measures
Interview Survey (specialists)
IO Accounts
Firm Synthesis
List of Firms with Their
Characteristi
Empty Trucks / Backhauling
Shipping Chain Configuration (direct/non-direct shipping chains)
Shipment Size / Frequency Choice
Main Mode Choice Model
Vehicle Choice
Number of Stops per
Stop Type
Access/Egress Mode Choice
Simulated Individual Shipments
Netw
ork
Analy
sis
CBP Data
Industry- Commodity Crosswalk
Freight Model (FAME) Framework

FAME’s zoning system Zone System Township level zones in the Chicago area (118 zone) County level zones in rest of Illinois (95 zone) FAF zones in the rest of US (120 zone)

Integration with Network Simulation
Advanced Demand models (Activity Based Models)
Advanced Supply Models (Dynamic Traffic Assignment)
– MATSim, DynusT, TRANSIMS, AIMSUN, ...
Interfacing, Interacting, Integrating!?! – Feedbacks – Tight Integration
Issues: – Behavioral Realism – Dynamic Activity Based Models – Dynamic pricing scenarios – Congestion related unreliability
Demand Model
Supply
List of Trips
Travel Times
19

Integration with TRANSIMS TRANSIMS Version 5.0
Router – Label constrained time dependent shortest path
Microsimulator: executes the trip plans – explicitly simulate:
Multiple travelers per vehicle Multiple trips per traveler Vehicles with different operating characteristics Intermodal travel plans
– does not simulate: Walking legs Interaction between cars and pedestrians Rail road crossings
Issues: – Behavioral Realism – Dynamic Activity Based Models
Network: Chicago Zones: 1,961 Signals: 9,822 Nodes: 19,038 Act Location: 98,204 Link: 31,339
Population: Households: 2,910,510 Person: 7,755,490
20

Integration Issues Variable Demand
Vehicle Rerouting
Performance – Running two different software, reduces the performance
Issues with Traffic Assignment Software Packages – Documentation – Programming Language Differences – Zoning Differences – Availability of high-fidelity network – Open Source, Cost
21
PhD Dissertation Proposal 5/10/2013
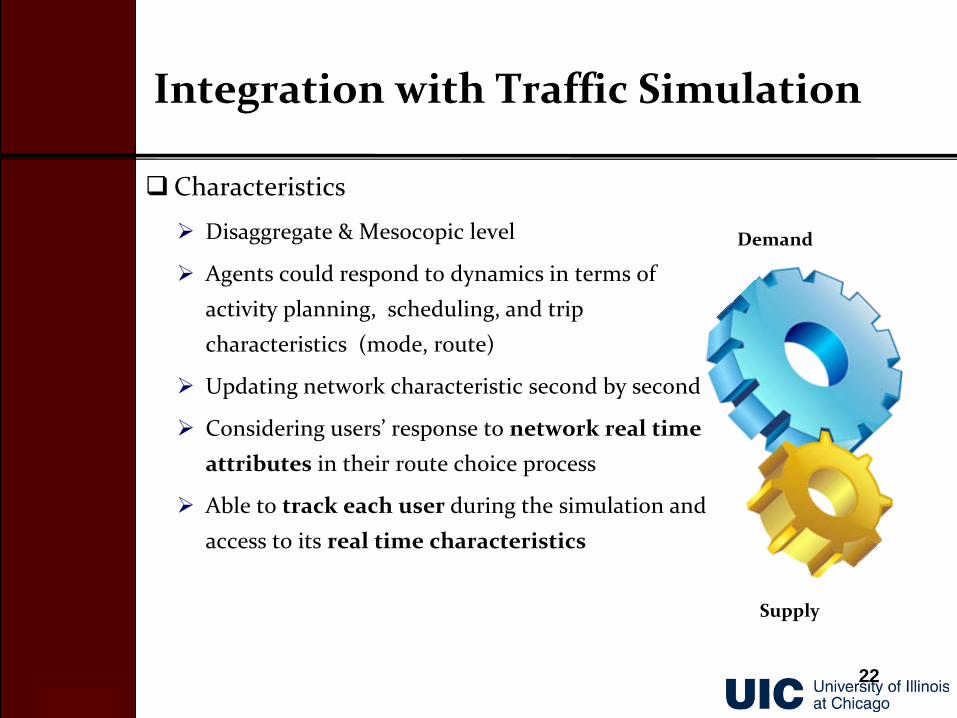
Integration with Traffic Simulation
Characteristics
Disaggregate & Mesocopic level
Agents could respond to dynamics in terms of activity planning, scheduling, and trip characteristics (mode, route)
Updating network characteristic second by second
Considering users’ response to network real time attributes in their route choice process
Able to track each user during the simulation and access to its real time characteristics
Demand
Supply
22

Embedded Traffic Simulator
Integrated model has been implemented directly in ADAPTS simulation
Consists of individual person-agents who: – Perform activity planning and scheduling (ADAPTS model)
– Select routes based on prevailing traffic & information provision (A* router)
Travel through the network (Newell’s model)
Can interact with ITS elements to modify or update plans
Two Modules: Router and Simulator – Router Calculates Shortest Path for P1 – Simulator Moves P1 along shortest path
Send details back to activity planner
1
8
5
9 11 10
7
4 3 2
6
5
4
2
6
2
4
6
5
7
4
5
6 3
23

Computational Issues Slow performance discourages practitioners
who need many scenario analysis and calibration
We may have the resources and patience, but others may not, so it is important to optimize the program and use minimum hardware
Advance models are very time-consuming and computationally intensive (DTA, ABMs, in-home activities, complex and dynamic policies, high level visualization, etc.)
24

Number of Threads: 64 Machine: RAM 256 GB, 32 AMD Opteron(TM)
Processors 2.3 GHz Full Microsimulation with dynamic traffic
assignment Tracking vehicles and individual locations every 30s Activity generation and scheduling simulation every
15 minutes 28 days of out-of-home activity preplanning and
real-time in-home activity generation Average activity statistics are recorded for the
sample. Simulated results for one week
Simulation

Extensions of the ADAPTS Model

Travel Behavior Health
• Air Pollution • Physical Activity • Traffic • Comfort Travel • Noise Pollution
• Urban Form • Pop./Emp. Density • Trans. System • Transit Accessibility • Trip characteristics
like trip purpose • Transit Service • Socioeconomic Status
Travel Behavior and Health
Every percent increase in Transit-use: • Decreases Heart Attack by 0.07% • Decreases Obesity by 0.29% • Improves General Health by 0.09% • Increases chance of Asthma infection by 0.03%
Every percent decrease in Auto-use: • Reduce chance of High Blood Pressure by 0.26% • Reduce chance of High Blood Cholesterol by 0.18%
Pedestrian friendly neighborhoods motivate people to walk more and be healthier.
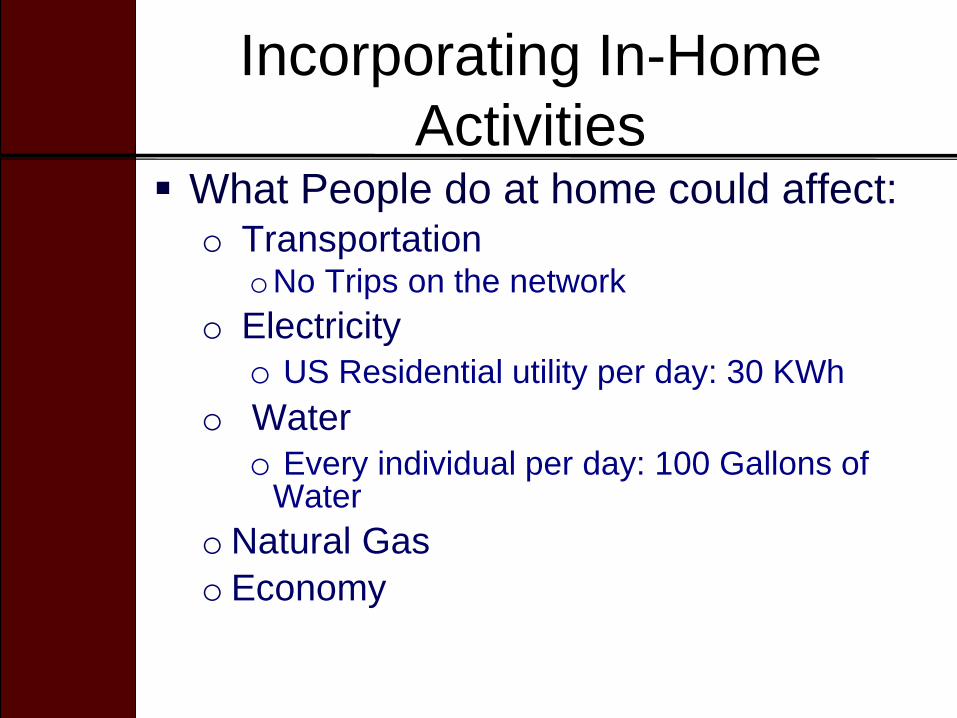
Incorporating In-Home Activities
What People do at home could affect: o Transportation
oNo Trips on the network o Electricity
o US Residential utility per day: 30 KWh o Water
o Every individual per day: 100 Gallons of Water
oNatural Gas o Economy

Incorporating In-Home Activities
o In-Home Activities that are being considered: – Sleep – Personal Maintenance
• Eating and Drinking • Personal Care
– Household Maintenance • Household Activities • Caring for & Helping Household Members • Caring For & Helping Non-HH Members
– Leisure/Social • Sports, Exercise, and Recreation (at Home) • Socializing, Relaxing, and Leisure
• Socializing and Communicating • Relax and Leisure
• Watching TV • Etc..
– Discretionary • Religious and Spiritual Activities • Telephone Calls
– Mandatory • Work & Work-Related Activities • Education Related

In-Home Personal Maintenance Time of Day Frequencies

In-Home Activity Duration Frequencies

Time step T
N
Y
Shift Planning Flag Times
Generate new Out-of-Home Activity
Update existing activity(s)
Attribute Planning Order model
Set Plan Flags: (Ttime,Tloc, etc.)
Y
N
t = Ttime t = Tmod t = Tloc t = Twith
Y
Planned Activity Schedule
Execute Schedule
Resolve Conflicts
Conflict Resolution Model 1 (OUT/OUT)
Is Any Activity in Progress?
Generate In-Home Activity
Conflict Resolution Model 2 (IN/OUT)
Time-of-Day Model
Party Composition
Destination Choice
Mode Choice
Y
N
Decision Logical test Model Simulated events
N
Y
Asleep?
N Y
N
o A combination of rule-based and econometric models that simulate in-home activities alongside with out-of-home ones
Assumptions:
o Out-of-home activities that are
preplanned have priority to in-home activities.
o Impulsive out-of-home activities compete with in-home activities.
ADPATS ABM Framework
ADAPTS Updated Framework

Simulation Time
Simulation Time Step T
Current time step interval under focus
Generated In-home Personal Maintenance
Travel to home
Work
Conflict of an In-home activity with a routine out-of-home activity
Simulation Time Simulation Time Step T
Resolved In-home Personal Maintenance Work
Rule-based conflict resolution by truncation :
Travel to work
Priority of out-of-home preplanned/routine activities to in-home activities

Conflict of an In-home activity with an impulsive out-of-home activity
Simulation Time Simulation Time Step T
Work
Priority conflict resolution by the reverse pairwise model: Travel to work
Generated impulsive shopping activity
Competition of out-of-home impulsive activities with in-home activities
shopping activity
Priority given to shopping activity
Simulation Time
Simulation Time Step T
Generated In-home Personal Maintenance
Travel to home
Work

0
1
2
3
4
5
Slee
p
Pers
onal
Mai
nten
ance
at h
ome
Hosu
ehol
d M
aint
enan
ce a
t hom
e
Leisu
re/S
ocia
l/Rec
reat
ion
at h
ome
Disc
retio
nary
-oth
er a
t hom
e
Man
dato
ry a
t hom
e
Average Frequency of Activities per Day
ATUS IL
0
60
120
180
240
300
Slee
p
Pers
onal
Mai
nten
ance
at h
ome
Hosu
ehol
dM
aint
enan
ce a
t hom
e
Leisu
re/S
ocia
l/Rec
reat
ion
at h
ome
Disc
retio
nary
-oth
er a
tho
me
Man
dato
ry a
t hom
e
Average Duration for Activity Episode (min)
ATUS IL
Validation of In-Home Activity Simulation

What’s next?
• Electricity • Water • Energy • Waste • Food • CAVs • ….

Total Electricity Consumption by Census Block
Per square foot Electricity Consumption by Census Block

Conclusion ADAPS is a framework for model development
ADAPTS’ unique framework incorporates planning dynamics – Enroute route-switching and activity re-planning – reactions to unexpected events
Potentially more useful for certain applications – Operational simulations (e.g., CAV fleets, …) – Agents responding to unexpected events – Emergency planning
Further Challenges – Still computationally intensive – Incorporating other urban systems – Incorporating social networks – Incorporating joint decision making processes – Incorporating agent history in decision making – Accounting for uncertainty – Data availability
38

Questions!
39


![Shortest-pathg rocerys hoppingjustinppearson.com/pages/shortest-path-grocery-shopping/shortest-path-grocery-shopping.pdfGraphPlot[meshGraph, ImageSize→ Full] Getthegraphvertices](https://img.pdfslide.net/doc/110x75/5ec9717fc18133726b4d56ff/shortest-pathg-rocerys-h-graphplotmeshgraph-imagesizea-full-getthegraphvertices.jpg)