Embed Size (px)
Citation preview

Faculty of Engineering & Science, Curtin Malaysia
Department of Mechanical Engineering
An Intelligent Monitoring Interface for a Coal-Fired Power
Plant Boiler Trips
Nong Nurnie Binti Mohd Nistah
This thesis is presented for the Degree of
Master of Philosophy (Mechanical Engineering)
Of
Curtin Malaysia
October 2018

i
Declaration
To the best of my knowledge and belief this thesis contains no material
previously published by any other person except where due acknowledgment has been
made.
This thesis contains no material which has been accepted for the award of any
other degree or diploma in any university.
Signature: ………………………………………….
Date: 31st October 2018

ii
Acknowledgements
In the name of Allah, the Most Gracious and Most Merciful.
Alhamdulillah. All praises to Allah Almighty for His blessings in the
completion of this work, and for giving me the strength, endurance and grit throughout
the whole research term. Without His will, this MPhil. thesis will not be completed
accordingly. For my parents and significant other, whom I will always be in debt to for
the support and prayers throughout this journey; Hj. Mohd Nistah Kabul, Hjh. Subiah
Laten, and my husband Zulkifli Osman.
My highest appreciation goes to my supervisors; Associate Professor Garenth
Lim King Hann and Associate Professor Lenin Gopal, for their patience, constructive
comments, tireless support, guidance and ideas that lead to a renewed motivation and
learning curve for me to continue and complete this research work especially in the
last gruelling years. As well as to my associate supervisor and former supervisor(s);
Mr. Foad Motalebi, Dr. Firas Basim Ismail Alnaimi, and Professor Yudi Samyudia,
who has supported and guided me in the initial stages of my research journey.
I am also grateful to the former Dean of Graduate Studies of Curtin Malaysia,
Professor Marcus M.K. Lee for his kind words of wisdom and advice. Without his
direction and recommendation, I don’t think I will get this far. In addition, I would like
to thank all the supporting administration staff of the Graduate Studies and R&D
office, HR and Finance department for helping me with my postgraduate affairs and
staff study support. A special thanks to the Dean, Professor Lau Hieng Ho and
everyone in the Faculty of Engineering & Science; with special mentioned to my dear
colleagues; Jameson Malang, Kamaroizan Mohamad, Dr. Anita Jimmie, Lai ZhenYue
and Loh Wan Ning who was there to support and help me with the technicalities.
Last but not least, I would also like to thank the experts who have assisted me
in the data collection and various site visits at SARAWAK Energy Sdn. Bhd., Miri and
MPG (Mukah Power Generation) Plant. This includes my former student and
colleague Muhammad Uwaes for helping me with the data recording and my fellow
postgraduate associates, Noraini Mohd for the collaboration and discussions; it has
been an eye opening experience.
iii
Abstract
Coal-fired power plant boiler trip happens when the fuel feed to the furnace is
stopped. This practice is carried out to clear any residue of combustible substances
from the boiler. It is a safety procedure to prevent explosive occurrences. The
combustible substances residue consists mainly of slag, ashes and flue gas
desulphurization gypsum. These chemical deposits have been the major part of many
literatures in assessing its impact on environment and public health. A power plant
monitoring system has the potential to (1) improve plant performances, (2) reduce
down time, and (3) address possible issues before it results in an unplanned downtime
or costly equipment damage. An existing monitoring system embedded with artificial
intelligence can enhance the effectiveness of the preventive maintenance further. It
contributes in reducing the time spent in trip analysis and following up with
supervisory approval. The intelligent feedback from the interface allow operators to
use the information as guideline in analyzing the affected operational parameters that
are causing the trips. The work involved in this research include the development of
an intelligent interface that optimizes the boiler monitoring system in a coal-fired
power plant. The tools used in the development include (1) an Artificial Neural
Network multi-layered model, and (2) and an interface to provide the advisory
feedback. These tools utilize a simulation prototype and an Integrated Development
Environment executable file that can run in a portable platform. Experimental results
shown that Multi-layered perceptron neural network trained with Levenberg-
Marquardt algorithm achieved the least mean squared error. These predictions of
possible trips were recorded to have occurred at a specific time interval and this
information is important as a guideline for the effective inspection and maintenance
work.
iv
List of Publications
1. N.N. Mohd Nistah, K.H. Lim, L. Gopal, and F.B.I. Alnaimi, “Coal-Fired
Boiler Fault Prediction Using Artificial Neural Networks,” Int. J. Electr.
Comput. Eng. (IJECE), vol 8, no. 4, 2018.
2. N.N. Mohd Nistah, F. Motalebi, Y. Samyudia, and F.B.I. Alnaimi, “Intelligent
Monitoring Interfaces for Coal Fired Power Plant Boiler Trips: A Review,”
Pertanika J.Sci. Technol., vol 22, no. 2, pp. 593-601, 2014.
Conference and Poster
1. N.N. Mohd Nistah, K.H. Lim, L.Gopal, and F.B.I. Alnaimi, “Artificial Neural
Networks to Predict Coal-fired Boiler Fault Using Boiler Operational
Parameters,” International Conference on Electrical, Electronic,
Communication and Control Engineering (ICCEECC), 2017 – Conference
presentation
2. N.N. Mohd Nistah, F. Motalebi, Y. Samyudia, F.B.I. Alnaimi, “An Intelligent
Monitoring Interface for a Coal-Fired Boiler Trip,” poster presented at
Postgraduate Colloquium, 2014 – Poster presentation
3. N.N. Mohd Nistah, F. Motalebi, Y. Samyudia, F.B.I. Alnaimi, “Intelligent
Monitoring Interfaces for Coal Fired Power Plant Boiler Trips: A Review,” 7th
Curtin University Technology, Science and Engineering Conference (CUTSE),
2012 – Conference presentation
v
Table of Contents
Chapter 1. Introduction ............................................................................................................ 1
1.1 Introduction ................................................................................................................. 1
1.2 Problem statement ....................................................................................................... 3
1.3 Research questions ...................................................................................................... 3
1.4 Objectives ................................................................................................................... 4
1.5 Research Contribution ................................................................................................ 4
1.6 Organization of this thesis........................................................................................... 5
Chapter 2. Review of Intelligent Approach to a Coal-Fired Power Plant Boiler Trip
Monitoring System ......................................................................................................................... 6
2.1 Introduction ................................................................................................................. 6
2.2 Importance of a boiler unit in a power plant ............................................................... 6
2.3 Factors contributing to boiler trips and efforts to reduce the impact on energy
production ................................................................................................................... 7
2.4 Intelligent Monitoring System for Coal-Fired Boiler Trip Condition ....................... 10
2.5 Current methods to improve the monitoring system ................................................. 12
2.6 Summary ................................................................................................................... 14
Chapter 3. Coal-Fired Power Plant and Boiler Unit Operational Parameters ..... 15
3.1 Introduction ............................................................................................................... 15
3.2 Functional & Operational Control ............................................................................ 15
3.2.1. Component 1 (C1): Coal supply & Preparation system ............................... 17
3.2.2. Component 2 (C2): Combustion & Steam generator ................................... 17
3.2.3. Component 3 (C3): Environmental & Safety Control system ..................... 17
3.2.4. Component 4 (C4): Turbine Generator & Electric production .................... 18
3.2.5. Component 5 (C5): Condenser & Feed water system .................................. 18
3.2.6. Component 6 (C6): Heat extraction & Rejection system ............................. 18
3.3 Boiler unit in a Thermal Power Plant ........................................................................ 18
3.4 Boiler Parameters & Performance Monitoring ......................................................... 19
3.5 Summary ................................................................................................................... 26
vi
Chapter 4. Boiler Fault Detection Using Artificial Neural Networks (ANN)......... 27
4.1 Introduction ............................................................................................................... 27
4.2 Artificial Neural Network (ANN) ............................................................................. 28
4.2.1 MLP based boiler fault detection .................................................................. 29
4.2.2 Data pre-processing and normalization ......................................................... 30
4.2.3 Activation functions ...................................................................................... 31
4.2.4 Training algorithm ........................................................................................ 32
4.3 Experimental Results & Discussion .......................................................................... 34
4.4 Summary ................................................................................................................... 40
Chapter 5. Intelligent Boiler Trip Monitoring Interface and Advisory Guide ..... 41
5.1 Introduction ............................................................................................................... 41
5.2 Power plant boiler monitoring interface ................................................................... 42
5.3 Power plant boiler trip advisory guide ...................................................................... 46
48
5.4 Boiler parameter sensitivity analysis ........................................................................ 48
5.5 Summary ................................................................................................................... 50
Chapter 6. Conclusion and Future Work .......................................................................... 51
6.1 Conclusion ................................................................................................................ 51
6.2 Future Works ............................................................................................................. 53
References ................................................................................................................................... 55
List of Figures
vii
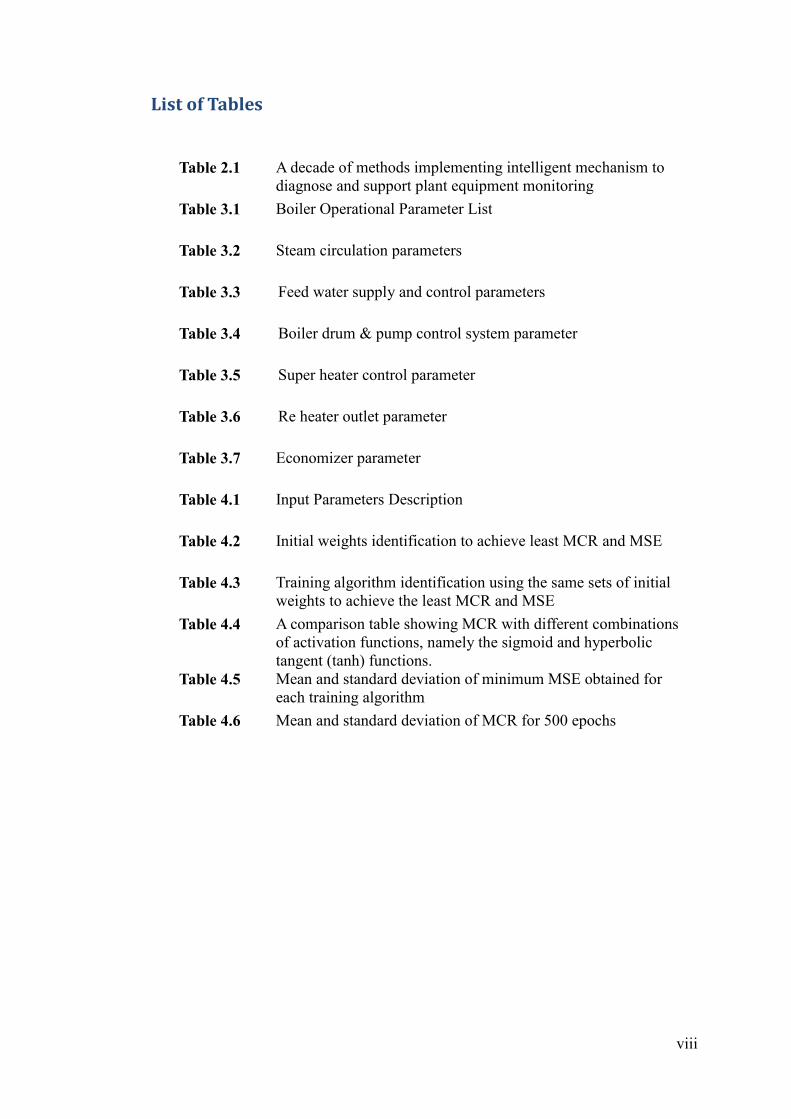
List of Figures
Figure 1.1. Pulverized coal processed as fossil fuel in a thermal power plant
boiler.
Figure 3.1 A block diagram of a thermal power plant
Figure 3.2. Process drawing of the arrangement of heat transfer surfaces in a
furnace equipped boiler.
Figure 3.3 A large coal fired utility boiler unit
Figure 4.1 Boiler fault detection framework
Figure 4.2 An abstract structure of a single artificial neuron.
Figure 4.3 A typical multilayer perceptron structure
Figure 5.1 The flowchart outlining the features of the GUI
Figure 5.2 An illustration of the interaction between plant operator and the
monitoring system
Figure 5.3 A time stamp parameter data reading advisory thermal power plant
boiler monitor user interface
Figure 5.4 Outliers identified and labelled with an (*) for variables V5, V8
and V9 related to super heater steam, exchange metal and inlet
header metal temperatures. This figure also includes outliers for
low temperature readings at the super heater wall outlet before and
after the super heater dryer, VAR20 and VAR21 respectively.
Figure 5.5 V5, V8 and V9 a sudden upsurge of temperature reading at interval
1835 to 1837
viii
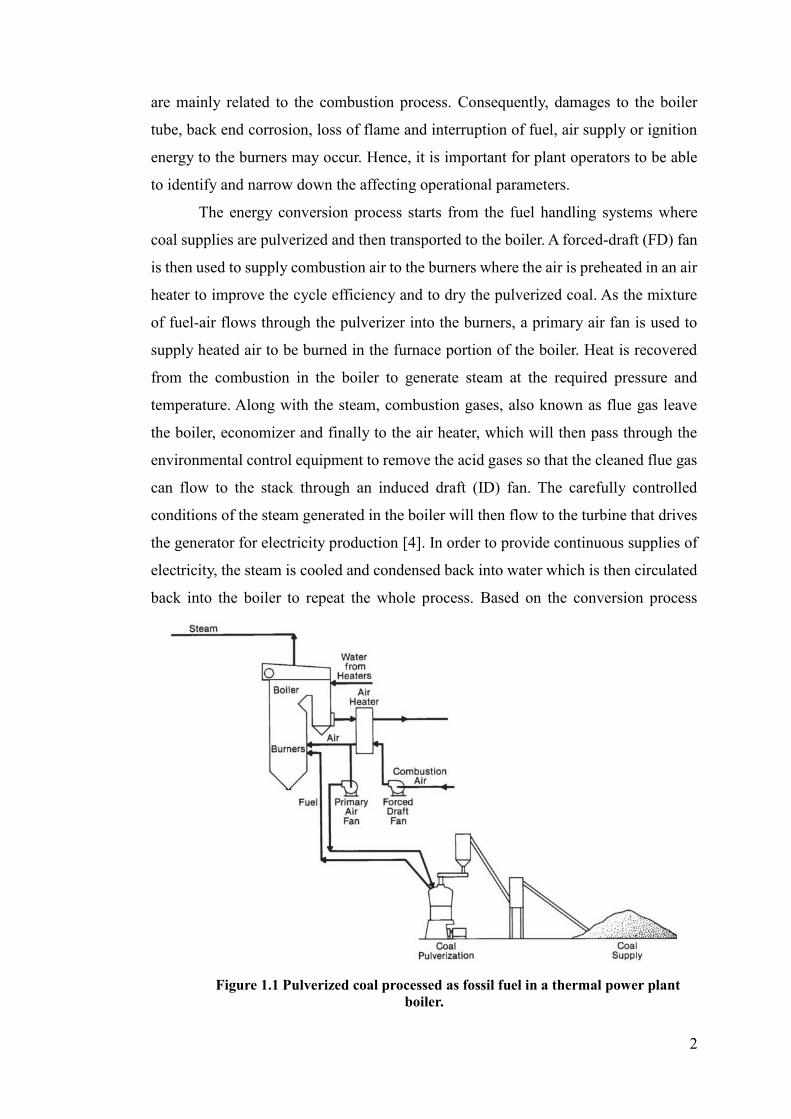
List of Tables
Table 2.1 A decade of methods implementing intelligent mechanism to
diagnose and support plant equipment monitoring
Table 3.1 Boiler Operational Parameter List
Table 3.2 Steam circulation parameters
Table 3.3 Feed water supply and control parameters
Table 3.4 Boiler drum & pump control system parameter
Table 3.5 Super heater control parameter
Table 3.6 Re heater outlet parameter
Table 3.7 Economizer parameter
Table 4.1 Input Parameters Description
Table 4.2 Initial weights identification to achieve least MCR and MSE
Table 4.3 Training algorithm identification using the same sets of initial
weights to achieve the least MCR and MSE
Table 4.4 A comparison table showing MCR with different combinations
of activation functions, namely the sigmoid and hyperbolic
tangent (tanh) functions.
Table 4.5 Mean and standard deviation of minimum MSE obtained for
each training algorithm
Table 4.6 Mean and standard deviation of MCR for 500 epochs

1
Chapter 1. Introduction
1.1 Introduction
Frequent electrical power outages have tremendously disrupted the
operational cost and production process of most industries. The accumulative effects
of unscheduled power outages incur cost in power restoration, interrupted production
loss, equipment maintenance and protection. These factors of unscheduled power
outage are mainly due to a sudden shortfall of electrical load failure and frequency
drop in the electrical power plant. To restore the operation of power plant, a series of
electrical standard set by Energy Commission [1] has to be carried out. One of the
standards requires a time lapse after the system inspection before start-up can be safely
administered. This delay can cause cost setbacks to small businesses, office
equipment’s failure, and even traffic flow interruption. Hence, it becomes more
apparent to consider improving the existing equipment monitoring system for a more
stable contingency plan for power recovery.
The current monitoring system continuously tracks the plant’s equipment’s
operating condition. Any identified features that affects the availability, capacity,
safety and quality of the energy production will be displayed on the plant monitoring
system. These displayed information helps plant operators to report the data for the
scheduled maintenance as part of the action items. Generally, most of the tell-tale signs
of an equipment’s degradation will be overlooked until the maintenance is carried out.
As a result, additional cost and time are required to carry out the necessary equipment
overhaul.
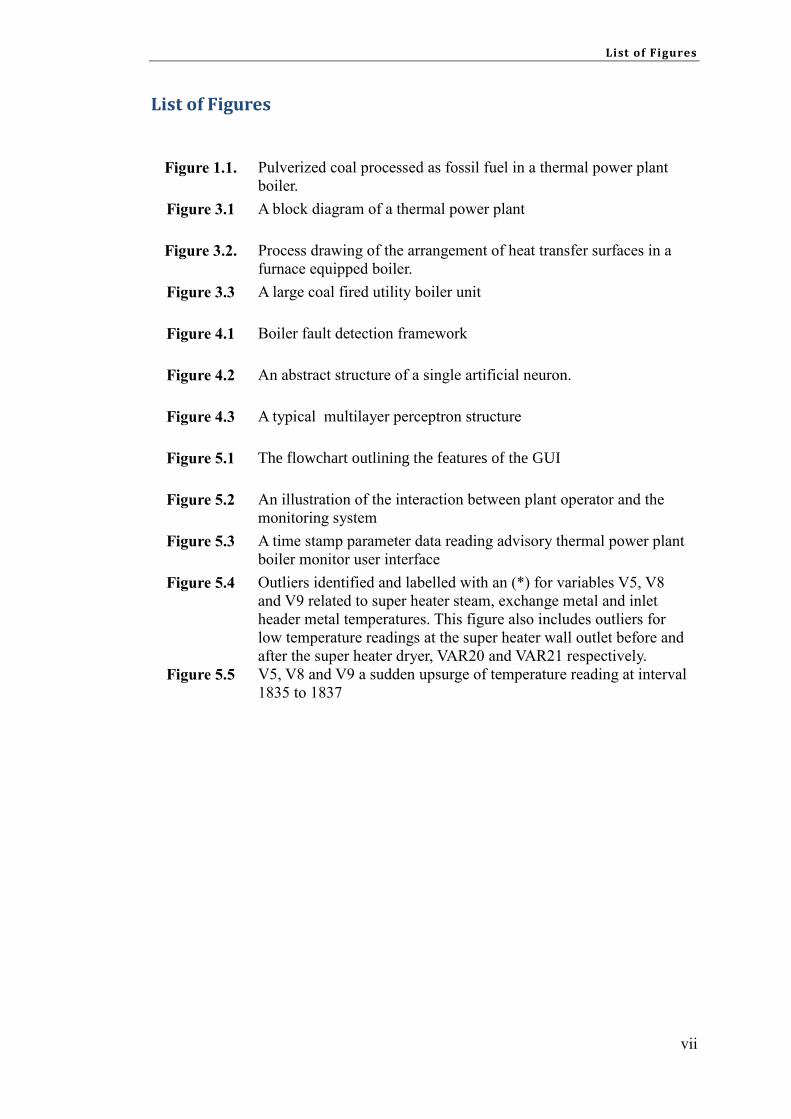
In this research work, a coal-fired boiler is one of the two main components of
a thermal power plant. A schematic diagram for a coal-fired boiler in a thermal power
plant is shown in Fig.1.1. A boiler is a vessel used to contain the combustion process
and facilitate heat transfer from flame and hot gases to water and steam tubes [2]. A
boiler unit trip has a huge impact on a plant’s continued operation and may lead to
power production process interruption. A trip condition happens when the fuel feed to
the furnace is stopped in order to clear any residues of combustible substances from
the boiler and to prevent explosive occurrence [3]. Common factors for boiler unit trips
2
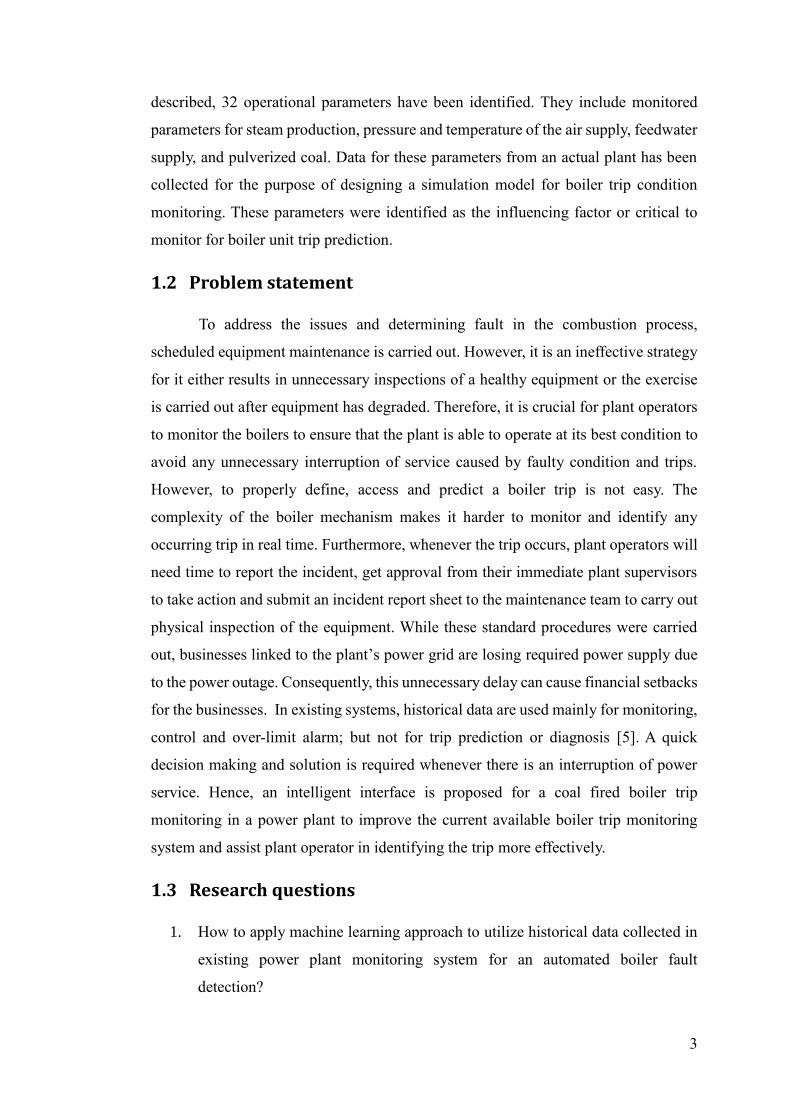
are mainly related to the combustion process. Consequently, damages to the boiler
tube, back end corrosion, loss of flame and interruption of fuel, air supply or ignition
energy to the burners may occur. Hence, it is important for plant operators to be able
to identify and narrow down the affecting operational parameters.
The energy conversion process starts from the fuel handling systems where
coal supplies are pulverized and then transported to the boiler. A forced-draft (FD) fan
is then used to supply combustion air to the burners where the air is preheated in an air
heater to improve the cycle efficiency and to dry the pulverized coal. As the mixture
of fuel-air flows through the pulverizer into the burners, a primary air fan is used to
supply heated air to be burned in the furnace portion of the boiler. Heat is recovered
from the combustion in the boiler to generate steam at the required pressure and
temperature. Along with the steam, combustion gases, also known as flue gas leave
the boiler, economizer and finally to the air heater, which will then pass through the
environmental control equipment to remove the acid gases so that the cleaned flue gas
can flow to the stack through an induced draft (ID) fan. The carefully controlled
conditions of the steam generated in the boiler will then flow to the turbine that drives
the generator for electricity production [4]. In order to provide continuous supplies of
electricity, the steam is cooled and condensed back into water which is then circulated
back into the boiler to repeat the whole process. Based on the conversion process
Figure 1.1 Pulverized coal processed as fossil fuel in a thermal power plant
boiler.
3
described, 32 operational parameters have been identified. They include monitored
parameters for steam production, pressure and temperature of the air supply, feedwater
supply, and pulverized coal. Data for these parameters from an actual plant has been
collected for the purpose of designing a simulation model for boiler trip condition
monitoring. These parameters were identified as the influencing factor or critical to
monitor for boiler unit trip prediction.
1.2 Problem statement
To address the issues and determining fault in the combustion process,
scheduled equipment maintenance is carried out. However, it is an ineffective strategy
for it either results in unnecessary inspections of a healthy equipment or the exercise
is carried out after equipment has degraded. Therefore, it is crucial for plant operators
to monitor the boilers to ensure that the plant is able to operate at its best condition to
avoid any unnecessary interruption of service caused by faulty condition and trips.
However, to properly define, access and predict a boiler trip is not easy. The
complexity of the boiler mechanism makes it harder to monitor and identify any
occurring trip in real time. Furthermore, whenever the trip occurs, plant operators will
need time to report the incident, get approval from their immediate plant supervisors
to take action and submit an incident report sheet to the maintenance team to carry out
physical inspection of the equipment. While these standard procedures were carried
out, businesses linked to the plant’s power grid are losing required power supply due
to the power outage. Consequently, this unnecessary delay can cause financial setbacks
for the businesses. In existing systems, historical data are used mainly for monitoring,
control and over-limit alarm; but not for trip prediction or diagnosis [5]. A quick
decision making and solution is required whenever there is an interruption of power
service. Hence, an intelligent interface is proposed for a coal fired boiler trip
monitoring in a power plant to improve the current available boiler trip monitoring
system and assist plant operator in identifying the trip more effectively.
1.3 Research questions
1. How to apply machine learning approach to utilize historical data collected in
existing power plant monitoring system for an automated boiler fault
detection?
4
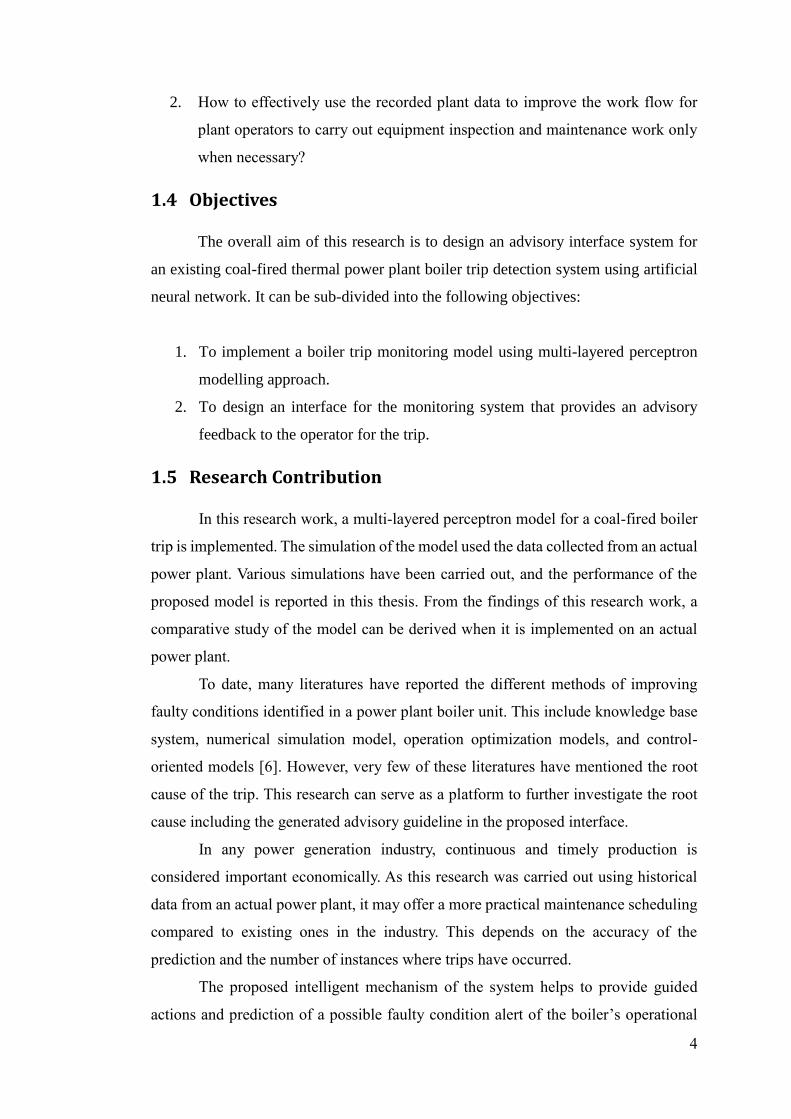
2. How to effectively use the recorded plant data to improve the work flow for
plant operators to carry out equipment inspection and maintenance work only
when necessary?
1.4 Objectives
The overall aim of this research is to design an advisory interface system for
an existing coal-fired thermal power plant boiler trip detection system using artificial
neural network. It can be sub-divided into the following objectives:
1. To implement a boiler trip monitoring model using multi-layered perceptron
modelling approach.
2. To design an interface for the monitoring system that provides an advisory
feedback to the operator for the trip.
1.5 Research Contribution
In this research work, a multi-layered perceptron model for a coal-fired boiler
trip is implemented. The simulation of the model used the data collected from an actual
power plant. Various simulations have been carried out, and the performance of the
proposed model is reported in this thesis. From the findings of this research work, a
comparative study of the model can be derived when it is implemented on an actual
power plant.
To date, many literatures have reported the different methods of improving
faulty conditions identified in a power plant boiler unit. This include knowledge base
system, numerical simulation model, operation optimization models, and control-
oriented models [6]. However, very few of these literatures have mentioned the root
cause of the trip. This research can serve as a platform to further investigate the root
cause including the generated advisory guideline in the proposed interface.
In any power generation industry, continuous and timely production is
considered important economically. As this research was carried out using historical
data from an actual power plant, it may offer a more practical maintenance scheduling
compared to existing ones in the industry. This depends on the accuracy of the
prediction and the number of instances where trips have occurred.
The proposed intelligent mechanism of the system helps to provide guided
actions and prediction of a possible faulty condition alert of the boiler’s operational
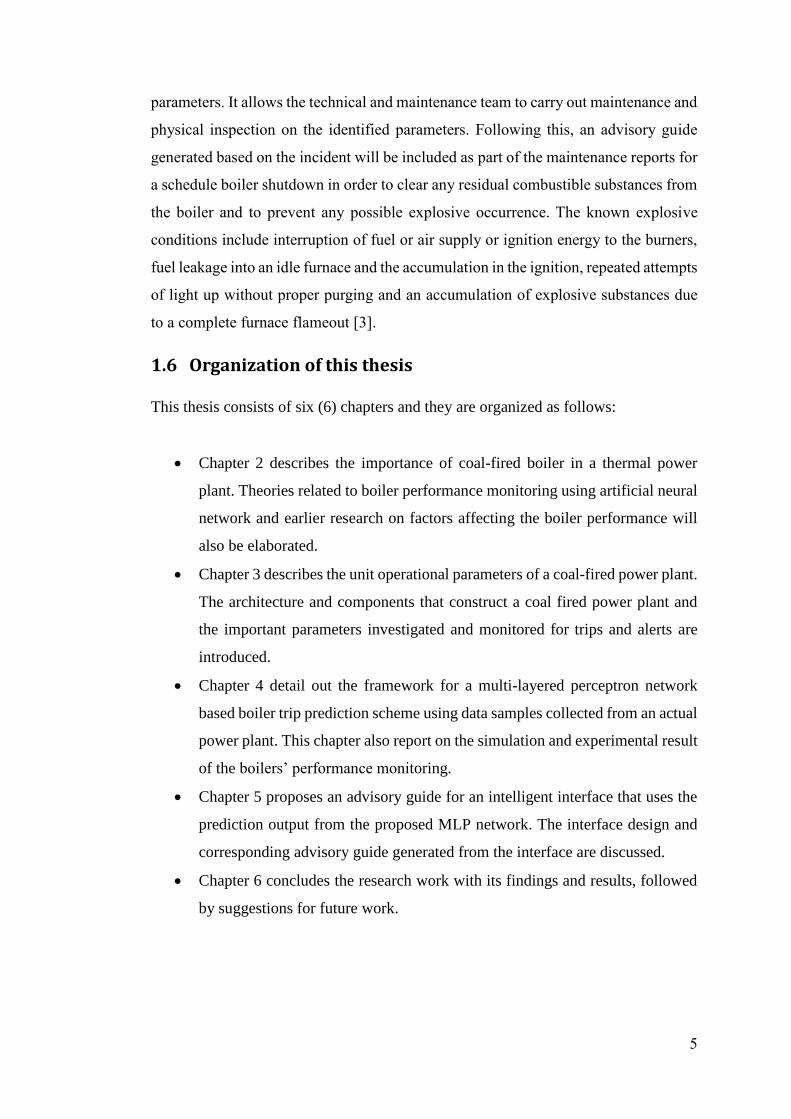
5
parameters. It allows the technical and maintenance team to carry out maintenance and
physical inspection on the identified parameters. Following this, an advisory guide
generated based on the incident will be included as part of the maintenance reports for
a schedule boiler shutdown in order to clear any residual combustible substances from
the boiler and to prevent any possible explosive occurrence. The known explosive
conditions include interruption of fuel or air supply or ignition energy to the burners,
fuel leakage into an idle furnace and the accumulation in the ignition, repeated attempts
of light up without proper purging and an accumulation of explosive substances due
to a complete furnace flameout [3].
1.6 Organization of this thesis
This thesis consists of six (6) chapters and they are organized as follows:
Chapter 2 describes the importance of coal-fired boiler in a thermal power
plant. Theories related to boiler performance monitoring using artificial neural
network and earlier research on factors affecting the boiler performance will
also be elaborated.
Chapter 3 describes the unit operational parameters of a coal-fired power plant.
The architecture and components that construct a coal fired power plant and
the important parameters investigated and monitored for trips and alerts are
introduced.
Chapter 4 detail out the framework for a multi-layered perceptron network
based boiler trip prediction scheme using data samples collected from an actual
power plant. This chapter also report on the simulation and experimental result
of the boilers’ performance monitoring.
Chapter 5 proposes an advisory guide for an intelligent interface that uses the
prediction output from the proposed MLP network. The interface design and
corresponding advisory guide generated from the interface are discussed.
Chapter 6 concludes the research work with its findings and results, followed
by suggestions for future work.

6
Chapter 2. Review of Intelligent Approach to a Coal-Fired Power Plant Boiler Trip Monitoring System 2.1 Introduction
In industries, a reliable alarm system is crucial to provide an advance warning
to plant operators before abnormal reading is measured beyond the normal threshold.
The existing power trip monitoring systems are limited in diagnosing and processing
problems reported on screen; often display information that are not the root cause
problems [2]. Instead, the alarms simply indicate that a problem exists, yet no course
of action is provided as a guideline for operators to analyse before conducting a
physical inspection of the equipment. When an upgrade of electrical and mechanical
systems was carried out, the human factors are neglected. Plant operators need to be
informed with clear and informative instructions on what actions to take in order to
recognize signals exhibit by the equipment monitoring system [7]. Therefore, the
current situation in fault and trip diagnosis of a boiler in a utility plant reports many
improvements in its approaches to assess the health of the equipment and system
involved. These include monitoring the operational readings such as temperature,
pressure, vibration and noise; physical inspection of the boiler unit for leakage, cracks,
stress or other defects, and most recently, observation of pre-existing condition using
historical data to predict the trips and unscheduled shut down of the utility unit [8]–
[16]. However, an adequate response time is identified to be another important
requirement especially in a real time environment. In this chapter, the importance of
integrating the existing trip monitoring system in the current power generating plant
in Malaysia with an intelligent approach is discussed.
2.2 Importance of a boiler unit in a power plant
The continuous evaluation of the boiler’s operating condition helps to identify
any features that may affect the quality, availability, capacity, safety, risk and cost
incurred relating to the boiler unit. The practice has in many cases extends the time

7
between maintenance shutdowns, minimizes downtime and ensuring the equipment is
maintain accordingly. It helps operators to be more informed of the decision for
performance optimization and its maintenance needs [17]. For instance, it will notify
operators when a major problem may be developing and this allows the operators to
anticipate a potential failure and to take action to resolve it. Any observed abnormal
deviations could therefore be investigated to avoid unscheduled shutdowns.
As the overall performance of an energy generating plant is evaluated by its
efficiency, it depends on its boilers for continuous operation and maintenance. The
efficiency of a boiler may be due to different reasons, such as poor combustion, heat
transfer fouling, including poor operation and maintenance. In recent years, the
deterioration of fuel and water quality is also considered as contributing factors to
thermal inefficiencies in boilers. The normal practice to evaluate boiler efficiency is
by defining its ratio of heat output to the heat input [18]. This method is proven to
assist plant operators to quickly evaluate the boiler’s health because it requires less
operational parameter monitoring. Operational parameters monitoring can help
operators identify the root cause problem more efficiently. Additionally, observation
of pre-existing condition based on historical data may provide insights of the
degradation of the equipment to better understand ways to carry out scheduled
maintenance works.
2.3 Factors contributing to boiler trips and efforts to reduce the
impact on energy production
Issues leading to tripping of boiler in a coal-fired power plant are usually
related to the coal combustion. These issues include the state of the coal when
transferred into the furnace, such as sticky coal blocking conveyors and chutes, fine
coal causing stockpile slumps following heavy rain and also wet coal. Other condition
such as contaminated coal supply with large rocks or pieces of steel that can damage
the conveyors and pulverizing mills may also contribute to boiler instability due to the
excessive holdup in mills [2].
There are limited literatures reporting on the exact cause of faulty condition
leading to a trip and shut down in a coal-fired boiler of a power plant. Nevertheless,
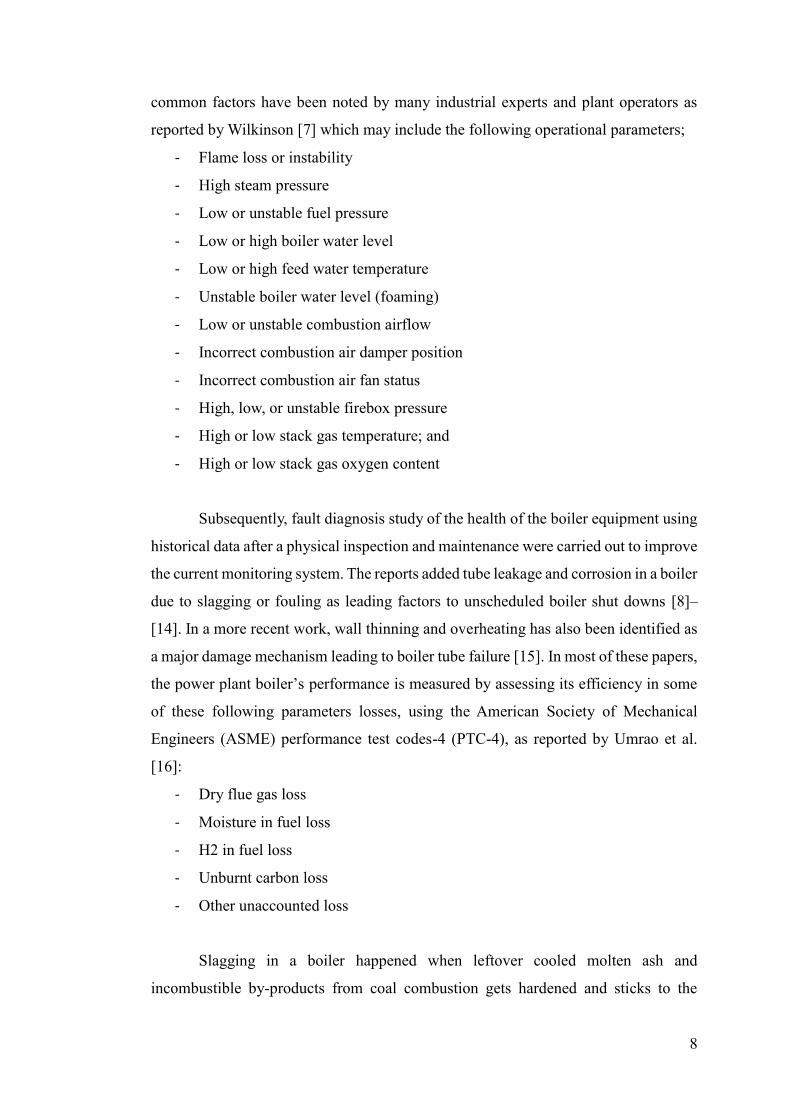
8
common factors have been noted by many industrial experts and plant operators as
reported by Wilkinson [7] which may include the following operational parameters;
- Flame loss or instability
- High steam pressure
- Low or unstable fuel pressure
- Low or high boiler water level
- Low or high feed water temperature
- Unstable boiler water level (foaming)
- Low or unstable combustion airflow
- Incorrect combustion air damper position
- Incorrect combustion air fan status
- High, low, or unstable firebox pressure
- High or low stack gas temperature; and
- High or low stack gas oxygen content
Subsequently, fault diagnosis study of the health of the boiler equipment using
historical data after a physical inspection and maintenance were carried out to improve
the current monitoring system. The reports added tube leakage and corrosion in a boiler
due to slagging or fouling as leading factors to unscheduled boiler shut downs [8]–
[14]. In a more recent work, wall thinning and overheating has also been identified as
a major damage mechanism leading to boiler tube failure [15]. In most of these papers,
the power plant boiler’s performance is measured by assessing its efficiency in some
of these following parameters losses, using the American Society of Mechanical
Engineers (ASME) performance test codes-4 (PTC-4), as reported by Umrao et al.
[16]:
- Dry flue gas loss
- Moisture in fuel loss
- H2 in fuel loss
- Unburnt carbon loss
- Other unaccounted loss
Slagging in a boiler happened when leftover cooled molten ash and
incombustible by-products from coal combustion gets hardened and sticks to the
9
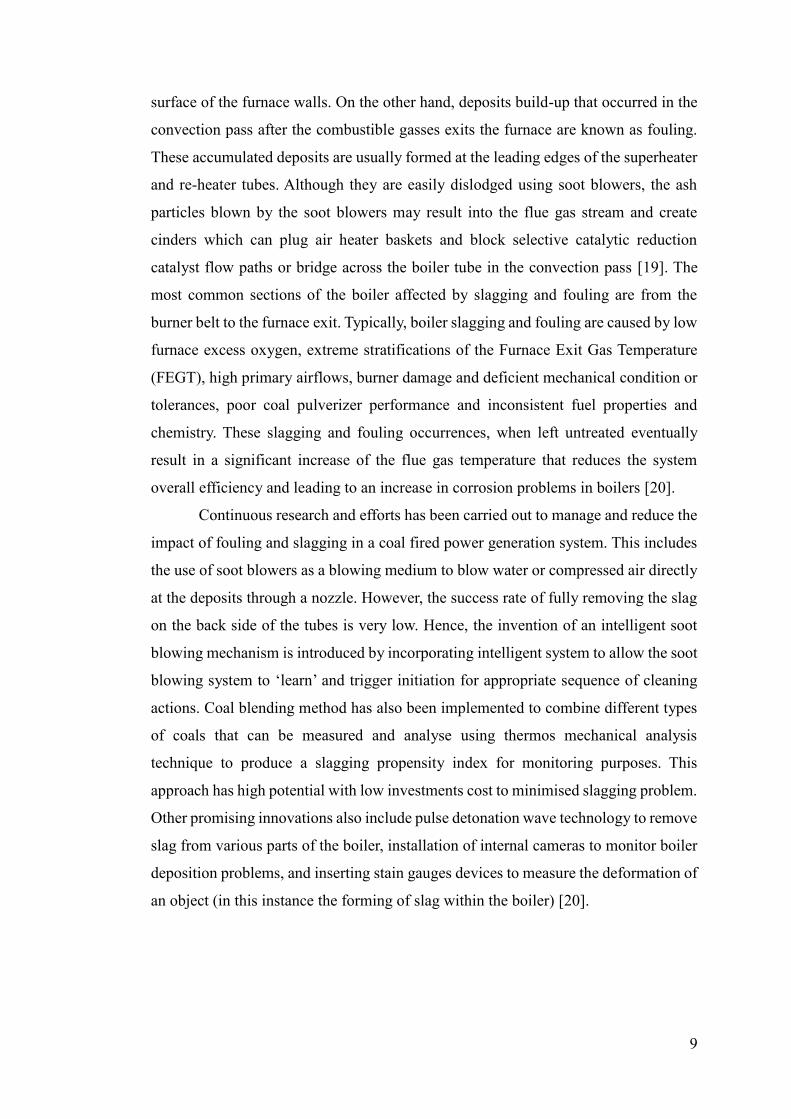
surface of the furnace walls. On the other hand, deposits build-up that occurred in the
convection pass after the combustible gasses exits the furnace are known as fouling.
These accumulated deposits are usually formed at the leading edges of the superheater
and re-heater tubes. Although they are easily dislodged using soot blowers, the ash
particles blown by the soot blowers may result into the flue gas stream and create
cinders which can plug air heater baskets and block selective catalytic reduction
catalyst flow paths or bridge across the boiler tube in the convection pass [19]. The
most common sections of the boiler affected by slagging and fouling are from the
burner belt to the furnace exit. Typically, boiler slagging and fouling are caused by low
furnace excess oxygen, extreme stratifications of the Furnace Exit Gas Temperature
(FEGT), high primary airflows, burner damage and deficient mechanical condition or
tolerances, poor coal pulverizer performance and inconsistent fuel properties and
chemistry. These slagging and fouling occurrences, when left untreated eventually
result in a significant increase of the flue gas temperature that reduces the system
overall efficiency and leading to an increase in corrosion problems in boilers [20].
Continuous research and efforts has been carried out to manage and reduce the
impact of fouling and slagging in a coal fired power generation system. This includes
the use of soot blowers as a blowing medium to blow water or compressed air directly
at the deposits through a nozzle. However, the success rate of fully removing the slag
on the back side of the tubes is very low. Hence, the invention of an intelligent soot
blowing mechanism is introduced by incorporating intelligent system to allow the soot
blowing system to ‘learn’ and trigger initiation for appropriate sequence of cleaning
actions. Coal blending method has also been implemented to combine different types
of coals that can be measured and analyse using thermos mechanical analysis
technique to produce a slagging propensity index for monitoring purposes. This
approach has high potential with low investments cost to minimised slagging problem.
Other promising innovations also include pulse detonation wave technology to remove
slag from various parts of the boiler, installation of internal cameras to monitor boiler
deposition problems, and inserting stain gauges devices to measure the deformation of
an object (in this instance the forming of slag within the boiler) [20].
10
2.4 Intelligent Monitoring System for Coal-Fired Boiler Trip
Condition
A Power Plant Boiler Condition Monitoring System is an automated computer
system that tracks the condition of the boiler unit continuously. The system retrieves
the boiler operational parameter readings from the sensors with a one-minute time
interval. The continuous data reading provided the plant operator with information on
the health of the boiler unit. An addition to monitoring and retrieving data, the system
can also be incorporated with an intelligent mechanism. For instance, an Intelligent
Monitoring Interface (IMI). It is a human-machine interface system that tracks and
improves the responses of an event associated with monitored equipment. It enables
user to perform potentially complex tasks more effectively and quickly with greater
accuracy. This is made possible by presenting users with information on the equipment
condition, user’s next actions, and warnings of undesirable consequences and
suggestions of an alternative action [21].
The study of developing a computer system that is equipped with the capability
of processing information intellectually like a human being has been conducted since
the early 1950s, known as Artificial Intelligence (AI) [22]. One of the branches of AI
is machine learning. It is a computer with learning capacity that learns through
experience or prior knowledge and recognizes patterns of outcome in a huge amount
of data to carry out a given task [23].
The most common techniques of an AI found in power systems applications
include Expert Systems, Fuzzy Logic, Genetic Algorithm (GA) and Artificial Neural
Network (ANN) [24]–[28]. Recent studies have suggested ANN as one of the most
popular schemes for power systems fault diagnosis, where the sources of diagnostic
information derive from the error between predicted and actual behaviour of the
system. The required expectation (prediction) is based on a model of what should
happen. Such techniques have been very well researched and implemented in many
utility plants [29]–[31].
An ANN is a model of reasoning based on the human brain [22], and it is one
of the most preferred branches of the study of AI. Due to its interconnected structure
of neurons and numerical weights that mimics the biological neurons of a human brain;
it learns to understand the relationship between the input parameters and variable by
11
acquiring knowledge through pre-recorded data also known as training process. One
of the key advantages of an ANN is that it is adaptable due to its non-linear
characteristics [32]. Instead of being built from specific sets of parameter value, the
neural and adaptive systems use external data to automatically set their parameters
[33]. The group of interconnected artificial neurons in an ANN processes information
in parallel. The performance of the network is continuously improved by rendering it
to be “aware” of its output value through a performance feedback loop that includes a
cost function. The feedback is used to adjust the network parameters through
systematic procedures called learning or training rules, in order to improve the system
output with respect to the desired goal [33]. This process is called ‘supervised
learning’. It is an iterative process that continues to loop until an acceptable level of
errors is obtained. The number of time for a whole set of data (both a forward and a
backward pass) is processed is known as an epoch. This method is defined as the error
back-propagation training [29].
Meanwhile, another popular intelligent system is known as an expert system
(ES). It is a computer software program built to perform a narrow, specialized domain
problem solving using existing expert knowledge acquired from a set of rules, decision
trees, models and frames. The simplicity of each given rules and existing information
allows a quick respond to the identified problem through reasoning, heuristics and
judgement. This method is useful when it involves large amount of data that needs to
be processed in a short period of time [22], [25]–[27]. However, it is limited to produce
good feedbacks to only known situation, where ES may exhibit important gaps in
knowledge when an unknown incident occurred. This is due to the fact that ES are
unable to learn or adapt to new problems or situation that are not included in its
knowledge database.
There is also an optimization technique, known as Genetic Algorithm (GA). It
is based on biological metaphors, which is the process of natural selection and genetics
[26], [27]. It is known to be highly efficient at reaching a very near optimal solution in
a computationally efficient manner, where it continuously use a set of candidate
description of the given system called population to gradually improve the quality of
the population until sufficient level of quality is achieved or no further improvement
occurs [25], [27]. Since the algorithm is simple and robust, it is a very good technique
for solving complex problems and nonlinear problems that usually occurred in power
generation planning, transmission and distribution system to properly adjust its
12
parameter’s excitation and control problem of reactive power compensation and
voltage [28]. However, GA is widely applied for optimization, and not classification
of data. It is not known if GA is able to identify and recognize a trip pattern from a
normal condition.
The study of fuzzy logic involves classes of objects with uncertain boundaries,
it allows uncertainties in problems formulation to be expressed and processed [25],
[27]. This approach is similar to a human decision making with an ability to produce
exact and accurate solutions from an approximate information and data. The
fuzzification provides superior expressive power, higher generality and an improved
capability that allows ambiguity throughout an analysis that specifies the available
information and minimizes the problem complexity. Fuzzy logic is commonly applied
in stability analysis and enhancement, power system control, fault diagnosis and
security assessments [26]. Although it can be a very useful tool in a control system,
implementing fuzzy logic as a predictor in a trip monitoring system may not yield
efficiency required for the proposed interface in this research.
2.5 Current methods to improve the monitoring system
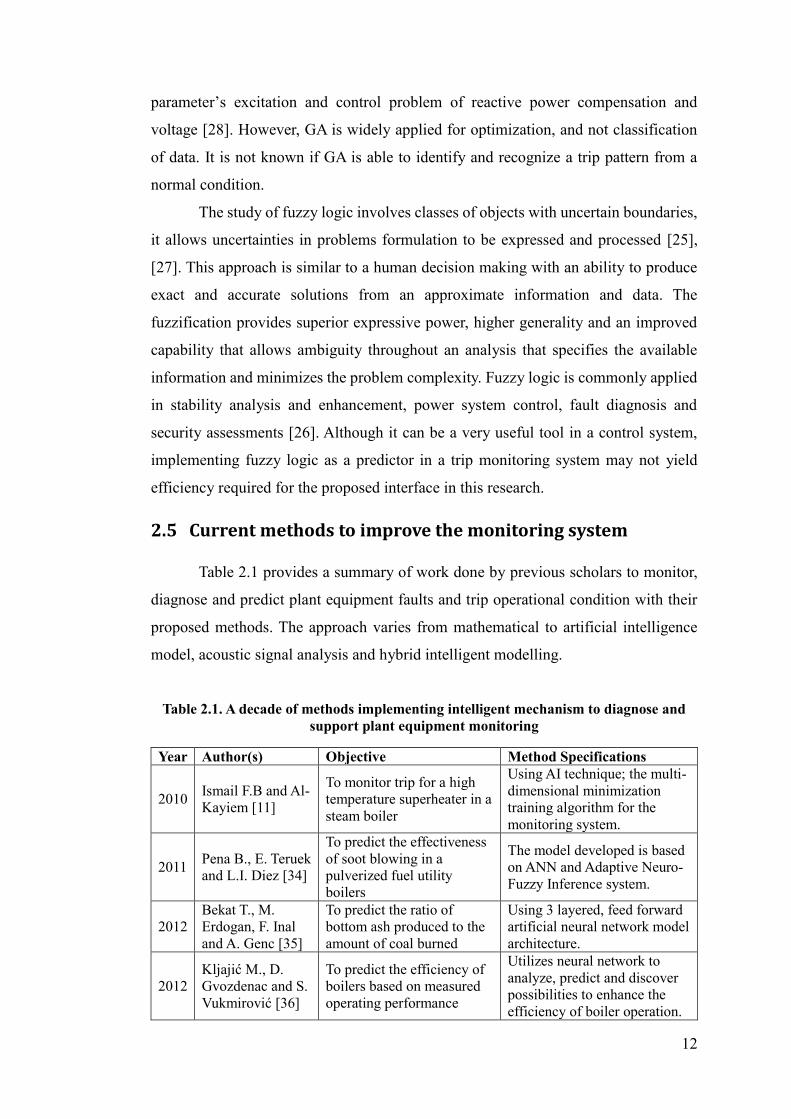
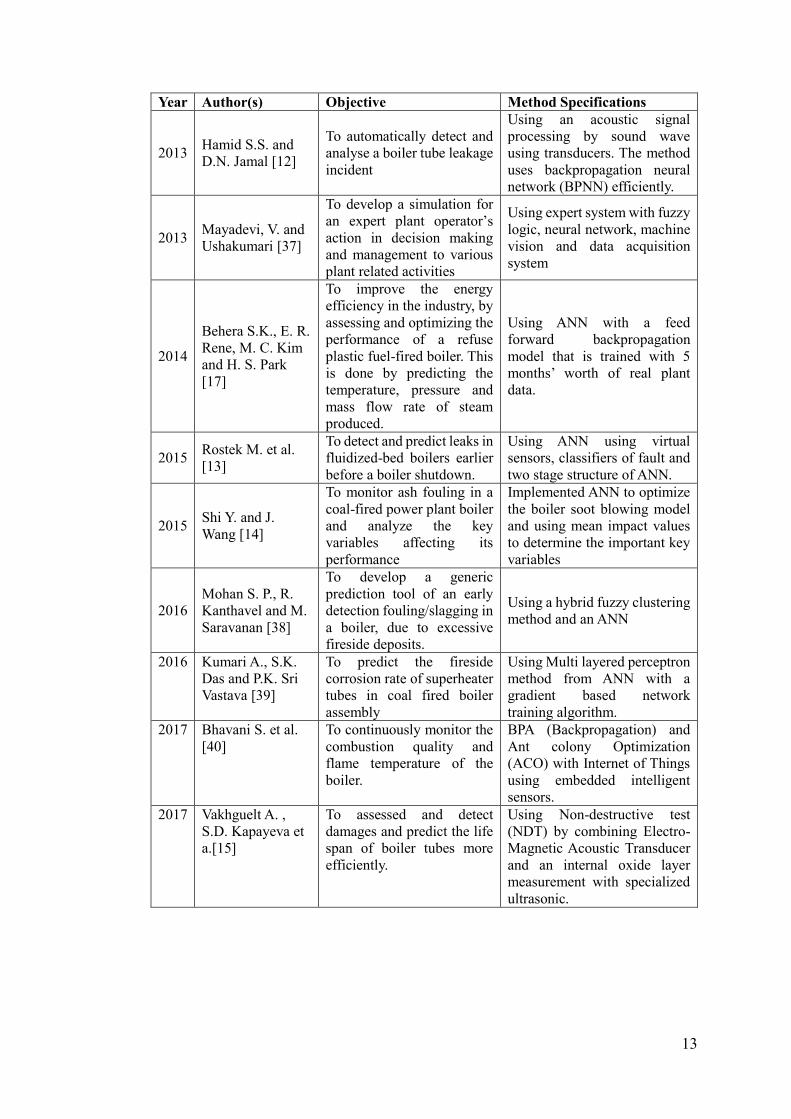
Table 2.1 provides a summary of work done by previous scholars to monitor,
diagnose and predict plant equipment faults and trip operational condition with their
proposed methods. The approach varies from mathematical to artificial intelligence
model, acoustic signal analysis and hybrid intelligent modelling.
Table 2.1. A decade of methods implementing intelligent mechanism to diagnose and
support plant equipment monitoring
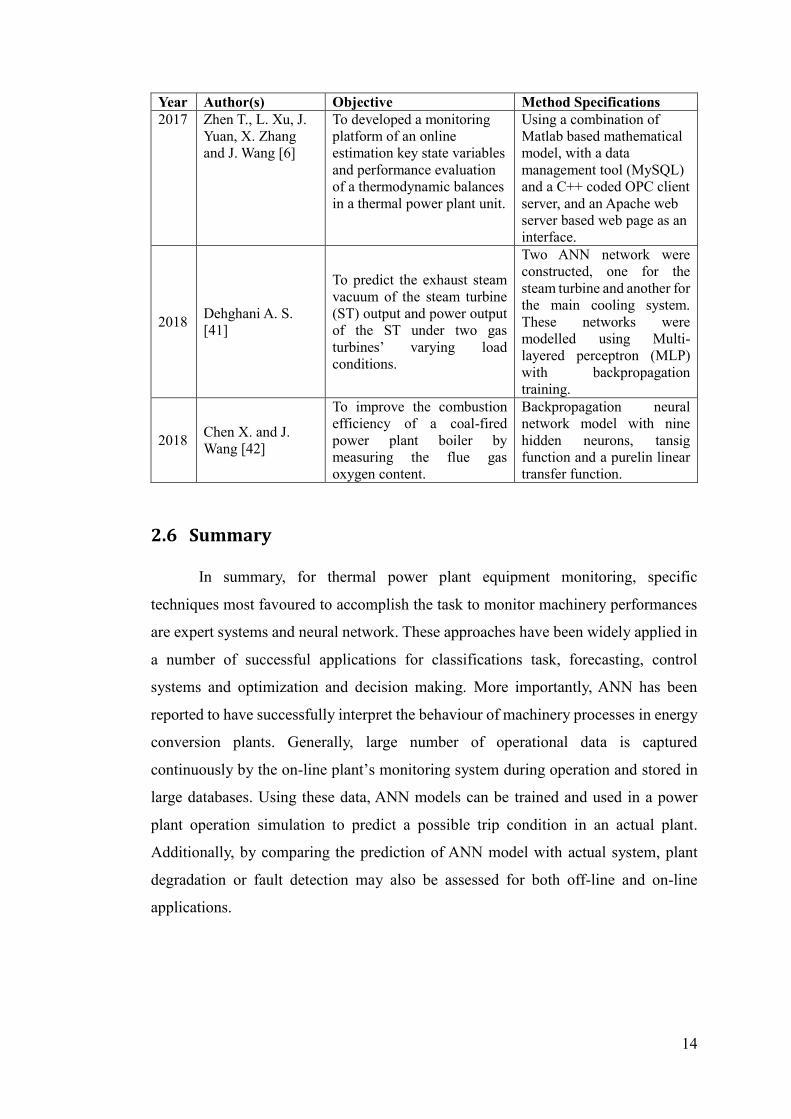
Year Author(s) Objective Method Specifications
2010 Ismail F.B and Al-
Kayiem [11]
To monitor trip for a high
temperature superheater in a
steam boiler
Using AI technique; the multi-
dimensional minimization
training algorithm for the
monitoring system.
2011 Pena B., E. Teruek
and L.I. Diez [34]
To predict the effectiveness
of soot blowing in a
pulverized fuel utility
boilers
The model developed is based
on ANN and Adaptive Neuro-
Fuzzy Inference system.
2012
Bekat T., M.
Erdogan, F. Inal
and A. Genc [35]
To predict the ratio of
bottom ash produced to the
amount of coal burned
Using 3 layered, feed forward
artificial neural network model
architecture.
2012
Kljajić M., D.
Gvozdenac and S.
Vukmirović [36]
To predict the efficiency of
boilers based on measured
operating performance
Utilizes neural network to
analyze, predict and discover
possibilities to enhance the
efficiency of boiler operation.
13
Year Author(s) Objective Method Specifications
2013 Hamid S.S. and
D.N. Jamal [12]
To automatically detect and
analyse a boiler tube leakage
incident
Using an acoustic signal
processing by sound wave
using transducers. The method
uses backpropagation neural
network (BPNN) efficiently.
2013 Mayadevi, V. and
Ushakumari [37]
To develop a simulation for
an expert plant operator’s
action in decision making
and management to various
plant related activities
Using expert system with fuzzy
logic, neural network, machine
vision and data acquisition
system
2014
Behera S.K., E. R.
Rene, M. C. Kim
and H. S. Park
[17]
To improve the energy
efficiency in the industry, by
assessing and optimizing the
performance of a refuse
plastic fuel-fired boiler. This
is done by predicting the
temperature, pressure and
mass flow rate of steam
produced.
Using ANN with a feed
forward backpropagation
model that is trained with 5
months’ worth of real plant
data.
2015 Rostek M. et al.
[13]
To detect and predict leaks in
fluidized-bed boilers earlier
before a boiler shutdown.
Using ANN using virtual
sensors, classifiers of fault and
two stage structure of ANN.
2015 Shi Y. and J.
Wang [14]
To monitor ash fouling in a
coal-fired power plant boiler
and analyze the key
variables affecting its
performance
Implemented ANN to optimize
the boiler soot blowing model
and using mean impact values
to determine the important key
variables
2016
Mohan S. P., R.
Kanthavel and M.
Saravanan [38]
To develop a generic
prediction tool of an early
detection fouling/slagging in
a boiler, due to excessive
fireside deposits.
Using a hybrid fuzzy clustering
method and an ANN
2016 Kumari A., S.K.
Das and P.K. Sri
Vastava [39]
To predict the fireside
corrosion rate of superheater
tubes in coal fired boiler
assembly
Using Multi layered perceptron
method from ANN with a
gradient based network
training algorithm.
2017 Bhavani S. et al.
[40]
To continuously monitor the
combustion quality and
flame temperature of the
boiler.
BPA (Backpropagation) and
Ant colony Optimization
(ACO) with Internet of Things
using embedded intelligent
sensors.
2017 Vakhguelt A. ,
S.D. Kapayeva et
a.[15]
To assessed and detect
damages and predict the life
span of boiler tubes more
efficiently.
Using Non-destructive test
(NDT) by combining Electro-
Magnetic Acoustic Transducer
and an internal oxide layer
measurement with specialized
ultrasonic.
14
Year Author(s) Objective Method Specifications
2017 Zhen T., L. Xu, J.
Yuan, X. Zhang
and J. Wang [6]
To developed a monitoring
platform of an online
estimation key state variables
and performance evaluation
of a thermodynamic balances
in a thermal power plant unit.
Using a combination of
Matlab based mathematical
model, with a data
management tool (MySQL)
and a C++ coded OPC client
server, and an Apache web
server based web page as an
interface.
2018 Dehghani A. S.
[41]
To predict the exhaust steam
vacuum of the steam turbine
(ST) output and power output
of the ST under two gas
turbines’ varying load
conditions.
Two ANN network were
constructed, one for the
steam turbine and another for
the main cooling system.
These networks were
modelled using Multi-
layered perceptron (MLP)
with backpropagation
training.
2018 Chen X. and J.
Wang [42]
To improve the combustion
efficiency of a coal-fired
power plant boiler by
measuring the flue gas
oxygen content.
Backpropagation neural
network model with nine
hidden neurons, tansig
function and a purelin linear
transfer function.
2.6 Summary
In summary, for thermal power plant equipment monitoring, specific
techniques most favoured to accomplish the task to monitor machinery performances
are expert systems and neural network. These approaches have been widely applied in
a number of successful applications for classifications task, forecasting, control
systems and optimization and decision making. More importantly, ANN has been
reported to have successfully interpret the behaviour of machinery processes in energy
conversion plants. Generally, large number of operational data is captured
continuously by the on-line plant’s monitoring system during operation and stored in
large databases. Using these data, ANN models can be trained and used in a power
plant operation simulation to predict a possible trip condition in an actual plant.
Additionally, by comparing the prediction of ANN model with actual system, plant
degradation or fault detection may also be assessed for both off-line and on-line
applications.

15
Chapter 3. Coal-Fired Power Plant and Boiler Unit Operational Parameters 3.1 Introduction
A coal fired power plant is a complex facility. It consists of fuel supply system
(coal is used), combustion and steam generators system, environmental safety control
system, turbine and electric generator system, condenser and feed water system and
heat extraction and rejection system. The focus of this research will be the combustion
and steam generator system, involving the boiler unit. This chapter briefly describes
the functional and operational control of the boiler and its parameters. It is divided into
three sections. Section 3.2 will illustrate the six components of the entire power plant
and its functionality. Section 3.3 will describe the coal-fired boiler unit and its
importance. While section 3.4 presents the operational parameters selected to be used
and monitored to identify the trip condition for a boiler unit.
3.2 Functional & Operational Control
Electricity is an essential utility for a household, thus the existence of power
plants that could process our natural resources such as coal or gas into energy are very
important. For instance, a coal-fired power plant can generate up to 700 MW of power,
which can provide electricity for about 500,000 residential and business units
continuously.
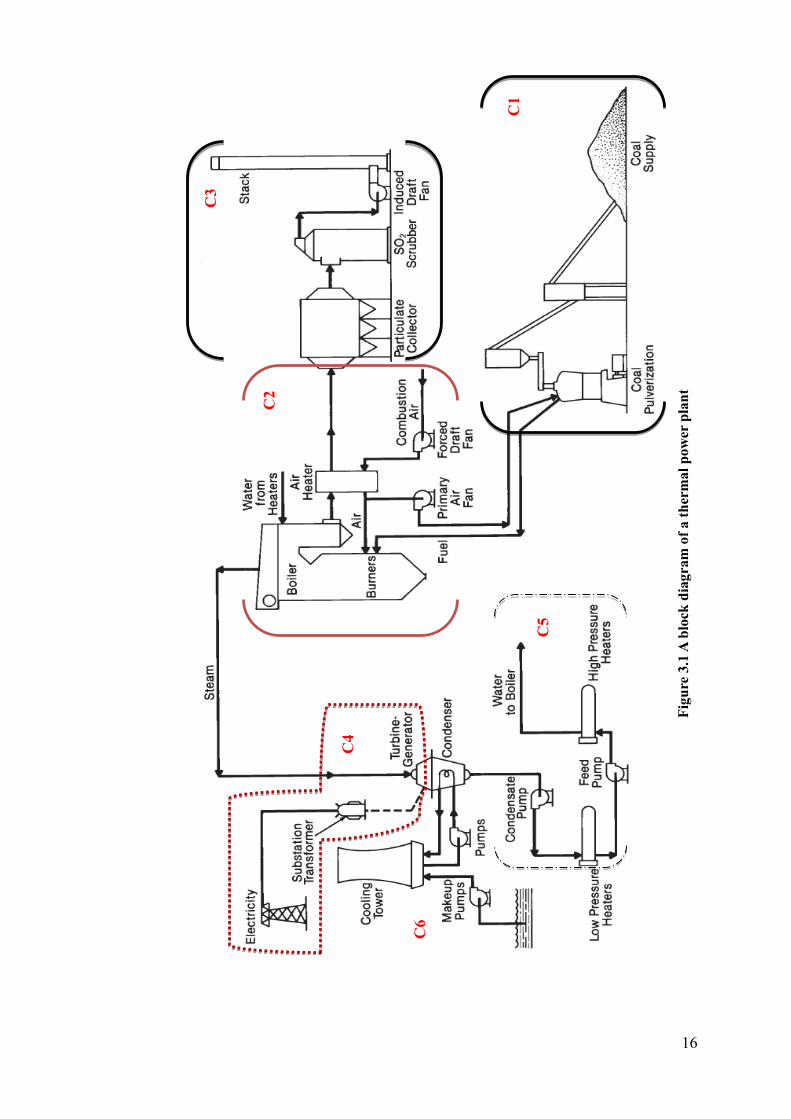
As illustrated in Figure 3.1, a thermal power plant consists of the following
components:
C1: Coal supply and preparation system
C2: A combustion and steam generator
C3: Environmental and safety control system
C4: Turbine generator and electric production system
C5: Condenser and feed water system
C6: Heat extraction and rejection system which includes the cooling tower.
16
Fig
ure
3.1
A b
lock
dia
gra
m o
f a t
her
mal
pow
er p
lan
t
C1
C2
C3
C5
C4
C6
17
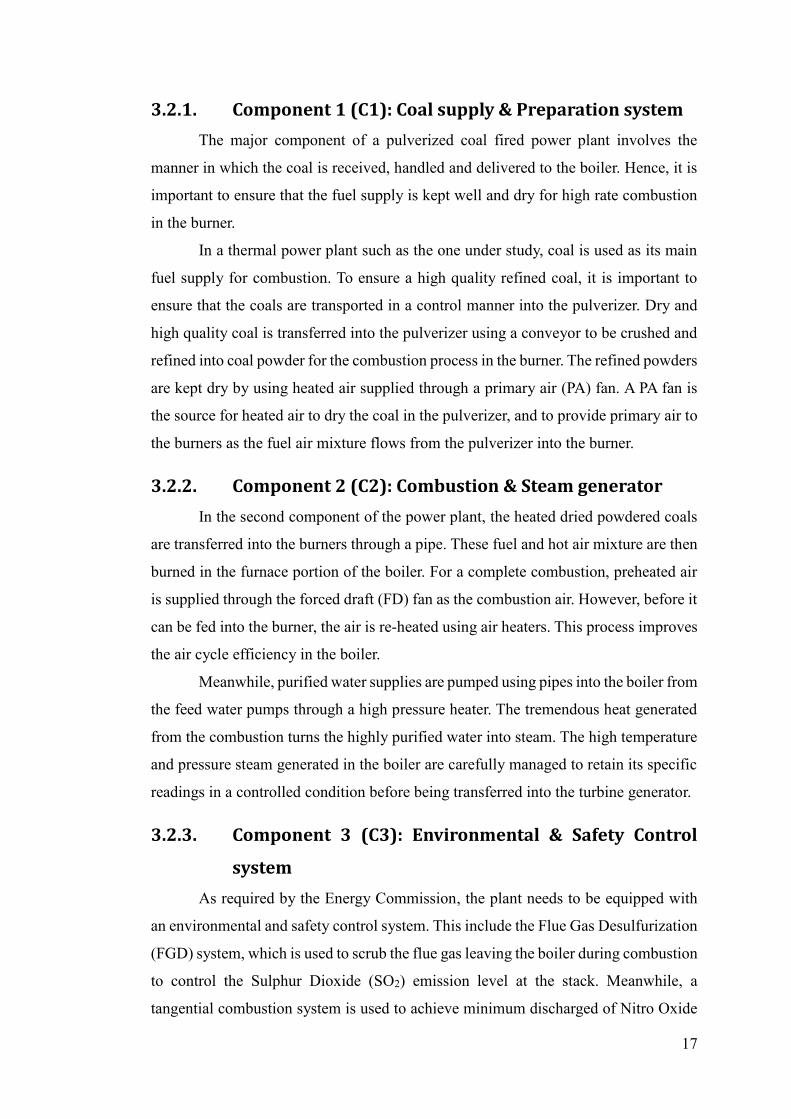
3.2.1. Component 1 (C1): Coal supply & Preparation system
The major component of a pulverized coal fired power plant involves the
manner in which the coal is received, handled and delivered to the boiler. Hence, it is
important to ensure that the fuel supply is kept well and dry for high rate combustion
in the burner.
In a thermal power plant such as the one under study, coal is used as its main
fuel supply for combustion. To ensure a high quality refined coal, it is important to
ensure that the coals are transported in a control manner into the pulverizer. Dry and
high quality coal is transferred into the pulverizer using a conveyor to be crushed and
refined into coal powder for the combustion process in the burner. The refined powders
are kept dry by using heated air supplied through a primary air (PA) fan. A PA fan is
the source for heated air to dry the coal in the pulverizer, and to provide primary air to
the burners as the fuel air mixture flows from the pulverizer into the burner.
3.2.2. Component 2 (C2): Combustion & Steam generator
In the second component of the power plant, the heated dried powdered coals
are transferred into the burners through a pipe. These fuel and hot air mixture are then
burned in the furnace portion of the boiler. For a complete combustion, preheated air
is supplied through the forced draft (FD) fan as the combustion air. However, before it
can be fed into the burner, the air is re-heated using air heaters. This process improves
the air cycle efficiency in the boiler.
Meanwhile, purified water supplies are pumped using pipes into the boiler from
the feed water pumps through a high pressure heater. The tremendous heat generated
from the combustion turns the highly purified water into steam. The high temperature
and pressure steam generated in the boiler are carefully managed to retain its specific
readings in a controlled condition before being transferred into the turbine generator.
3.2.3. Component 3 (C3): Environmental & Safety Control
system
As required by the Energy Commission, the plant needs to be equipped with
an environmental and safety control system. This include the Flue Gas Desulfurization
(FGD) system, which is used to scrub the flue gas leaving the boiler during combustion
to control the Sulphur Dioxide (SO2) emission level at the stack. Meanwhile, a
tangential combustion system is used to achieve minimum discharged of Nitro Oxide

18
(NOx) by delivering excess air to the top of the combustion zone to reduce combustion
zone stoichiometry and supress the NOx formation.
3.2.4. Component 4 (C4): Turbine Generator & Electric
production
The recovered high temperature and pressure steam from the boiler provides
the force to turn the turbine blades in the turbine generator to spin electromagnet within
copper coils in the generator. This is the process in which electricity are generated. A
substation transformer is used to distribute the electricity into its proper and safe
voltage to be supplied to residential and business units accordingly.
3.2.5. Component 5 (C5): Condenser & Feed water system
To improve the overall process efficiency in preserving energy, the steam used
in the turbine is converted back to water to be reuse as boiler feed water using the
condenser. The condensed water is recycled back into the boiler through a series of
pumps and heat exchangers called feed water heaters. These processes have indirectly
increases the pressure and temperature of the water prior to its re-entering the boiler.
3.2.6. Component 6 (C6): Heat extraction & Rejection system
At the final stage of the energy conversion process, the remaining cooling water
that passes through the condenser will absorb the rejected heat from condensing and
releasing it to the atmosphere through the cooling tower. Any excess steam is cooled
and condensed back into water which is then circulated back into the boiler to repeat
the whole process. This essential cooling process requires large quantities of fresh
water; thus, most thermal power plants are located on lakes or rivers.
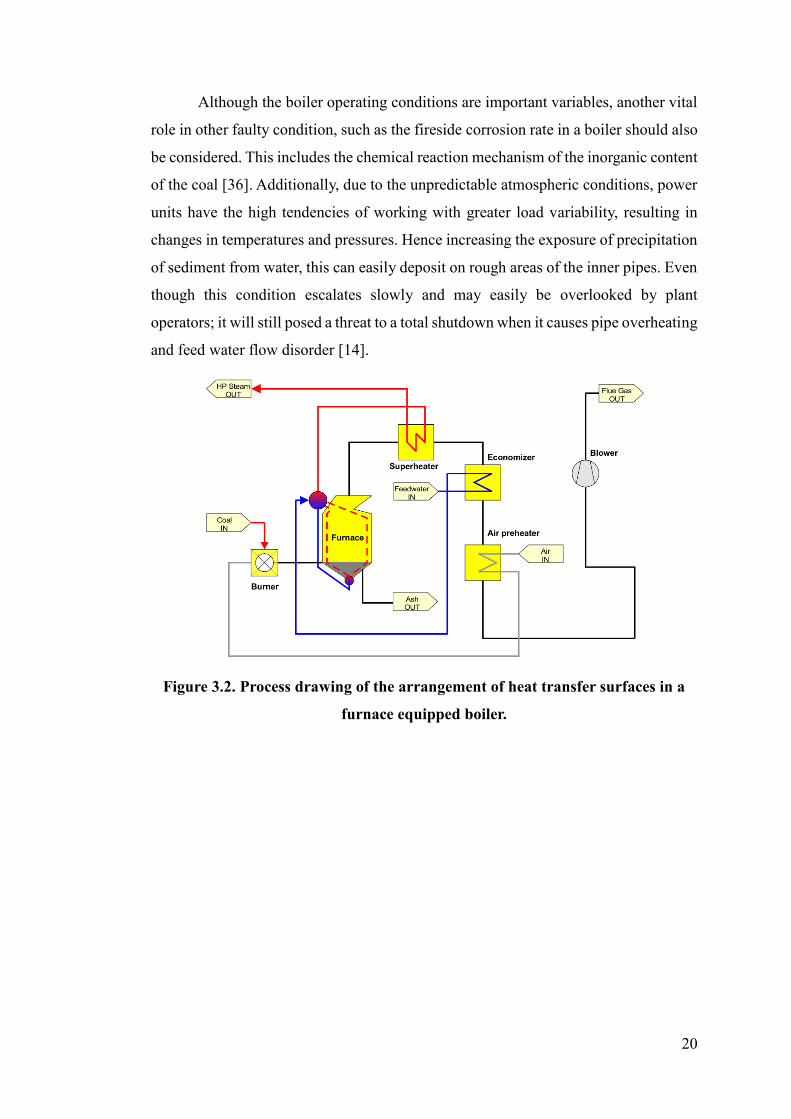
3.3 Boiler unit in a Thermal Power Plant
A boiler is designed to optimize thermal efficiency and to economically benefit
an energy conversion plant. Its main purpose is to transfer heat from flue gas to water
or steam circulation. Heat transfer surfaces in a boiler play an important role. They
include the furnace, evaporators, superheaters, economizers and air preheaters. These
surfaces are the main interior built of the boiler from the furnace to the boiler exhaust.
It is crucial to have the correct arrangement of the heat surfaces within the boiler.
Because it dictates the durability and fouling of the material use, temperature of steam
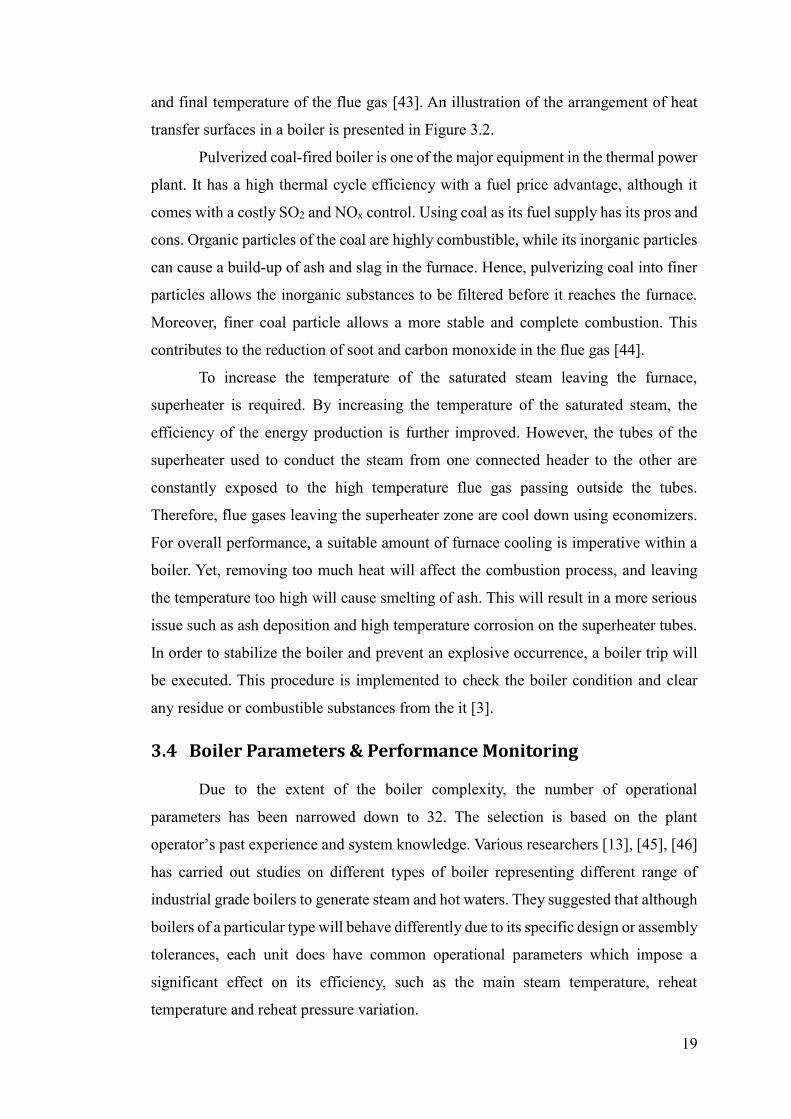
19
and final temperature of the flue gas [43]. An illustration of the arrangement of heat
transfer surfaces in a boiler is presented in Figure 3.2.
Pulverized coal-fired boiler is one of the major equipment in the thermal power
plant. It has a high thermal cycle efficiency with a fuel price advantage, although it
comes with a costly SO2 and NOx control. Using coal as its fuel supply has its pros and
cons. Organic particles of the coal are highly combustible, while its inorganic particles
can cause a build-up of ash and slag in the furnace. Hence, pulverizing coal into finer
particles allows the inorganic substances to be filtered before it reaches the furnace.
Moreover, finer coal particle allows a more stable and complete combustion. This
contributes to the reduction of soot and carbon monoxide in the flue gas [44].
To increase the temperature of the saturated steam leaving the furnace,
superheater is required. By increasing the temperature of the saturated steam, the
efficiency of the energy production is further improved. However, the tubes of the
superheater used to conduct the steam from one connected header to the other are
constantly exposed to the high temperature flue gas passing outside the tubes.
Therefore, flue gases leaving the superheater zone are cool down using economizers.
For overall performance, a suitable amount of furnace cooling is imperative within a
boiler. Yet, removing too much heat will affect the combustion process, and leaving
the temperature too high will cause smelting of ash. This will result in a more serious
issue such as ash deposition and high temperature corrosion on the superheater tubes.
In order to stabilize the boiler and prevent an explosive occurrence, a boiler trip will
be executed. This procedure is implemented to check the boiler condition and clear
any residue or combustible substances from the it [3].
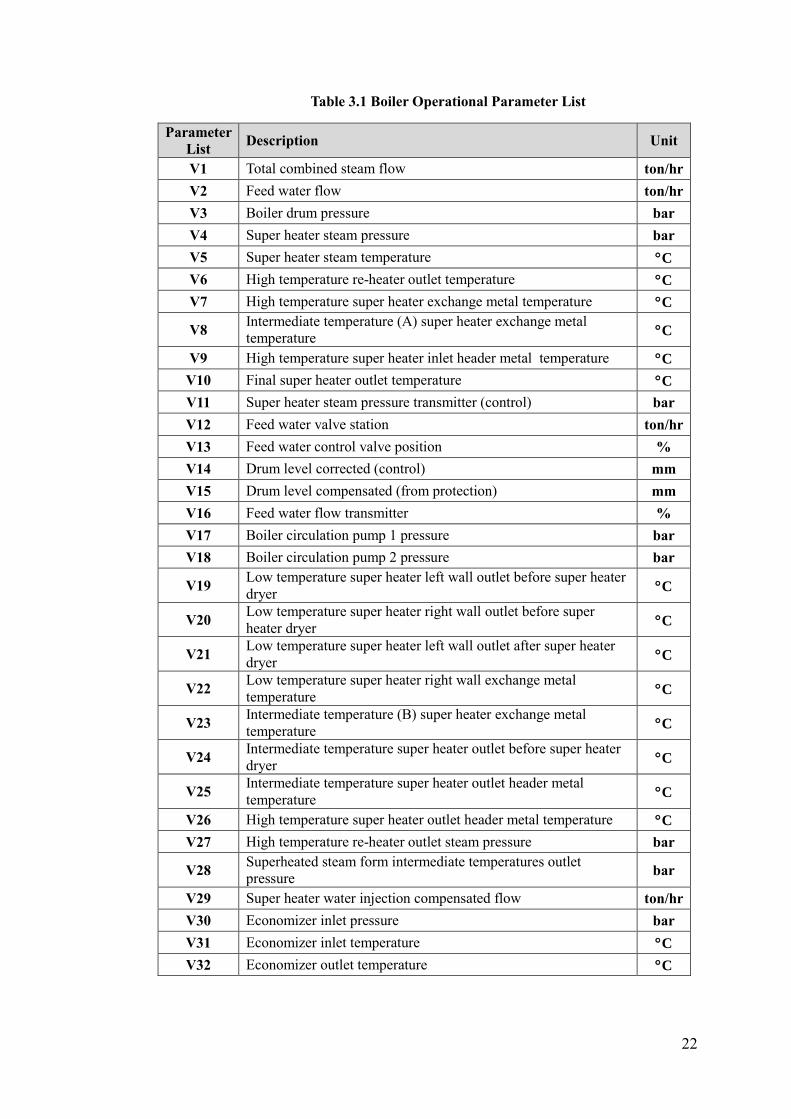
3.4 Boiler Parameters & Performance Monitoring
Due to the extent of the boiler complexity, the number of operational
parameters has been narrowed down to 32. The selection is based on the plant
operator’s past experience and system knowledge. Various researchers [13], [45], [46]
has carried out studies on different types of boiler representing different range of
industrial grade boilers to generate steam and hot waters. They suggested that although
boilers of a particular type will behave differently due to its specific design or assembly
tolerances, each unit does have common operational parameters which impose a
significant effect on its efficiency, such as the main steam temperature, reheat
temperature and reheat pressure variation.
20
Although the boiler operating conditions are important variables, another vital
role in other faulty condition, such as the fireside corrosion rate in a boiler should also
be considered. This includes the chemical reaction mechanism of the inorganic content
of the coal [36]. Additionally, due to the unpredictable atmospheric conditions, power
units have the high tendencies of working with greater load variability, resulting in
changes in temperatures and pressures. Hence increasing the exposure of precipitation
of sediment from water, this can easily deposit on rough areas of the inner pipes. Even
though this condition escalates slowly and may easily be overlooked by plant
operators; it will still posed a threat to a total shutdown when it causes pipe overheating
and feed water flow disorder [14].
Figure 3.2. Process drawing of the arrangement of heat transfer surfaces in a
furnace equipped boiler.
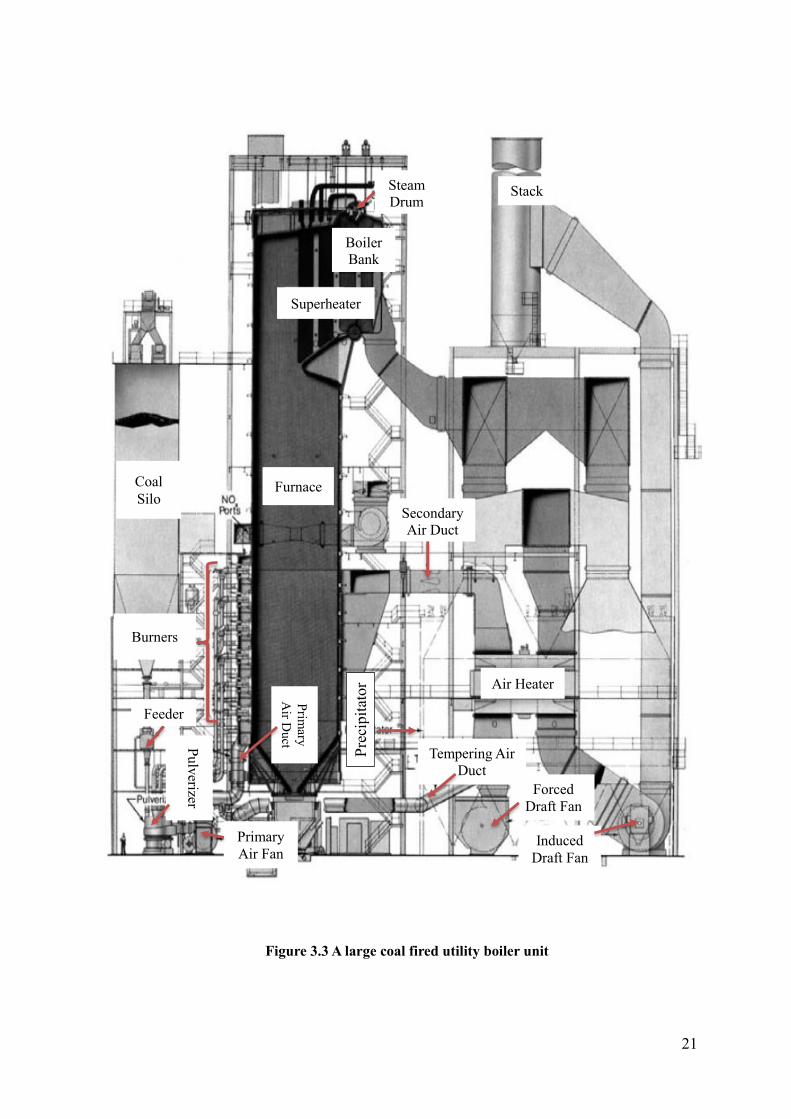
21
Figure 3.3 A large coal fired utility boiler unit
Coal
Silo Furnace
Superheater
Boiler
Bank
Steam
Drum
Feeder
Pulv
erizer
Stack
Secondary
Air Duct
Air Heater
Forced
Draft Fan
Induced
Draft Fan
Burners
Prim
ary
Air D
uct
Primary
Air Fan
Pre
cipit
ator
Tempering Air
Duct
22
Table 3.1 Boiler Operational Parameter List
Parameter
List Description Unit
V1 Total combined steam flow ton/hr
V2 Feed water flow ton/hr
V3 Boiler drum pressure bar
V4 Super heater steam pressure bar
V5 Super heater steam temperature C
V6 High temperature re-heater outlet temperature C
V7 High temperature super heater exchange metal temperature C
V8 Intermediate temperature (A) super heater exchange metal
temperature C
V9 High temperature super heater inlet header metal temperature C
V10 Final super heater outlet temperature C
V11 Super heater steam pressure transmitter (control) bar
V12 Feed water valve station ton/hr
V13 Feed water control valve position %
V14 Drum level corrected (control) mm
V15 Drum level compensated (from protection) mm
V16 Feed water flow transmitter %
V17 Boiler circulation pump 1 pressure bar
V18 Boiler circulation pump 2 pressure bar
V19 Low temperature super heater left wall outlet before super heater
dryer C
V20 Low temperature super heater right wall outlet before super
heater dryer C
V21 Low temperature super heater left wall outlet after super heater
dryer C
V22 Low temperature super heater right wall exchange metal
temperature C
V23 Intermediate temperature (B) super heater exchange metal
temperature C
V24 Intermediate temperature super heater outlet before super heater
dryer C
V25 Intermediate temperature super heater outlet header metal
temperature C
V26 High temperature super heater outlet header metal temperature C
V27 High temperature re-heater outlet steam pressure bar
V28 Superheated steam form intermediate temperatures outlet
pressure bar
V29 Super heater water injection compensated flow ton/hr
V30 Economizer inlet pressure bar
V31 Economizer inlet temperature C
V32 Economizer outlet temperature C
23
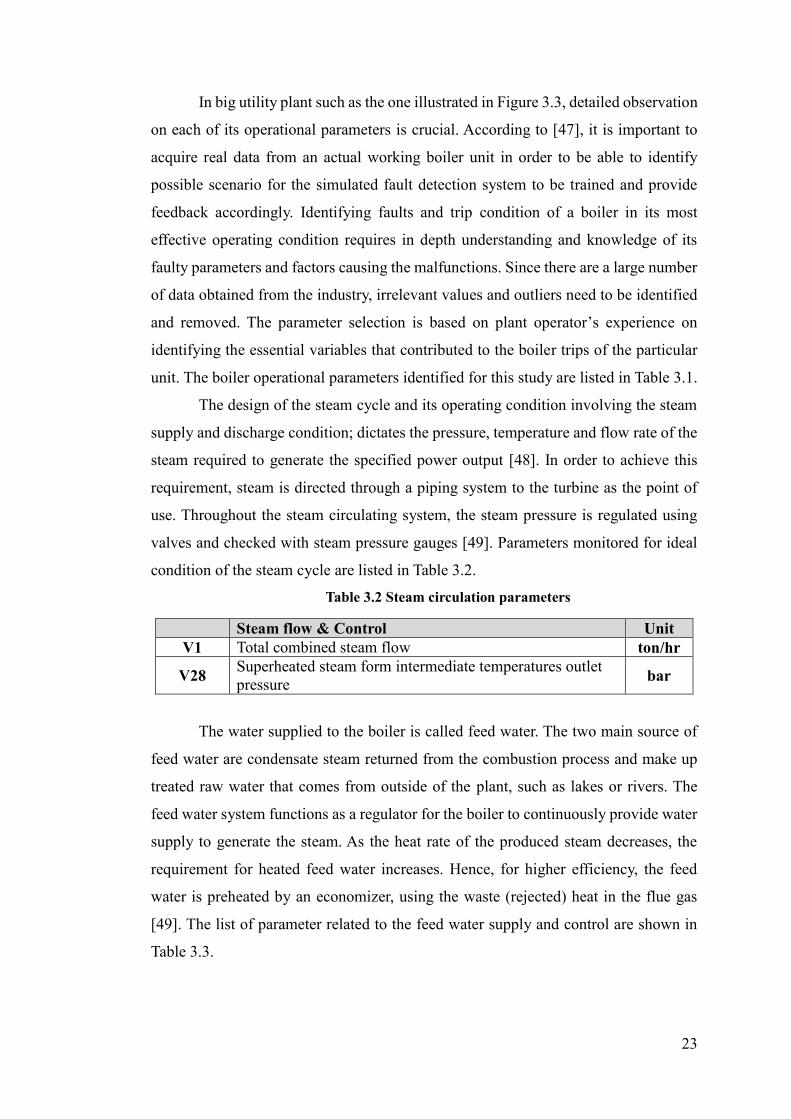
In big utility plant such as the one illustrated in Figure 3.3, detailed observation
on each of its operational parameters is crucial. According to [47], it is important to
acquire real data from an actual working boiler unit in order to be able to identify
possible scenario for the simulated fault detection system to be trained and provide
feedback accordingly. Identifying faults and trip condition of a boiler in its most
effective operating condition requires in depth understanding and knowledge of its
faulty parameters and factors causing the malfunctions. Since there are a large number
of data obtained from the industry, irrelevant values and outliers need to be identified
and removed. The parameter selection is based on plant operator’s experience on
identifying the essential variables that contributed to the boiler trips of the particular
unit. The boiler operational parameters identified for this study are listed in Table 3.1.
The design of the steam cycle and its operating condition involving the steam
supply and discharge condition; dictates the pressure, temperature and flow rate of the
steam required to generate the specified power output [48]. In order to achieve this
requirement, steam is directed through a piping system to the turbine as the point of
use. Throughout the steam circulating system, the steam pressure is regulated using
valves and checked with steam pressure gauges [49]. Parameters monitored for ideal
condition of the steam cycle are listed in Table 3.2.
Table 3.2 Steam circulation parameters
Steam flow & Control Unit
V1 Total combined steam flow ton/hr
V28 Superheated steam form intermediate temperatures outlet
pressure bar
The water supplied to the boiler is called feed water. The two main source of
feed water are condensate steam returned from the combustion process and make up
treated raw water that comes from outside of the plant, such as lakes or rivers. The
feed water system functions as a regulator for the boiler to continuously provide water
supply to generate the steam. As the heat rate of the produced steam decreases, the
requirement for heated feed water increases. Hence, for higher efficiency, the feed
water is preheated by an economizer, using the waste (rejected) heat in the flue gas
[49]. The list of parameter related to the feed water supply and control are shown in
Table 3.3.
24
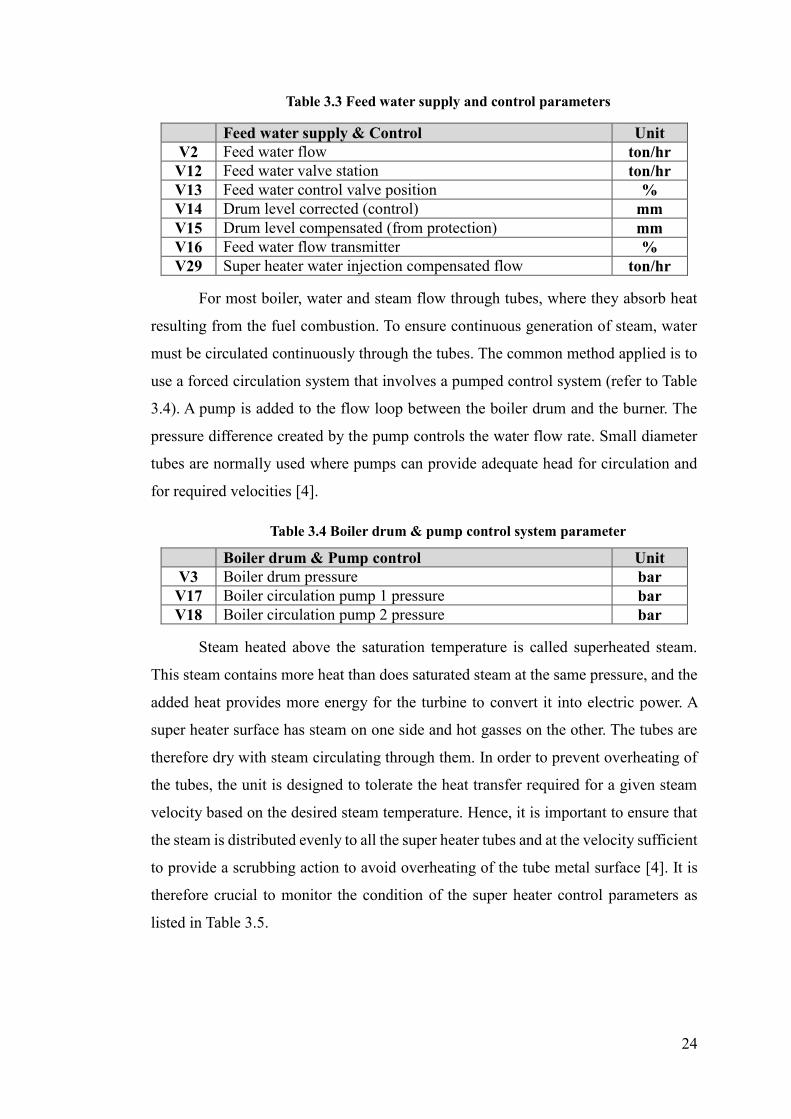
Table 3.3 Feed water supply and control parameters
Feed water supply & Control Unit
V2 Feed water flow ton/hr
V12 Feed water valve station ton/hr
V13 Feed water control valve position %
V14 Drum level corrected (control) mm
V15 Drum level compensated (from protection) mm
V16 Feed water flow transmitter %
V29 Super heater water injection compensated flow ton/hr
For most boiler, water and steam flow through tubes, where they absorb heat
resulting from the fuel combustion. To ensure continuous generation of steam, water
must be circulated continuously through the tubes. The common method applied is to
use a forced circulation system that involves a pumped control system (refer to Table
3.4). A pump is added to the flow loop between the boiler drum and the burner. The
pressure difference created by the pump controls the water flow rate. Small diameter
tubes are normally used where pumps can provide adequate head for circulation and
for required velocities [4].
Table 3.4 Boiler drum & pump control system parameter
Boiler drum & Pump control Unit
V3 Boiler drum pressure bar
V17 Boiler circulation pump 1 pressure bar
V18 Boiler circulation pump 2 pressure bar
Steam heated above the saturation temperature is called superheated steam.
This steam contains more heat than does saturated steam at the same pressure, and the
added heat provides more energy for the turbine to convert it into electric power. A
super heater surface has steam on one side and hot gasses on the other. The tubes are
therefore dry with steam circulating through them. In order to prevent overheating of
the tubes, the unit is designed to tolerate the heat transfer required for a given steam
velocity based on the desired steam temperature. Hence, it is important to ensure that
the steam is distributed evenly to all the super heater tubes and at the velocity sufficient
to provide a scrubbing action to avoid overheating of the tube metal surface [4]. It is
therefore crucial to monitor the condition of the super heater control parameters as
listed in Table 3.5.
25
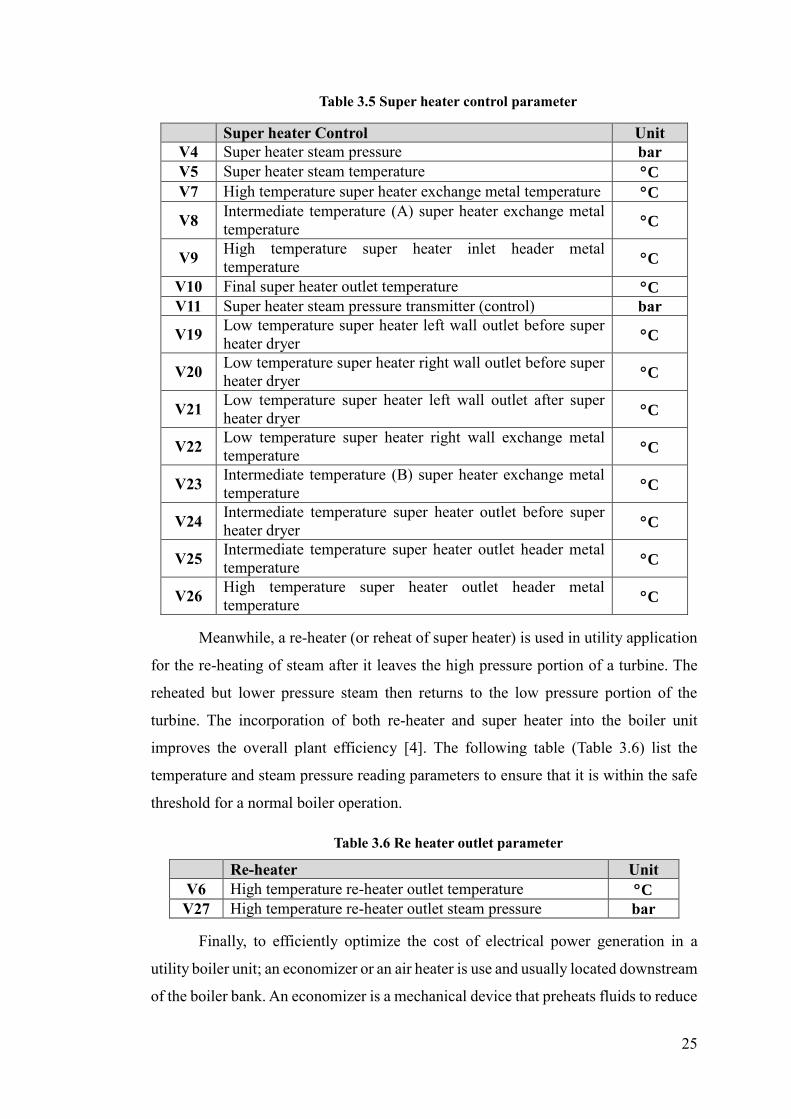
Table 3.5 Super heater control parameter
Super heater Control Unit
V4 Super heater steam pressure bar
V5 Super heater steam temperature C
V7 High temperature super heater exchange metal temperature C
V8 Intermediate temperature (A) super heater exchange metal
temperature C
V9 High temperature super heater inlet header metal
temperature C
V10 Final super heater outlet temperature C
V11 Super heater steam pressure transmitter (control) bar
V19 Low temperature super heater left wall outlet before super
heater dryer C
V20 Low temperature super heater right wall outlet before super
heater dryer C
V21 Low temperature super heater left wall outlet after super
heater dryer C
V22 Low temperature super heater right wall exchange metal
temperature C
V23 Intermediate temperature (B) super heater exchange metal
temperature C
V24 Intermediate temperature super heater outlet before super
heater dryer C
V25 Intermediate temperature super heater outlet header metal
temperature C
V26 High temperature super heater outlet header metal
temperature C
Meanwhile, a re-heater (or reheat of super heater) is used in utility application
for the re-heating of steam after it leaves the high pressure portion of a turbine. The
reheated but lower pressure steam then returns to the low pressure portion of the
turbine. The incorporation of both re-heater and super heater into the boiler unit
improves the overall plant efficiency [4]. The following table (Table 3.6) list the
temperature and steam pressure reading parameters to ensure that it is within the safe
threshold for a normal boiler operation.
Table 3.6 Re heater outlet parameter
Re-heater Unit
V6 High temperature re-heater outlet temperature C
V27 High temperature re-heater outlet steam pressure bar
Finally, to efficiently optimize the cost of electrical power generation in a
utility boiler unit; an economizer or an air heater is use and usually located downstream
of the boiler bank. An economizer is a mechanical device that preheats fluids to reduce
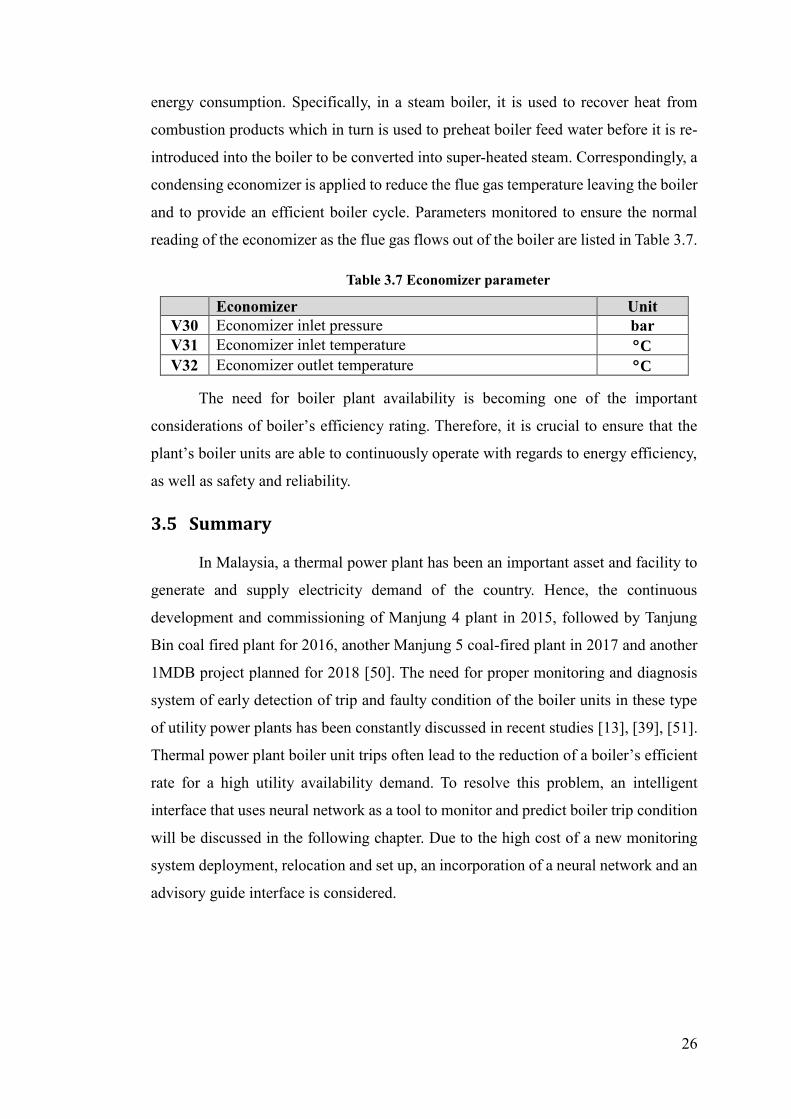
26
energy consumption. Specifically, in a steam boiler, it is used to recover heat from
combustion products which in turn is used to preheat boiler feed water before it is re-
introduced into the boiler to be converted into super-heated steam. Correspondingly, a
condensing economizer is applied to reduce the flue gas temperature leaving the boiler
and to provide an efficient boiler cycle. Parameters monitored to ensure the normal
reading of the economizer as the flue gas flows out of the boiler are listed in Table 3.7.
Table 3.7 Economizer parameter
Economizer Unit
V30 Economizer inlet pressure bar
V31 Economizer inlet temperature C
V32 Economizer outlet temperature C
The need for boiler plant availability is becoming one of the important
considerations of boiler’s efficiency rating. Therefore, it is crucial to ensure that the
plant’s boiler units are able to continuously operate with regards to energy efficiency,
as well as safety and reliability.
3.5 Summary
In Malaysia, a thermal power plant has been an important asset and facility to
generate and supply electricity demand of the country. Hence, the continuous
development and commissioning of Manjung 4 plant in 2015, followed by Tanjung
Bin coal fired plant for 2016, another Manjung 5 coal-fired plant in 2017 and another
1MDB project planned for 2018 [50]. The need for proper monitoring and diagnosis
system of early detection of trip and faulty condition of the boiler units in these type
of utility power plants has been constantly discussed in recent studies [13], [39], [51].
Thermal power plant boiler unit trips often lead to the reduction of a boiler’s efficient
rate for a high utility availability demand. To resolve this problem, an intelligent
interface that uses neural network as a tool to monitor and predict boiler trip condition
will be discussed in the following chapter. Due to the high cost of a new monitoring
system deployment, relocation and set up, an incorporation of a neural network and an
advisory guide interface is considered.
27
Chapter 4. Boiler Fault Detection Using Artificial Neural Networks (ANN) 4.1 Introduction
Fault conditions are common in huge machinery such as the energy generating
power plant that may lead to lost, both financially and operationally. Fault is defined
as an unpermitted deviation of a standard machine operation from the acceptable or
usual operational condition [45]. The complexity of a boiler makes it difficult to
monitor and identify any occurring fault in real time. Therefore, in the past decades
there have been many research in developing a model and system to analyze, evaluate,
monitor, predict, detect and diagnose faults of a boiler in a power generating system
[8], [9], [11], [13], [14], [36], [46], [47]. All of these papers suggested that the
implementation of ANN would improve the existing systems considerably. This
chapter will describe the ANN model design and power plant boiler simulation result
using a set of pre-randomized data attained from an actual power plant here in
Malaysia. The outcome of the proposed network’s “predicted” output will be used to
compare findings and simulation results from previous work to report any variation of
the pre-selected features and suggests possible modification on the network parameters
for future work. This chapter is divided into two sections. The first section will be a
discussion on the development and design of the ANN model. While the experimental
setup and simulation result of the prediction system is reported in the second section.
The following diagram (see Figure 4.1) illustrates the framework of the
proposed boiler fault detection system implementing artificial neural network.
28
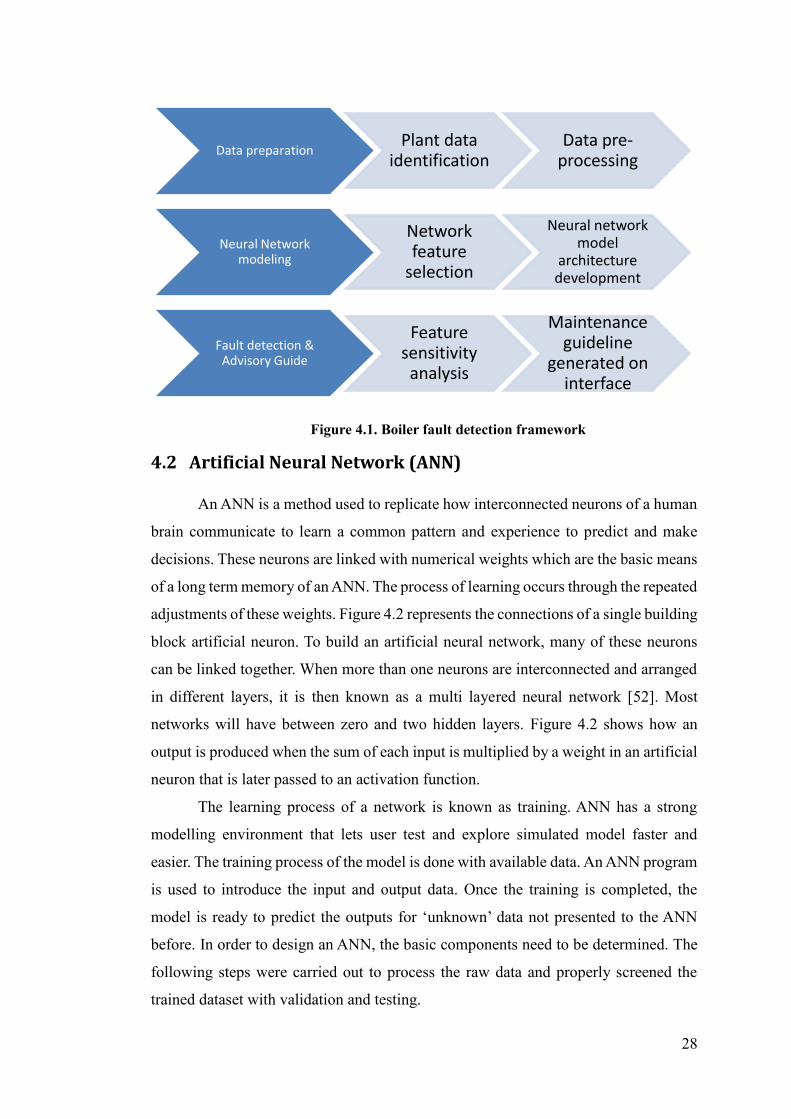
Figure 4.1. Boiler fault detection framework
4.2 Artificial Neural Network (ANN)
An ANN is a method used to replicate how interconnected neurons of a human
brain communicate to learn a common pattern and experience to predict and make
decisions. These neurons are linked with numerical weights which are the basic means
of a long term memory of an ANN. The process of learning occurs through the repeated
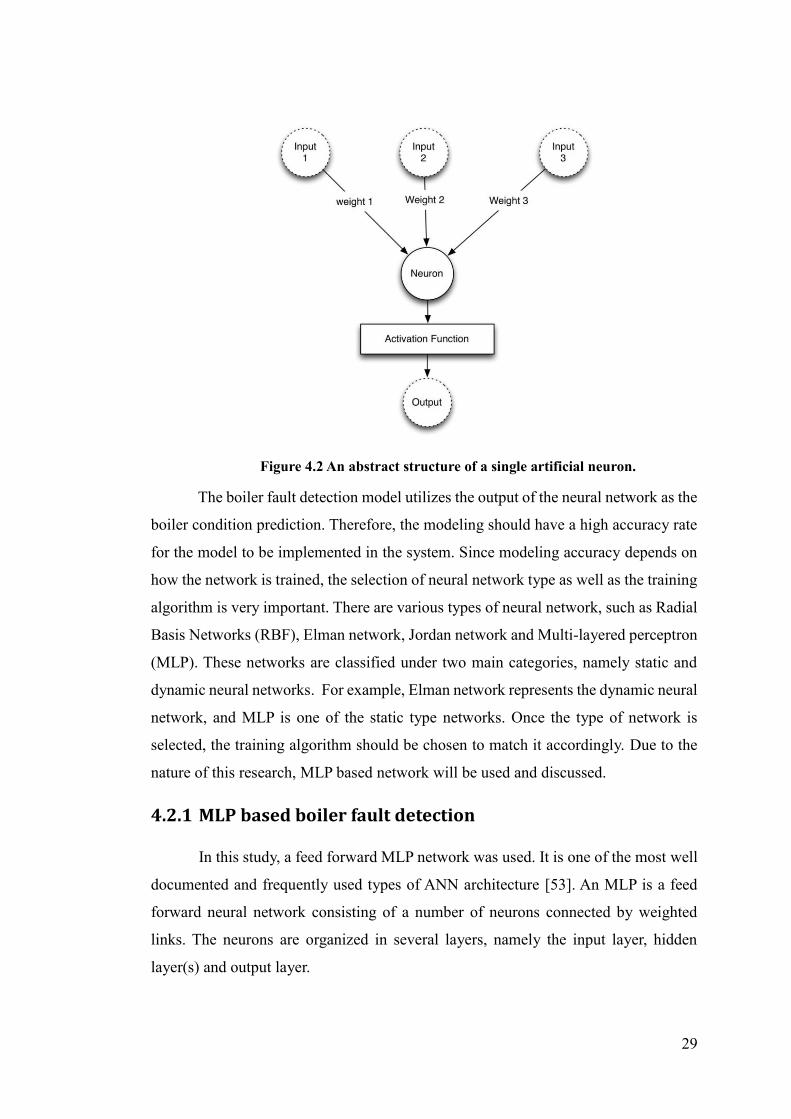
adjustments of these weights. Figure 4.2 represents the connections of a single building
block artificial neuron. To build an artificial neural network, many of these neurons
can be linked together. When more than one neurons are interconnected and arranged
in different layers, it is then known as a multi layered neural network [52]. Most
networks will have between zero and two hidden layers. Figure 4.2 shows how an
output is produced when the sum of each input is multiplied by a weight in an artificial
neuron that is later passed to an activation function.
The learning process of a network is known as training. ANN has a strong
modelling environment that lets user test and explore simulated model faster and
easier. The training process of the model is done with available data. An ANN program
is used to introduce the input and output data. Once the training is completed, the
model is ready to predict the outputs for ‘unknown’ data not presented to the ANN
before. In order to design an ANN, the basic components need to be determined. The
following steps were carried out to process the raw data and properly screened the
trained dataset with validation and testing.
Data preparationPlant data
identificationData pre-
processing
Neural Network modeling
Network feature
selection
Neural network model
architecture development
Fault detection & Advisory Guide
Feature sensitivity
analysis
Maintenance guideline
generated on interface
29
Figure 4.2 An abstract structure of a single artificial neuron.
The boiler fault detection model utilizes the output of the neural network as the
boiler condition prediction. Therefore, the modeling should have a high accuracy rate
for the model to be implemented in the system. Since modeling accuracy depends on
how the network is trained, the selection of neural network type as well as the training
algorithm is very important. There are various types of neural network, such as Radial
Basis Networks (RBF), Elman network, Jordan network and Multi-layered perceptron
(MLP). These networks are classified under two main categories, namely static and
dynamic neural networks. For example, Elman network represents the dynamic neural
network, and MLP is one of the static type networks. Once the type of network is
selected, the training algorithm should be chosen to match it accordingly. Due to the
nature of this research, MLP based network will be used and discussed.
4.2.1 MLP based boiler fault detection
In this study, a feed forward MLP network was used. It is one of the most well
documented and frequently used types of ANN architecture [53]. An MLP is a feed
forward neural network consisting of a number of neurons connected by weighted
links. The neurons are organized in several layers, namely the input layer, hidden
layer(s) and output layer.
30
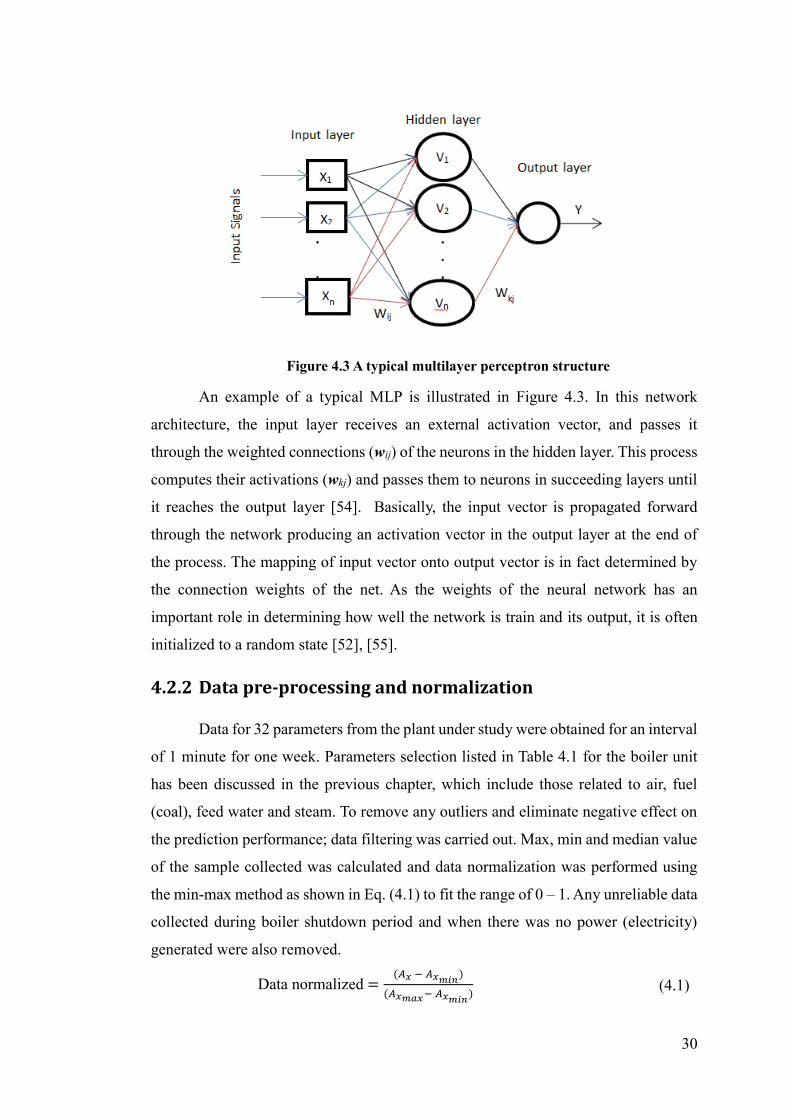
Figure 4.3 A typical multilayer perceptron structure
An example of a typical MLP is illustrated in Figure 4.3. In this network
architecture, the input layer receives an external activation vector, and passes it
through the weighted connections (wij) of the neurons in the hidden layer. This process
computes their activations (wkj) and passes them to neurons in succeeding layers until
it reaches the output layer [54]. Basically, the input vector is propagated forward
through the network producing an activation vector in the output layer at the end of
the process. The mapping of input vector onto output vector is in fact determined by
the connection weights of the net. As the weights of the neural network has an
important role in determining how well the network is train and its output, it is often
initialized to a random state [52], [55].
4.2.2 Data pre-processing and normalization
Data for 32 parameters from the plant under study were obtained for an interval
of 1 minute for one week. Parameters selection listed in Table 4.1 for the boiler unit
has been discussed in the previous chapter, which include those related to air, fuel
(coal), feed water and steam. To remove any outliers and eliminate negative effect on
the prediction performance; data filtering was carried out. Max, min and median value
of the sample collected was calculated and data normalization was performed using
the min-max method as shown in Eq. (4.1) to fit the range of 0 – 1. Any unreliable data
collected during boiler shutdown period and when there was no power (electricity)
generated were also removed.
Data normalized =(𝐴𝑥 − 𝐴𝑥𝑚𝑖𝑛)
(𝐴𝑥𝑚𝑎𝑥− 𝐴𝑥𝑚𝑖𝑛) (4.1)
31
where Ax represents the original value of the data before normalization.
Next step is to identify the right activation function for the selected MLP.
According to [53], it was found that an MLP does not increase the computing power
if the activation functions are linear for a single layer network. Hence, the unique
advantage of an MLP comes from a non-linear activation functions.
4.2.3 Activation functions
An activation function or transfer function establishes the bounds for the output
of neurons within a neural network. Choosing the right activation function is important
because it affects the formatting method of the input data. There are six activation
functions to select from, depending on the target outcome of the network [52].
However, for the purpose of this research, an MLP is used as the network for training;
hence only two of the commonly used non-linear activation functions for a
feedforward network are discussed. They are as follows;
4.2.3.1 Sigmoid activation function
In a feedforward neural network, the common choice is the sigmoid or logistic
activation function, when the expected output is only positive numbers and to ensure
values stay within relatively small range. Eq. (4.2) is an example of a sigmoid function.
Due to its continuous and differentiable behaviour, sigmoid function plays an
important role in weight adaptation during training when it produces a nonlinear
response in the interval of 0 to 1 [35]. Though it is widely used, in many research; the
hyperbolic tangent seem to produce a better outcome and becoming a more popular
option [14], [30], [52], [56].
∅(𝑥) =1
1 + 𝑒−𝑥 (4.2)
4.2.3.2 Hyperbolic tangent activation function
The hyperbolic tangent (tanh) function is another popular choice for a
feedforward network that has the output value range between -1 and 1. The advantage
of hyperbolic tangent when compared to the sigmoid function is evident when it
involves the derivatives used when training neural network. An example of a
hyperbolic tangent function is given in (4.3).
32
∅(𝑥) = tanh𝑥 (4.3)
4.2.4 Training algorithm
The training algorithm is the procedure used to carry out the learning process
in a neural network. Each type of training algorithm has its unique characteristics and
performance. In this research, the common five training algorithm will be discussed to
determined which one fits the network best to achieve the best outcome.
4.2.4.1 Levenberg-Marquardt (LM)
The Levenberg-Marquardt algorithm, also known as the damped least-squares
method was designed specifically for loss functions that take the form of a sum of
squared errors. This makes the training process very fast. LM is a hybrid algorithm
that is based on Newton’s method and on gradient descent (backpropagation). A neural
network is trained with LM algorithm by calculating the loss, gradient and the Hessian
approximation. If the stopping criteria are false, then the damping parameter is
adjusted to reduce the loss in each iteration. As shown in Eq. (4.4), the LM algorithm
enhances the Newton’s algorithm as follows:
∆𝑤 = (𝐻 + 𝜆𝐼)−1𝑔 (4.4)
In this equation, the damping factor, represented by a lambda λ is multiplied by an
identity matrix represented by I. Where I is a square matrix with all the values are at 0
except for a northwest line of values at 1. As the damping factor increases in value, the
Hessian, represented by H will be factored out of the above equation. Meanwhile, as
the damping factor decreases, the Hessian becomes more significant than the gradient
vector (g), allowing the LM training algorithm to interpolate between gradient descent
and Newton’s method. The training iteration of an LM algorithm begins with a low λ
and increases it until a desirable outcome is achieved [52].
4.2.4.2 Resilient Backpropagation (RProp)
The resilient backpropagation training algorithm is also known as the RProp is
a local adaptive learning scheme that performs supervised batch learning in an MLP.
Its main objective is to eliminate the harmful influence of the partial derivative size on
the weight step. This means only the sign of the derivatives is considered to indicate
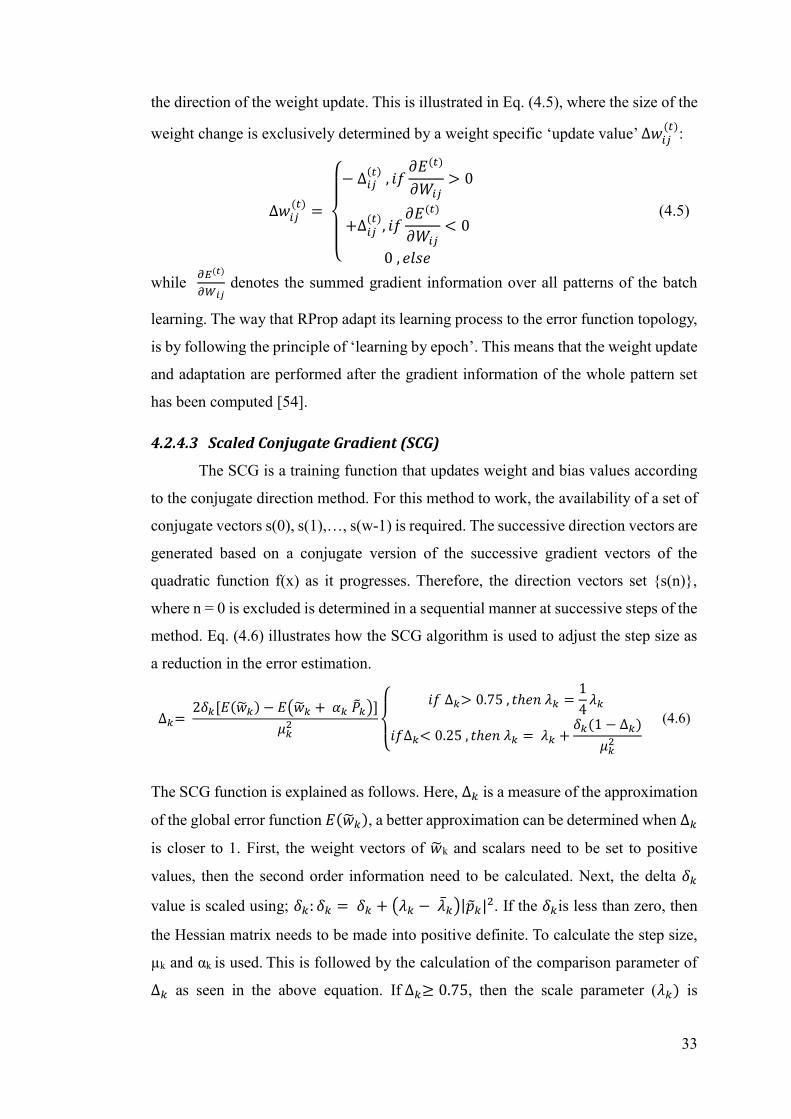
33
the direction of the weight update. This is illustrated in Eq. (4.5), where the size of the
weight change is exclusively determined by a weight specific ‘update value’ ∆𝑤𝑖𝑗(𝑡)
:
∆𝑤𝑖𝑗(𝑡)=
{
− ∆𝑖𝑗
(𝑡) , 𝑖𝑓𝜕𝐸(𝑡)
𝜕𝑊𝑖𝑗> 0
+∆𝑖𝑗(𝑡), 𝑖𝑓
𝜕𝐸(𝑡)
𝜕𝑊𝑖𝑗< 0
0 , 𝑒𝑙𝑠𝑒
(4.5)
while 𝜕𝐸(𝑡)
𝜕𝑊𝑖𝑗 denotes the summed gradient information over all patterns of the batch
learning. The way that RProp adapt its learning process to the error function topology,
is by following the principle of ‘learning by epoch’. This means that the weight update
and adaptation are performed after the gradient information of the whole pattern set
has been computed [54].
4.2.4.3 Scaled Conjugate Gradient (SCG)
The SCG is a training function that updates weight and bias values according
to the conjugate direction method. For this method to work, the availability of a set of
conjugate vectors s(0), s(1),…, s(w-1) is required. The successive direction vectors are
generated based on a conjugate version of the successive gradient vectors of the
quadratic function f(x) as it progresses. Therefore, the direction vectors set {s(n)},
where n = 0 is excluded is determined in a sequential manner at successive steps of the
method. Eq. (4.6) illustrates how the SCG algorithm is used to adjust the step size as
a reduction in the error estimation.
∆𝑘= 2𝛿𝑘[𝐸(�̃�𝑘) − 𝐸(�̃�𝑘 + 𝛼𝑘 �̃�𝑘)]
𝜇𝑘2
{
𝑖𝑓 ∆𝑘> 0.75 , 𝑡ℎ𝑒𝑛 𝜆𝑘 =1
4𝜆𝑘
𝑖𝑓∆𝑘< 0.25 , 𝑡ℎ𝑒𝑛 𝜆𝑘 = 𝜆𝑘 +𝛿𝑘(1 − ∆𝑘)
𝜇𝑘2
(4.6)
The SCG function is explained as follows. Here, ∆𝑘 is a measure of the approximation
of the global error function 𝐸(�̃�𝑘), a better approximation can be determined when ∆𝑘
is closer to 1. First, the weight vectors of �̃�k and scalars need to be set to positive
values, then the second order information need to be calculated. Next, the delta 𝛿𝑘
value is scaled using; 𝛿𝑘: 𝛿𝑘 = 𝛿𝑘 + (𝜆𝑘 − �̅�𝑘)|�̃�𝑘|2. If the 𝛿𝑘is less than zero, then
the Hessian matrix needs to be made into positive definite. To calculate the step size,
µk and αk is used. This is followed by the calculation of the comparison parameter of
∆𝑘 as seen in the above equation. If ∆𝑘≥ 0.75, then the scale parameter (𝜆𝑘) is
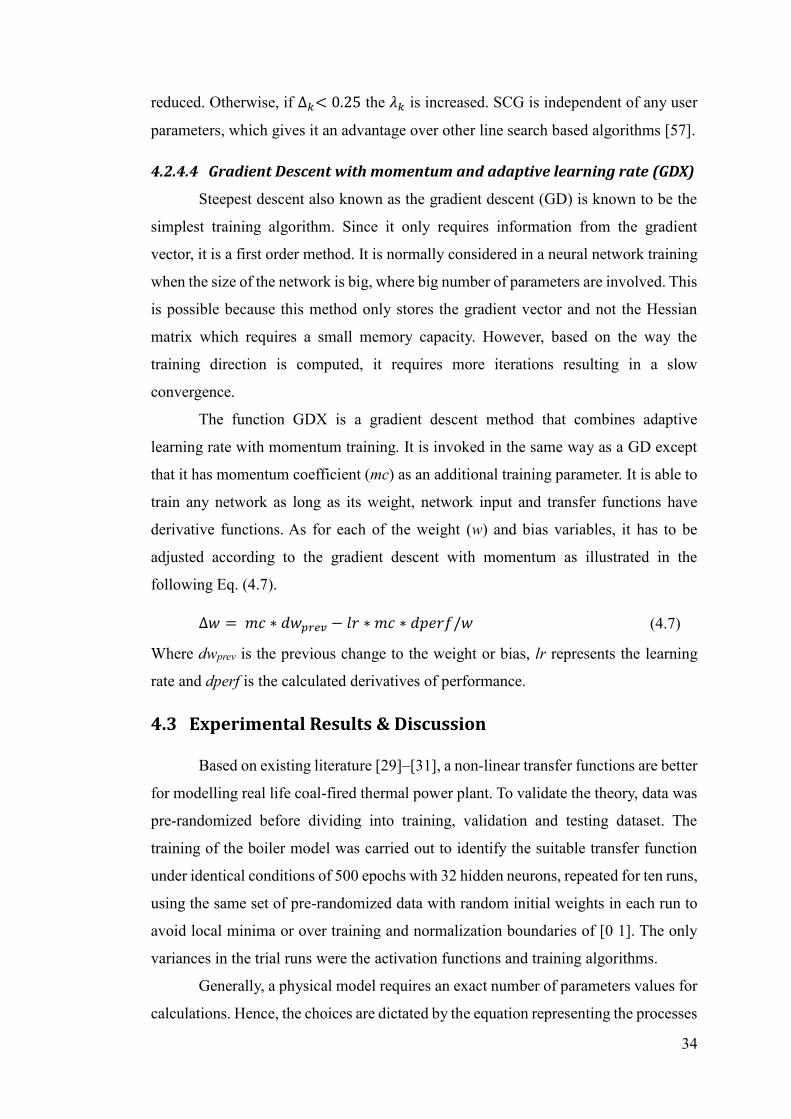
34
reduced. Otherwise, if ∆𝑘< 0.25 the 𝜆𝑘 is increased. SCG is independent of any user
parameters, which gives it an advantage over other line search based algorithms [57].
4.2.4.4 Gradient Descent with momentum and adaptive learning rate (GDX)
Steepest descent also known as the gradient descent (GD) is known to be the
simplest training algorithm. Since it only requires information from the gradient
vector, it is a first order method. It is normally considered in a neural network training
when the size of the network is big, where big number of parameters are involved. This
is possible because this method only stores the gradient vector and not the Hessian
matrix which requires a small memory capacity. However, based on the way the
training direction is computed, it requires more iterations resulting in a slow
convergence.
The function GDX is a gradient descent method that combines adaptive
learning rate with momentum training. It is invoked in the same way as a GD except
that it has momentum coefficient (mc) as an additional training parameter. It is able to
train any network as long as its weight, network input and transfer functions have
derivative functions. As for each of the weight (w) and bias variables, it has to be
adjusted according to the gradient descent with momentum as illustrated in the
following Eq. (4.7).
∆𝑤 = 𝑚𝑐 ∗ 𝑑𝑤𝑝𝑟𝑒𝑣 − 𝑙𝑟 ∗ 𝑚𝑐 ∗ 𝑑𝑝𝑒𝑟𝑓/𝑤 (4.7)
Where dwprev is the previous change to the weight or bias, lr represents the learning
rate and dperf is the calculated derivatives of performance.
4.3 Experimental Results & Discussion
Based on existing literature [29]–[31], a non-linear transfer functions are better
for modelling real life coal-fired thermal power plant. To validate the theory, data was
pre-randomized before dividing into training, validation and testing dataset. The
training of the boiler model was carried out to identify the suitable transfer function
under identical conditions of 500 epochs with 32 hidden neurons, repeated for ten runs,
using the same set of pre-randomized data with random initial weights in each run to
avoid local minima or over training and normalization boundaries of [0 1]. The only
variances in the trial runs were the activation functions and training algorithms.
Generally, a physical model requires an exact number of parameters values for
calculations. Hence, the choices are dictated by the equation representing the processes
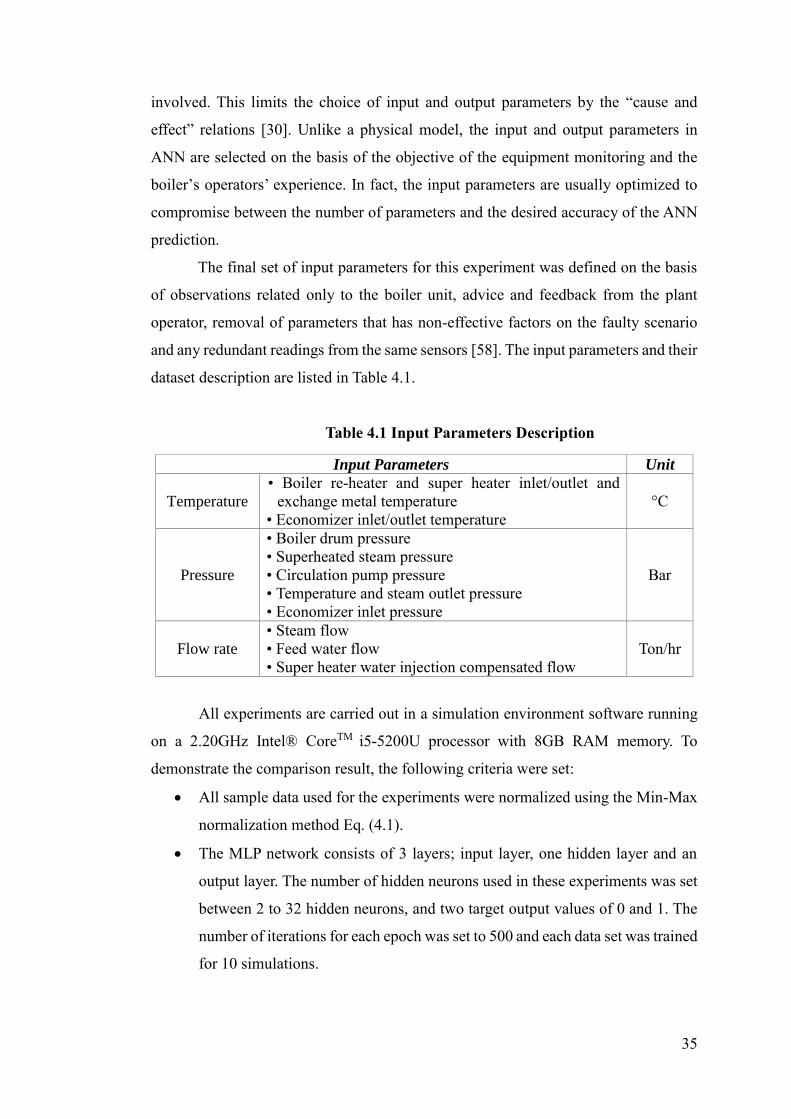
35
involved. This limits the choice of input and output parameters by the “cause and
effect” relations [30]. Unlike a physical model, the input and output parameters in
ANN are selected on the basis of the objective of the equipment monitoring and the
boiler’s operators’ experience. In fact, the input parameters are usually optimized to
compromise between the number of parameters and the desired accuracy of the ANN
prediction.
The final set of input parameters for this experiment was defined on the basis
of observations related only to the boiler unit, advice and feedback from the plant
operator, removal of parameters that has non-effective factors on the faulty scenario
and any redundant readings from the same sensors [58]. The input parameters and their
dataset description are listed in Table 4.1.
Table 4.1 Input Parameters Description
Input Parameters Unit
Temperature
• Boiler re-heater and super heater inlet/outlet and
exchange metal temperature
• Economizer inlet/outlet temperature
°C
Pressure
• Boiler drum pressure
• Superheated steam pressure
• Circulation pump pressure
• Temperature and steam outlet pressure
• Economizer inlet pressure
Bar
Flow rate
• Steam flow
• Feed water flow
• Super heater water injection compensated flow
Ton/hr
All experiments are carried out in a simulation environment software running
on a 2.20GHz Intel® CoreTM i5-5200U processor with 8GB RAM memory. To
demonstrate the comparison result, the following criteria were set:
All sample data used for the experiments were normalized using the Min-Max
normalization method Eq. (4.1).
The MLP network consists of 3 layers; input layer, one hidden layer and an
output layer. The number of hidden neurons used in these experiments was set
between 2 to 32 hidden neurons, and two target output values of 0 and 1. The
number of iterations for each epoch was set to 500 and each data set was trained
for 10 simulations.
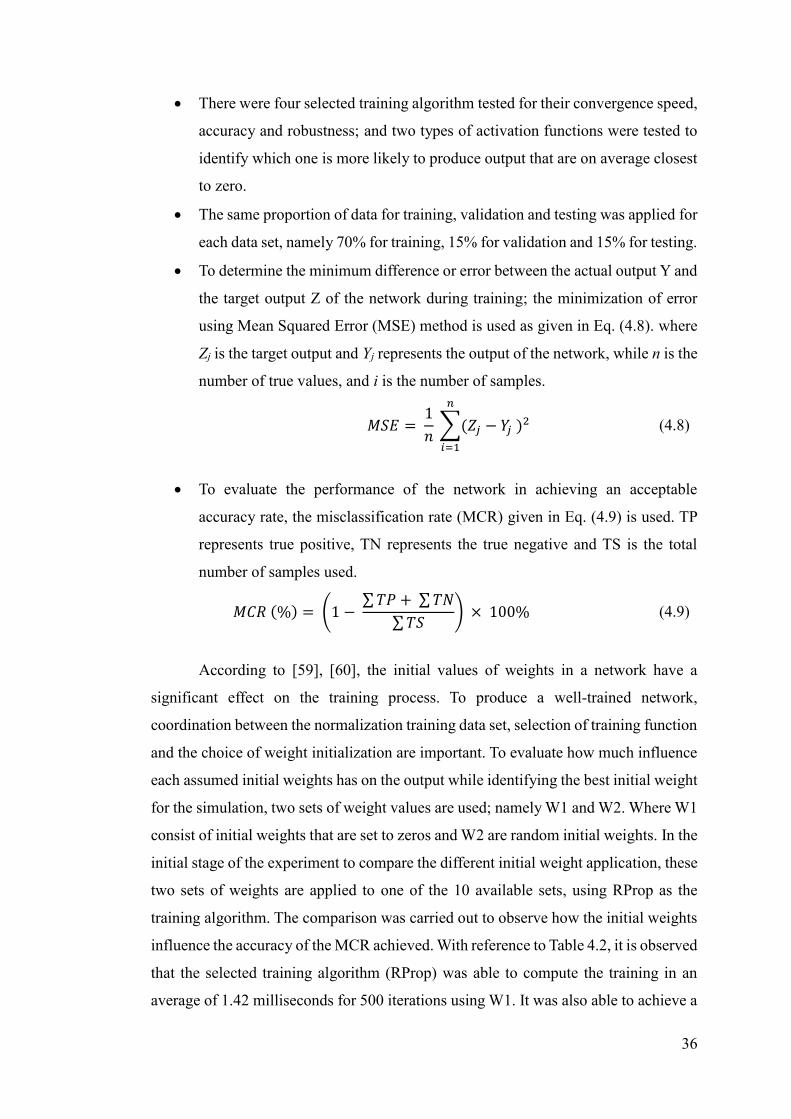
36
There were four selected training algorithm tested for their convergence speed,
accuracy and robustness; and two types of activation functions were tested to
identify which one is more likely to produce output that are on average closest
to zero.
The same proportion of data for training, validation and testing was applied for
each data set, namely 70% for training, 15% for validation and 15% for testing.
To determine the minimum difference or error between the actual output Y and
the target output Z of the network during training; the minimization of error
using Mean Squared Error (MSE) method is used as given in Eq. (4.8). where
Zj is the target output and Yj represents the output of the network, while n is the
number of true values, and i is the number of samples.
𝑀𝑆𝐸 = 1
𝑛 ∑(𝑍𝑗 − 𝑌𝑗 )
2
𝑛
𝑖=1
(4.8)
To evaluate the performance of the network in achieving an acceptable
accuracy rate, the misclassification rate (MCR) given in Eq. (4.9) is used. TP
represents true positive, TN represents the true negative and TS is the total
number of samples used.
𝑀𝐶𝑅 (%) = (1 − ∑𝑇𝑃 + ∑𝑇𝑁
∑𝑇𝑆) × 100% (4.9)
According to [59], [60], the initial values of weights in a network have a
significant effect on the training process. To produce a well-trained network,
coordination between the normalization training data set, selection of training function
and the choice of weight initialization are important. To evaluate how much influence
each assumed initial weights has on the output while identifying the best initial weight
for the simulation, two sets of weight values are used; namely W1 and W2. Where W1
consist of initial weights that are set to zeros and W2 are random initial weights. In the
initial stage of the experiment to compare the different initial weight application, these
two sets of weights are applied to one of the 10 available sets, using RProp as the
training algorithm. The comparison was carried out to observe how the initial weights
influence the accuracy of the MCR achieved. With reference to Table 4.2, it is observed
that the selected training algorithm (RProp) was able to compute the training in an
average of 1.42 milliseconds for 500 iterations using W1. It was also able to achieve a
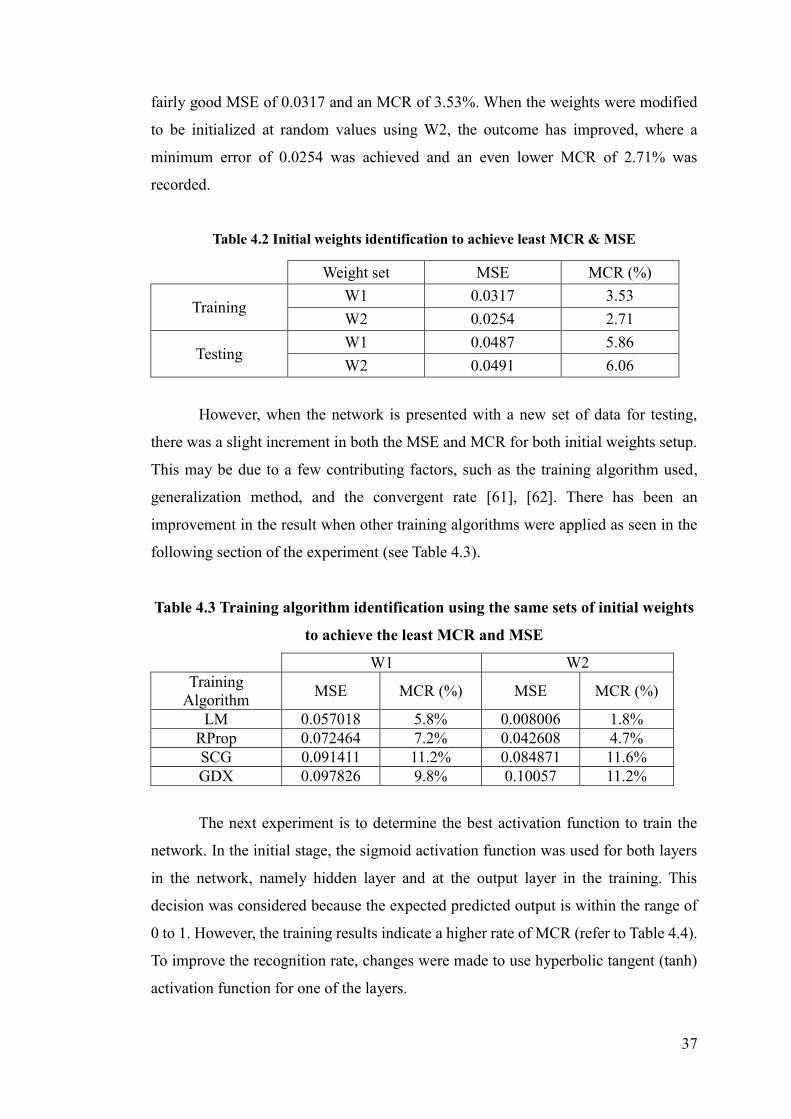
37
fairly good MSE of 0.0317 and an MCR of 3.53%. When the weights were modified
to be initialized at random values using W2, the outcome has improved, where a
minimum error of 0.0254 was achieved and an even lower MCR of 2.71% was
recorded.
Table 4.2 Initial weights identification to achieve least MCR & MSE
Weight set MSE MCR (%)
Training W1 0.0317 3.53
W2 0.0254 2.71
Testing W1 0.0487 5.86
W2 0.0491 6.06
However, when the network is presented with a new set of data for testing,
there was a slight increment in both the MSE and MCR for both initial weights setup.
This may be due to a few contributing factors, such as the training algorithm used,
generalization method, and the convergent rate [61], [62]. There has been an
improvement in the result when other training algorithms were applied as seen in the
following section of the experiment (see Table 4.3).
Table 4.3 Training algorithm identification using the same sets of initial weights
to achieve the least MCR and MSE
W1 W2
Training
Algorithm MSE MCR (%) MSE MCR (%)
LM 0.057018 5.8% 0.008006 1.8%
RProp 0.072464 7.2% 0.042608 4.7%
SCG 0.091411 11.2% 0.084871 11.6%
GDX 0.097826 9.8% 0.10057 11.2%
The next experiment is to determine the best activation function to train the
network. In the initial stage, the sigmoid activation function was used for both layers
in the network, namely hidden layer and at the output layer in the training. This
decision was considered because the expected predicted output is within the range of
0 to 1. However, the training results indicate a higher rate of MCR (refer to Table 4.4).
To improve the recognition rate, changes were made to use hyperbolic tangent (tanh)
activation function for one of the layers.
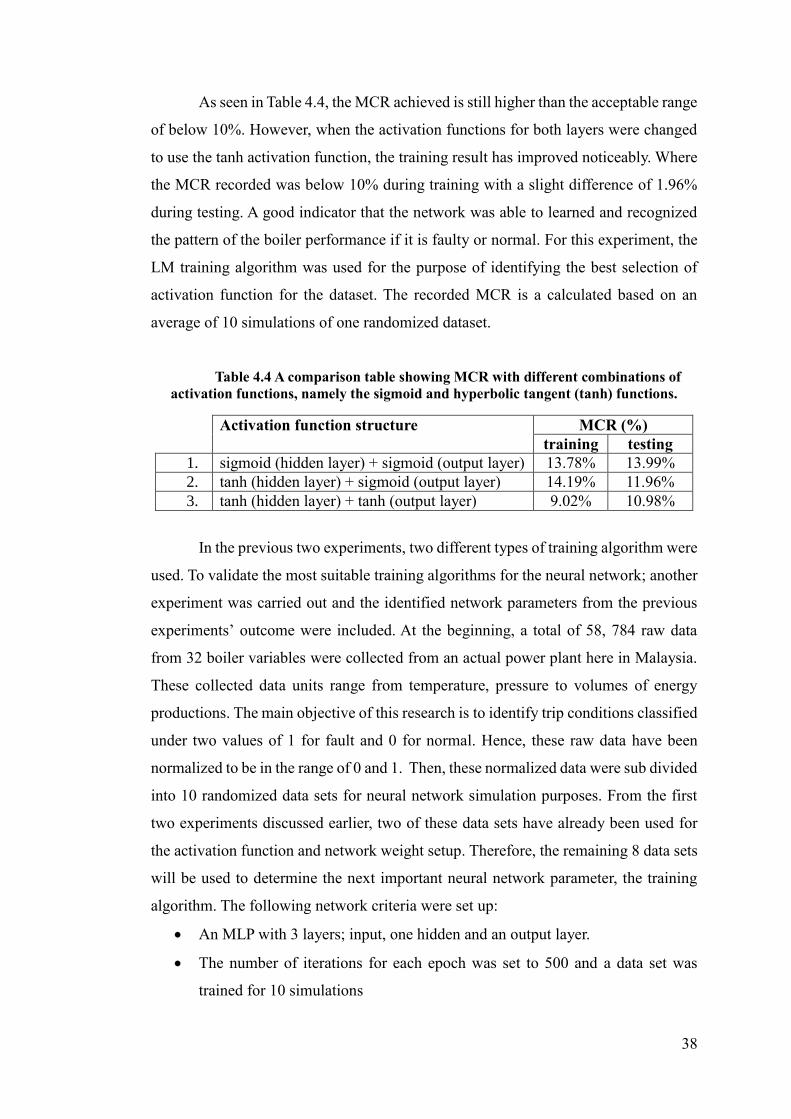
38
As seen in Table 4.4, the MCR achieved is still higher than the acceptable range
of below 10%. However, when the activation functions for both layers were changed
to use the tanh activation function, the training result has improved noticeably. Where
the MCR recorded was below 10% during training with a slight difference of 1.96%
during testing. A good indicator that the network was able to learned and recognized
the pattern of the boiler performance if it is faulty or normal. For this experiment, the
LM training algorithm was used for the purpose of identifying the best selection of
activation function for the dataset. The recorded MCR is a calculated based on an
average of 10 simulations of one randomized dataset.
Table 4.4 A comparison table showing MCR with different combinations of
activation functions, namely the sigmoid and hyperbolic tangent (tanh) functions.
Activation function structure MCR (%)
training testing
1. sigmoid (hidden layer) + sigmoid (output layer) 13.78% 13.99%
2. tanh (hidden layer) + sigmoid (output layer) 14.19% 11.96%
3. tanh (hidden layer) + tanh (output layer) 9.02% 10.98%
In the previous two experiments, two different types of training algorithm were
used. To validate the most suitable training algorithms for the neural network; another
experiment was carried out and the identified network parameters from the previous
experiments’ outcome were included. At the beginning, a total of 58, 784 raw data
from 32 boiler variables were collected from an actual power plant here in Malaysia.
These collected data units range from temperature, pressure to volumes of energy
productions. The main objective of this research is to identify trip conditions classified
under two values of 1 for fault and 0 for normal. Hence, these raw data have been
normalized to be in the range of 0 and 1. Then, these normalized data were sub divided
into 10 randomized data sets for neural network simulation purposes. From the first
two experiments discussed earlier, two of these data sets have already been used for
the activation function and network weight setup. Therefore, the remaining 8 data sets
will be used to determine the next important neural network parameter, the training
algorithm. The following network criteria were set up:
An MLP with 3 layers; input, one hidden and an output layer.
The number of iterations for each epoch was set to 500 and a data set was
trained for 10 simulations
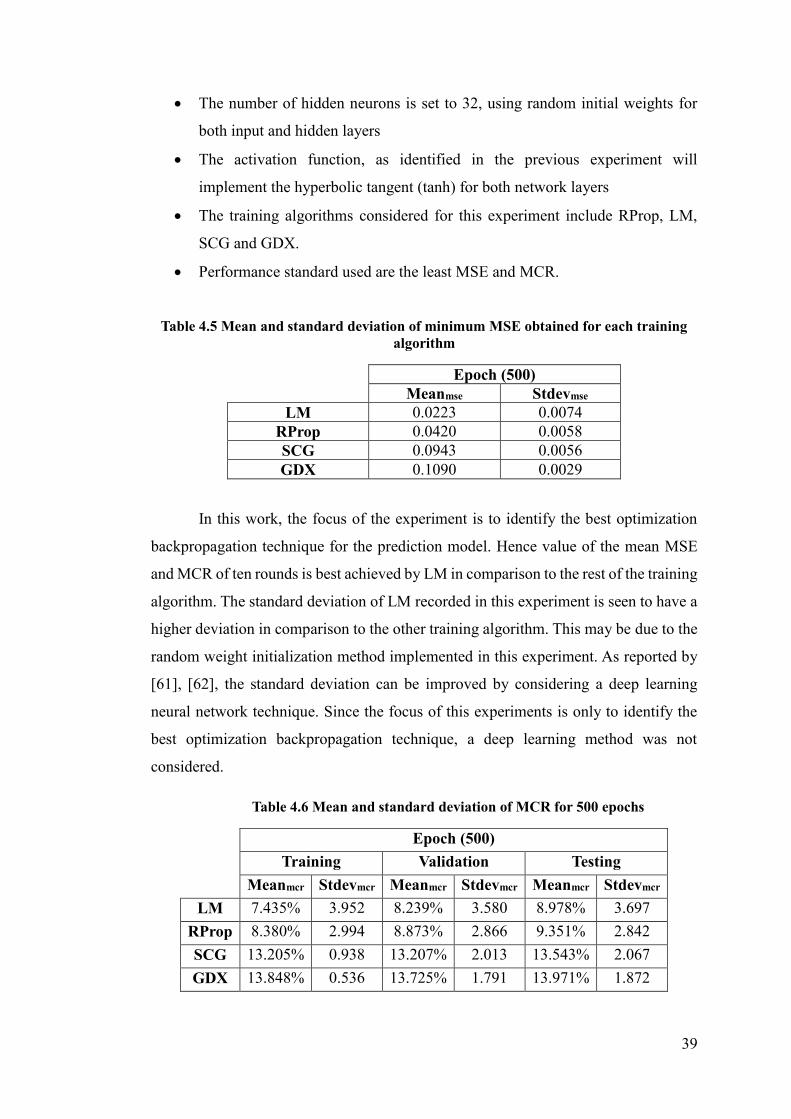
39
The number of hidden neurons is set to 32, using random initial weights for
both input and hidden layers
The activation function, as identified in the previous experiment will
implement the hyperbolic tangent (tanh) for both network layers
The training algorithms considered for this experiment include RProp, LM,
SCG and GDX.
Performance standard used are the least MSE and MCR.
Table 4.5 Mean and standard deviation of minimum MSE obtained for each training
algorithm
Epoch (500)
Meanmse Stdevmse
LM 0.0223 0.0074
RProp 0.0420 0.0058
SCG 0.0943 0.0056
GDX 0.1090 0.0029
In this work, the focus of the experiment is to identify the best optimization
backpropagation technique for the prediction model. Hence value of the mean MSE
and MCR of ten rounds is best achieved by LM in comparison to the rest of the training
algorithm. The standard deviation of LM recorded in this experiment is seen to have a
higher deviation in comparison to the other training algorithm. This may be due to the
random weight initialization method implemented in this experiment. As reported by
[61], [62], the standard deviation can be improved by considering a deep learning
neural network technique. Since the focus of this experiments is only to identify the
best optimization backpropagation technique, a deep learning method was not
considered.
Table 4.6 Mean and standard deviation of MCR for 500 epochs
Epoch (500)
Training Validation Testing
Meanmcr Stdevmcr Meanmcr Stdevmcr Meanmcr Stdevmcr
LM 7.435% 3.952 8.239% 3.580 8.978% 3.697
RProp 8.380% 2.994 8.873% 2.866 9.351% 2.842
SCG 13.205% 0.938 13.207% 2.013 13.543% 2.067
GDX 13.848% 0.536 13.725% 1.791 13.971% 1.872
40
4.4 Summary
The boiler fault detection comprising a replicated MLP network architecture is
used in this chapter. In order to train the MLP, a standard feedforward algorithm is
applied and a fairly high prediction rate was obtained. The simulation result shows the
Rprop algorithm was found to compute faster when the initial weights are set to zero,
however a better performance and misclassified rate are evident when LM algorithm
was used. The initialization of the random weights in the network results in an
improved misclassified rate of the overall learning pattern. Additionally, an equal
distribution of the normal and faulty reading in the training set is also important to
avoid data overfitting when testing of the network is carried out. To conclude, it
appears that LM was able to reach the minimum MSE in Table 4.3. The result
demonstrates LM dominants in pattern recognition network against the other three
training algorithm for the trip prediction of the thermal power plant boiler parameters.
41
Chapter 5. Intelligent Boiler Trip Monitoring Interface and Advisory Guide
5.1 Introduction
An Intelligent Monitoring Interface (IMI) is a human-machine interface system
that tracks and improves the responses of an event associated with monitored
equipment. It enables user to perform potentially complex tasks more effectively and
quickly with greater accuracy. This is made possible by presenting users with
information on the equipment condition, user’s next actions, and warnings of
undesirable consequences and suggestions of an alternative action. The basic idea
behind the IMI for a coal fired boiler unit is due to the limited capabilities of the current
monitoring system. It does not allow simultaneous collaboration between plant
supervisor and boiler operator when a trip occurred.
In Chapter 4, we have discussed the computational optimization algorithm and
network architecture of the boiler trip monitoring. Many researchers have been
focusing on improving the monitoring system using various methods, see [5], [8]–[10],
[14], [17], [46], [63], [64]. These methods include comparative analysis, hybrid fuzzy
clustering, ANN, support vector machine, data mining, and a multi agent system to
name a few. The next part of the intelligent monitoring is the interface development
for the boiler trip advisory guide.
In 2002, an expert system to manage abnormal condition of a manufacturing
system has already been proposed by [65] where their main objective was to develop
a system that was able to detect unusual events early, assess the potential impacts of
the identified event, diagnose the root cause and provide operators with guided advice
for an appropriate immediate actions. In their paper, “smart” generic and reusable
objects known as “Generic Heaters” developed using Gensym Optegrity software were
used to provide proactive diagnostic to manage these identified abnormality and
performance indices. Generic Heaters are software objects containing diagnostic, fault
models and advisory messages for managing over 80 faults typical for boilers,
42
furnaces, ethylene crackers and incinerators. Using their method for a 32 sensor
parameter reading to identify the fault condition of a boiler will require over 2,560
fault models objects to consider. This will be time consuming and may not be practical
for real time implementation. Hence, in this work the method of using ANN as the
prediction tool for fault detection and forecasting of a boiler’s abnormal reading is
used instead. Additionally, the user interface will be developed using a simulation
environment software to generate the data reading and prediction along with the
advisory guide whenever a fault is forecasted. The following sections of this chapter
will elaborate on the steps involved to design and develop the Graphical User Interface
(GUI) of the advisory guide for the monitoring system using an Integrated
Development Environment (IDE) program. The preliminary design of the user
interface is based on the following flowchart (Figure 5.1).
5.2 Power plant boiler monitoring interface
An extension to the current monitoring system is the GUI development for both
client side data representation and control and maintenance operations. The most
common interface implementation of a monitoring system is through an on-site server
where authenticated user access the data collected through their local workstation
connected to a Virtual Private Network (VPN). Meanwhile, a remote server monitoring
system allows data collected on site to be sent to a remote server and accessible through
any standard web browsers (e.g. Mozilla, Explorer, or Google Chrome). Anyone with
an authentic username and password can view the data without installing the client
software. The advantage of the latter; plant staff, analyst and equipment and
maintenance operators and technicians can simultaneously look at the data to
collaborate on remedial actions [66]. Rather than delivering machine data in-house
only (on-site control rooms), the Internet allows information to be accessible from
anywhere, anytime.
Ideally, plant operators of this monitoring system are made accessible at
different levels, and possibly different types of views and control, depending on their
profile, conditions of the system and the current task being executed. As suggested in
the illustration in Figure 5.2, the operator is responsible in monitoring and inspecting
physical condition of the equipment whenever an alarm is triggered on the monitoring
system.
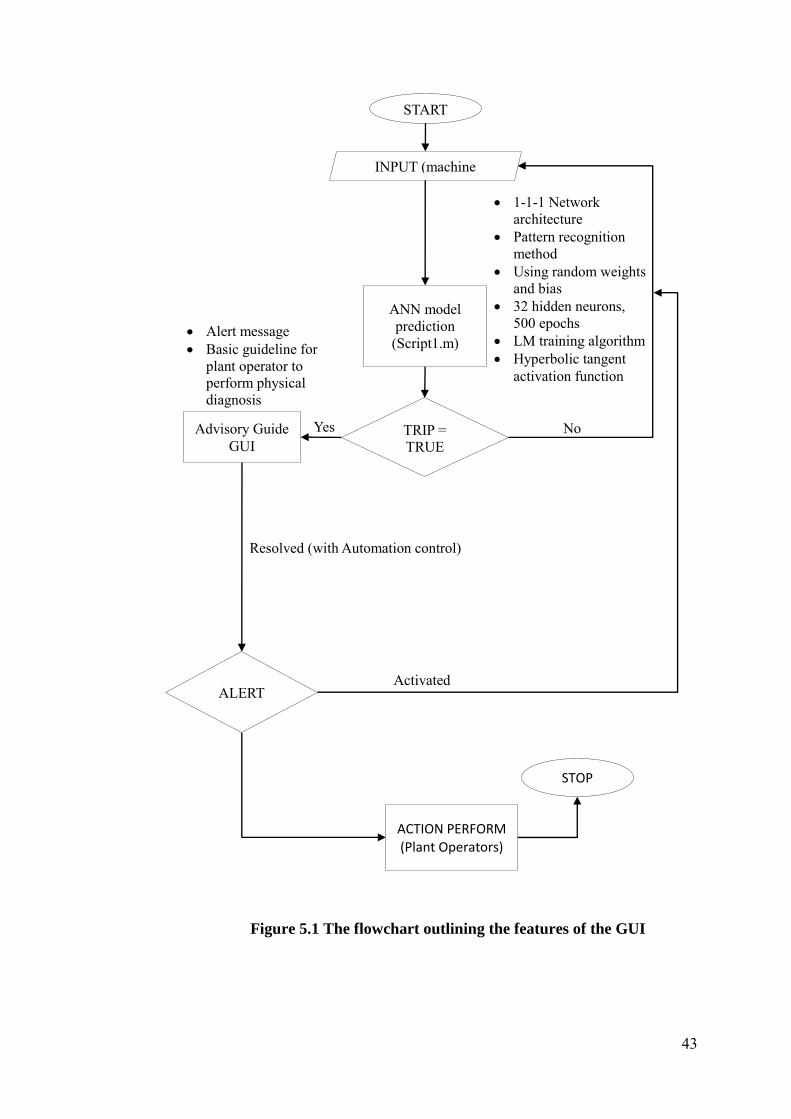
43
Figure 5.1 The flowchart outlining the features of the GUI
START
INPUT (machine
sensors)
ANN model
prediction
(Script1.m)
TRIP =
TRUE
Advisory Guide
GUI
ALERT
ACTION PERFORM (Plant Operators)
STOP
1-1-1 Network
architecture
Pattern recognition
method
Using random weights
and bias
32 hidden neurons,
500 epochs
LM training algorithm
Hyperbolic tangent
activation function
Alert message
Basic guideline for
plant operator to
perform physical
diagnosis
No Yes
Activated
Resolved (with Automation control)
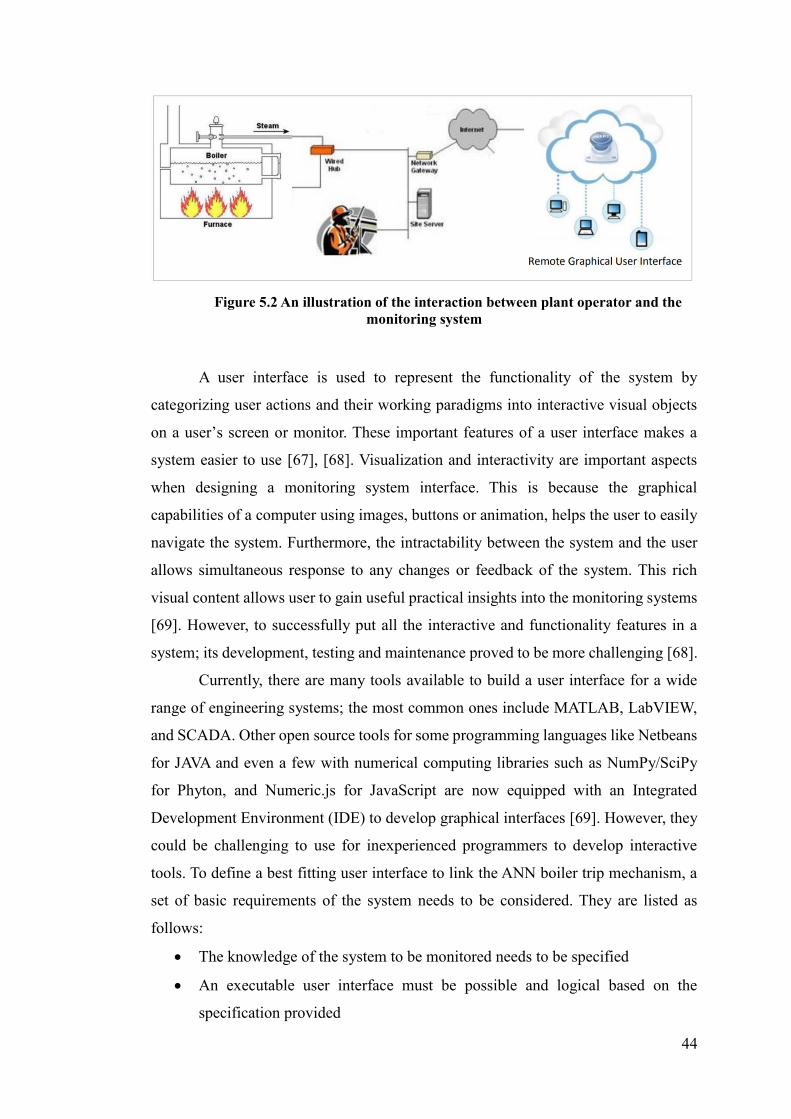
44
Figure 5.2 An illustration of the interaction between plant operator and the
monitoring system
A user interface is used to represent the functionality of the system by
categorizing user actions and their working paradigms into interactive visual objects
on a user’s screen or monitor. These important features of a user interface makes a
system easier to use [67], [68]. Visualization and interactivity are important aspects
when designing a monitoring system interface. This is because the graphical
capabilities of a computer using images, buttons or animation, helps the user to easily
navigate the system. Furthermore, the intractability between the system and the user
allows simultaneous response to any changes or feedback of the system. This rich
visual content allows user to gain useful practical insights into the monitoring systems
[69]. However, to successfully put all the interactive and functionality features in a
system; its development, testing and maintenance proved to be more challenging [68].
Currently, there are many tools available to build a user interface for a wide
range of engineering systems; the most common ones include MATLAB, LabVIEW,
and SCADA. Other open source tools for some programming languages like Netbeans
for JAVA and even a few with numerical computing libraries such as NumPy/SciPy
for Phyton, and Numeric.js for JavaScript are now equipped with an Integrated
Development Environment (IDE) to develop graphical interfaces [69]. However, they
could be challenging to use for inexperienced programmers to develop interactive
tools. To define a best fitting user interface to link the ANN boiler trip mechanism, a
set of basic requirements of the system needs to be considered. They are listed as
follows:
The knowledge of the system to be monitored needs to be specified
An executable user interface must be possible and logical based on the
specification provided
45
It must be feasible to verify properties and to validate the specification
It must be possible to classify users into different profiles
It must be possible to define the tasks that may be available to only some user
profile
Apart from the above listed requirements, the human factor is also an important
feature; to achieve productivity gains from the monitoring system. This involved the
main four personnel directly in contact with the monitoring system and its
corresponding interface. They are:
Expert: An expert will be the direct person to contact for an alarm event
involving an equipment sensor malfunctions or trips. The purpose of the user
interface is to provide the expert on the equipment sensor installation, ANN
design, and testing and diagnosis report.
Maintenance: The user interface will be used to display statistics or machine
reading for various parameter measurements to the maintenance team.
Supervisor: The task of a supervisor is to manage the machinery processes and
oversee the learning process of the embedded ANN into the system. Hence, the
user interface will provide information regarding the movements of the plant
equipment operators and the communication link and channel for information
exchange between the two personnel.
Operators: Generally, the operators are the one handling the continuous
innovation and improvements of the machinery. Furthermore, should there be
any need for equipment changeover and reporting anomalies during
inspections; direct communication to the supervisors are critical especially for
triggered alarm or trip inspections. The user interface should provide the
interaction medium in real time.
The above requirements are known as the Human Machine Interaction (HMI). It
provides the link between the ANN based monitoring system and the end user by
providing the means for a long term analysis and aid improvements and innovation of
the equipment [70], [71]. The monitoring system runs a boiler condition reading at
regular intervals of one minute throughout the day. These captured data are then stored
into a data management system, that manages them into a database as historical data
and ease of retrieval to be analyse in the developed prediction model. To predict any
46
possible trip occurrences, a dedicated program was coded in a simulation environment
software with neural network as discussed in the previous chapter.
5.3 Power plant boiler trip advisory guide
The output of the sample user interface consists of a time stamp and normalized
data reading for the 32 parameters being observed, an identified number of parameter
abnormalies for both warning and alarm indicator and an advisory message box alert
detailing the root cause explanations and suggested actions to be carried out. A sample
of the designed GUI is shown in Figure 5.3. Using a simulation environment software,
the custom interface has been developed in Microsoft Windows 10 operating system,
using a 2.20 GHz Intel® CoreTM i5-5200U CPU with 8GB RAM. One of the features
added in the GUI is an update button, where for each button press; a new set of time
stamp data is retrieved from the (.mat) file and displayed in the first column for review
and analysis purpose. In this prototype, data displayed have already been normalized
between the values of 0 to 1. This is due to the specification requirement of the
developed neural network model which identifies faults when a reading is closer to the
value of 1. As for the parameter anomalies feature in the GUI, a set of condition based
algorithm is added to identify the number of warnings and alarms identified (if any)
whenever the data reading is updated in the table.
Meanwhile, in the parameter analysis section of the GUI, a button that generates
the text file of the advisory guideline is included. The action performed when this
button is pressed; it will open a text document on a separate window using the notepad
program. In this text file, detailed information of the alarm/fault reading is displayed.
Where the description of the parameters identified to be affected by the trip alert is
listed with its suggested actions to be considered when an inspection or maintenance
exercise is carried out on the parameter.
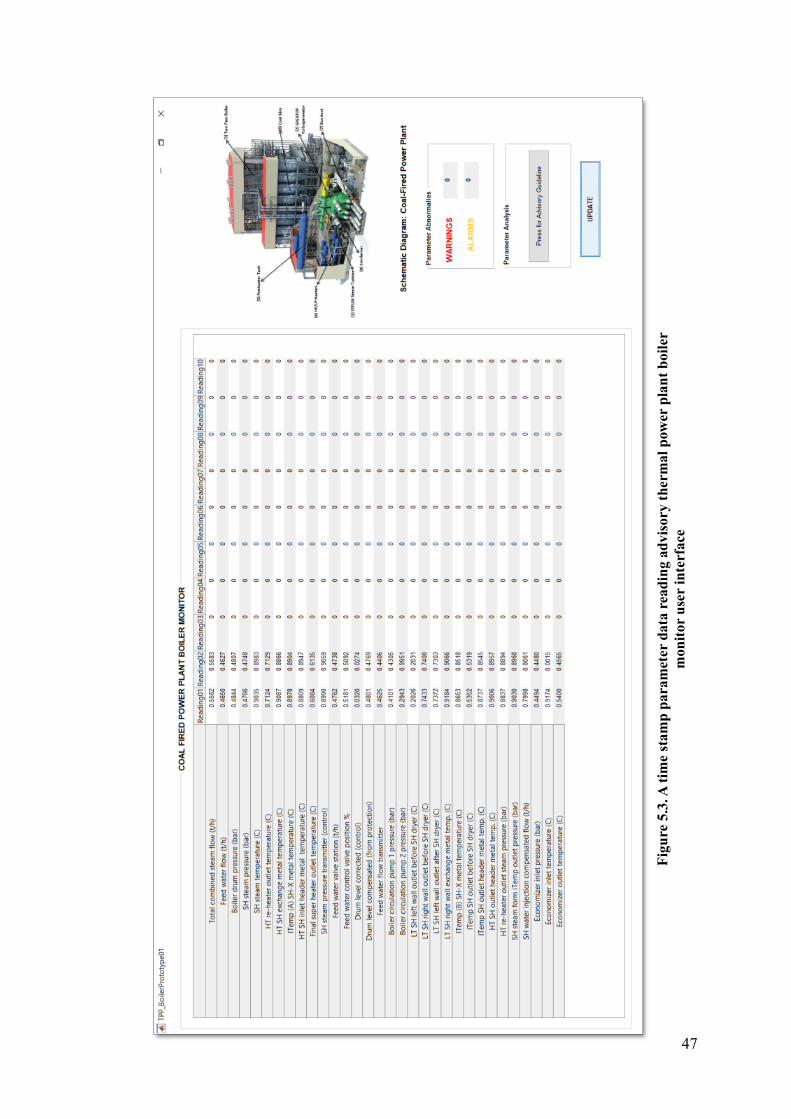
47
Fig
ure
5.3
. A
tim
e st
am
p p
ara
met
er d
ata
rea
din
g a
dvis
ory
th
erm
al
pow
er p
lan
t b
oil
er
mon
itor
use
r in
terf
ace
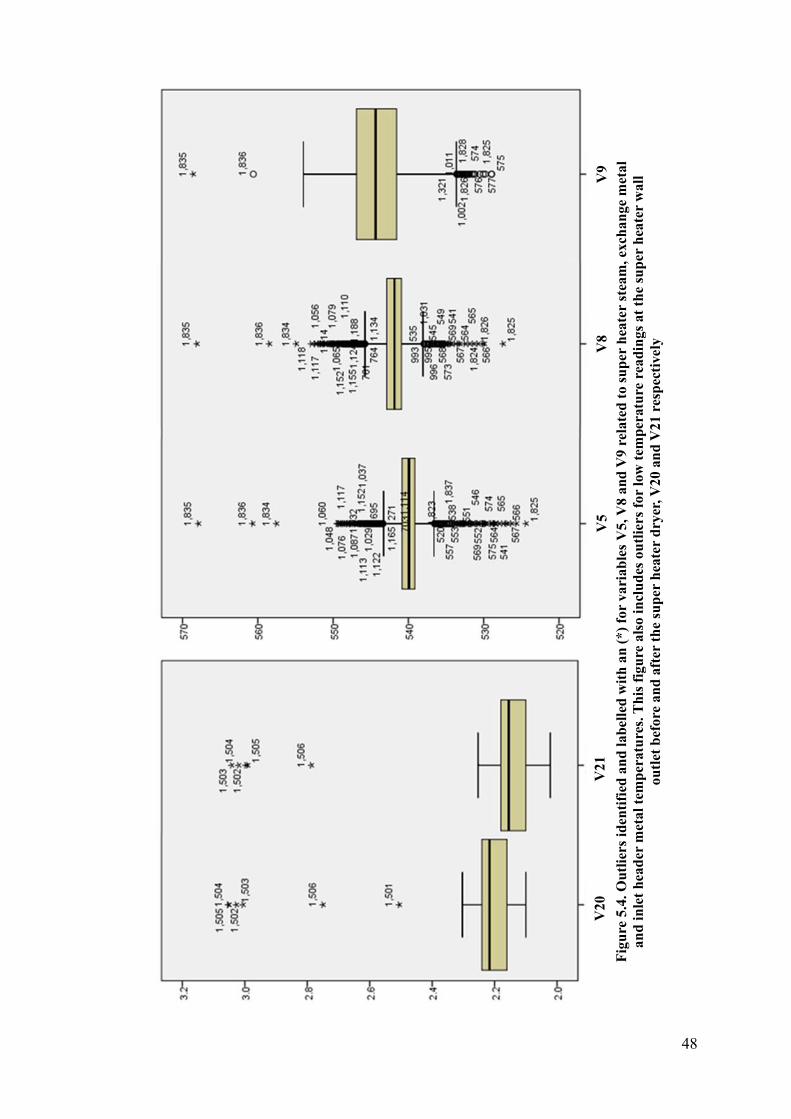
48
5.4 Boiler parameter sensitivity analysis
Fig
ure
5.4
. O
utl
iers
id
enti
fied
an
d l
ab
elle
d w
ith
an
(*)
for
vari
ab
les
V5, V
8 a
nd
V9 r
ela
ted
to
su
per
hea
ter
stea
m, ex
cha
ng
e m
eta
l
an
d i
nle
t h
ead
er m
eta
l te
mp
eratu
res.
Th
is f
igu
re a
lso i
ncl
ud
es o
utl
iers
for
low
tem
per
atu
re r
ead
ing
s at
the
sup
er h
eate
r w
all
ou
tlet
bef
ore
an
d a
fter
th
e su
per
hea
ter
dry
er, V
20 a
nd
V2
1 r
esp
ecti
vely
V9
V8
V
5
V21
V
20
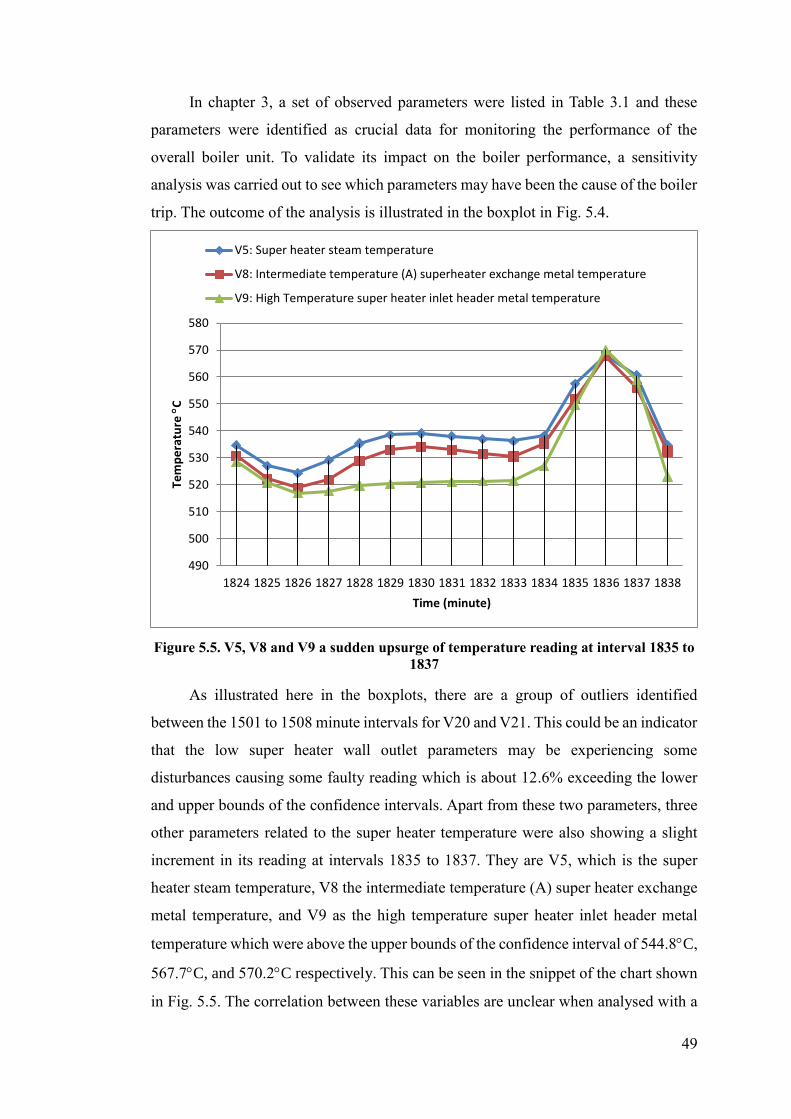
49
In chapter 3, a set of observed parameters were listed in Table 3.1 and these
parameters were identified as crucial data for monitoring the performance of the
overall boiler unit. To validate its impact on the boiler performance, a sensitivity
analysis was carried out to see which parameters may have been the cause of the boiler
trip. The outcome of the analysis is illustrated in the boxplot in Fig. 5.4.
Figure 5.5. V5, V8 and V9 a sudden upsurge of temperature reading at interval 1835 to
1837
As illustrated here in the boxplots, there are a group of outliers identified
between the 1501 to 1508 minute intervals for V20 and V21. This could be an indicator
that the low super heater wall outlet parameters may be experiencing some
disturbances causing some faulty reading which is about 12.6% exceeding the lower
and upper bounds of the confidence intervals. Apart from these two parameters, three
other parameters related to the super heater temperature were also showing a slight
increment in its reading at intervals 1835 to 1837. They are V5, which is the super
heater steam temperature, V8 the intermediate temperature (A) super heater exchange
metal temperature, and V9 as the high temperature super heater inlet header metal
temperature which were above the upper bounds of the confidence interval of 544.8C,
567.7C, and 570.2C respectively. This can be seen in the snippet of the chart shown
in Fig. 5.5. The correlation between these variables are unclear when analysed with a
490
500
510
520
530
540
550
560
570
580
1824 1825 1826 1827 1828 1829 1830 1831 1832 1833 1834 1835 1836 1837 1838
Tem
pe
ratu
re
C
Time (minute)
V5: Super heater steam temperature
V8: Intermediate temperature (A) superheater exchange metal temperature
V9: High Temperature super heater inlet header metal temperature
50
statistical tool, hence the importance to use neural network to make the correlation
between these variable reading.
5.5 Summary
A description of the proposed intelligent monitoring user interface has been
presented and discussed. The advantages of the proposed system were described along
with the comparison of a traditional and existing monitoring system. Some of the
feedback provided on the advisory system were also provided. As a conclusion, the
boiler fault condition identification tool and advisory guide was able to save thousands
in revenue as well as the lives of people involve in the work of maintaining the boiler
operation in the power plant. The gains for these improvements added to the existing
monitoring system not only benefit the industry economically, but it also improved the
overall optimization of the boiler equipment unit in a power plant.
51
Chapter 6. Conclusion and Future Work 6.1 Conclusion
Thermal power plant boiler unit trips often lead to the declining rate of boiler
efficiency for the high utility availability demand. Due to the alarming rate of the
frequent blackouts resulting from an unscheduled power unit trips, various new
methods have been proposed for the diagnosis and monitoring of the boiler unit in a
power plant. In Malaysia, a thermal power plant is an important asset and facility to
generate and supply electricity demand of the country. Hence, the continuous
development and commissioning of Manjung 4 plant in 2015, followed by Tanjung
Bin coal fired plant in 2016, Manjung 5 coal-fired plant in 2017 and another 1MDB
project planned for 2018 [50]. These new projects are a necessity to meet the demand
of the growing number of users. However, building more utility plants does not
necessarily resolve the boiler unit trip occurrences issue. Despite new efforts to
diagnose and monitor the trips, more research is needed to develop new system that is
able to monitor and diagnose factors leading to the degradation of boiler unit(s) in a
power plant.
In chapter 2, a comprehensive literature review on the specific techniques most
favoured to accomplish the task to monitor boiler performance was presented. Based
on previous work, ANN has been identified as the most appropriate candidate. It has
been widely applied in a number of successful applications for classifications task,
forecasting, control systems and optimization and decision making. For instance, ANN
has been reported to have successfully interpret the behaviour of machinery processes
in energy conversion plants [29], [31], [38], [58], [72]–[74]. Commonly, large number
of operational data is captured continuously by the on-line plant’s monitoring system
for its proper operation. These are usually stored as parameter record and historical
data in a database. By utilising these data, ANN can be used to simulate a power plant
operation to recognize and identify boiler unit degradation that eventually leads to trips
in an actual plant. Furthermore, a comparison study of the simulated data to an actual
plant data can be used to assess the plant degradation rate. By being able to establish
52
the timeline of a boiler unit’s lifespan, better maintenance schedule and planning can
be carried out.
In chapter 3, the boiler unit operational parameters were presented. In big
utility plant, detailed observation on each of its operational parameters is crucial. Due
to the extent of the boiler complexity, the number of operational parameters to be used
as sample in this work include the 32 most influential parameters to the boiler unit.
The selection is based on the plant operator’s past experience and system knowledge.
Identifying faults and trip condition of a boiler in its most effective operating condition
requires in depth understanding and knowledge of its faulty parameters and factors
causing the malfunctions. Since there are a large number of data obtained from the
industry, irrelevant values and outliers need to be identified and removed accordingly.
In chapter 4, an ANN model implementing the LM algorithm was presented.
As suggested in the literature [29]–[31], a non-linear activation functions are better for
modelling coal-fired thermal power plant. Hence, an MLP were used and simulations
were carried out under an identical condition of 500 epochs, with 32 hidden neurons,
pre-randomized initial weights and a hyperbolic tangent activation function. There
were four training algorithm tested for their convergence speed, accuracy and
robustness. They were LM, RProp, SCG and GDX. Simulation outcome and result
showed LM has proven to be consistent in achieving the least MSE and MCR in all of
the simulations.
In chapter 5, major issues associated with an intelligent approach for an
intelligent monitoring system was reported. Most of the issues was due to the high cost
for deployment, relocation and set up [75]. Thus, the incorporation of neural network
for boiler fault identification with an interactive GUI was also studied. In this chapter,
an application of an intelligent monitoring GUI was presented and discussed. A
simulation environment software was used to develop the GUI in a standard CPU setup
of a windows based operating system. The advantages of the proposed system were
described along with the comparison of a traditional and existing monitoring system.
To conclude, the problems related to thermal power plant boiler trips were
identified and analyzed with existing literatures. Comparison of existing monitoring
systems and the research gap using various methods and approaches have also been
highlighted and acknowledged. The boiler fault condition identification tool and
advisory guide was able to save thousands in revenue as well as the lives of people
involve in the work of maintaining the boiler operation in the power plant. The gains
53
for these improvements added to the existing monitoring system not only benefit the
industry economically, but it also improved the overall optimization of the boiler
equipment unit in a power plant.
6.2 Future Works
In developing the proposed advisory guide interface for the existing boiler
power plant trip identification, some of the costing issues identified will be addressed.
For instance, a portable executable file setup for the interface module should be
considered. This is to avoid any additional cost on software installation and licensing
to run the extended module.
Another recommendation would be to look into other machine learning
approach for feature selection and analysis. By enabling the intelligent feature
selection module, the parameters monitored could be simplified and reduced to
improve the overall efficiency of the monitoring system. One neural network method
that could be considered is the Convolutional Neural Network (CNN). In recent
studies, CNN has been widely used to extract robust and informative features from a
set of sequential data [76], [77]. The collected real time data usually contain noise,
CNN is used to extract only the most significant features. It does this through the
convolutional layers (also known as convolutional kernels) by combining multiple
local filters with the raw sequential data to generate invariant local features. Then, the
following pooling layers extracts the sequence of the local robust features hence
reducing the data spectrum in a multiple variables sequential data [77].
Additionally, in a real-time computing process, plant controllers need to
quickly make a decision based on the predicted output of the prediction model. To
accelerate and simplify the overall computing process, a simpler network architecture
for a faster predicted result are required. As a static feedforward ANN, an MLP may
not be suitable when longer time steps are involved [78]. With the conventional
Backpropagation Neural Network (BPNN), error signals flowing backwards has the
tendency to either blow up or vanish. This means, more time will be needed for the
model to simulate the analysis and produced a forecasted trip. To solve the issue, [79]
addresses it by introducing a novel and time efficient gradient based method known as
Long Short-Term Memory (LSTM). It enforces the constant error back flow of a
traditional backpropagation method by applying a multiplicative gate that opens and
closes the access to the constant flow creating a “constant error carousels”. Hence, to

54
further improve the current proposed monitoring system, integrating the LSTM may
be consider as the next method for quicker trip predicted result. Finally, it is hope that
the improved version of the proposed intelligent monitoring system can be
implemented on an actual coal-fired power plant.
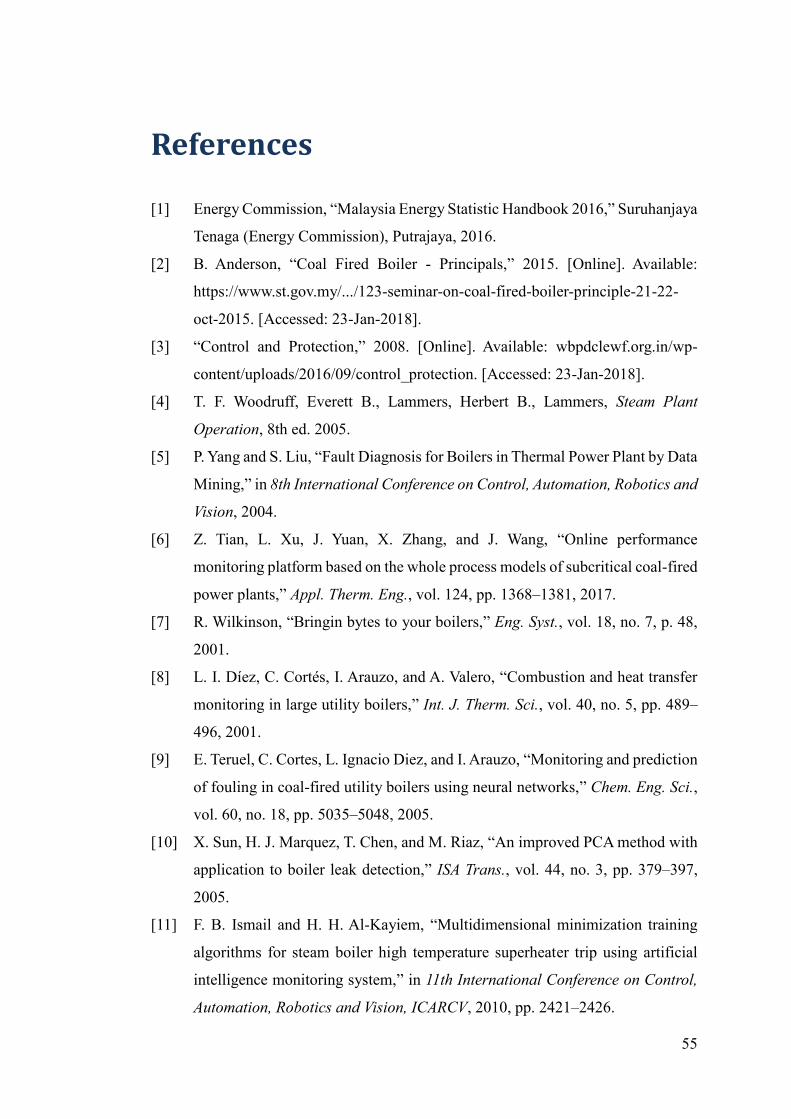
55
References
[1] Energy Commission, “Malaysia Energy Statistic Handbook 2016,” Suruhanjaya
Tenaga (Energy Commission), Putrajaya, 2016.
[2] B. Anderson, “Coal Fired Boiler - Principals,” 2015. [Online]. Available:
https://www.st.gov.my/.../123-seminar-on-coal-fired-boiler-principle-21-22-
oct-2015. [Accessed: 23-Jan-2018].
[3] “Control and Protection,” 2008. [Online]. Available: wbpdclewf.org.in/wp-
content/uploads/2016/09/control_protection. [Accessed: 23-Jan-2018].
[4] T. F. Woodruff, Everett B., Lammers, Herbert B., Lammers, Steam Plant
Operation, 8th ed. 2005.
[5] P. Yang and S. Liu, “Fault Diagnosis for Boilers in Thermal Power Plant by Data
Mining,” in 8th International Conference on Control, Automation, Robotics and
Vision, 2004.
[6] Z. Tian, L. Xu, J. Yuan, X. Zhang, and J. Wang, “Online performance
monitoring platform based on the whole process models of subcritical coal-fired
power plants,” Appl. Therm. Eng., vol. 124, pp. 1368–1381, 2017.
[7] R. Wilkinson, “Bringin bytes to your boilers,” Eng. Syst., vol. 18, no. 7, p. 48,
2001.
[8] L. I. Díez, C. Cortés, I. Arauzo, and A. Valero, “Combustion and heat transfer
monitoring in large utility boilers,” Int. J. Therm. Sci., vol. 40, no. 5, pp. 489–
496, 2001.
[9] E. Teruel, C. Cortes, L. Ignacio Diez, and I. Arauzo, “Monitoring and prediction
of fouling in coal-fired utility boilers using neural networks,” Chem. Eng. Sci.,
vol. 60, no. 18, pp. 5035–5048, 2005.
[10] X. Sun, H. J. Marquez, T. Chen, and M. Riaz, “An improved PCA method with
application to boiler leak detection,” ISA Trans., vol. 44, no. 3, pp. 379–397,
2005.
[11] F. B. Ismail and H. H. Al-Kayiem, “Multidimensional minimization training
algorithms for steam boiler high temperature superheater trip using artificial
intelligence monitoring system,” in 11th International Conference on Control,
Automation, Robotics and Vision, ICARCV, 2010, pp. 2421–2426.
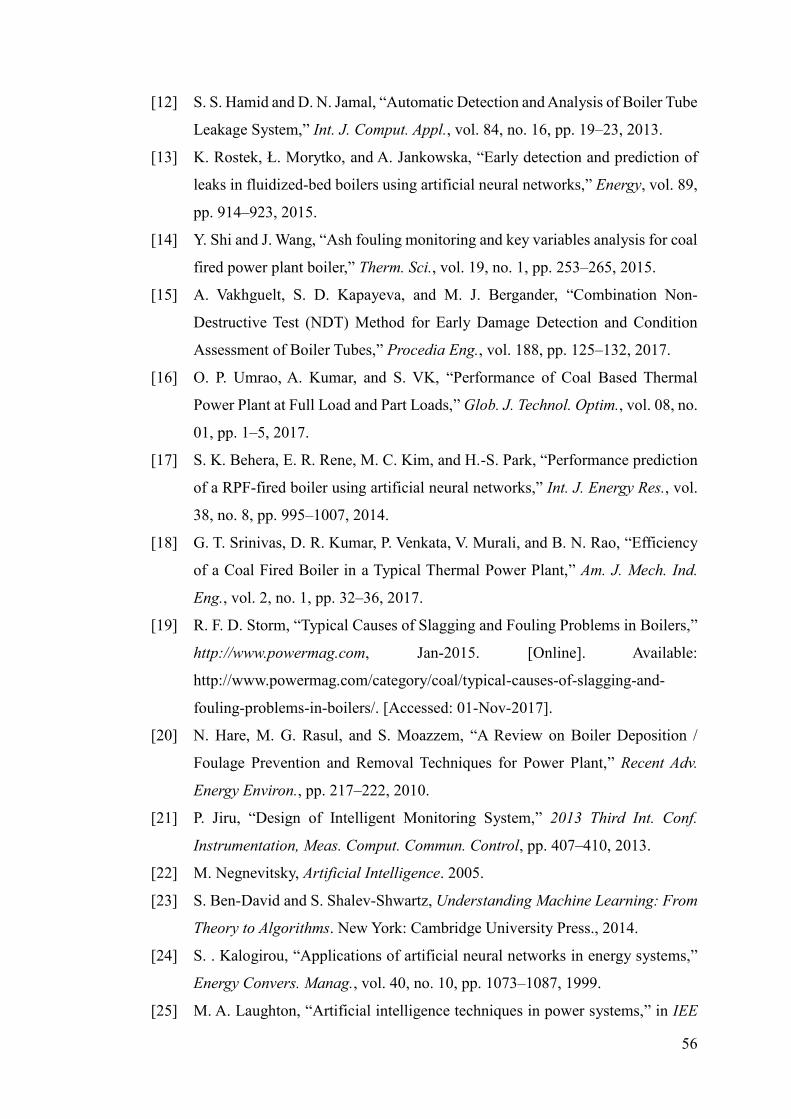
56
[12] S. S. Hamid and D. N. Jamal, “Automatic Detection and Analysis of Boiler Tube
Leakage System,” Int. J. Comput. Appl., vol. 84, no. 16, pp. 19–23, 2013.
[13] K. Rostek, Ł. Morytko, and A. Jankowska, “Early detection and prediction of
leaks in fluidized-bed boilers using artificial neural networks,” Energy, vol. 89,
pp. 914–923, 2015.
[14] Y. Shi and J. Wang, “Ash fouling monitoring and key variables analysis for coal
fired power plant boiler,” Therm. Sci., vol. 19, no. 1, pp. 253–265, 2015.
[15] A. Vakhguelt, S. D. Kapayeva, and M. J. Bergander, “Combination Non-
Destructive Test (NDT) Method for Early Damage Detection and Condition
Assessment of Boiler Tubes,” Procedia Eng., vol. 188, pp. 125–132, 2017.
[16] O. P. Umrao, A. Kumar, and S. VK, “Performance of Coal Based Thermal
Power Plant at Full Load and Part Loads,” Glob. J. Technol. Optim., vol. 08, no.
01, pp. 1–5, 2017.
[17] S. K. Behera, E. R. Rene, M. C. Kim, and H.-S. Park, “Performance prediction
of a RPF-fired boiler using artificial neural networks,” Int. J. Energy Res., vol.
38, no. 8, pp. 995–1007, 2014.
[18] G. T. Srinivas, D. R. Kumar, P. Venkata, V. Murali, and B. N. Rao, “Efficiency
of a Coal Fired Boiler in a Typical Thermal Power Plant,” Am. J. Mech. Ind.
Eng., vol. 2, no. 1, pp. 32–36, 2017.
[19] R. F. D. Storm, “Typical Causes of Slagging and Fouling Problems in Boilers,”
http://www.powermag.com, Jan-2015. [Online]. Available:
http://www.powermag.com/category/coal/typical-causes-of-slagging-and-
fouling-problems-in-boilers/. [Accessed: 01-Nov-2017].
[20] N. Hare, M. G. Rasul, and S. Moazzem, “A Review on Boiler Deposition /
Foulage Prevention and Removal Techniques for Power Plant,” Recent Adv.
Energy Environ., pp. 217–222, 2010.
[21] P. Jiru, “Design of Intelligent Monitoring System,” 2013 Third Int. Conf.
Instrumentation, Meas. Comput. Commun. Control, pp. 407–410, 2013.
[22] M. Negnevitsky, Artificial Intelligence. 2005.
[23] S. Ben-David and S. Shalev-Shwartz, Understanding Machine Learning: From
Theory to Algorithms. New York: Cambridge University Press., 2014.
[24] S. . Kalogirou, “Applications of artificial neural networks in energy systems,”
Energy Convers. Manag., vol. 40, no. 10, pp. 1073–1087, 1999.
[25] M. A. Laughton, “Artificial intelligence techniques in power systems,” in IEE
57
Colloquium on Artificial Intelligence Techniques in Power Systems, London:
Institution of Electrical Engineers, 1997, pp. 1–19.
[26] R. P. Nath and V. N. Balaji, “Artificial Intelligence in Power System,” Int. J.
Innov. Res. Electr. Electron. Instrum. Control Eng., vol. 3, no. 7, pp. 86–87,
2015.
[27] S. Madan and K. E. Bollinger, “Applications of artificial intelligence in power
systems,” Electr. Power Syst. Res., vol. 41, no. 2, pp. 117–131, 1997.
[28] X. Zhao and X. Zhang, “Artificial Intelligence Applications in Power Systems,”
in 2nd International Conference on Artificial Intelligence and Industrial
Engineering (AIIE2016), 2016, vol. 133, pp. 123–126.
[29] S. De, M. Kaiadi, M. Fast, and M. Assadi, “Development of an artificial neural
network model for the steam process of a coal biomass cofired combined heat
and power (CHP) plant in Sweden,” Energy, vol. 32, no. 11, pp. 2099–2109,
2007.
[30] J. Smrekar, M. Assadi, M. Fast, I. Kuštrin, and S. De, “Development of artificial
neural network model for a coal-fired boiler using real plant data,” Energy, vol.
34, no. 2, pp. 144–152, 2009.
[31] M. Fast and T. Palmé, “Application of artificial neural networks to the condition
monitoring and diagnosis of a combined heat and power plant,” Energy, vol. 35,
no. 2, pp. 1114–1120, 2010.
[32] S. Haykin, “Neural networks expand SP,” IEEE Signal Processing Magazine,
vol. 13, no. 2. pp. 24–49, 1996.
[33] J. C. Principe, N. R. Euliano, and L. C. W., Neural and Adaptive Systems:
Fundamentals through simulations, 1st ed. New York: John Wiley & Sons Inc.,
1999.
[34] B. Pena, E. Teruel, and L. I. Diez, “Soft-computing models for soot-blowing
optimization in coal-fired utility boilers,” Appl. Soft Comput. J., vol. 11, no. 2,
pp. 1657–1668, 2011.
[35] T. Bekat, M. Erdogan, F. Inal, and A. Genc, “Prediction of the bottom ash
formed in a coal-fired power plant using artificial neural networks,” Energy,
vol. 45, no. 1, pp. 882–887, 2012.
[36] M. Kljajić, D. Gvozdenac, and S. Vukmirović, “Use of Neural Networks for
modeling and predicting boiler’s operating performance,” Energy, vol. 45, no.
1, pp. 304–311, 2012.
58
[37] N. Mayadevi, S. Ushakumari, and V. C. SS, “A Review on Expert System
Applications in Power Plants,” Int. J. Electr. Comput. Eng. J., vol. 4, no. 1, pp.
2088–8708, 2014.
[38] M. S. Priya, R. Kanthavel, and M. Saravanan, “Fault Diagnostics on Steam
Boilers and Forecasting System Based on Hybrid Fuzzy Clustering and
Artificial Neural Networks in Early Detection of Chamber Slagging/Fouling,”
Circuits Syst., vol. 07, no. 12, pp. 4046–4070, 2016.
[39] A. Kumari, S. K. Das, and P. K. Srivastava, “Modeling fireside corrosion rate
in a coal fired boiler using adaptive neural network formalism,” Port.
Electrochim. Acta, vol. 34, no. 1, pp. 23–38, 2016.
[40] K. Sujatha, N. P. G. Bhavani, T. K. Reddy, and K. S. R. Kumar, “Internet of
things for flame monitoring power station boilers,” Proc. - TIMA 2017 9th Int.
Conf. Trends Ind. Meas. Autom., 2017.
[41] A. Dehghani, “Combined cycle power plant with indirect dry cooling tower
forecasting using artificial neural network,” Decis. Sci. Lett., vol. 7, no. 2, pp.
131–142, 2018.
[42] X. Chen and J. Wang, “A Soft-Sensing Model for Oxygen-Content in Flue
Gases of Coal-Fired Power Plant Based on Neural Network,” in 37th Chinese
Control Conference (CCC), 2018, pp. 3657–3661.
[43] S. Teir and A. Jokivuori, “Heat Exchangers in Boilers,” in Steam Boiler
Technology eBook, 2002.
[44] S. Teir, Modern Boiler Types and Applications. Espoo, Finland: Energy
Engineering and Environmental Protection Publications, 2002.
[45] R. Isermann, “Model-based fault detection and diagnosis – status and
applications,” Annu. Rev. Control, vol. 29, no. 1, pp. 71–85, 2005.
[46] L. M. Romeo and R. Gareta, “Neural network for evaluating boiler behaviour,”
Appl. Therm. Eng., vol. 26, no. 14–15, pp. 1530–1536, 2006.
[47] H. Rusinowski and W. Stanek, “Neural modelling of steam boilers,” Energy
Convers. Manag., vol. 48, no. 11, pp. 2802–2809, 2007.
[48] A. Ong’iro, V. I. Ugursal, A. M. Al Taweel, and J. D. Walker, “Modeling of heat
recovery steam generator performance,” Appl. Therm. Eng., vol. 17, no. 5, pp.
427–446, 1997.
[49] M. Gupta and R. Kumar, “Graph theoretic approach for performance evaluation
of a boiler,” Proc. - 2013 Int. Conf. Mach. Intell. Res. Adv. ICMIRA, 2013.
59
[50] “Manjung 4: An ultra-supercritical first in Southeast Asia,” 2012. [Online].
Available: https://www.powerengineeringint.com/articles/print/volume-
20/issue-8/power-report/manjung-4-an-ultra-supercritical-first-in-southeast-
asia.html. [Accessed: 26-Oct-2018].
[51] F. B. I. Alnaimi and H. H. Al-Kayiem, “AI system for Steam Boiler Diagnosis
based on Superheater Monitoring.pdf,” J. Appl. Sci., p. 7, 2011.
[52] J. Heaton, AIFH, Volume 3: Deep Learning and Neural Networks, 1.0., vol. 3.
Heaton Research, Inc., 2015.
[53] M.-C. Popescu, V. E. Balas, L. Perescu-Popescu, and N. Mastorakis,
“Multilayer Perceptron and Neural Networks,” vol. 8, no. 7, pp. 579–588, 2009.
[54] M. Riedmiller, “Rprop-description and implementation details,” Report, pp. 5–
6, 1994.
[55] G. Thimm and E. Fiesler, “High-order and multilayer perceptron initialization,”
IEEE Trans. Neural Networks, vol. 8, no. 2, pp. 349–359, 1997.
[56] J. Smrekar, D. Pandit, M. Fast, M. Assadi, and S. De, “Prediction of power
output of a coal-fired power plant by artificial neural network,” Neural Comput.
Appl., vol. 19, no. 5, pp. 725–740, 2010.
[57] M. F. Møller, “A scaled conjugate gradient algorithm for fast supervised
learning,” Neural Networks, vol. 6, no. 4, pp. 525–533, 1993.
[58] F. B. I. Alnaimi, R. I. B. Ismail, and P. J. Ker, “Development and
Implementation of Intelligent Condition Monitoring System for Steam Turbine
Trips,” vol. 11, no. 24, pp. 14275–14283, 2016.
[59] Y. F. Yam, C. T. Leung, P. K. S. Tam, and W. C. Siu, “An independent
component analysis based weight initialization method for multilayer
perceptrons,” Neurocomputing, vol. 48, pp. 807–818, 2002.
[60] S. Timotheou, “A novel weight initialization method for the random neural
network,” Neurocomputing, vol. 73, no. 1–3, pp. 160–168, 2009.
[61] X. Glorot and Y. Bengio, “Understanding the difficulty of training deep
feedforward neural networks,” in 13th International Conference on Artificial
Intelligence and Statistics (AISTATS), 2010, vol. 9, pp. 249–256.
[62] K. He, X. Zhang, S. Ren, and J. Sun, “Delving deep into rectifiers: Surpassing
human-level performance on imagenet classification,” Proc. IEEE Int. Conf.
Comput. Vis., vol. 2015 International Conference on Computer Vision, ICCV
2015, pp. 1026–1034, 2015.
60
[63] B. R. Kumar, K. V. Ramana, and K. M. Rao, “Condition monitoring and fault
diagnosis of a boiler feed pump unit,” J. Sci. Ind. Res. (India)., vol. 68, no. 9,
pp. 789–793, 2009.
[64] N. N. Mohd Nistah, F. Motalebi, Y. Samyudia, and F. B. I. Alnaimi, “Intelligent
Monitoring Interfaces for Coal Fired Power Plant Boiler Trips : A Review,”
Pertanika J. Sci. Technol., vol. 22, no. 2, pp. 593–601, 2014.
[65] H. Noureldin and F. Roveta, “Using Expert System and Object Technology for
Abnormal Condition Management,” 2002.
[66] N. Baxter, “Remote Machine Monitoring : A Developing Industry,” 2006.
[67] A. Isabella and J. E. Retna, “Study Paper on Test Case Generation for Gui Based
Testing,” Int. J. Softw. Eng. Appl., vol. 3, no. 1, pp. 139–147, 2012.
[68] Z. Singhera, E. Horowitz, and A. Shah, “A Graphical User Interface (GUI)
Testing Methodology,” Int. J. Inf. Technol. Web Eng., vol. 3, no. 2, pp. 1–18,
2008.
[69] J. Chacón, G. Farias, H. Vargas, A. Visioli, and S. Dormido, “Remote
Interoperability Protocol: A bridge between interactive interfaces and
engineering systems,” IFAC-PapersOnLine, vol. 48, no. 29, pp. 247–252, 2015.
[70] M. Blanton et al., “Human-Computer Interaction,” Encycl. Database Syst., pp.
1327–1331, 2009.
[71] K. Martinsen, J. Downey, and I. Baturynska, “Human-Machine Interface for
Artificial Neural Network Based Machine Tool Process Monitoring,” Procedia
CIRP, vol. 41, pp. 933–938, 2016.
[72] G. K. Singh and S. A. S. Al Kazzaz, “Development of an intelligent diagnostic
system for induction machine health monitoring,” IEEE Syst. J., vol. 2, no. 2,
pp. 273–288, 2008.
[73] E. Mesbahi, M. Genrup, and M. Assadi, “Fault prediction/diagnosis and sensor
validation technique for a steam power plant,” pp. 33–40, 2005.
[74] Y. H. Bae, S. H. Lee, H. C. Kim, B. R. Lee, J. Jang, and J. Lee, “A real-time
intelligent multiple fault diagnostic system,” Int. J. Adv. Manuf. Technol., vol.
29, no. 5–6, pp. 590–597, 2006.
[75] J. Ma, “Methods and Systems for Fault Disgnosis in Nuclear Power Plants,”
The University of Western Ontario, 2015.
[76] R. Zhao, R. Yan, J. Wang, and K. Mao, “Learning to monitor machine health
with convolutional Bi-directional LSTM networks,” Sensors (Switzerland), vol.

61
17, no. 2, pp. 1–18, 2017.
[77] T. Y. Kim and S. B. Cho, “Predicting residential energy consumption using
CNN-LSTM neural networks,” Energy, vol. 182, pp. 72–81, 2019.
[78] D. Zhang, G. Lindholm, and H. Ratnaweera, “Use long short-term memory to
enhance Internet of Things for combined sewer overflow monitoring,” J.
Hydrol., vol. 556, pp. 409–418, 2018.
[79] S. Hochreiter and J. Schmidhuber, “Long Short-Term Memory,” Neural
Comput., vol. 9, no. 8, pp. 1–32, 1997.