Embed Size (px)
Citation preview

ARTICLE IN PRESS
Computers in Biology and Medicine ( ) –www.intl.elsevierhealth.com/journals/cobm
An intelligent system for automatic detection of gastrointestinaladenomas in video endoscopy
Dimitris K. Iakovidisa,∗, Dimitris E. Maroulisa, Stavros A. Karkanisb
aDepartment of Informatics and Telecommunications, University of Athens, Panepistimiopolis, Illisia, 15784 Athens, GreecebDepartment of Informatics and Computer Technology, Technological Educational Institute of Lamia, 3rd km Old National
Road, 35100 Lamia, Greece
Abstract
Today 95% of all gastrointestinal carcinomas are believed to arise from adenomas. The early detection of adenomascould prevent their evolution to cancer. A novel system for the support of the detection of adenomas in gastrointestinalvideo endoscopy is presented. Unlike other systems, it accepts standard low-resolution video input thus requiring lesscomputational resources and facilitating both portability and the potential to be used in telemedicine applications. Itcombines intelligent processing techniques of SVMs and color–texture analysis methodologies into a sound patternrecognition framework. Concerning the system’s accuracy this was measured using ROC analysis and found toexceed 94%.� 2005 Elsevier Ltd. All rights reserved.
Keywords: Biomedical system; Video endoscopy; Color–texture features; Support vector machines; Gastrointestinal lesions;Adenomas
1. Introduction
Gastrointestinal neoplasms include polyps arising from the epithelial cells of the gastric and the colonicmucosa. These polyps are mainly classified into two types: adenomatous and hyperplastic polyps. Polypsof the first type, also referred to as adenomas, are usually cancer precursor lesions, whereas polyps ofthe second type are not considered to be premalignant. Definitive distinction between the two typesrequires polyp biopsy and histological examination of the tissue specimens. Although there are modern
∗ Corresponding author. Tel.: +30 210 7275317; fax: +30 210 7275333.E-mail address: [email protected] (D.K. Iakovidis).
0010-4825/$ - see front matter � 2005 Elsevier Ltd. All rights reserved.doi:10.1016/j.compbiomed.2005.09.008

2 D.K. Iakovidis et al. / Computers in Biology and Medicine ( ) –
ARTICLE IN PRESS
non-invasive procedures to detect polyps, such as virtual endoscopy, standard video endoscopy remainsthe most efficient minimally invasive procedure to detect even small-size polyps that allows biopsy andin many cases polyp resection. Today, the international consensus for the treatment of polyposis dictatesremoval of all polyps, regardless of the location, the size or other characteristics, in order to prevent apossible development of cancer [1–3].
During an endoscopic examination it is possible for some polyps to go undetected and evolve intomalignant tumors in the following years. A reliable system that would be capable of supporting thedetection of adenomas could increase the endoscopist’s ability to accurately locate early stage adenomas,and could contribute to the reduction of the duration of the endoscopic procedure, which is in most casesuncomfortable for the patients. Such a system would minimize the expert’s subjectivity introduced in theevaluation of the clinical characteristics of the examined tissue. Moreover, a consequent cost reduction ofthe operation would also be feasible, as more patients could be examined faster even by less experiencedpersonnel.
A variety of methods have been proposed in the literature for computer-aided evaluation of gastroin-testinal endoscopic images or video. First attempts include the application of edge detection methods forthe detection of gastric ulcers [4], region-growing methods for the extraction of large intestinal lumencontours [5] and for the detection of abnormalities in the lower gastrointestinal tract [6].
By the end of the nineties, texture analysis methods combined with intelligent pattern classificationtechniques began to arise for the detection of lesions in endoscopic images. These methods were moti-vated by the fact that the textural characteristics of the tumorous lesions can be used for diagnosis notonly microscopically [7] but also macroscopically [8]. Neural network-based grey-level texture analy-sis approaches of endoscopic images include the usage of texture spectrum [9], co-occurrence matrix[10,11], Local Binary Patterns (LBP) [12] and wavelet- domain co-occurrence matrix features [13]. Thelatter approach has been applied for tumor detection in colonoscopic video-frame sequences in [14] andit was integrated in a versatile and standalone software system for the detection of colorectal lesions inendoscopic video-frames named CoLD [15].
Although texture has proved to be important for the characterization of colorectal lesions, it has beenshown that color can be used as an additional clue for the detection of lesions in endoscopic images.Tjoa and Krishnan [16] combined texture spectrum and color histogram features for the analysis of colonstatus. Karkanis et al. [17] extended the concept of wavelet-domain co-occurrence matrix features forcolor images and proposed the Color Wavelet Covariance (CWC) features for computer-aided detectionof adenomatous polyps of the colon in high-resolution endoscopic video-frames. The experimental resultsshowed that these features lead to higher detection sensitivity than the original grey-level features andother color–texture descriptors [18]. In a later work, Zheng et al. [19] proposed a clinical decision supportsystem based on a Bayesian fusion scheme that combines color, texture and lumen contour informationfor the detection of lumps and bleeding lesions in colonoscopic images. The fusion approach led to amarginal improvement of the system’s sensitivity and specificity for lump detection as compared withthe performance achieved only by extracting grey-level LBP histograms.
In this paper we present a novel intelligent system for automatic detection of colonic and gastric ade-nomas in endoscopic videos. It utilizes color–texture image features and incorporates non-linear SupportVector Machines (SVMs) to achieve improved detection accuracy compared to the linear classificationscheme utilized in [17]. Moreover, we focus on the selection of a feature extraction method appropriatefor the analysis of low rather than high-resolution video-frames. The advantages emanating from theadoption of such a method include processing time reduction, applicability in telemedicine and less de-

ARTICLE IN PRESSD.K. Iakovidis et al. / Computers in Biology and Medicine ( ) – 3
manding hardware requirements. The assessment of the system’s performance is realized by means ofReceiver Operating Characteristics (ROC), which provide more reliable estimates of accuracy comparedto other measures, not deriving from ROC [20], which have been adopted in the previously cited works.
The rest of this paper consists of four sections. Section 2 describes the architecture of the proposedsystem. The methods investigated for the implementation of each module of the system are described inSection 3. In Section 4, we present the experimental results from the application of the proposed systemfor the detection of colonic and gastric adenomas, in colonoscopic and gastroscopic videos, respectively.Finally, the conclusions as well as future perspectives of this study are summarized in Section 5.
2. System architecture
The design of the proposed system takes into account the practical needs of both traditional andcontemporary endoscopists and allows standard low-resolution video input. The endoscopic examinationsor at least the most informative video segments are usually recorded by the endoscopists on standard VHSvideotapes, for further, more thorough clinical evaluation. Scarcely do contemporary endoscopists utilizemodern digital equipment, which allows direct recording of the endoscopic examination on digital mediain standard video file formats (Fig. 1).
The proposed system is implemented in Microsoft Visual C++ and it can be installed in most conven-tional Personal Computers (PCs) equipped with Microsoft Windows operating system. It accepts videofiles of the standard AVI format as input, and it outputs characterized video files with markers framing allpossible adenomas in the video-frame sequence. It consists of four modules, namely a pre-processing, afeature extraction, a classification and a post-processing module (Fig. 1). In the sequel, the operation ofthese modules is outlined, and the methods employed in each module are further described in Section 3.
2.1. Pre-processing module
The pre-processing module handles the extraction of video-frames with a user-defined frame rate andsize corresponding to a Region of Interest (ROI) within the original video-frames. This aims to exclusionof irrelevant textual information, such as patient’s name, date of birth, date and time of the examination,printed on a constant dark background (Fig. 2). Another task of the pre-processing module is to applycolor transformations on the extracted video-frames. The RGB color information they contain can bethen transformed to other color models that could enhance the detection of adenomas.
2.2. Feature extraction module
The feature extraction module is assigned to the estimation of color–texture measures from the pre-processed video-frames. More specifically, each frame is raster scanned with a sliding window of user-defined size and sliding step. For each window a number of features are estimated producing this waya single feature vector, as illustrated in Fig. 3. The number of feature vectors produced for each framedepends on its size, the dimensions and the step of the sliding window.

4 D.K. Iakovidis et al. / Computers in Biology and Medicine ( ) –
ARTICLE IN PRESS
Endoscope
VHS medium
Pre-processing
Feature extraction
Classification
Post-processing
Recording
Frame grabbing& Compression
AnalogDigital
Personal Computer
Endoscopicvideo file
IntelligentSoftware System
Outputvideo file
Digital medium
Fig. 1. Block diagram of the proposed system.
Fig. 2. ROI extraction during pre-processing.

ARTICLE IN PRESSD.K. Iakovidis et al. / Computers in Biology and Medicine ( ) – 5
Fig. 3. Feature extraction technique.
Fig. 4. Post-processing of labeled video-frames: (a) input frame, (b) labeled frame, (c) marker framing the regions labeled aspossible adenomas by the classification module, (d) system’s output after post-processing.
2.3. Classification module
This module handles the classification of the feature vectors into one of the two classes: adenomas ornon-adenomas. The first class usually represents a minority-class of samples, whereas the latter representsa majority-class of samples. In the rest of this document these classes are referred to as normal andabnormal, respectively.
The classification module operates in two modes: the training and the testing modes. The training modeof operation requires that the classification module should be fed with feature vectors from representativevideo-frames, previously selected and characterized by experts in gastroenterology. During training,the classification module determines its internal parameters based on the available training samples. Inthe testing mode of operation it utilizes the knowledge gained from the training samples to classifynew samples extracted from unknown video-frames. The test samples are forwardly propagated and areconsequently labeled as normal or abnormal. For each frame a stream of labels is generated and directedto the post-processing module that follows.
2.4. Post-processing module
The post-processing module utilizes the output of the classification module to produce new video-frames on which the possible adenomas are appropriately marked. The technique applied is illustrated inFig. 4. The stream of labels inputted to the post-processing module is used for the formation of labeledvideo-frames. Fig. 4(b) illustrates a labeled frame, on which the white color represents abnormal regions

6 D.K. Iakovidis et al. / Computers in Biology and Medicine ( ) –
ARTICLE IN PRESS
and the black color represents normal regions. The labeled frame is superimposed with the input frame(Fig. 4a) and a marker is drawn as the outer outline of all the abnormal regions (Fig. 4c, d).
3. Methods
3.1. Color model transformations
Many medical applications utilize color to provide additional information that could enhance thediagnostic accuracy. The most common representation of color in digital imaging is realized by means ofthe RGB color model. The direct use of the RGB model has proved to be inadequate for the descriptionof clinical and pathological characteristics of tissues for various medical diagnostic tasks, including thedetection and diagnosis of early stage lesions in endoscopic images [21,22]. Major drawbacks of the RGBcolor model include the high correlation among its components and the inconformity with the perceptualmechanisms of the human brain [23].
A variety of color models have been proposed to overcome these drawbacks. These models can bederived from the RGB color model by linear or non-linear transformations implemented in the pre-processing module [17].
3.1.1. Linear transformationsLinear RGB transformations commonly include XYZ, YIQ, and K-L or I1I2I3 models [23,24]. Color–
texture analysis studies conclude that the use of orthogonal color models improves texture discrimination,with the YIQ and K-L to be the most prominent models of this type [18]. The YIQ model, which is used forNTSC video signal transmission, is nearly orthogonal, whereas K-L has been designed to be orthogonal.The K-L transform of an image is originally formed by the eigenvector of the image’s correlation matrix.Ohta et al. [24] showed that this matrix remains approximately the same for a large set of natural colorimages and in practice it can be approximated by a linear transformation of the RGB components. Theaxes of the K-L space (I1, I2 and I3) are statistically uncorrelated. I1 explains the highest proportion of thetotal variance and represents intensity, whereas I2 and I3 correspond to the second and the third highestproportion, respectively, and represent chromatic information.
From a computational point of view the calculation of K-L from RGB is far simpler than that ofYIQ, since it requires simple integer operations [24]. Moreover, it has been experimentally shown thatK-L leads to a more accurate texture classification than YIQ, when used prior to color–texture featureextraction [18], and has been successfully utilized for the detection of adenomas [17].
3.1.2. Non-linear transformationsTwo major categories of color models that usually derive from non-linear transformation of the RGB
components include the phenomenal and the CIE-uniform color models [23]. The phenomenal colormodels attempt to classify colors in relation to how they are perceived by the human brain. In general,these color models mainly incorporate hue, saturation and brightness as classifying descriptors, and theyare intuitive as regards color manipulation. CIE-uniform color models have been proposed to describecolor closer to the way it is perceived by humans, in the sense that the Euclidean distances measure theperceived color differences.

ARTICLE IN PRESSD.K. Iakovidis et al. / Computers in Biology and Medicine ( ) – 7
The results of previous research on color–texture analysis [18,25] as well as on endoscopic image andvideo analysis [17] suggest that HSV and CIE-Lab color models should be considered in this study, as rep-resentative members of the phenomenal and the CIE-uniform color model categories, respectively. HSVconsists of hue, saturation and brightness value components, whereas CIE-Lab consists of a Lightnesscomponent and two chromatic components, a and b.
3.2. Grey-level and color–texture feature extraction
The texture analysis methods have been initially developed for grey-level images mainly because coloris not mandatory for the human perception of texture. The effectiveness of the wavelet transform fortexture analysis has been pointed out in many studies for texture classification [27,28]. Experimentsin color–texture analysis have shown that color information enhances texture classification [29]. Earlycolor–texture analysis approaches mainly involved the extraction of grey-level texture features from eachimage color channel separately [29]. Recent approaches to color–texture analysis focus on the exploitationof both intra- and inter-channel information [18,30–32].
Motivated by these studies we investigate the performance of three color–texture feature sets, namely theWavelet Correlation Signatures (WCS), the Color Wavelet Covariance features (CWC) and the OpponentColor–Local Binary Pattern (OC–LBP) histograms, for the detection of gastrointestinal adenomas in low-resolution endoscopic video. The first two have been applied for the detection of only colonic adenomasin high-resolution video-frames. The last one has been proposed as extension of the LBP for color images[30] and has not been applied for endoscopic image or video analysis in the literature. Moreover, we haveconsidered the extraction of grey-level features such as Wavelet Energy (WE), LBP and Color WaveletEnergy (CWE) features for comparison purposes.
3.2.1. Wavelet energy featuresThe Discrete Wavelet Transform (DWT) of a grey-level image is realized by convolution of the image
with a low pass filter L and a high pass filter H , the output of which is then sub-sampled dyadically.This procedure produces a low-resolution image B0(k) and detail images Bj(k), j = 1, 2, 3, at scale k,as described by the following equations [33]:
B0(k) = {Lx ∗ [Ly ∗ B0(k − 1)]↓2x}↓2y,
B1(k) = {Hx ∗ [Ly ∗ B0(k − 1)]↓2x}↓2y,
B2(k) = {Hx ∗ [Hy ∗ B0(k − 1)]↓2x}↓2y,
B3(k) = {Lx ∗ [Hy ∗ B0(k − 1)]↓2x}↓2y,
(1)
where ↓ 2 denotes the sub-sampling procedure, x and y denote the row-wise and columnwise operationsinvolved, respectively, and the asterisk (*) is the convolution operator. The repetition of this filteringprocedure for k = 1, 2, . . . , K results in a multiscale representation of the image. The resulting imagesBj(k) comprise wavelet coefficients bj,k that encode the content of the input image in variable widthspatial frequency bands. By omitting sub-sampling in Eqs. (1), a variation of DWT, the Discrete WaveletFrame Transform (DWFT), is produced [26]. DWFT is a redundant representation that leads to a texturedescription tolerant to translation [27,28]. The wavelet energy features are estimated by summing the

8 D.K. Iakovidis et al. / Computers in Biology and Medicine ( ) –
ARTICLE IN PRESS
squares of all bj,k coefficients of the detail images Bj(k), j = 1, 2, 3:
EBj (k) =∑
i
bj,k(i)2. (2)
The low-resolution images of the DWFT are not taken into account for the computation of the energies as ithas been shown that the detail images at any decomposition level perform better for the characterizationof textures than the low-resolution images [34]. A straightforward approach to extract DWFT energyfeatures from color images is to apply DWFT to each color channel Ci and then use Eq. (2) to extract
CWE features EBj (k)
Ci, i = 1, 2, 3, from each color channel Ci of the image separately.
In this study, the DWFT was implemented by using biorthogonal spline filters as they have proved tobe more suitable for texture characterization [35].
3.2.2. Wavelet correlation signaturesThe WCS have been proposed by Van de Wouwer et al. [18] as extensions of the DWFT energy features
that take into account the correlation of the wavelet coefficients between the image color channels. Theyare derived by the following equation:
WCBj (k)
Cl,Cm=
⎧⎪⎨⎪⎩
EBj (k)
Cl, l = m,
∑ib
j,kCl
(i)bj,kCm
(i)
EBj (k)
Cl·EBj (k)
Cm
, l �= m,(3)
where bj,kCl
and bj,kCm
are the coefficients of the detail images Bj(k), j = 1, 2, 3, k = 1, 2, . . . , K, of thecolor channels Cl and Cm,l = 1, 2, 3, m = 1, 2, 3, respectively.
3.2.3. Color wavelet covariance featuresThe CWC features are covariance estimates of the second-order statistical information inherent in the
DWFT of the color channels of an image [17,31,32]. The image color channels are transformed to thewavelet domain by the DWFT. The second-order statistical information of the wavelet coefficients iscaptured by means of co-occurrence matrices [36]. Co-occurrence matrices encode the grey-level spatialdependence based on the estimation of the second-order joint conditional probability density functionf (i, j, d, a), which is computed by counting all pairs of pixels at distance d having grey-levels i and j
at a given direction a. The angular displacement of d = 1 corresponds to four discrete directions at 0◦,45◦, 90◦ and 135◦.
LetMBj(k)
Ci(a)be a co-occurrence matrix estimated over a detail imageBj(k), j=1, 2, 3, k=1, 2, . . . , K ,
of the color channel Ci,i = 1, 2, 3, for a direction a. Four representative statistical features are estimatedover each detail image Bj(k), j = 1, 2, 3, k = 1, 2, . . . , K , namely the angular second moment (f1),the correlation (f2), the inverse difference moment (f3) and the entropy (f4) [36]. The resulting set offeatures that corresponds to the different color channels Ci is
FBj (k)
Ci(a), i = 1, 2, 3, j = 1, 2, 3, k = 1, 2, . . . , K , (4)
where F ∈ {f1, f2, f3, f4} and a ∈ {0◦, 45◦, 90◦, 135◦}.
ARTICLE IN PRESSD.K. Iakovidis et al. / Computers in Biology and Medicine ( ) – 9
6 5 2
7 6 1
9 3 7
1 0 0
1 0
1 0 1
1 2 4
8 16
32 64 128
1 0 0
8 0
32 0 128
(a) (b) (c) (d)
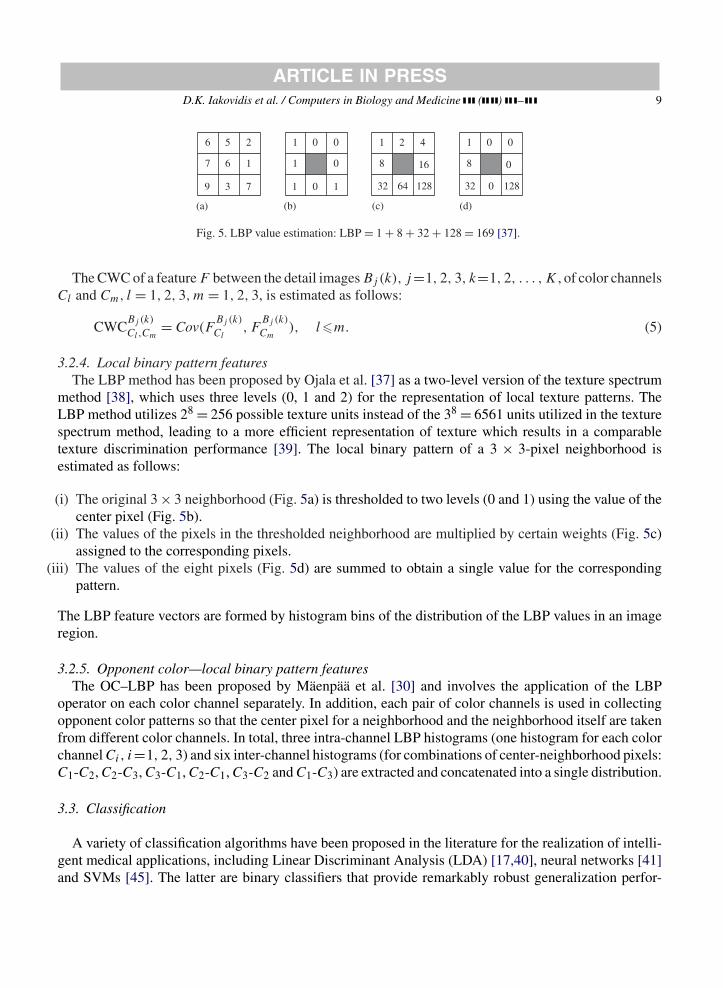
Fig. 5. LBP value estimation: LBP = 1 + 8 + 32 + 128 = 169 [37].
The CWC of a feature F between the detail images Bj(k), j=1, 2, 3, k=1, 2, . . . , K , of color channelsCl and Cm, l = 1, 2, 3, m = 1, 2, 3, is estimated as follows:
CWCBj (k)
Cl,Cm= Cov(F
Bj (k)
Cl, F
Bj (k)
Cm), l�m. (5)
3.2.4. Local binary pattern featuresThe LBP method has been proposed by Ojala et al. [37] as a two-level version of the texture spectrum
method [38], which uses three levels (0, 1 and 2) for the representation of local texture patterns. TheLBP method utilizes 28 = 256 possible texture units instead of the 38 = 6561 units utilized in the texturespectrum method, leading to a more efficient representation of texture which results in a comparabletexture discrimination performance [39]. The local binary pattern of a 3 × 3-pixel neighborhood isestimated as follows:
(i) The original 3 × 3 neighborhood (Fig. 5a) is thresholded to two levels (0 and 1) using the value of thecenter pixel (Fig. 5b).
(ii) The values of the pixels in the thresholded neighborhood are multiplied by certain weights (Fig. 5c)assigned to the corresponding pixels.
(iii) The values of the eight pixels (Fig. 5d) are summed to obtain a single value for the correspondingpattern.
The LBP feature vectors are formed by histogram bins of the distribution of the LBP values in an imageregion.
3.2.5. Opponent color—local binary pattern featuresThe OC–LBP has been proposed by Mäenpää et al. [30] and involves the application of the LBP
operator on each color channel separately. In addition, each pair of color channels is used in collectingopponent color patterns so that the center pixel for a neighborhood and the neighborhood itself are takenfrom different color channels. In total, three intra-channel LBP histograms (one histogram for each colorchannel Ci, i=1, 2, 3) and six inter-channel histograms (for combinations of center-neighborhood pixels:C1-C2, C2-C3, C3-C1, C2-C1, C3-C2 and C1-C3) are extracted and concatenated into a single distribution.
3.3. Classification
A variety of classification algorithms have been proposed in the literature for the realization of intelli-gent medical applications, including Linear Discriminant Analysis (LDA) [17,40], neural networks [41]and SVMs [45]. The latter are binary classifiers that provide remarkably robust generalization perfor-

10 D.K. Iakovidis et al. / Computers in Biology and Medicine ( ) –
ARTICLE IN PRESS
�
Fig. 6. A linear SVM solution to a linearly separable classification problem.
mance, even with sparse and noisy data. They resist to overfitting the training data and their classificationperformance is not easily affected by the magnitude of the features-to-samples ratio [42]. Moreover,SVMs are less empirical as regards the determination of their parameters compared to standard neuralnetworks and they have proved to be more accurate than other classifiers in many applications, includingthe classification of textures [46] and CT colonography patterns [47].
The training of the SVMs involves a quadratic programming optimization procedure which aims at theidentification of a subset of vectors from the training set, called support vectors. These vectors are utilizedfor the drawing of a separating hypersurface between two classes. In the case of linearly separable classes,the support vector algorithm searches for the separating hyperplane which leads to the largest possiblemargin � between the two classes. A typical example in a two-dimensional feature space is illustratedin Fig. 6. The solid line is the solution hyperplane, the margin � is the distance between the two paralleldashed lines, and the outlined black and white samples correspond to the support vectors.
Non-linear classification is based on the idea of injecting the data points into a higher-dimensionalHilbert space via some non-linear mapping �, and using the linear support vector algorithm there toseparate the training samples. The support vector algorithm in its general form, which includes the non-linear classification of non-linearly separable classes, proceeds as follows [42,43]:
Let I be an input space of vectors xi, i = 1, 2, . . . , N , distributed to two classes, which are labeled asyi ∈ {−1, 1}. Considering � being a non-linear mapping from the input space I ⊆ Rn to a Euclideanspace E, training the SVM results in a vector w and a scalar w0 of a hypersurface defined by theequation
w�(x) + w0 = 0, (6)
so that the margin of separation between the two classes is maximized. It is easy to prove that for themaximal margin hypersurface,
w =N∑
i=1
�iyi�T(xi), (7)

ARTICLE IN PRESSD.K. Iakovidis et al. / Computers in Biology and Medicine ( ) – 11
and w0 is estimated from the Karush–Kuhn–Tucker complementarity condition. The variables �i areLagrange multipliers which are estimated by maximizing the Lagrangian
LD =N∑
i=1
�i − 1
2
N∑i=1
N∑j=1
�i�j yiyjK(xi, xj ), (8)
with respect to �i . The vectors xi for which 0 < �i �c are the support vectors and c is a positive costparameter. As c increases a higher penalty for errors is assigned.
The function K(xi, xj ) is known as kernel function and should satisfy Mercer’s condition [43]. It isdefined by the following inner product:
K(xi, xj ) = �T(xi)�(xj ). (9)
Common choices include the linear and the Gaussian radial basis function (RBF) kernel, which areestimated by the following equations, respectively:
K(xi, xj ) = xixj , (10)
K(xi, xj ) = e−‖xi−xj‖2/�, (11)
where � is a strictly positive constant. The Gaussian kernel performs usually better than other non-linear kernels, such as the polynomial, because it usually has a better boundary response as it allows forextrapolation, and most high-dimensional data sets can be approximated by Gaussian- like distributionssimilar to those used by radial basis function networks [44]. Moreover, it involves only one parameter(�), and thus facilitates the search for the optimal values of the SVM parameters.
The hypersurface separating the two classes can be finally derived by the following equation:∑
∀i:1� i �N,0<�i �c
�iyiK(xi, x) + w0 = 0. (12)
Given a test input vector x, the trained SVM produces an output value s which corresponds to the labelof the class it belongs to:
s = sign
⎛⎝ ∑
∀i:1� i �N,0<�i �c
�iyiK(xi, x) + w0
⎞⎠ , (13)
where sign is a function that returns 1 for positive and −1 for non-positive input values.In the proposed system the SVMs implement the classification module which handles the classification
of the feature vectors xi , extracted from endoscopic video-frames, into normal or abnormal.
4. Results
Extensive experiments were performed towards two directions. The first is the assessment of theaccuracy of the proposed system in the detection of gastrointestinal adenomas. The second is the directionof the determination of the most appropriate methods to be employed.
12 D.K. Iakovidis et al. / Computers in Biology and Medicine ( ) –
ARTICLE IN PRESS
The experiments have been analyzed by applying Receiver Operating Characteristic (ROC) analysis,as it evaluates the classification performance independent of the naturally occurring class distribution orerror cost [20,48]. An ROC graph represents on the x-axis the probability that the classification moduleregards the sample as abnormal when it is actually abnormal, and on the y-axis the probability thatthe sample is abnormal when it is actually normal. The former is also known as true positive rate (orsensitivity), whereas the latter is also known as false positive rate (or one minus specificity). The ROCcurve shows how these two quantities vary together as the decision threshold varies. The Area Under theROC Curve (AUC) is used as a reliable measure of the classification accuracy [20].
The experiments were performed on a database of 60 colonoscopic and 26 gastroscopic videos frompatients examined in the General Hospital of Athens “Laiko”, Medical School, University of Athens. Allpolyps found during the endoscopic examinations went through biopsy and were histologically evaluated.The results of the histological evaluation were used as the gold standard for the evaluation of the proposedsystem. As the experts suggested, mainly small size adenomas have been considered for the purposes ofour study. Such polyps are not easily detectable, they are more common and are more likely to becomemalignant compared to the hyperplastic polyps [1].
The endoscopic video files were acquired by the endoscopists and saved in AVI format with a resolutionof 320 × 240-pixel frame dimensions, 24 bit color depth at a frame rate of 25 fps. The duration of eachvideo was set at 10 s, which results in 250 frames.
For the purposes of our experiments, two training sets were formed from 40% of the frames comprisingthe available videos. The first set was built from 100 representative video-frames of each colonoscopicvideo, and the second, from 100 representative video-frames of each gastroscopic video. In total, thecorresponding training sets comprised 60 × 100 = 6000 colonoscopic and 26 × 100 = 2600 gastroscopicvideo-frames, respectively. These frames were carefully selected by experts in gastroenterology andcorrespond to adenomas or normal tissue captured from different angles and illumination conditions. Abalanced proportion of normal and abnormal samples was extracted from these frames in a way that allabnormal samples were included and an equal number of normal samples was randomly selected. In [48],it has been shown that learning from a balanced class distribution the classifiers generally come up withfewer but more accurate classification rules for the minority class than for the majority class. So, such anapproach is expected to enhance the classification of abnormal samples and thus increase the system’ssensitivity.
Apart from the training sets, two test sets were formed from the video-frames that were not includedin the training sets, i.e. 250 − 100 = 150 frames (60%) from each video. The first test set comprised150 × 60 = 9000 colonoscopic video-frames, and the second, 150 × 26 = 3900 gastroscopic video-frames. Each of these frames was raster scanned by the feature extraction module and all of the occurringsamples were used in the corresponding testing phase, regardless of the class they belong to. It should beexplicitly stressed that the training and test sets have been chosen so that they do not overlap, and thatfeature extraction was class-blind, so that the reliability of the presented results is ensured.
The sampling of each frame was performed by the feature extraction module using a sliding windowof 32 × 32-pixel dimensions and a sliding step of 16 pixels, resulting in a total of 7 × 7 = 49 samples perframe. A 4-level DWFT was considered for the extraction of the WE, CWE and WCS features [18,27],whereas a 1-level DWFT was applied for the extraction of the CWC features [17]. The LBP and OC–LBPhistograms were quantized at 64-bins. The dimensions of the feature spaces produced by each featureextraction method are presented in Table 1. These vectors were classified by employing both linear andnon-linear Gaussian kernel functions (Eqs. (10)–(11)) in the classification module.
ARTICLE IN PRESSD.K. Iakovidis et al. / Computers in Biology and Medicine ( ) – 13
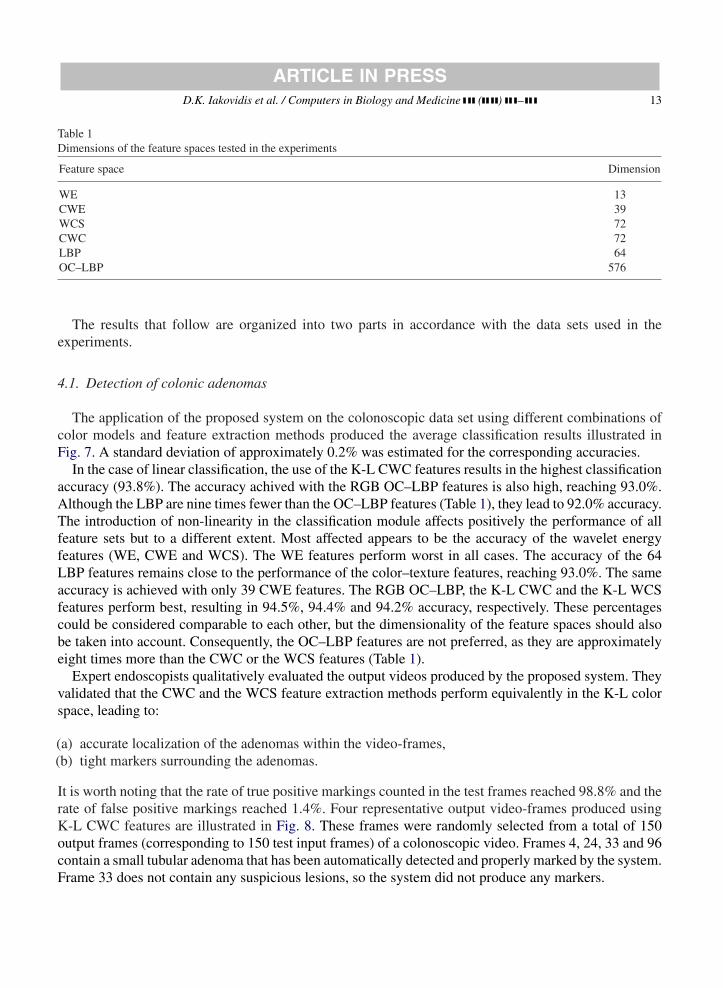
Table 1Dimensions of the feature spaces tested in the experiments
Feature space Dimension
WE 13CWE 39WCS 72CWC 72LBP 64OC–LBP 576
The results that follow are organized into two parts in accordance with the data sets used in theexperiments.
4.1. Detection of colonic adenomas
The application of the proposed system on the colonoscopic data set using different combinations ofcolor models and feature extraction methods produced the average classification results illustrated inFig. 7. A standard deviation of approximately 0.2% was estimated for the corresponding accuracies.
In the case of linear classification, the use of the K-L CWC features results in the highest classificationaccuracy (93.8%). The accuracy achived with the RGB OC–LBP features is also high, reaching 93.0%.Although the LBP are nine times fewer than the OC–LBP features (Table 1), they lead to 92.0% accuracy.The introduction of non-linearity in the classification module affects positively the performance of allfeature sets but to a different extent. Most affected appears to be the accuracy of the wavelet energyfeatures (WE, CWE and WCS). The WE features perform worst in all cases. The accuracy of the 64LBP features remains close to the performance of the color–texture features, reaching 93.0%. The sameaccuracy is achieved with only 39 CWE features. The RGB OC–LBP, the K-L CWC and the K-L WCSfeatures perform best, resulting in 94.5%, 94.4% and 94.2% accuracy, respectively. These percentagescould be considered comparable to each other, but the dimensionality of the feature spaces should alsobe taken into account. Consequently, the OC–LBP features are not preferred, as they are approximatelyeight times more than the CWC or the WCS features (Table 1).
Expert endoscopists qualitatively evaluated the output videos produced by the proposed system. Theyvalidated that the CWC and the WCS feature extraction methods perform equivalently in the K-L colorspace, leading to:
(a) accurate localization of the adenomas within the video-frames,(b) tight markers surrounding the adenomas.
It is worth noting that the rate of true positive markings counted in the test frames reached 98.8% and therate of false positive markings reached 1.4%. Four representative output video-frames produced usingK-L CWC features are illustrated in Fig. 8. These frames were randomly selected from a total of 150output frames (corresponding to 150 test input frames) of a colonoscopic video. Frames 4, 24, 33 and 96contain a small tubular adenoma that has been automatically detected and properly marked by the system.Frame 33 does not contain any suspicious lesions, so the system did not produce any markers.

14 D.K. Iakovidis et al. / Computers in Biology and Medicine ( ) –
ARTICLE IN PRESS
Fig. 7. AUCs obtained for the detection of colonic adenomas using (a) linear and (b) non-linear classification module.
Fig. 8. Output colonoscopic video-frames produced using K-L CWC features and non-linear classification.

ARTICLE IN PRESSD.K. Iakovidis et al. / Computers in Biology and Medicine ( ) – 15
Fig. 9. AUCs obtained for the detection of gastric adenomas using (a) linear and (b) non-linear classification module.
4.2. Detection of gastric adenomas
In the second part of the experiments the proposed system was applied for the detection of gastricadenomas, under the previously described framework. The results are illustrated in Fig. 9. A standarddeviation of approximately 0.3% was estimated for the corresponding accuracies.
Comparing Fig. 9 with Fig. 7 it can be noticed that the results are almost compatible. The K-L CWCfeatures perform best in the case of linear classification leading to 93.2% accuracy. The non-linear

16 D.K. Iakovidis et al. / Computers in Biology and Medicine ( ) –
ARTICLE IN PRESS
Fig. 10. Output gastroscopic video-frames produced using K-L CWC features and non-linear classification.
classification module enhances the classification of the gastroscopic data in most cases and increases theaccuracy achieved with the K-L CWC and the K-L WCS to comparable levels (94.3% vs 94.4%). TheWE features do not perform well (80.0%) even with non-linear classification module.
The conclusions of the qualitative evaluation performed by the expert endoscopists on the gastroscopicoutput videos are in agreement with the conclusions of the respective evaluation performed on the colono-scopic output videos. The rate of true positive markings counted in the test frames reached 97.8% and therate of false positive markings reached 1.7%. Fig. 10 illustrates a set of representative frames that wererandomly selected from a total of 150 output video-frames produced using K-L CWC features. A smooth,benign-appearing gastric polyp (close-up view), practically indistinguishable from hyperplastic polyps,was detected in frames 120, 152 and 186. This lesion surprisingly proved to be a tubular adenoma withhigh-grade dysplasia on biopsy. In frame 189 no lesion appears, so the system did not draw any markerson it.
5. Conclusions
We presented a novel intelligent system capable of supporting the medical decision for detection ofadenomas in gastrointestinal video. It aims to the enhancement of the endoscopist’s ability to accuratelylocate early stage adenomas, which may go undetected and evolve into malignant tumors. The systemexploits color and textural characteristics of the gastrointestinal epithelium that comprise the clinicalfindings, which are consequently quantified and used for the development of abstract, mathematicallydescribed, decision rules within an SVM classification module.
The results of the extensive experimentation using different color models, feature extraction methods,linear and non-linear classification schemes lead us to the following clear conclusions:
• Textural characteristics of the colonic mucosa can be quantified by measuring texture under the contextof image analysis and for the first time color–texture analysis methodologies are successfully appliedfor automatic detection of gastric adenomas.
• In most of the feature spaces investigated, the use of the non-linear SVM kernel positively affects thediscrimination of normal from abnormal samples. Depending on the feature extraction method used,the non-linearity of the kernel function affects classification to a different extent. It could be argued thatin the cases of OC–LBP and K-L CWC features the classes are almost linearly separable and that thenon-linear kernel SVM could be replaced by a simpler linear classifier at the cost of a slight decreasein accuracy. However, this could be reasonable under the framework of a non-medical application. Inmedical applications, accuracy is crucial as it is associated with diagnosis and it concerns patients’health that can not be jeopardized at the cost of some more computations.

ARTICLE IN PRESSD.K. Iakovidis et al. / Computers in Biology and Medicine ( ) – 17
• The optimal configuration of the proposed system includes RGB to K-L color transform in the pre-processing module, the CWC or WCS feature extraction module and a non-linear classification module.In this paper the non-linearity in the classification module was introduced with the Gaussian func-tion in the SVM kernel. However, other non-linear kernels, such as the polynomial, could have alsoworked. The determination or the development of new kernel functions that would optimally solvethe gastrointestinal lesion detection problem is a challenging topic for future research.
• The utilization of standard low-resolution input, as it has been considered to meet the practical needsof the endoscopists, provides to the system an advantageous time performance over earlier approachesutilizing frames of higher resolution [17]. The increase in time performance achieved for the lowerresolution frames is attributed to the reduction of the computational cost which follows the applicationof the feature extraction methods on a fewer population of windows per frame and/or the smallerwindow dimensions used. However, the population of windows per frame and the window size areinterdependent system parameters and their choice can affect the detection of the gastrointestinallesions. Considering the window sampling scheme used in the experiments, a division of the framedimensions by N will result in an N2-times reduction of the computational cost. For example, di-viding the 1024 × 1024-pixel frame dimensions [17] by N = 8 (Fig. 2), a 64-times reduction of thecomputational cost is achieved.
• The accuracy of the system exceeds 94% as estimated with ROC analysis in the detection and locationof the gastrointestinal adenomas from endoscopic videos.
Future perspectives of this work include further enhancement of the system’s accuracy by includingother input modalities such as shape information, clinical data, etc. Moreover, the implementation of asoftware–hardware architecture which will be capable of supporting video endoscopy in real-time seemsto be feasible as solutions have been proposed in the literature for the implementation of the featureextraction and the classification modules in hardware [49,50].
6. Summary
Today 95% of all gastrointestinal carcinomas are believed to arise from adenomas. The early detectionof adenomas could prevent their evolution to cancer. In this paper we propose a novel intelligent system forautomatic detection of gastric and colonic adenomas in endoscopic videos. It utilizes color–texture imagefeatures and incorporates non-linear support vector machines (SVMs) to achieve improved detectionaccuracy compared to the linear classification scheme. The system focuses on the selection of a featureextraction method appropriate for the analysis of low- rather than high-resolution video-frames. Theadvantages emanating from the adoption of such a method include processing time reduction, applicabilityin telemedicine and less demanding hardware requirements. The assessment of the system’s performanceis realized by means of Receiver Operating Characteristics (ROC), which provide more reliable estimatesof accuracy compared to other measures. The results of the extensive experimentation on 60 colonoscopicand 26 gastroscopic videos, using different color models, feature extraction methods, linear and non-linearclassification schemes, led us to the conclusion that the proposed system can accurately detect, locate andmark the colonic and gastric adenomas within the endoscopic videos provided to its input. Its accuracyexceeds 94% as estimated with ROC analysis.

18 D.K. Iakovidis et al. / Computers in Biology and Medicine ( ) –
ARTICLE IN PRESS
Acknowledgements
This research was funded by the Operational Program for Education and Vocational Training (EPEAEKII) under the framework of the project “Pythagoras—Support of University Research Groups” co-funded75% by the European Social Fund and 25% by national funds. We would like to acknowledge Prof.M. Tzivras M.D., Section of Gastroenterology, General Hospital of Athens “Laiko”, Medical School,University of Athens and his research group for the provision of the endoscopic videos used in our studyand their contribution to the evaluation of the results.
References
[1] S.H. Itzkowitz, Y.S. Kim, Sleisinger & Fordtran’s Gastrointestinal and Liver Disease, sixth ed., vol. 2, WB SaundersCompany, Philadelphia, 1998.
[2] C.D. Johnson, A.H. Dachman, CT colonography: the next colon screening examination, Radiology 216 (2000) 331–341.[3] D. Rex, R. Weddle, D. Pound, K. O’Connor, R. Hawes, R. Dittus, J. Lappas, L. Lumeng, Flexible sigmoidoscopy plus
air contrast barium enema versus colonoscopy for suspected lower gastrointestinal bleeding, Gastroenterology 98 (1990)855–861.
[4] H. Kodama, F. Yano, S.P. Ninomija, Y. Sakai, S. Ninomija, A digital imaging processing method for gastric endoscopepicture, in: Proceedings of the 21st Annual Hawaian International Conference on System Sciences, vol. 4, 1988, pp.277–282.
[5] S.M. Krishnan, C.S. Tan, K.L. Chan, Closed-boundary extraction of large intestinal lumen, in: Proceedings of the 16thAnnual International Conference of the IEEE Engineering in Medicine and Biology Society, vol. 1, 1994, pp. 610–611.
[6] S.M. Krishnan, X. Yang, K.L. Chan, S. Kumar, P.M.Y. Goh, Intestinal abnormality detection from endoscopic images, in:Proceedings of the International Conference of the IEEE on Engineering in Medicine and Biology Society, vol. 2, 1998,pp. 895–898.
[7] A.N. Esgiar, R.N.G. Naguib, B.S. Sharif, M.K. Bennett, A. Murray, Microscopic image analysis for quantitativemeasurement and feature identification of normal and cancerous colonic mucosa, IEEE Trans. Inform. Technol. Biomed.2 (1998) 197–203.
[8] S. Kudo, S. Tamura, T. Nakajima, H. Yamano, H. Kusaka, H. Watanabe, Diagnosis of colorectal tumorous lesions bymagnifying endoscopy, Gastrointest. Endos. 44 (1996) 8–14.
[9] S. Karkanis, K. Galousi, D. Maroulis, Classification of endoscopic images based on texture spectrum, in: Proceedings ofthe Workshop on Machine Learning in Medical Applications, Advance Course in Artificial Intelligence, 1999, pp. 63–69.
[10] S. Karkanis, G.D. Magoulas, M. Grigoriadou, M. Schurr, Detecting abnormalities in colonoscopic images by texturaldescription and neural networks, in: Proceedings of the Workshop on Machine Learning in Medical Applications, AdvanceCourse in Artificial Intelligence, Chania, Greece, 1999, pp. 59–62.
[11] G.D. Magoulas, V.P. Plagianakos, M.N. Vrahatis, Neural network-based colonoscopic diagnosis using on-line learningand differential evolution, Appl. Soft Comput. 4 (2004) 369–379.
[12] P. Wang, S.M. Krishnan, C. Kugean, M.P. Tjoa, Classification of endoscopic images based on texture and neural network,in: Proceedings of the 23rd IEEE Engineering in Medicine and Biology, vol. 4, 2001, pp. 3691–3695.
[13] S.A. Karkanis, G.D. Magoulas, D.K. Iakovidis, D.A. Karras, D.E. Maroulis, Evaluation of textural feature extractionschemes for neural network-based interpretation of regions in medical images, in: Proceedings of the IEEE InternationalConference on Image Processing, Thessaloniki, Greece, 2001, pp. 281–284.
[14] S.A. Karkanis, D.K. Iakovidis, D.A. Karras, D.E. Maroulis, Detection of lesions in endoscopic video using texturaldescriptors on wavelet domain supported by artificial neural network architectures, in: Proceedings of the IEEE InternationalConference on Image Processing, Thessaloniki, Greece, 2001, pp. 833–836.
[15] D.E. Maroulis, D.K. Iakovidis, S.A. Karkanis, D.A. Karras, CoLD: A versatile system for detection of colorectal lesionsin endoscopy video-frames, Comput. Methods Programs Biomed. 70 (2003) 151–166.
[16] M.P. Tjoa, S.M. Krishnan, Feature extraction for the analysis of colon status from the endoscopic images, BioMedicalEngineering OnLine, 2003, pp. 2–9.

ARTICLE IN PRESSD.K. Iakovidis et al. / Computers in Biology and Medicine ( ) – 19
[17] S.A. Karkanis, D.K. Iakovidis, D.E. Maroulis, D.A. Karras, M. Tzivras, Computer aided tumor detection in endoscopicvideo using color wavelet features, IEEE Trans. Inform. Technol. Biomed. 7 (2003) 141–152.
[18] G. Van de Wouwer, P. Scheunders, S. Livens, D. Van Dyck, Wavelet correlation signatures for color texture characterization,Pattern Recognition 32 (1999) 443–451.
[19] M.M. Zheng, S.M. Krishnan, M.P. Tjoa, A fusion-based clinical decision support for disease diagnosis from endoscopicimages, Comput. Biol. Med. 35 (2005) 259–274.
[20] J.A. Swets, R.M. Dawes, J. Monahan, Psychological science can improve diagnostic decisions, Psychol. Sci. Public Interest1 (2000) 1–26.
[21] Y. Miyake, N. Tsumura, M. Takeya, R. Inagawa, Digital color images in biomedicine, in: H. Tanaka, Y. Miyake, M.Nishibori, D. Mukhopadhyay (Eds.), Japan, 2001.
[22] T. Shiobara, H. Haneishi, Y. Miyake, Improved color reproduction of electronic endoscopes, J. Imaging Sci. Technol. 40(1996) 494–501.
[23] G. Wyszecki, W.S. Styles, Color Science: Concepts and Methods Quantitative Data and Formulae, Wiley, New York, 1982.[24] Y. Ohta, T. Kanade, T. Sakai, Color information for region segmentation, in: Proceedings on Computer Graphics and Image
Processing, vol. 13, 1980, pp. 222–241.[25] G. Paschos, Perceptually uniform color spaces for color texture analysis: an empirical evaluation, IEEE Trans. Image
Process. 10 (6) (2001) 932–937.[26] S. Theodoridis, K. Koutroumbas, Pattern Recognition, Academic Press, San Diego, 1999.[27] M. Unser, Texture classification and segmentation using wavelet frames, IEEE Trans. Image Process. 4 (1995) 1549–1560.[28] T. Randen, J.H. HusZy, Filtering for texture classification: a comparative study, IEEE Trans. Pattern Anal. Mach. Intell.
21 (1999) 291–310.[29] A. Drimbarean, P.F. Whelan, Experiments in colour texture analysis, Pattern Recognition Lett. 22 (2001) 1161–1167.[30] T. Mäenpää, M. Pietikäinen, J. Viertola, Separating color and pattern information for color texture discrimination,
Proceedings of the 16th International Conference on Pattern Recognition, Quebec City, Canada, 2002, pp. 668–671.[31] D.K. Iakovidis, D.E. Maroulis, S.A. Karkanis, I.N. Flaounas, Color texture recognition in video sequences using wavelet
covariance features and support vector machines, in: Proceedings of the 29th EUROMICRO Conference, Antalya, Turkey,2003, pp. 199–204.
[32] D.K. Iakovidis, S.A. Karkanis, D.E. Maroulis, Color wavelet features for texture recognition under varying illuminationusing support vector machines, in: Proceedings of the IEEE International Conference on Image Processing, Singapore,2004, pp. 1505–1508.
[33] S.G. Mallat, A theory for multiresolution signal decomposition: the wavelet representation, IEEE Trans. Pattern Anal.Mach. Intell. 11 (1989) 674–693.
[34] W.Y. Ma, B.S. Manjunath, A comparison of wavelet transform features for texture image annotation, Int. Conf. ImageProcess, 1995, pp. 256–259.
[35] A. Mojscilovic, M.V. Popovic, D.M. Rackov, On the selection of an optimal wavelet basis for texture characterization,IEEE Trans. Image Processing 9 (2000) 2043–2050.
[36] R.M. Haralick, K. Shanmugam, I. Dinstein, Textural features for image classification, IEEE Trans. Syst. Man Cybern. 3(1973) 610–621.
[37] T. Ojala, M. Pietikäinen, D. Harwood, A comparative study of texture measures with classification based on featuredistributions, Pattern Recognition 29 (1996) 51–99.
[38] D.C. He, L. Wang, Texture unit, texture spectrum, and texture analysis, IEEE Trans. Geosci. Remote Sensing 28 (1990)509–512.
[39] M. Pietikäinen, T. Ojala, Nonparametric texture analysis with complementary spatial operator, in: M. Pietikäinen (Ed.),Texture Analysis in Machine Vision, Series in Machine Perception and Artificial Intelligence, vol. 40, World Scientific,Singapore, 2000, pp. 3–18.
[40] D. West, V. West, Model selection for a medical diagnostic decision support system: a breast cancer detection case, Artif.Intell. Med. 20 (2000) 183–204.
[41] K. Papik, B. Molnal, R. Schaefer, Z. Dombovari, Z. Tulassay, J. Feher, Application of neural networks in medicine—areview, Diagnostics Med. Technol. 4 (3) (1998) 538–546.
[42] V. Vapnik, Statistical Learning Theory, Wiley, New York, 1998.[43] C. Burges, A Tutorial on Support Vector Machines for Pattern Recognition, Kluwer Academic Publishers, Boston, 1998.

20 D.K. Iakovidis et al. / Computers in Biology and Medicine ( ) –
ARTICLE IN PRESS
[44] J. Huang, X. Shao, H. Wechsler, Face pose discrimination using support vector machines (SVM), in: Proceedings of theICPR International Conference on Pattern Recognition, vol. 1, 1998, pp. 154–156.
[45] I. El-Naqa, Y. Yongyi, M.N. Wernick, N.P. Galatsanos, R.M. Nishikawa, A support vector machine approach for detectionof microcalcifications, IEEE Trans. Med. Imaging 21 (12) (2002) 1552–1563.
[46] S. Li, J.T. Kwok, H. Zhu, Y. Wand, Texture classification using the support vector machines, Pattern Recognition 36 (2003)2883–2893.
[47] S.B. Gokturk, C. Tomasi, B. Acar, C.F. Beaulieu, D.S. Paik, R.B. Jeffrey Jr., J. Yee, S. Napel, A statistical 3-D patternprocessing method for computer-aided detection of polyps in CT colonography, IEEE Trans. Med. Imaging 20 (12) (2001)1251–1260.
[48] G.M. Weiss, F. Provost, The effect of class distribution on classifier learning, Technical Report ML-TR-43, Departmentof Computer Science, Rudgers University, January 2001.
[49] D. Bariamis, D.K. Iakovidis, D.E. Maroulis, S.K. Karkanis, An FPGA-based Architecture for Real Time Image FeatureExtraction, in: Proceedings of the ICPR International Conference on Pattern Recognition, Cambridge, UK, 2004,pp. 801–804.
[50] D. Anguita, A. Boni, S. Ridella, A digital architecture for support vector machines: theory, algorithm, and FPGAimplementation, IEEE Trans. Neural Networks 14 (5) (2003) 993–1009.
Dimitris K. Iakovidis received his B.Sc. degree in Physics from the University of Athens, Greece. In April 2001, he receivedhis M.Sc. degree in Cybernetics and in February 2004 his Ph.D. degree in the area of Medical Informatics from the Departmentof Informatics and Telecommunications, University of Athens, Greece. Currently he is working as a Research Fellow in thesame department and he has co-authored more than 30 papers on biomedical applications and image analysis. Also, he is regularreviewer for many international journals. His research interests include biomedical systems, image analysis, pattern recognitionand bioinformatics.
Dimitris E. Maroulis received the B.Sc. degree in Physics, the M.Sc. degree in Radioelectricity, the M.Sc. in ElectronicAutomation and the Ph.D. degree in Informatics, all from the University of Athens, Greece, in 1973, 1977, 1980 and 1990,respectively. In 1979, he was appointed Assistant in the Department of Physics, in 1991 he was elected Lecturer and in 1994 hewas elected Assistant Professor, in the Department of Informatics of the same university. He is currently working in the abovedepartment in teaching and research activities, including Projects with European Community. His main areas of activity includedata acquisition systems, real-time systems, signal processing and biomedical systems.
Stavros A. Karkanis obtained his B.Sc. in Mathematics from the University of Athens, Greece, in April 1986 and his Ph.D.degree in December 1995 from the Department of Informatics and Telecommunications of the same University. For the last 17years he has been working in the field of image processing, especially in the area of texture recognition from various academicand industry positions. Today he is Associate Professor in the Department of Informatics at the Technological EducationalInstitute of Lamia. His main interests include texture recognition, wavelet transform for texture, pattern recognition for imageprocessing applications and statistical learning methodologies for classification.