Embed Size (px)
Citation preview

IWAL
An Interactive Weather Analysis Laboratory
Michael Sprenger, Sebastian Limbach, Elmar Schömer, Heini Wernli
Institute for Atmospheric and Climate Science, ETH, Zurich, Switzerland
Institute for Computer Science, Johannes-Gutenberg University, Mainz, Germany

Working with weather data!
Print out weather maps and let the students arrange them according to time
Use weather data resources on the internet
Prepare simple Matlab/Python scripts to produce weather charts
Let the students learn how to use a professional tool, e.g. Ninjo at MeteoSwiss
Create an intuitive and simple tool that allows to work with ‘real’ meteo data

Data Sources
- ERA-Interim 1979-2014 in 6-h steps (about 7 TB)
- Selected case studies (e.g., storms Xynthia, Lothar, Sandy, Kyrill, …) with
extended lists of meteorological fields; additional events can be included..
- ECMWF operational analysis and deterministic forecast
- global IR and WV satellite imagery

WebGUI – Interface to IWAL Viewport 1: horizontal cross section
Viewport 2: vertical cross section
list of all image
layers
details of
a image
layer
decid
e w
hat
to d
o!
new
im
ag
e layer?
save s
tate
? s
ave i
mag
e?

Features I
Dynamic zoom
- similar to Google Earth
- Resolution of the image is auto-
matically adapted to plotting domain
Arbitrary number of image layers
- additional fields (e.g. relative humidity)
can be overlaid with a free degree of
transparency)
- Easy switching on/off of layers

Features II Arbitrary vertical cross sections
- end points easily set in horizontal viewport;
cross section redrawn if end points moved
- position in vertical cross section shown
in horizontal cross section
- several layers allowed (degree of transparency
adjustable)
x
x PV [PVU] and θ [K]

Features III
X
- Pseudosounding at mouse-selected position (T, dew-point T, wind profile)
- Sounding is automatically adjusted if position is changing
P and T @ LCL
CAPE
Showalter index

Features IV
- Forward and backward trajectories from
arbitrary starting positions
- Additional fields traced along trajectories and
shown in table (e.g., temperature T)
starting positions

Student Case Study – Task for the students
Student Case Study – Anna Gevecke

Student Case Study – Sylvia Gassner & Lars van Galen
Characteristics
- storm Jeannette
- 27-28 October 2002 in Northwestern Europe
- strongest storm in regard to area and intensity
- two deepening phases
- sting jet formed during passage over Britain
storm passes over
northern Europe

Genesis
Student Case Study
Students found
- storm Jeannette formed south of Newfoundland
- no closed isobars, but baroclinic zone with a little 'kink' in it (indicates unstable zone)
SLP and theta-e @ 850 hPa

1st deepening phase
SLP and wind speed @ 200 hPa
Student Case Study
Students found
- storm has developed first closed isobars
- first deepening phase takes place near left-exit of an upper-level jet streak

2nd deepening phase
SLP and wind speed @ 200 hPa
Student Case Study
Students found
- storm has reached 980 hPa in ERA-Interim data set
- at 200 hPa a remarkable straight jet streak is discernible
- second deepening takes place in exit of this jet streak

Maturity and sting jet
27-06 06Z
SLP and theta-e @ 850 hPa
Student Case Study
Students found
- storm shows distinct frontal structures
(warm and cold fronts)
- they relate it to the conceptual Shapiro-Keyser model
- they recognize that ERA-Interim cannot capture sting jet

How we used IWAL so far / experience!
Since it was developed in 2014, it was used in the Bachelor lecture ‚Wettersysteme‘
First tasks: Characterize the weather at your birthday!
Then: Choose an interesting weather event, and tell a story about it with IWAL
Now: We specifiy three cases, and students can choose one of these cases.
IWAL is not perfect – we now about bugs and deficiencies!
It is not very easy to implement further features...
The deficiencies are not severe; IWAL is useful even with them...
We do *not* use it in Bachelor and Master theses
Needed flexibility and functionality is not sufficient in IWAL
Bachelor and Master students use script languages (Python/Matlab/NCL,...)
Students are ‚nearer‘ to the data, and get full control by ‚programming‘ their figures...
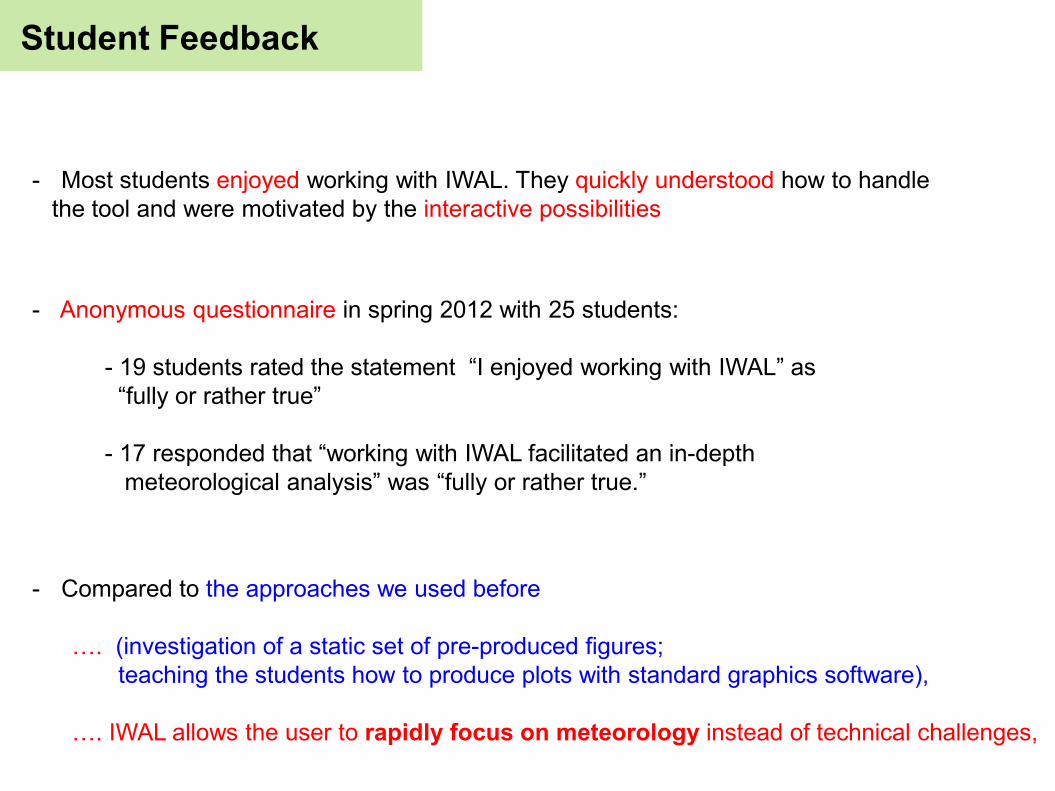
Student Feedback
- Most students enjoyed working with IWAL. They quickly understood how to handle
the tool and were motivated by the interactive possibilities
- Anonymous questionnaire in spring 2012 with 25 students:
- 19 students rated the statement “I enjoyed working with IWAL” as
“fully or rather true”
- 17 responded that “working with IWAL facilitated an in-depth
meteorological analysis” was “fully or rather true.”
- Compared to the approaches we used before
…. (investigation of a static set of pre-produced figures;
teaching the students how to produce plots with standard graphics software),
…. IWAL allows the user to rapidly focus on meteorology instead of technical challenges,

Student Feedback – Felix Piringer
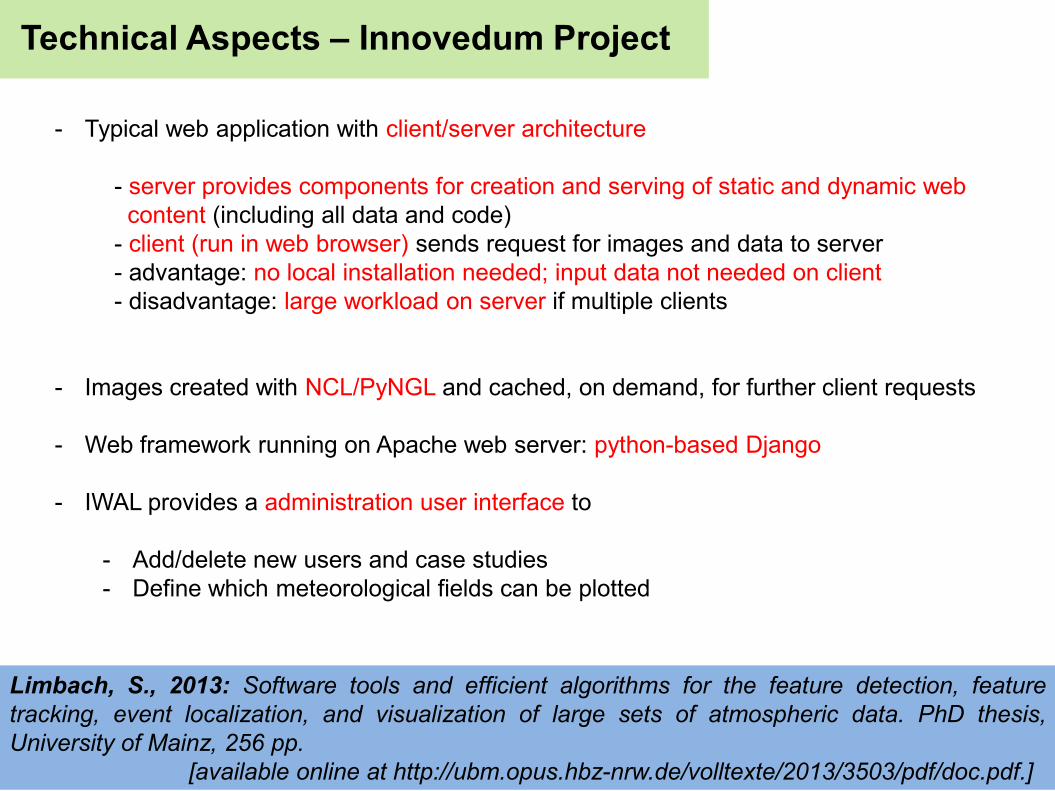
Technical Aspects – Innovedum Project
Limbach, S., 2013: Software tools and efficient algorithms for the feature detection, feature
tracking, event localization, and visualization of large sets of atmospheric data. PhD thesis,
University of Mainz, 256 pp.
[available online at http://ubm.opus.hbz-nrw.de/volltexte/2013/3503/pdf/doc.pdf.]
- Typical web application with client/server architecture
- server provides components for creation and serving of static and dynamic web
content (including all data and code)
- client (run in web browser) sends request for images and data to server
- advantage: no local installation needed; input data not needed on client
- disadvantage: large workload on server if multiple clients
- Images created with NCL/PyNGL and cached, on demand, for further client requests
- Web framework running on Apache web server: python-based Django
- IWAL provides a administration user interface to
- Add/delete new users and case studies
- Define which meteorological fields can be plotted

Access to IWAL
- IWAL is installed at ETH Zurich, and external users can access a demo version
online at
www.iwal.ethz.ch
Challenges when installing IWAL on other place:
i) install freely-available third party software (e.g., NCL, trajectory calculation);
ii) setup a powerful web server;
iii) link (large) database (satellite imagery, reanalysis data,..) to web server
||Data Literacy
Refresh Teching
Felix Piringer
MSc student Geomatics D-BAUG
12/02/2019 1
Data Literacy at the Example of IWAL: A Student’s View
Felix Piringer

||Data Literacy
Refresh Teching12/02/2019Felix Piringer 2
Geomatics, Geodesy, Geoinformatics, Geospatial Engineering,…

||Data Literacy
Refresh Teching
Practical application of theoretical knowledge
“Search for the weather” in the 3D-atmosphere
Getting “a feel” for the specific data
Reminder of how… …important visualization is when dealing with big amounts of data
…visualization can trick you
12/02/2019Felix Piringer 3
IWAL: Personal Experience
Source: IWAL Source: https://de.wikipedia.org/wiki/Plattkarte#/media/Datei:Plate_Carr%C3%A9e_with_Tissot's_Indicatrices_of_Distortion.svg

||Data Literacy
Refresh Teching
Downsides: Usually less capable => no problem up to a certain point
Lack of practical knowledge and skills (for work after ETH)
Sometimes neglected…
12/02/2019Felix Piringer 4
Rudimentary Teaching/Science Tools vs Commercial Software

||Data Literacy
Refresh Teching
Advantages: Close to theoretical knowledge of students
Little familiarization required
Focus on the actual data
Link to other disciplines
Possibly even better: raw data or own data acquisition (when feasible)
Crucial (my opinion): Fundamentals of statistics AND programming
12/02/2019Felix Piringer 5
Rudimentary Teaching/Science Tools vs Commercial Software

||Data Literacy
Refresh Teching
Data Acquisition: Measurement principle of particular system
Measurement setup
Modelling and corrections of systematic errors
Ability to quantify uncertainties and reliability
Data Representation: Complex data structure, large amounts of data
Geometry (reference frames, ellipsoidal geometry, etc.)
Semantics
Visualization Projections
>> 2 dimensions
Cartographical methods (generalization, colors, lines, symbology, layout,…)
12/02/2019Felix Piringer 6
Use of Geospatial Data (outside Geodesy)

||Data Literacy
Refresh Teching
Acquiring and handling geodata and is a science in itself
Many things to do wrong
Communication and fundamental knowledge Top down (required accuracy, unwanted corrections, systematic errors)
Bottom up (interpretation methods, desired results)
12/02/2019Felix Piringer 7
Use of Geospatial Data (outside Geodesy)