Embed Size (px)
Citation preview

An interlaboratory investigation of intrinsic dissolution rate determination using surface dissolution. Kelly Ethersona, Claire Dunnb, Wayne Matthewsc, Henrik Pamelundc,f, Camille Barragatf, Natalie Sandersond, Toshiko Izumie, Claudia da Costa Mathewse, Gavin Halbertb, Clive Wilsonb, Mark McAllistere, James Mannd, Jesper Østergaardf, James Butlera, Ibrahim Khadrab
a Product Development & Supply, GlaxoSmithKline R&D, Ware, U.K.b Strathclyde Institute of Pharmacy and Biomedical Sciences, University of Strathclyde, Glasgow, U.K.c Product Development & Supply, GlaxoSmithKline R&D, Stevenage, U.K.d Pharmaceutical Technology & Development, AstraZeneca, Macclesfield, U.K.e Drug Product Design, Pharmaceutical Sciences, Pfizer Ltd., Sandwich, U.K.f Department of Pharmacy, University of Copenhagen, Copenhagen, Denmark.
Abstract
The purpose of this study was to conduct an interlaboratory ring-study, with six partners (academic and industrial), investigating the measurement of intrinsic dissolution rate (IDR) using surface dissolution imaging (SDI) equipment. Measurement of IDR is important in pharmaceutical research as it provides characterising information on drugs and their formulations. This work allowed us to assess the SDI’s interlaboratory performance for measuring IDR using a defined standard operating procedure (see supporting information) and six drugs assigned as low (tadalafil, bromocriptine mesylate), medium (carvedilol, indomethacin) and high (ibuprofen, valsartan) solubility compounds. Fasted State Simulated Intestinal Fluid (FaSSIF) and blank FaSSIF (without sodium taurocholate and lecithin) (pH 6.5) were used as media. Using the standardised protocol an IDR value was obtained for all compounds and the results show that the overall IDR rank order matched the solubility rank order. Interlaboratory variability was also examined and it was observed that the variability for lower solubility compounds was higher, coefficient of variation >50%, than for intermediate and high solubility compounds, with the exception of indomethacin in FaSSIF medium. Inter laboratory variability is a useful descriptor for understanding the robustness of the protocol and the system variability. On comparison to another published small-scale IDR study the rank ordering with respect to dissolution rate is identical except for the high solubility compounds. This results indicates that the SDI robustly measures IDR however, no recommendation on the use of one small scale method over the other is made.
KeywordsIntrinsic dissolution rate (IDR), Orbito, dissolution, Fasted State Simulated Intestinal Fluid (FaSSIF), Surface Dissolution imaging (SDI), Gastro Intestinal Tract (GIT)
1 Introduction
The most convenient and frequent way of administering drugs is via the oral route (1). Generally, dosage forms consist of an active pharmaceutical ingredient (API) and excipients, which help to ensure the drug reaches its site of action, prevent unwanted decomposition and in some cases controlling release. To exert an effect the drug must: dissolve in the aqueous environment of the gastrointestinal tract; remain in solution to be available for absorption;
brought to you by COREView metadata, citation and similar papers at core.ac.uk
provided by University of Strathclyde Institutional Repository

and be sufficiently lipophilic to be absorbed. The key drug attributes, solubility and permeability, are succinctly classified in the widely used Biopharmaceutics Classification System (BCS) (2).
1.1 Solubility and Dissolution
Drug solubility and dissolution are interrelated parameters important for bioavailability and can be affected by internal as well as external factors. Internal factors include the drug’s chemical structure, particle size and crystal form as well as any ionisable groups in the molecule. The external factors include the gastrointestinal (GI) tract environment and behaviour. The GI tract environment for example contains bile salts, phospholipids, fatty acids and proteins in different concentrations throughout the digestive tract and these have an impact on drug behaviour. Solubilisers such as bile salts and lecithin for example can increase solubility of lipophilic drugs (3, 4). In addition the GI tract luminal content viscosity, mixing, and flow pattern also vary (5) and pH varies between the stomach (pH 1.5-4) and intestine (pH 5-7) (6). Depending upon the drug’s pKa ionisation and solubility will therefore vary and the use of salt forms may result in completely different drug solubilities and dissolution rates in GI tract fluids than in pure water (3, 7, 8). Biorelevant media such as FaSSIF (Fasted Stated Simulated Intestinal Fluid) are commonly used to more accurately mimic in vivo conditions, resulting in better predictions overall (9). These media have frequently been used to mimic human intestinal fluids for greater biorelevance in solubility and dissolution experiments (3, 10, 11).
1.2 Intrinsic Dissolution Rate (IDR)
Dissolution is an important in vitro test, as it provides crucial information on the release of the API from a formulated product which can then be used to guide formulation development, and ultimately, provide assurance of reliable drug release in humans. The intrinsic dissolution rate (IDR) is defined as the amount of drug dissolved per unit time per unit area and is therefore expressed as a rate, in contrast to the thermodynamic equilibrium reported by solubility data. IDR determination can be used in the selection of optimal forms and versions (e.g. salts), and can improve prediction of drug behaviour in the dynamic situation found in the GI tract (12). In addition, studies carried out using disc IDR were reported to be a simple, convenient and feasible way to determine BCS solubility class (13). Yu et al. showed that IDR values determined using Wood’s apparatus can be used to classify compounds as either high or low solubility under different pH conditions. The classification matched the BCS system for solubility based on an IDR cut-off of 0.1 mg/min/cm2 (13).
Apparatus for IDR is described by pharmacopoeias and includes the rotating disk system (or Wood’s apparatus). This is a modified USP I/II set up whereby a disc of API with a known surface area is rotated in a dissolution vessel and the concentration at set time points measured. IDR is expressed by the Nernst-Brunner adaptation of the Noyes Whitney equation as (14)
Equation 1𝑑𝐶𝑑𝑡 =
𝐷𝐴𝑉ℎ(𝐶𝑠 ― 𝐶𝑏)
Where C is the concentration of API dissolved (mg/mL), t is the sampling time (min), D is the diffusion coefficient (cm2/min), A is the surface area (cm2), V is the volume of the medium (mL), h is the boundary layer thickness at interface between drug solid and solution

(cm), Cs and Cb are the concentrations at saturation (present in the boundary layer) and in the bulk solution respectively (mg/mL).
Diffusion coefficient of an API is affected by properties of the dissolution media, and in biorelevant media, the diffusion coefficient is a function of both the diffusion of the unbound API and the diffusion of the API within micelles (15, 16).
Deff = Dmonofmono + Daggfagg Equation 2
Where Deff is the effective diffusion coefficient, Dmono and Dagg is the diffusion coefficient of the unbound (monomer) and micelle bound (aggregate) API respectively (cm2/min), and f is the fraction of the monomer and aggregated API.
The work here will focus on the IDR of compounds in two media (FaSSIF and blank FaSSIF). IDR is related to dissolution rate equation and is a function of area whereby:
Equation 3𝐼𝐷𝑅 =𝑑𝑐𝑑𝑡 ∗
𝑉𝐴 =
𝐷ℎ(𝐶𝑠 ― 𝐶𝑏)
1.3 Small Scale Intrinsic Dissolution Apparatus
The use of Wood’s apparatus to determine IDR is rarely feasible during early development due to the amount of API required. Miniaturised methods have therefore been developed which need only minimal drug, and utilise small volume vials (rotating and stationary disc systems), 96-well plates, flow through cells, and optical microscopy (17-22). An example of a system utilising small volume vials (up to 20 mL) is the Pion µDISS Profiler™, which can measure disc, powder and controlled suspensions (23-25). Standardised procedures for IDR determination using the μDISS Profiler™ were proposed based on an interlaboratory study (26) as part of the IMI OrBiTo collaboration (27, 28). The ability of the μDISS Profiler™ to use minimal amounts of API and the ease of use makes it an attractive option for IDR determination in early preformulation work. In this study, further interlaboratory comparisons were conducted to evaluate an alternative small-scale IDR method, which combines IDR measurement with UV imaging of the dissolution process.
The IDR measurement technique investigated in this study utilises the Sirius Surface Dissolution Imaging (SDI) system (29) whuich allows real-time monitoring of dissolution and release from the surface of a small compressed disc of drug. Dissolution studies performed over 5-30 min at specific flow rates allows determinations of IDRs, surface concentrations and the cumulative amount of drug dissolved using UV imaging. Moreover, videos can be generated for visual examination of the dissolution process (30-35). Examples of IDR studies using UV imaging include comparisons between different forms of drugs and their salts/hydrates, and between micronised and nonmicronised material. Form changes can also be studied with the use of simultaneous Raman spectroscopy. The system has also been used to determine diffusion coefficients and solubility (35-38).
The SDI works by filtering light through a bandpass filter, followed by a diffuser to refocus on a specific UV wavelength. The light then passes through a lens to collimate it and is presented to the front of a quartz flow cell containing the sample. The detector readout is passed to the computer (37, 39, 40), where the software analyses 3 zones from the image (Figure1).

Figure 1. Image from the SDI analysis software while investigating valsartan dissolution in phosphate buffer. Picture from one partner taken from analysis software. Within the software, the x-axis is the horizontal axis and the y-axis is the vertical axis, background absorbance zone (medium only) is the reference zone to account for variations in media absorbance, the surface absorbance zone measures the concentration above the API compact surface, IDR absorbance zone measures the concentration at the outlet which is used for IDR calculations by the software.
A published convection dissolution model, developed by Nelson and Shah (41, 42), which has been applied to both static and flow through systems and accounts for changes in velocity and concentration gradients above the surface has been applied to the SDI. For circular compacts, the dissolution rate (R) is represented by:
Equation 4R = 2.157.𝐷2/3.𝑐0.α1/3.𝑟5/3
Where D is the diffusivity (cm2/min), c0 is the solubility (mg/mL), r is the compact radius (cm), and α is the shear rate in boundary layer
Equation 5𝛼 =6𝑄
𝐻2𝑊
Where Q is the volumetric flow rate (mL), H is the height of channel (cm), W is the width of channel (cm). Using the SDI data analysis software the IDR is calculated from (43):
Equation 6𝐼𝐷𝑅 =∑
𝐻2𝑧 = 0
(𝑣𝑧𝑀𝑐𝑧W𝛥𝑧)
𝑆
Equation 7𝑣z =3𝑄
2𝐻𝑊 ∗ (1 ― ((2𝑧 ― 𝐻)2
𝐻2 ))Where z is the height above z-origin (cm – variable, set by analyst), vz is the velocity at z, M is the molecular weight (Da), cz is the concentration at z (μg/mL), W is the width of flow cell channel (cm), Δz is the effective pixel height (cm), S is the surface area of sample (cm2), H is the height of flow cell channel in observation region (cm), Q = volumetric flow rate (mL/min).
The purpose of this work was to conduct an interlaboratory ring study using the Sirius SDI apparatus to measure IDR. To this end the variability of IDR values measured at different
Background absorbance
Surface absorbance
IDR absorbance
Approx. location of top of sample cup

sites was assessed. An investigation into molar extinction coefficient (MEC) values and variability was also conducted. A standardised procedure for compressing the API powders into compacts was utilised and each partner used a pre-defined protocol for each of the six APIs. The IDR work was carried out over six partner sites (two academic and four industrial) using the same batch for each of the compounds unless specified. This will provide information on the robustness of the SDI system for IDR measurement when sites use a standard method, providing a level of confidence in the data generated. A comparison between the μDISS Profiler™ system and SDI results and variability was carried out to provide information on the usefulness of the flow through imaged IDR data (26).
Andersson et al. described boundaries for high, intermediate and low solubility APIs whereby disc and/or powder IDR determination can be used (26). The six compounds chosen for this study were: two high solubility APIs (solubility > 1mg/mL – valsartan and ibuprofen), two intermediate solubility APIs (100µg/mL < solubility < 1mg/mL – carvedilol and indomethacin), and two low solubility APIs (solubility < 100µg/mL – tadalafil and bromocriptine mesylate) (Table 1). The drugs were also selected to provide continuity to the interlaboratory dissolution studies performed with the μDISS Profiler™ (26).
2 Material and Methods
2.1 Materials
Valsartan, ibuprofen, carvedilol, tadalafil, indomethacin and bromocriptine mesylate (Table 1) were kindly provided through the Orbito consortium with the exception of site number 6 who sourced ibuprofen separately due to stock availability issues. FaSSIF powder was purchased through Biorelevant.com. Sodium hydroxide (NaOH), monobasic sodium phosphate monohydrate (NaH2PO4·H2O) and sodium chloride (NaCl) were purchased from Sigma Aldrich.
Table 1. Physicochemical properties of the 6 APIs investigated.API Classification MW/FW pKa LogP LogD
at pH6.5
Sapp FaSSIF/ Sapp blank FaSSIF
Solubility (μg/mL)*
Ref†
Bromocriptine mesylate
Base 654.6/750.7 4.9 2.909 2.899 14.275 60.4 (Sapp FaSSIF) ‡3 (Sapp pH 6.5) ‡∆
(26, 44)
Carvedilol Base 406.5 7.9 2.784 1.384 2.738 136 (FaSSIF)51.6 (Blank FaSSIF)
(45, 46)
Ibuprofen Acid 206.3 4.4 2.904 0.804 1.146 1560 (FaSSIF)7935 (pH 6.5)
(47-49)
Indomethacin Acid 357.8 4.5 4.30 2.3 435.8 (FaSSIF)306.98 (Blank FaSSIF)
(50)
Tadalafil Base 389.4 0.85 (predicted)
2.61 2.61 0.997 2.5 (Sapp FaSSIF) ‡
(26, 51)

2 (pH not specified)
Valsartan Acid 435.54.7
3.942 2.142 951.609 (FaSSIF)594 – 628 (Blank FaSSIF)
(26, 52)
† Other sources for MW/FW and pKa were pubchem.ncbi.nlm.nih.gov and www.druginfosys.com, drugs@ FDA: FDA approved drug products.‡ Sapp is the apparent solubility based on maximum concentrations from μDISS dissolution experiments.∆ The solubility value for bromocriptine mesylate was recorded after more than 400 minutes post exposure to the medium and there was evidence that the salt had disproportionated to the parent.* All solubility measurements were performed at 37oC.
2.2 Methods
2.2.1 FaSSIF buffer and media preparation
FaSSIF and blank FaSSIF (both version1) were prepared using the instructions supplied through Biorelevant.com (53), based on the composition proposed by Galia et al. (54). Blank FaSSIF was prepared in the same way as FaSSIF with the exclusion of the FaSSIF powder.
2.2.2 Equipment
Sirius SDI equipment (Sirius Analytical, East Sussex,UK) was used for IDR assays. SDI data collection and analysis software (version 1.8.50814) was used to analyse the runs and values.
2.2.3 Solution preparation
Stock solutions of the APIs in FaSSIF and blank FaSSIF were prepared. For higher solubility drugs (ibuprofen, valsartan, indomethacin and carvedilol), a minimum five-point calibration curve (absorbance (mAU) versus concentration (mM)) was created. Due to the low solubility for some APIs, the mean molar extinction coefficient (MEC) of three solutions of similar concentration was calculated. Up to 10% V/V methanol was added to the solution as a co-solvent to increase solubility. Sonication was used where required to aid dissolution. In the experiments, where methanol was added, and/or the solutions sonicated, the medium used for blanking the system was treated in the same manner.
2.2.4 Compact preparation
Approximately 4mg of API was weighed into the micropress and for compressed at 80 cN.m for 5 min using a calibrated torque wrench. Compacts were prepared, where possible, just before measurement and the compact’s surface area, assuming a flat surface, is 0.00314 cm2.
2.2.5 Molar Extinction Coefficient
The Molar Extinction Coefficient (MEC) was determined at each site using the following methods at the same wavelength used for IDR work
The SDI pump and data collection software was programmed to run for 10 min at 0.5 mL/min. The system was blanked with buffer and when prompted a syringe containing the drug calibration solution (4mL) was loaded and pumped through the flow cell at 2 mL/min, followed by resetting the pump to 0.5 mL/min. Each calibration concentration was run individually.
Two sites (sites 2 and 4) used the following alternative method. The data collection software was setup to run continuously for 40 min. The pump was operated manually (in withdraw mode) to flow standard solutions through the dissolution cell at a flow rate of 1 mL/min for 4 min at each concentration. Blank medium was flushed through the dissolution cell for 4 min before and after the standard solutions to detect baseline drifts. The absorbance values were read and used for construction of the calibration curve.
2.2.6 MEC data analysis
Where a calibration curve of absorbance versus concentration was utilised, a regression line was drawn through the plot and assessed to ensure linearity was maintained at all concentrations and the MEC was calculated by dividing the slope of the line by the path-length. Where solutions of similar concentration were used, the mean MEC of the three solutions was calculated and used for IDR work. The five-point calibration was the preferred method but the alternative method was used if solubility was too low (tadalafil and bromocriptine). Each site determined and used their own MECs and comparisons between sites was carried out by calculating the mean MEC.
2.2.7 IDR
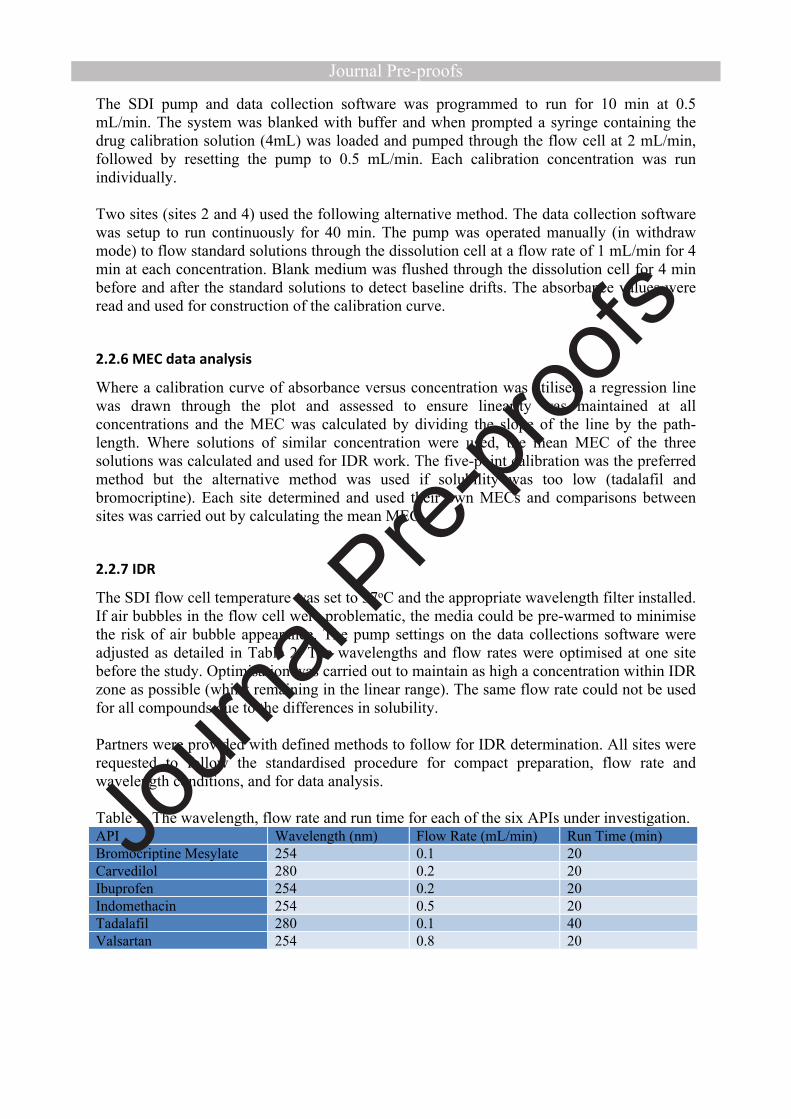
The SDI flow cell temperature was set to 37oC and the appropriate wavelength filter installed. If air bubbles in the flow cell were problematic, the media could be pre-warmed to minimise the risk of air bubble appearance. The pump settings on the data collections software were adjusted as detailed in Table 2. The wavelengths and flow rates were optimised at one site before the study. Optimisation was carried out to maintain as high a concentration within IDR zone as possible (whilst remaining in the linear range). The same flow rate could not be used for all compounds due to the differences in solubility.
Partners were provided with defined methods to follow for IDR determination. All sites were requested to follow the standardised procedure for compact preparation, flow rate and wavelength conditions, and for data analysis.
Table 2. The wavelength, flow rate and run time for each of the six APIs under investigation.API Wavelength (nm) Flow Rate (mL/min) Run Time (min)Bromocriptine Mesylate 254 0.1 20Carvedilol 280 0.2 20 Ibuprofen 254 0.2 20 Indomethacin 254 0.5 20 Tadalafil 280 0.1 40Valsartan 254 0.8 20

2.2.8 IDR determination
The system was previewed and blanked, then the sample was loaded into the cell insert when prompted by the instrument. The system was flushed with media three times at the elevated angle to remove air bubbles, during the third flush the cartridge was lowered to the horizontal position and data collection restarted. The above IDR steps were repeated until six acceptable results were obtained. Results were deemed unacceptable if one or more of the following exclusion criteria were met: negative IDR values, air bubbles in the system, and where the RSD values over 60 s intervals exceeded 10%. These features indicated a possible failure of the run and/or compact formation.
2.2.9 IDR data analysis
The MEC, molecular weight and compact weight were entered into the data analysis software. The z-origin was adjusted so that there was no increase in absorbance after the first point, this was visualised in concentration/absorption profile tab of the software. The mean and standard deviation of each compact were calculated from the data points collected 6 to 20 min after initiation of the dissolution experiment (21 to 40 min for tadalafil). Early work by one partner investigated when the IDRs measurements should be taken, at these points it is expected that the curves would be linear, and due to continuous flow sink conditions are assumed. Once six replicates were accepted, the mean and standard deviation were calculated using the mean IDR from each run. If an IDR for one compact exceeded 1.64 standard deviations from the overall mean (90% of normally distributed results should fall within this range), then the result was excluded and repeated. Outliers could be excluded as they do not signify normal IDR for the compounds. This could be due to issues with compact formation or media blanking. A maximum of two runs could be excluded in this way. For the final included data set the mean, standard deviation, RSD, median and quartiles was calculated for comparison.Between site comparisons were conducted on mean IDRs for each site. From these data the overall mean IDRs, standard deviations and RSDs were calculated.
3 Results and Discussion
The variability associated with dissolution testing experiments performed using the SDI systems has not previously been studied. Six compounds were selected based on initial work by one partner. One partner (site 6) had technical difficulties with their SDI system and the team were not able to complete the experimental work in house. In an effort to provide a full data set, the syringe pump, cartridge and tools from the site’s system were transferred to another site and used with a detector and heating block from another SDI system. A crossover compound (indomethacin, with the blank FaSSIF medium) was also examined. These experiments were analysed and have been kept separate from the original site 6 data and have been designated as site 7 in results. Indomethacin in blank FaSSIF was selected as all other sites had data for this API/medium combination and there was sufficient quantity of the API to allow a duplicate run including MEC to be completed. It was originally intended that this data could be used to provide a complete dataset for site 6, however this was not possible (see IDR results).

3.1 MEC
Each site measured MECs to take into account possible differences with respect to system performance, including lamp age. A single MEC used for all sites was not appropriate as the UV lamps are not replaceable and the systems used were of varying ages, with differences in the number of lamp hours. Additionally, the bandpass filters were different and differences in UV transmission between the filters is possible. During analysis, path length was not altered, the equipment has a standard path length of 0.4 cm.The mean MECs were used to give an indication of the variability between systems in terms of detector performance. The variability of carvedilol in FaSSIF was the greatest at around 45% RSD (with a range of 4900 to 16000). The variability of carvedilol in blank FaSSIF was also high at around 37% RSD, with the MEC at one site around half the value of the highest (see Supplementary Material - Table 5). See Figure 2 for the MEC determined at each site. One reason for the higher variability in tadalafil and carvedilol may be due to their relatively low solubility compared to other compounds in this study that have a higher solubility.
Where the calibration curve method was used, absorbance vs concentration was shown to be linear across the concentration range. There is no evidence that the different methods for MEC determination affect the results since MEC values at sites which used method 2 shows no pattern of high or low values. As the work was investigational it was assumed that the stated concentrations were accurate and no orthogonal determination of the solution concentrations was carried out.
Figure 2. MEC values determined in dissolution media by UV imaging at each site. Val – valsartan, Ibu – ibuprofen, Car – carvedilol, Ind – indomethacin, Tad – tadalafil, Bro – bromocriptine mesylate, FaS – FaSSIF, Bl FaS – blank FaSSIF. Insert is close up of ibuprofen results for clarity. Error bars on mean marker represent 1 standard deviation, where not visible, the error bars do not extend beyond the symbol. Mean MEC was calculated as a mean of individual sites as some were calculated from a calibration curve.

3.2 IDR
IDR can provide useful information in early drug development, especially small-scale methods where only a small quantity is required. It can be used to provide information on the performance of different API forms and salts to guide selection. The overall mean IDR for each API in the different media can be found in Table 3. The highest solubility APIs had the highest IDR values. The intermediate solubility drug substances (carvedilol and indomethacin) had intermediate IDR values while tadalafil and bromocriptine mesylate had the lowest values.

Table 3. Overall mean IDR values for each drug in both media. Individual site means also detailed.Drug Media Overall Mean (μg/min/cm2) ∆
(SD)[RSD]
Site Site Mean (μg/min/cm2) (SD)
RSD n† Total runs ‡§
Site 1 2.0 (0.90) 45% 6 8Site 2 1.7 (0.40) 24% 6 7Site 3 3.1 (0.74) 24% 6 7Site 4 4.0 (2.4) 60% 6 8Site 5 0.43 (0.18) 42% 6 15
FaSSIF3.4(2.7)[82%]
Site 6 8.2 (4.4) 54% 4 7Site 3 6.4 (6.1) 96% 6 6Site 4 2.1 (2.0) 94% 6 9
Bromocriptine Mesylate
Blank FaSSIF2.2(2.7)[20%] Site 6 4.4 (4.7) 110% 6 8
Site 1 3.7 (0.78) 21% 6 6Site 2 10 (1.5) 14% 6 8Site 3 4.3 (1.3) 30% 6 7Site 4 5.9 (2.3) 39% 6 13
FaSSIF7.1(4.2)[59%]
Site 7 11 (5.8) 51% 6 6Site 1 4.0 (1.8) 45% 6 6Site 2 3.6 (0.41) 11% 6 8Site 3 2.0 (0.51) 25% 6 12Site 4 6.4 (2.9) 46% 6 12
Carvedilol
Blank FaSSIF3.6(2.3)[65%]
Site 7 1.4 (0.88) 62% 5 6Site 1 66 (13) 20% 6 8Site 2 89 (17) 19% 6 8Site 3 89 (16) 18% 6 10Site 4 60 (8.4) 14% 6 7Site 5 47 (8.3) 18% 6 7
FaSSIF75(24)[33%]
Site 6 110 (22) 20% 4 7Site 1 55 (15) 27% 6 6Site 2 57 (16) 28% 6 12Site 3 57 (13) 22% 6 8
Ibuprofen
Blank FaSSIF66(30)[46%] Site 4 73 (7.1) 9.7% 6 7

Site 5 50 (17) 34% 6 8Site 6 120 (52) 42% 4 6Site 1 8.9 (0.90) 10% 6 7Site 2 22 (4.1) 19% 6 6Site 3 19 (5.9) 32% 6 8Site 4 15 (2.2) 15% 6 10Site 5 7.9 (1.5) 19% 6 6
FaSSIF19(15)[79%]
Site 6 47 (22) 46% 5 6Site 1 8.4 (0.86) 10% 6 8Site 2 16 (2.3) 15% 6 9Site 3 16 (7.5) 47% 6 10Site 4 15 (2.5) 16% 6 10Site 5 8.8 (1.3) 15% 6 7Site 6 13 (5.6) 44% 2 6
Indomethacin
Blank FaSSIF13(4.8)[38%]
Site 7 12 (7.4) 63% 2 3Site 1 0.80 (0.38) 47% 6 6Site 2 0.33 (0.049) 15% 6 9Site 3 1.5 (0.60) 39% 6 6Site 4 6.6 (3.8) 59% 6 7Site 5 1.5 (0.50) 34% 6 8
FaSSIF2.1(2.7)[130%]
Site 6 2.1 (2.3) 110% 5 7Site 3 0.62 (0.28) 45% 6 8Site 4 7.4 (0.59) 7.9% 6 7
Tadalafil
Blank FaSSIF2.9(3.3)[120%] Site 6 0.59 (0.28) 47% 6 8
Site 1 25 (3.8) 16% 6 6Site 2 60 (8.9) 15% 6 9Site 3 75 (11) 15% 6 6Site 4 50 (15) 30% 6 7Site 5 45 (7.0) 16% 6 11
FaSSIF48(21)[43%]
Site 7 20 (12) 59% 3 4Site 1 34 (5.6) 16% 6 7Site 2 51 (3.1) 6.0% 6 9
Valsartan
Blank FaSSIF37(16)[45%] Site 3 18 (6.6) 37% 6 10
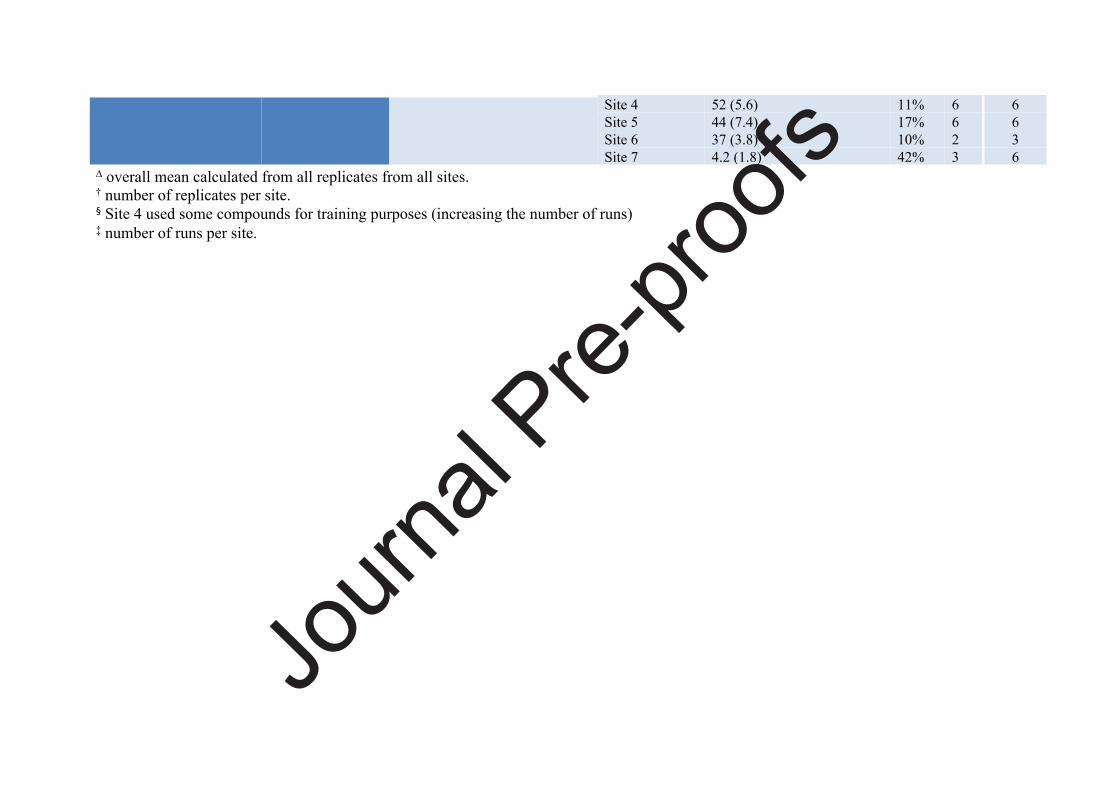
Site 4 52 (5.6) 11% 6 6Site 5 44 (7.4) 17% 6 6Site 6 37 (3.8) 10% 2 3Site 7 4.2 (1.8) 42% 3 6
∆ overall mean calculated from all replicates from all sites.† number of replicates per site.§ Site 4 used some compounds for training purposes (increasing the number of runs)‡ number of runs per site.

The equations for dissolution rate and IDR (Equations 1, 3 and 4) assume that the concentration at the API surface is the same as the solubility in the bulk medium. This is however variable depending on the microenvironment surrounding the surface. As an ionisable compound dissolves, the pH in the static layer in contact with the compound can be increased or decreased from the bulk for bases and acids respectively (55, 56). Where the pKa is close to the pH of the bulk medium, there is the possibility that pH changes can affect the solubility within the boundary layer at the compact surface. While this is difficult to overcome, awareness of the differences in solubility is important. For all APIs studied here, with the exception of tadalafil, there is a risk that the surface solubility is lower than the bulk due to pH changes thus decreasing the IDR. The compact surface pH was not determined in this study and therefore the possible impact of this effect has not been investigated. Each compound was investigated with a set flow rate, changes to this flow rate may alter the microenvironment at the compact surface and could be applied to study this phenomenon.
Buffer capacity and buffer type has also been shown to affect the dissolution rate. Krieg et al. demonstrated for ibuprofen and indomethacin that changing the buffer capacity will result in an increase in dissolution rate without a change in bulk pH (55). It is not only the buffer capacity which can affect dissolution since in the same study Krieg et al. showed that bicarbonate and phosphate buffers with the same capacity, show different IDRs (55). The work conducted here was carried out using a phosphate buffer with a set buffer capacity based on the recipe provided Biorelevant, therefore the results here can be compared between sites.
Site 6 utilised a different ibuprofen supply and to assess this internal studies at site 1 (not published) investigated the difference in IDR between four ibuprofen sources. It was found that the IDR of the OrBiTo supplied ibuprofen was statistically higher than commercial supplies from Sigma-Aldrich and BASF. While this may have affected measured IDR values, it was not sufficient to affect the overall rank order of the compounds.
The variability of the IDR results observed here for all replicates (33% to 130%) is similar to the μDISS IDR disc results from the interlaboratory study described earlier (26) where the coefficient of variation observed ranged from around 55% to 110%. These variabilities show that the SDI has a similar robustness to the μDISS. Robust intersite performance is important, if during the development of a compound it may be analysed using different systems. It is beneficial to have an understanding on potential differences between different systems in use, giving confidence to the results achieved.
From Table 3, the IDR for indomethacin in blank FaSSIF is similar between sites 6 and 7, however, valsartan had a lower IDR than expected in blank FaSSIF. It was not clear why this was the case. As a result site 7 was treated independently to site 6.
Due to the unavailability of the raw data; the indomethacin IDR values were recalculated post-analysis at site 7 using the correct MEC value according to Beer-Lambert Law.
3.2.1 Results in rank order of mean IDR
Data across the sites has been tabulated in overall rank order of mean IDR for both FaSSIF and blank FaSSIF. In FaSSIF media, the overall rank order of mean IDR was ibuprofen > valsartan > indomethacin > carvedilol > bromocriptine mesylate > tadalafil. This rank order
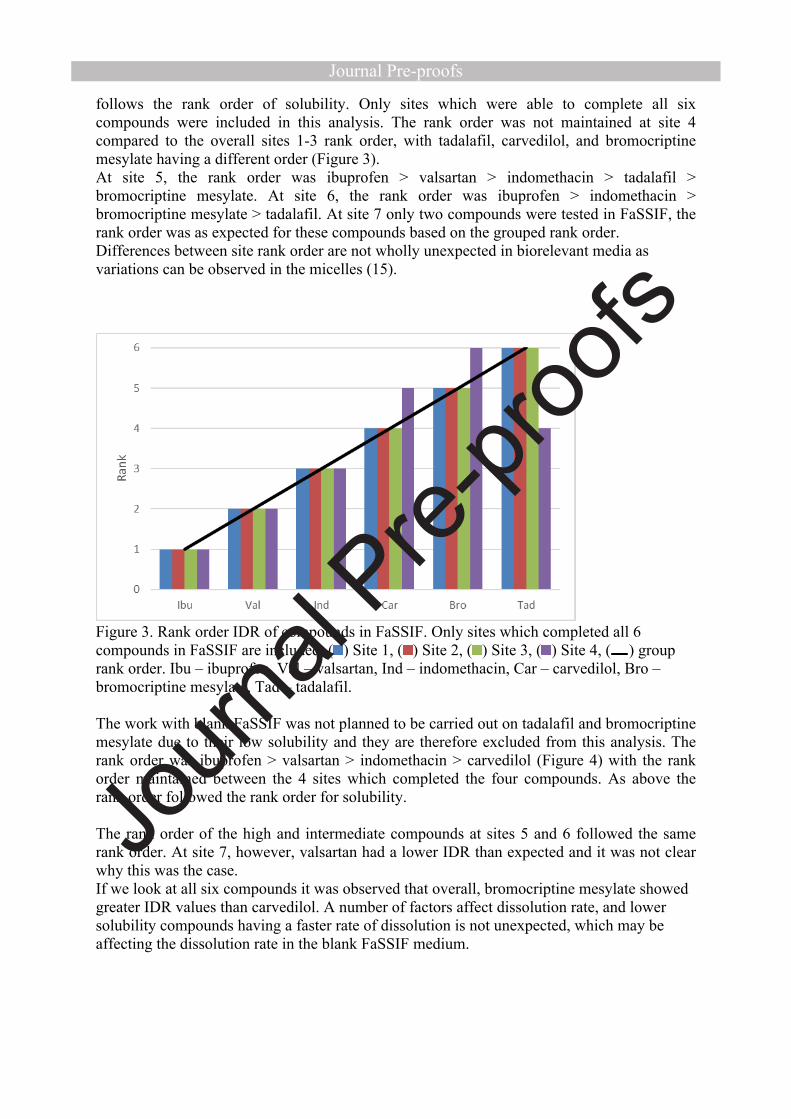
follows the rank order of solubility. Only sites which were able to complete all six compounds were included in this analysis. The rank order was not maintained at site 4 compared to the overall sites 1-3 rank order, with tadalafil, carvedilol, and bromocriptine mesylate having a different order (Figure 3).At site 5, the rank order was ibuprofen > valsartan > indomethacin > tadalafil > bromocriptine mesylate. At site 6, the rank order was ibuprofen > indomethacin > bromocriptine mesylate > tadalafil. At site 7 only two compounds were tested in FaSSIF, the rank order was as expected for these compounds based on the grouped rank order.Differences between site rank order are not wholly unexpected in biorelevant media as variations can be observed in the micelles (15).
Figure 3. Rank order IDR of compounds in FaSSIF. Only sites which completed all 6 compounds in FaSSIF are included. ( ) Site 1, ( ) Site 2, ( ) Site 3, ( ) Site 4, ( ) group rank order. Ibu – ibuprofen, Val – valsartan, Ind – indomethacin, Car – carvedilol, Bro – bromocriptine mesylate, Tad – tadalafil.
The work with blank FaSSIF was not planned to be carried out on tadalafil and bromocriptine mesylate due to their low solubility and they are therefore excluded from this analysis. The rank order was ibuprofen > valsartan > indomethacin > carvedilol (Figure 4) with the rank order maintained between the 4 sites which completed the four compounds. As above the rank order followed the rank order for solubility.
The rank order of the high and intermediate compounds at sites 5 and 6 followed the same rank order. At site 7, however, valsartan had a lower IDR than expected and it was not clear why this was the case.If we look at all six compounds it was observed that overall, bromocriptine mesylate showed greater IDR values than carvedilol. A number of factors affect dissolution rate, and lower solubility compounds having a faster rate of dissolution is not unexpected, which may be affecting the dissolution rate in the blank FaSSIF medium.

Figure 4. Rank order IDR of compounds in FaSSIF. Only sites which completed all moderate and high solubility compounds in FaSSIF are included. ( ) Site 1, ( ) Site 2, ( ) Site 3, ( ) Site 4, ( ) group rank order. Ibu – ibuprofen, Val – valsartan, Ind – indomethacin, Car – carvedilol.
Although the overall rank orders observed for FaSSIF was the same as solubility, it should not be assumed that solubility rank order directly translates into IDR rank order. This was the case for bromocriptine and carvedilol, in blank FaSSIF.
3.3 SDI versus μDISS
Five of the APIs studied here were also studied in the μDISS Profiler™ system, carvedilol was not included in the study by Andersson et al. and is not included in this part of the discussion (26). The study by Andersson et al. determined IDR on both API powder and compacted discs, only the disc IDRs will be discussed and the mean IDR comparisons can be found in Figure 5. Direct comparisons between the IDR values were not appropriate as the conditions were different between the methods. The rank order for the disc IDRs in FaSSIF for μDISS Profiler™ was valsartan > ibuprofen > indomethacin > bromocriptine mesylate > tadalafil (26). This differs from the rank order for the current SDI work: ibuprofen > valsartan > indomethacin > bromocriptine mesylate > tadalafil. The high solubility compounds have switched places but apart from that the order is identical. When the μDISS IDR is plotted against the SDI values a linear relationship was not observed, with an R2 value of 0.55. Valsartan appears to be an outlier in the data. When valsartan is excluded a linear relationship with an R2 value of 0.98 is observed. It is unclear whether valsartan IDR is over or under estimated in the μDISS or SDI respectively. One possibility for the results is due to valsartan being a high solubility, high UV absorbance compound, which could be affecting the IDR results measured in both studies. Further work is needed on high solubility, high absorbance compounds to allow that distinction to be made. Another possibility could be the differences in the compact microenvironments between the static and flow through systems. APIs will dissolve to saturation around the compact before diffusing into the bulk media, as the hydrodynamics of both static and flow through systems differ there could be an effect on IDR. The IDR values for the SDI and μDISS are expected to differ based on the differences between the systems. The SDI utilises a static compact where medium is passed over the compact at a set flow rate whereas the μDISS utilises a rotating compact. The method of

detection varies between the two systems also. Where the SDI detects a single wavelength the μDISS detects across the spectrum and a range can be used. The quantitative performance of the UV imaging setup (SDI) with respect to determining dissolution rates has previously been assessed (57, 58). As with solubility, IDRs measured are affected by different measurement conditions and comparisons between different techniques should be qualitative. A comparison to Wood’s apparatus is recommended, ideally using the same batch of APIs used in this study, as well as running carvedilol using the same μDISS methods used by Andersson et al.(26).
Figure 5. IDR comparison between SDI ring study and μDISS ring study. All results in FaSSIF at 37oC. ( ) Bromocriptine Mesylate, ( ) Ibuprofen, ( ) Indomethacin, ( ) Tadalafil, ( ) Valsartan
3.4 Single operator analysis
To investigate the variability introduced by different operators carrying out the analysis at multiple sites it was decided that one person would process the indomethacin data for all sites in both FaSSIF and blank FaSSIF media. Variability due to operator can occur due to inconsistencies in FaSSIF preparation as it is known that micelle size is particularly sensitive to the concentration of SIF used (15). Further source of variability between operators can occur with the placement of the z-origin in the analysis software. This origin determines the amount of absorption data included in IDR determinations. Operators were instructed on setting the origins within the software as part of the shared methods.
Raw data files from sites 1 to 6 were sent to a single operator for analysis, along with details of the indomethacin MEC in both FaSSIF and blank FaSSIF. Site 7 was excluded from the analysis as raw SDI files were not available. In FaSSIF medium, the single operator analysis improved the variability (Table 4) over all sites. When blank FaSSIF medium was used, single operator analysis did not reduce the observed variability.
While single operator analysis successfully reduced the variability of the mean IDR in FaSSIF, there was a lack of improvement in the lower variability blank FaSSIF analysis. The
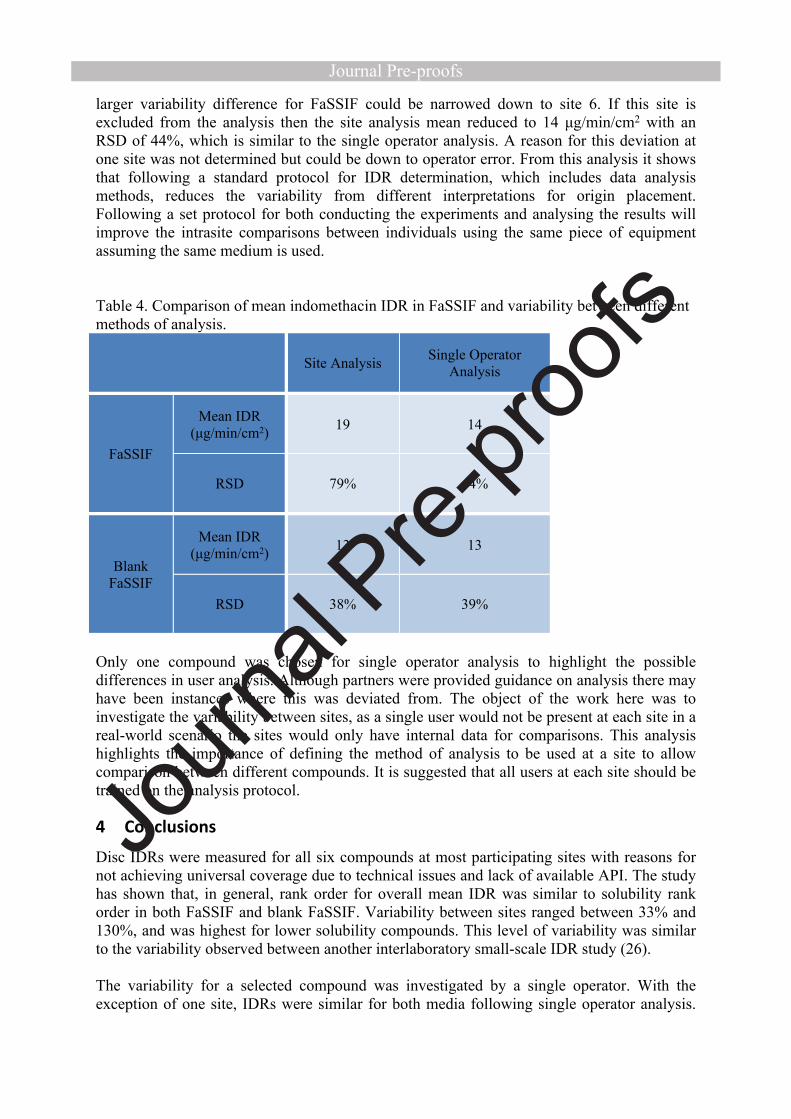
larger variability difference for FaSSIF could be narrowed down to site 6. If this site is excluded from the analysis then the site analysis mean reduced to 14 μg/min/cm2 with an RSD of 44%, which is similar to the single operator analysis. A reason for this deviation at one site was not determined but could be down to operator error. From this analysis it shows that following a standard protocol for IDR determination, which includes data analysis methods, reduces the variability from different interpretations for origin placement. Following a set protocol for both conducting the experiments and analysing the results will improve the intrasite comparisons between individuals using the same piece of equipment assuming the same medium is used.
Table 4. Comparison of mean indomethacin IDR in FaSSIF and variability between different methods of analysis.
Site Analysis Single Operator Analysis
Mean IDR (μg/min/cm2) 19 14
FaSSIF
RSD 79% 44%
Mean IDR (μg/min/cm2) 13 13
Blank FaSSIF
RSD 38% 39%
Only one compound was chosen for single operator analysis to highlight the possible differences in user analysis. Although partners were provided guidance on analysis there may have been instances where this was deviated from. The object of the work here was to investigate the variability between sites, as a single user would not be present at each site in a real-world scenario the sites would only have internal data for comparisons. This analysis highlights the importance of defining the method of analysis to be used at a site to allow comparison between different compounds. It is suggested that all users at each site should be trained on the analysis protocol.
4 Conclusions
Disc IDRs were measured for all six compounds at most participating sites with reasons for not achieving universal coverage due to technical issues and lack of available API. The study has shown that, in general, rank order for overall mean IDR was similar to solubility rank order in both FaSSIF and blank FaSSIF. Variability between sites ranged between 33% and 130%, and was highest for lower solubility compounds. This level of variability was similar to the variability observed between another interlaboratory small-scale IDR study (26).
The variability for a selected compound was investigated by a single operator. With the exception of one site, IDRs were similar for both media following single operator analysis.

Therefore, having and following a standard method, for data collection and analysis will help to reduce variability during intra and inter laboratory experiments.
The observed variability is likely related to an intrinsic variability which can be expected between systems and is difficult to reduce further with experimental controls. While the rank order for the three lowest solubility compounds was not maintained, the high and low solubility compounds were successfully separated according to IDR at the sites. It is important that the MEC values are measured using the system on which the IDR will be determined.
The data here shows that the SDI can be used in early development work to measure IDR. The variability is similar to the μDISS Profiler™. The advantage this system has over others is the imaging capabilities. For APIs at risk of, for example, gelling or form changes, this can be observed from the videos produced. Powder release from the compact surface or compact disintegration can be detected and visualised using the imaging, providing information on the behaviour of the API. For the majority of compounds, the two different small-scale IDR methods compared here are likely to be suitable. An internal database of knowledge should be gathered for allowing comparisons between APIs to make determinations. Further work is required to investigate the suitability of the SDI method for high solubility, high absorbance drugs.
The current study highlights the challenges associated with determining a seemingly simple but important parameter affecting the performance of drug candidates. Variability at and between sites is remarkable and should be kept in mind assessing dissolution rate data.
5 Acknowledgments
This work has received support from the Innovative Medicines Initiative Joint Undertaking (http://www.imi.europa.eu) under grant agreement no. 115369, resources of which are composed of financial contribution from the European Union’s Seventh Framework Programme (FP7/2007-2013) and European Federation of Pharmaceutical Industries and Association companies. This project has also received funding from the European Union’s Horizon 2020 research and innovation program under the Marie Sklodowska-Curie grant agreement No 644056 (CRYDIS). We also acknowledge the University of Bath for allowing use of their system to allow completion of work, and Karl Box and Hayley Watson of Pion (formerly Sirius) who provided helpful input during initial discussions when planning the study.
6 Supplementary Material
Table 5. Mean MEC values for each API in media used.API Media Mean MEC (M-1 cm-1) (SD/RSD) No. of Sites
FaSSIF 8.43 x 10³ (2.27 x 10³/27%) 6Bromocriptine mesylate Blank FaSSIF 5.90 x 10³ (1.71 x 10²/2.9%) 2FaSSIF 8.29 x 10³ (3.04 x 10³/37%) 5Carvedilol Blank FaSSIF 9.42 x 10³ (4.20 x 10³/45%) 5FaSSIF 2.78 x 10² (7.05 x 101/25%) 5Ibuprofen Blank FaSSIF 2.81 x 10² (5.39 x 101/19%) 6

FaSSIF 1.82 x 10⁴ (5.06 x 10³/28%) 6Indomethacin Blank FaSSIF 1.88 x 10⁴ (3.32 x 10³/18%) 7FaSSIF 1.06 x 10⁴ (3.38 x 10³/32%) 6Tadalafil Blank FaSSIF 1.22 x 10⁴ (3.24 x 10³/27%) 2FaSSIF 1.16 x 10⁴ (3.75 x 10³/32%) 7Valsartan Blank FaSSIF 1.28 x 10⁴ (2.44 x 10³/19%) 7
7 References1. Varum FJ, Hatton GB, Basit AW. Food, physiology and drug delivery. International Journal of Pharmaceutics. 2013;457(2):446-60.2. Amidon GL, Lennernäs H, Shah VP, Crison JR. A Theoretical Basis for a Biopharmaceutic Drug Classification: The Correlation of in Vitro Drug Product Dissolution and in Vivo Bioavailability. Pharm Res. 1995;12(3):413-20.3. Zhou Z, Dunn C, Khadra I, Wilson CG, Halbert GW. Statistical investigation of simulated fed intestinal media composition on the equilibrium solubility of oral drugs. European Journal of Pharmaceutical Sciences. 2017;99:95-104.4. Sabena D. Mithani, Vassiliki Bakatselou, Christopher N. TenHoor, Dressman JB. Estimation of the Increase in Solubility of Drugs as a Function of Bile Salt Concentration. Pharm Res. 1996;13(1):163-7.5. Hörter D, Dressman JB. Influence of physicochemical properties on dissolution of drugs in the gastrointestinal tract. Advanced Drug Delivery Reviews. 1997;25(1):3-14.6. Koziolek M, Grimm M, Becker D, Iordanov V, Zou H, Shimizu J, et al. Investigation of pH and Temperature Profiles in the GI Tract of Fasted Human Subjects Using the Intellicap((R)) System. Journal of Pharmaceutical Sciences. 2015;104(9):2855-63.7. Wurster DE, Taylor PW. Dissolution Rates. J Pharm Sci. 1965;54(2):169-75.8. Shoghi E, Fuguet E, Bosch E, Rafols C. Solubility-pH profiles of some acidic, basic and amphoteric drugs. Eur J Pharm Sci. 2013;48(1-2):291-300.9. Klein S. The use of biorelevant dissolution media to forecast the in vivo performance of a drug. AAPS J. 2010;12(3):397-406.10. Fuchs A, Leigh M, Kloefer B, Dressman JB. Advances in the design of fasted state simulating intestinal fluids: FaSSIF-V3. Eur J Pharm Biopharm. 2015;94:229-40.11. Leigh M, Kloefer B, Schaich M. Comparison of the Solubility and Dissolution of Drugs in FastedState Biorelevant Media (FaSSIF and FaSSIF-V2). Dissolution Technologies. 2013;20(3):44-50.12. Issa MG, Ferraz HG. Intrinsic Dissolution as a Tool for Evaluating Drug Solubility in Accordance with the Biopharmaceutics Classification System. Dissolution Technologies. 2011;18(3):6-13.13. Yu LX, Carlin AS, Amidon GL, Hussain AS. Feasibility studies of utilizing disk intrinsic dissolution rate to classify drugs. International Journal of Pharmaceutics. 2004;270(1-2):221-7.14. Dokoumetzidis A, Macheras P. A century of dissolution research: from Noyes and Whitney to the biopharmaceutics classification system. Int J Pharm. 2006;321(1-2):1-11.15. Sugano K, Okazaki A, Sugimoto S, Tavornvipas S, Omura A, Mano T. Solubility and Dissolution Profile Assessment in Drug Discovery. Drug Metabolism and Pharmacokinetics. 2007;22(4):225-54.16. Okazaki A, Mano T, Sugano K. Theoretical dissolution model of poly-disperse drug particles in biorelevant media. Journal of Pharmaceutical Sciences. 2008;97(5):1843-52.17. Tseng Y-C, Patel M, Zhao Y. Determination of Intrinsic Dissolution Rate Using Miniaturized Rotating and Stationary Disk Systems. Dissolut Technol. 2014;21(2):24-9.18. Avdeef A, Tsinman O. Miniaturized rotating disk intrinsic dissolution rate measurement: effects of buffer capacity in comparisons to traditional wood's apparatus. Pharm Res. 2008;25(11):2613-27.

19. Aaltonen J, Heinanen P, Peltonen L, Kortejarvi H, Tanninen VP, Christiansen L, et al. In situ measurement of solvent-mediated phase transformations during dissolution testing. Journal of Pharmaceutical Sciences. 2006;95(12):2730-7.20. Alsenz J, Haenel E, Anedda A, Du Castel P, Cirelli G. Miniaturized INtrinsic DISsolution Screening (MINDISS) assay for preformulation. Eur J Pharm Sci. 2016;87:3-13.21. Svanbäck S, Ehlers H, Yliruusi J. Optical microscopy as a comparative analytical technique for single-particle dissolution studies. Int J Pharm. 2014;469(1):10-6.22. Kuentz M. Analytical technologies for real-time drug dissolution and precipitation testing on a small scale. Journal of Pharmacy and Pharmacology. 2015;67(2):143-59.23. Andersson SBE, Alvebratt C, Bergstrom CAS. Controlled Suspensions Enable Rapid Determinations of Intrinsic Dissolution Rate and Apparent Solubility of Poorly Water-Soluble Compounds. Pharm Res. 2017;34(9):1805-16.24. Berger CM, Tsinman O, Voloboy D, Lipp D, Stones S, Avdeef A. Technical Note: Miniaturized Intrinsic Dissolution Rate (Mini-IDR™) Measurement of Griseofulvin and Carbamazepine. Dissolution Technologies. 2007;14(4):39-41.25. Nielsen LH, Gordon S, Pajander JP, Østergaard J, Rades T, Mullertz A. Biorelevant characterisation of amorphous furosemide salt exhibits conversion to a furosemide hydrate during dissolution. Int J Pharm. 2013;457(1):14-24.26. Andersson SB, Alvebratt C, Bevernage J, Bonneau D, da Costa Mathews C, Dattani R, et al. Interlaboratory Validation of Small-Scale Solubility and Dissolution Measurements of Poorly Water-Soluble Drugs. J Pharm Sci. 2016;105(9):2864-72.27. Lennernas H, Aarons L, Augustijns P, Beato S, Bolger M, Box K, et al. Oral biopharmaceutics tools - time for a new initiative - an introduction to the IMI project OrBiTo. European Journal of Pharmaceutical Sciences. 2014;57:292-9.28. Kostewicz ES, Abrahamsson B, Brewster M, Brouwers J, Butler J, Carlert S, et al. In vitro models for the prediction of in vivo performance of oral dosage forms. European Journal of Pharmaceutical Sciences. 2014;57:342-66.29. Sun Y, Ostergaard J. Application of UV Imaging in Formulation Development. Pharm Res. 2017;34(5):929-40.30. Wren S, Lenke J. Pharmaceutical Dissolution and UV Imaging. American Laboratory. 2011;Application Notes.31. Boetker JP, Savolainen M, Koradia V, Tian F, Rades T, Mullertz A, et al. Insights into the early dissolution events of amlodipine using UV imaging and Raman spectroscopy. Mol Pharm. 2011;8(4):1372-80.32. Qiao N, Wang K, Schlindwein W, Davies A, Li M. In situ monitoring of carbamazepine-nicotinamide cocrystal intrinsic dissolution behaviour. Eur J Pharm Biopharm. 2013;83(3):415-26.33. Østergaard J, Wu JX, Naelapaa K, Boetker JP, Jensen H, Rantanen J. Simultaneous UV imaging and raman spectroscopy for the measurement of solvent-mediated phase transformations during dissolution testing. J Pharm Sci. 2014;103(4):1149-56.34. Niederquell A, Kuentz M. Biorelevant dissolution of poorly soluble weak acids studied by UV imaging reveals ranges of fractal-like kinetics. International Journal of Pharmaceutics. 2014;463(1):38-49.35. Hulse WL, Gray J, Forbes RT. A discriminatory intrinsic dissolution study using UV area imaging analysis to gain additional insights into the dissolution behaviour of active pharmaceutical ingredients. Int J Pharm. 2012;434(1-2):133-9.36. Bloomer JC, Ambery C, Miller BE, Connolly P, Garden H, Henley N, et al. Identification and characterisation of a salt form of Danirixin with reduced pharmacokinetic variability in patient populations. Eur J Pharm Biopharm. 2017;117:224-31.37. Østergaard J, Lenke J, Sun Y, Ye F. UV Imaging for In Vitro Dissolution and Release Studies: Intial Experiences. Dissolution Technologies. 2014;21(4).

38. Lu Y, Li M. Simultaneous Rapid Determination of the Solubility and Diffusion Coefficients of a Poorly Water-Soluble Drug Based on a Novel UV Imaging System. J Pharm Sci. 2016;105(1):131-8.39. Wren S, Lenke J. Pharmaceutical dissolution and UV imaging. American Laboratory. 2011;43:33.40. Jensen SS, Jensen H, Goodall DM, Ostergaard J. Performance characteristics of UV imaging instrumentation for diffusion, dissolution and release testing studies. J Pharm Biomed Anal. 2016;131:113-23.41. Nelson KG, Shah AC. Convective diffusion model for a transport-controlled dissolution rate process. J Pharm Sci. 1975;64(4):610-4.42. Shah AC, Nelson KG. Evaluation of a convective diffusion drug dissolution rate model. J Pharm Sci. 1975;64(9):1518-20.43. Lenke J. Two Dimensional orthogonal imaging of laminar fluid flow across API surface: Insight into dosage concentration inside GI Lumen and permeability. The Electronic Conference on Pharmaceutical Sciences: ECPS20112011.44. He Y, Ho C, Yang D, Chen J, Orton E. Measurement and Accurate Interpretation of the Solubility of Pharmaceutical Salts. J Pharm Sci. 2017;106(5):1190-6.45. Söderlind E, Karlsson E, Carlsson A, Kong R, Lenz A, Lindborg S, et al. Simulating Fasted Human Intestinal Fluids: Understanding the Roles of Lethicin and Bile Acids. Mol Pharm. 2010;7(5):1498-507.46. Hamed R, Awadallah A, Sunoqrot S, Tarawneh O, Nazzal S, AlBaraghthi T, et al. pH-Dependent Solubility and Dissolution Behavior of Carvedilol--Case Example of a Weakly Basic BCS Class II Drug. AAPS PharmSciTech. 2016;17(2):418-26.47. Levis KA, Lane ME, Corrigan OI. Effect of buffer media composition on the solubility and effective permeability coefficient of ibuprofen. International Journal of Pharmaceutics. 2003;253(1-2):49-59.48. Corrigan OI. The Biopharmaceutic Drug Classification and Drugs Administered in Extended Release (Er) Formulations. In: Young D, Devane JG, Butler J, editors. In Vitro-in Vivo Correlations. Boston, MA: Springer US; 1997. p. 111-28.49. Etherson K, Halbert G, Elliott M. Determination of excipient based solubility increases using the CheqSol method. International Journal of Pharmaceutics. 2014;465(1-2):202-9.50. Clarysse S, Brouwers J, Tack J, Annaert P, Augustijns P. Intestinal drug solubility estimation based on simulated intestinal fluids: comparison with solubility in human intestinal fluids. European Journal of Pharmaceutical Sciences. 2011;43(4):260-9.51. Anderson NR, Gullapalli RP, inventors; Lilly ICOS, assignee. β-carboline pharmaceutical compositions. United States patent US6841167B1. 2000.52. Mbah CJ. Physicochemical properties of valsartan and the effect of ethyl alcohol, propylene glycol and pH on its solubility. Pharmazie. 2005;60(11):849-50.53. Merimsky O, Rubinstein M, Fischer D, Danon A, Chaitchik S. Pharmacokinetics of Recombinant Interferon-Alpha-C. Cancer Chemotherapy and Pharmacology. 1991;27(5):406-8.54. Galia E, Nicolaides E, Hörter D, Löbenberg R, Reppas C, Dressman JB. Evaluation of Various Dissolution Media for Predicting In Vivo Performance of Class I and II Drugs. Pharm Res. 1998;15(5):698-705.55. Krieg BJ, Taghavi SM, Amidon GL, Amidon GE. In Vivo Predictive Dissolution: Comparing the Effect of Bicarbonate and Phosphate Buffer on the Dissolution of Weak Acids and Weak Bases. J Pharm Sci. 2015;104(9):2894-904.56. Shekunov B, Montgomery ER. Theoretical Analysis of Drug Dissolution: I. Solubility and Intrinsic Dissolution Rate. J Pharm Sci. 2016;105(9):2685-97.57. Boetker JP, Rantanen J, Rades T, Mullertz A, Østergaard J, Jensen H. A new approach to dissolution testing by UV imaging and finite element simulations. Pharm Res. 2013;30(5):1328-37.58. Østergaard J. UV imaging in pharmaceutical analysis. J Pharm Biomed Anal. 2018;147:140-8.

Background absorbance
Surface absorbance
IDR absorbance
Approx. location of top of sample cup
Surface Dissolution Imaging Instrument Output of SDI used to calculate the IDR
Results and IDR Reported