Embed Size (px)
Citation preview

An intervention-logic approach for the design and implementation of S3 strategies
from place-based assets to expected impacts
Mathieu Doussineau
Christian Saublens
Nicholas Harrap
2021
EUR 30573 EN

This publication is a Science for Policy report by the Joint Research Centre (JRC), the European Commission’s s cience a nd kn o wle dge
service . It aims to provide evidence-based scientific support to the European policymaking process. The scientific output expressed d oes not imply a policy position of the European Commission. Neither the European Commission nor any p erson a ctin g o n b ehalf o f th e
Commission is responsible for the use that might be made of this publication. For information on the methodology and quality underlying the data used in this publication for which the source is neither Eurostat nor other Commission s erv ices , u s ers s hou ld co ntac t th e
referenced source . The designations employed and the presentation of material on the maps do not imply th e expression of any opin ion whatsoever on the part of the European Union concerning the legal status of any country, te rritory, city or area or of its a u thoritie s, o r
concerning the delimitation of its frontie rs or boundaries.
Contact information Name: Mathieu Doussineau
Address: Calle Inca Garcilaso 3, 41092, Seville , Spain Email: [email protected]
EU Science Hub
https://ec.europa.eu/jrc
JRC121110
EUR 30573 EN
PDF ISBN 978-92-76-29138-1 ISSN 1831-9424 doi:10.2760/21167
Luxembourg: Publications Office of the European Union, 2021
© European Union, 2021
The reuse policy of the European Commission is implemented by the Commission Decision 2011/833/EU of 12 December 2 0 1 1 o n th e reuse of Commission documents (OJ L 330, 14.12.2011, p . 39). Except otherwise noted, the reuse of this document is authorised u nder
the Creative Commons Attribution 4.0 International (CC BY 4.0) licence (https://creativecommons.org/licenses/by/4.0/). Th is me ans th at reuse is allowed provided appropriate credit is given and any changes are indicated. For any use or reproductio n o f photo s o r o ther
material that is not owned by the EU, permission must be sought directly from the copyright holders.
All content © European Union, 2021, except cover p icture ©EtiAmmos / Adobe
How to cite this report: Doussineau M., Saublens C., Harrap N., An intervention-logic approach for the design and implementation of S 3 strategies: from place-based assets to expected impacts, EUR 30573 EN, Publications Office of the European Union, Luxembourg, 2 02 1 ,
ISBN 978-92-76-29138-1, doi:10.2760/21167, JRC121110.

i
Contents
Abstract .......................................................................................................................................................................................................................................................... 2
Foreword ...................................................................................................................................................................................................................................................... 3
Acknowledgements ............................................................................................................................................................................................................................. 4
Executive summary.............................................................................................................................................................................................................................. 5
Introduction ............................................................................................................................................................................................................................................... 6
1 The logic of intervention in Smart Specialisation: lessons from 2014-2020 and the way forward .... 8
1.1 Cases studies and a seminar to frame the approach .............................................................................................................. 8
1.2 Deconstructing the Intervention logic to better revise the Smart Specialisation Strategy ................ 9
1.3 Rationale for a place-based result-oriented approach ............................................................................................................ 12
2 Approach for a place-based and more result-oriented strategy ................................................................................................ 14
2.1 Step 1: Assessment of Stakeholders’ needs based on Regional Competitive Intelligence ................. 15
2.2 Step 2: Strategy operationalisation ............................................................................................................................................................. 17
2.3 Step 3: Target indicators estimation through Predictive analytics ............................................................................. 19
2.4 Step 4: Strategy implementation and management ................................................................................................................. 20
2.5 Step 5: Resource allocation through a reverse action plan ................................................................................................. 22
2.6 Step 6: Strategy consistency check and enabling condition .............................................................................................. 23
Conclusion .................................................................................................................................................................................................................................................... 25
References .................................................................................................................................................................................................................................................. 26

2
Abstract
Smart Specialisation is conceptualised as research and innovation policymaking encompassed in a holistic place-based view of development. It combines an organisational bottom-up approach with a structural approach, stressing interactions among local and international actors that participate and facilitate reflexive learning processes.
The issue of governance is key and multi-level governance is instrumental for advancing with the goal of the strategy on the ground. The need to connect top-down EU policies with place-based facts and ambitions that translate into competitive advantage , generating growth and jobs, makes governance the cornerstone of the Smart Specialisation process. In the context of the revision of the existing strategies the need to reassess the coherence of policy intervention is of crucial importance to address the local but also the global challenges faced by EU territories.

3
Foreword
When addressing complex systems, analysts are often confronted with a multiple array of parameters and factors that are not easy to grasp, let alone to configure, in ways that can lead to meaningful results. A good example is the field of software engineering and the imperative for its updating due to the ever changing needs of user profiles, hardware evolution, business organi sational structures, regulatory, safety and security requirements. To do this, developers spend significant efforts to fully understand the underlying routines, the knots and bolts of existing software, to properly des ign future versions and advance to new configurations. This is a critical process that identifies the core components, the possible new directions for development and the operational paths for new achievements.
Writing on software reverse engineering, Chikofsky and Cross1 define this as “the process of analysing a subject system, to identify the system’s components and their inter-relationships and create representations of the system in another form or at a higher level of abstraction”. Reverse engineering proves often effective also in other areas, where the analysis of complex systems is facilitated by establishing procedures that define systematic feedback loops to shed light and inform uncertain decision trees. And it is here that an interesting analogy begins between complex software systems and Smart Specialisation.
Smart Specialisation has been characterised by Corina Creţu, the previous European Commissioner for regional policy, as the most comprehensive policy experience on implementing innovation -driven progress in Europe…’, however it is still unclear how such a policy is conceived, designed , built and implemented on the ground. While we have by now a lot of guides and plenty of expertise , we cannot say we are out of the woods yet on going from policy design to policy practice on a sa fe path to success. Yet we have invested millions of Euro on the concept of RIS3, often not still getting the desired results . Drawing an analogy with complex software, we could argue that it would be rather beneficial to proceed to some intelligent reverse engineering of the concept before going further. Analysing the b lack box of Smart Specialisation and connecting its objectives with realities on the ground together with capabilitie s and limitations of the players, could pay-off.
This is exactly what the present study attempts with elegance, brevity and accuracy. It uses analogies from the world of management studies, quantitative methods and operational research to bring a fresh view of the necessary evaluation and monitoring that form a core part of the Entrepreneurial Discove ry Process. And it is with a refreshing clarity that the reader will discover the operational stages p roposed that contribute to a better policy design of Smart Specialisation Strategies. Certainly a clear advancement in our long journey towards successful regional innovation ecosystems.
Dr Dimitri Corpakis Former EU official (Head of Unit) Senior Research Fellow, South East European Research Centre (SEERC) Member of the Executive Committee of the Triple Helix Association
1 Chikofsky, E., and Cross, J.I. Reverse engineering and design recovery: A ta xonomy. IEEE So f twa re 7,
1(1990), 13–17

4
Acknowledgements
The authors would like to thank Esteban Pelayo and Christopher McInnes from the European Associaton of Development Agencies (EURADA) for their constant support and Roberto Algara, Andrea d i Anse lmo, Luc Hulsman, Aude Korfer, Jan Larosse, Carmen Sillero, Elżbieta Książek, Jean-Christophe Godest and Frédéric Pinna for their participation in the December 2019 workshop in providing useful comments. The authors wish also to thank Jayne Woolford, Mark Boden, Johan Stierna, Karel Haegeman, Denisa Perrin , Koen Jonkers and Dimitri Corparkis for providing useful comments and feedback on the working draft of the report.
Authors
Mathieu Doussineau, European Commission, Joint Research Centre, Seville, Spain
Christian Saublens, Saublens & Saublens snc (Belgium), Former CEO of the European Association of Development Agencies (EURADA)
Nicholas Harrap, European Commission, Joint Research Centre, Seville, Spain

5
Executive summary
Smart Specialisation is conceptualised as research and innovation policymaking encompassed in a holistic place-based view of development. It combines an organisational bottom-up approach with a structural approach, stressing interactions among local and international actors that participate and facilitate reflexive learning processes.
The issue of governance is key and multi-level governance is of crucial importance. The need to connect top-down sectoral policies with place-based facts and ambitions that translate into competitive advantage generating growth and jobs makes governance the cornerstone of the process. The need for mainstreaming Smart Specialisation Strategies, allowing all sectoral policies to operate with a common overall directionality in synergy with the new EU agenda, is instrumental for a successful implementation. Opportunities exist for better links between Smart Specialisation Strategies and o the r programmes such as Horizon Europe to fully address challenges set by the Green Deal and the New Industrial Strategy.
This report focuses on the new generation of Smart Specialisation Strategies and their expected impacts. The main objective is to make sure the links between all the components of the imp lementation of a strategy strengthen the overall coherence of the public intervention.
Policy context
After years of implementation across European regions and countries, the concept of Smart Specialisation has managed to convince most policy makers of its value. However, the academic community and evaluators, have highlighted difficulties faced by stakeholders when implementing the strategies. The effectiveness of the public intervention is sometimes questioned in terms of socio-economic impacts in addressing both EU and territorial challenges. After three generations2 of reg ional innovation strategies within cohesion policies, the question of ‘value for money’ is more than ever relevant particularly in the context of increasing need of public intervention with the COVID pandemic.
The transition between the 2014-2020 and 2021-2027 financing periods, with the feedback loop of the European cohesion policy cycle, is an appropriate time to rethink past and future regional strategies. The next generation of Smart Specialisation Strategies offers the opportunity to embed the New European industrial policy orienting growth policy to the European Green Deal in line with the UN Sustainable Development Goals. An evolution from a full bottom-up approach in the 2014-2020 period to a combination of bottom-up and top-down approaches, using the new mission-oriented concept for EU innovation policy, offers opportunities for the next generation of Smart Specialisation Strategies.
Key conclusions
After seven years of experience there is now an opportunity to adjust the original concept in line with the new EU policy agenda and to verify that the strategy is still addressing the regional stakeholders’ needs . Based on the general observation that the effectiveness and the impact of Smart Specialisation Strategies can be improved, this report proposes an approach to strengthen the result-orientation of Smart Specialisation by verifying the coherence of strategic decisions with the territorial capacitie s and capabilities.
The originality of this approach is that it borrows and adapts management tools often used in the private sector for a public purpose.
The report invites policy makers to address the questions about the ‘why’ (is the intervention addressing a problem?), the ‘who’ (what is the target of the intervention?), and the ‘how’ (do I have f inancia l and administrative resources?).
Starting from a pre-existing Smart Specialisation Strategy, the results-oriented ‘stress-test’ is divided into six steps: (1) the assessment of stakeholders’ needs, (2) the strategy operationalisation, (3) the estimation of target indicators, (4) the strategy implementation and management, (5) the resource allocation and (6) a final consistency check.
2 The first generation of regional innovation strategies (RIS) was launched for the 2000 -2006 pro gramming
period.

6
Introduction
In 2009, the so-called Barca report3 proposed a common understanding of a place-based rationale for 2014-2020 EU cohesion policy. The report set the basis for the implementation, at a local leve l , of the Lisbon Strategy objectives and the Europe 2020 Agenda.
A cornerstone of public policy is the use of a public intervention to address market and systemic failures. More recent innovation policy also recognizes the need for a more proactive and ‘entrepreneurial state ’ , mobilising public policy to shape or create markets (Mazzucato, 2011). Public interventions are based on policies that have different, but complementary, objectives targeting different or the same beneficiaries . Therefore, synergies between EU public policies are promoted at national and regional levels.
In 2019, the European Court of Auditors (ECA) highlighted a lack of effectiveness of cohesion policy leading to low tangible results in some EU regions (European Court of Auditors, 2019). The ECA recommended that EU Regions should not only design a “clear intervention logic” but also take a more result-oriented approach to tackle the lack of impacts. According to the ECA, such an approach should be implemented during the selection phase and the implementation phase of projects. It is the quality of projects funded and their benefit in terms of tangible results that will determine the overall impact of a policy.
The new EU policy agenda introduces a directionality with the European Green Deal, which is a lso the EU’s new growth agenda. This is reflected in the EU’s new industrial strategy striving for the creation of new industry and jobs in the EU from a strategic approach to the twin ecological and digital trans itions (European Commission, 2020, 102; European Commission, 2019, 640). This increases the importance of public resources used for ambitious projects that have impact on competitive sustainability and strategic autonomy. In the context of the European Green Deal, requiring systemic innovation, further institutional capacity building is crucial. This implies increased importance of results-oriented policy-design with much improved evidence-gathering and awareness of local strengths and weaknesses, opportunities and threats in times of global transitions (McCann and Soete, 2020). In addition, the mission-oriented approach (Mazzucato, 2018) along with the upcoming Horizon Europe programme can be a new parameter to consider for the next generation of strategies.
To successfully implement new strategic directions, it is preferable that they are endorsed by all the regional stakeholders involved in the policy design. This requires evidence-based assessment using robust and reliable data drawn from a range of sources and analysed in an appropriate manner. It needs also to present a clear logical link between the data, the analysis and conclusions highlighting any strengths or weaknesses.
There is also a need to take into consideration the Covid-19 crisis and its impact on the European economies particularly the consequences for the next the 2021-27 financial period. The European Commission proposed a new instrument, the ‘Next Generation EU’, where investment in firms and innovations for the green and digital transition is at the forefront (European Commission, 2020a; European Commission, 2020b)4. This temporary instrument provides targeted and frontloaded investment to support Member States and reinforce EU programmes key for Europe’s recovery and future resilience.
A further important element for successful implementation is related to administrative capacity, the strategy is likely to be hindered by low institutional capacity precisely in those regions that need the most help. In many cases, insufficient attention is given to the investment to be made in human resources. The lack of skilled personnel represents a bottleneck for the strategy’s success (Sotarauta , 2018). The OECD report on Strengthening the Governance of EU funds under Cohesion Policy (2020) underlines that public administrations require human capital with the right skills not just for fulfilling
3 Commissioner Danuta Hübner has asked in 2009 Dr. Fabrizio Barca (Director General, Ministry of Eco nomy & Finance,
Italy) to prepare an independent report containing an assessment of the effectiveness of cohesion policy to date as well as a series of proposals how to reform cohesion policy for the period post 2013.
4 Sectors & activities targeted by the EU recovery plan: Strategic autonomy (From reducing excessive import depe nde ncy to diversifying global value chain and increasing EU supply capacity); Green Investment (From hydrogen to offshore renewable energy); Digital Communication (From 5G to Artific ial Intelligence); Education and long-life learning; Social
infrastructure investment (Addressing social needs; Health security and crisis preparedness).

7
audit and legal requirements but also for providing strategic inputs. The OECD recommends reinforc ing the organisation management and strategic planning capacities. A further important element for management is the ability to monitor and evaluate the strategy (Gianelle & Kleibrink, 2015; Kleibrink e t al, 2016).
The purpose of this report is to provide regional policymakers and stakeholders with an approach to help them adapt their Smart Specialisation Strategies on the basis of evidence from territorial analysis, previous experiences and future trends. This approach would assist them to better quantify realistic outcomes and determine financial and human resources needed to achieve the socio -economic objectives.
The following section (section 2) sets the basis of what can be a logic of intervention of a Smart Specialisation Strategy and introduces the rationale of the proposed result-oriented approach. Section 3 then provides a six-step approach to better link strategic decisions to results. The report concludes with some policy recommendations.

8
1 The logic of intervention in Smart Specialisation: lessons from 2014-
2020 and the way forward
1.1 Cases studies and a seminar to frame the approach
Based on the observation that Smart Specialisation is being sometimes partially implemented (Gianelle et al, 2019), a workshop co-organised by the Joint Research Centre and the European Association of Development Agencies (EURADA) was held in Brussels in December 2019 5.
Experts from various European regions6 discussed about indicators based on regional case studies 7. The meeting tackled operational aspects such as the collection of data, the alignment with results indicators of ERDF operational programmes, the comparison between different periods, the consistency between planned interventions, and coherence in the programmes’ design. The purpose of the case studies was to investigate how regions have translated the objectives of their respective Smart Specialisation Strategy into the ERDF Operational Programmes (OP) and what were the expected impacts. Some recurrent inconsistencies in the translation of the Smart Specialisation objectives and the choices and the quantification of the expected impacts were highlighted (see Box 1 Findings of case studies).
The result of the meeting led to a mutual understanding of how the indicators are operationalise and regions undertake the data collection and how to enhance both for future revisions. At the same time , the seminar was also an opportunity to consider the different approaches the regions are implementing for monitoring and evaluating the strategies. The changeover to a new programming and financial period implies a continuous revision of the priorities throughout the Smart Specialisation process orchestrated by sound and efficient governance.
Box 1 Findings of case studies
16 regional case studies were prepared to feed the discussion of the December 2019 workshop. The case studies consisted of an analysis investigating the relationship between the budget allocation by categories of intervention and the expected results in the 16 ERDF Operational programmes designed by the regions for the 2014-2020 programming period. The analysis has shown, in a significant number of cases, a weak correlation between the planned investment and the targeted results. It suggests that asymmetries and inconsistencies in the logic of intervention hamper the ability of Smart Specialisation Strategies to address policy objectives.
Out of 16 Regions covered by the analysis, the main findings were:
12 regions did not provide the number of start-ups to be supported, even though it is recognised that start-ups are a sign of a dynamic innovation ecosystem. Moreover, out of the 8 regions which have earmarked a budget for incubation, 4 of them did not estimate the number of start-ups that will be created.
Of the 14 regions that earmarked a budget to support investment in R+D+I infrastructure, 11 regions did not provide a number of new research jobs that will be created. ,
9 regions did not provide the number of jobs to be created although job creation is one of the main objectives of the Cohesion Policy.
7 regions did not provide the number of innovations created by firms when 14 have earmarked a budget for technology transfer organisations (TTO),
6 regions did not provide the number of innovations that will be introduced into the market when all of the 16 have allocated a budget to support R&I activities and/or innovation activities in SMEs.
Only 8 regions have earmarked a budget to support clusters. While several regions reported the creation of thousands of jobs and several hundreds of start-ups
5 http://www.eurada.org/smart-specialisation-workshop-for-the-upcoming-financial-period/ 6 The workshop gathered representatives from Bretagne, Wielkopolskie , North Holland, Flanders, Centre Val de Loire,
Valencia district, and Andalusia. 7 Flanders (BE), Niedersachsen, Sachsen-Anhalt (DE), Andalusia, Valencia, Basque country (ES) , Bretagne, Centre -Val de
Loire, Nord-Pas-de-Calais (FR), Emilia Romagna and Umbria (IT), North Netherland (NL), Wielkopolskie (PL), Alentejo
(PT), South Sweden (SE) and Scotland (UK).
9
for the ESIF 2007-2013 programming period they did not provide any figures for the 2014-2020 In terms of comparison with international practices and standards, it also appears that expected
results when they exist are often low compared to the amounts allocated (e.g. average cost of start-up support, average public funding by job created).
The comparison between the expected results and the achievements of the last programming period 2007-2013 does not show a real consistency. In most of cases, an underestimation can be observed: the expectations for 2014-2020 are considerably lower than the results achieved for the previous programming period.
1.2 Deconstructing the Intervention logic to better revise the Smart Specialisation Strategy
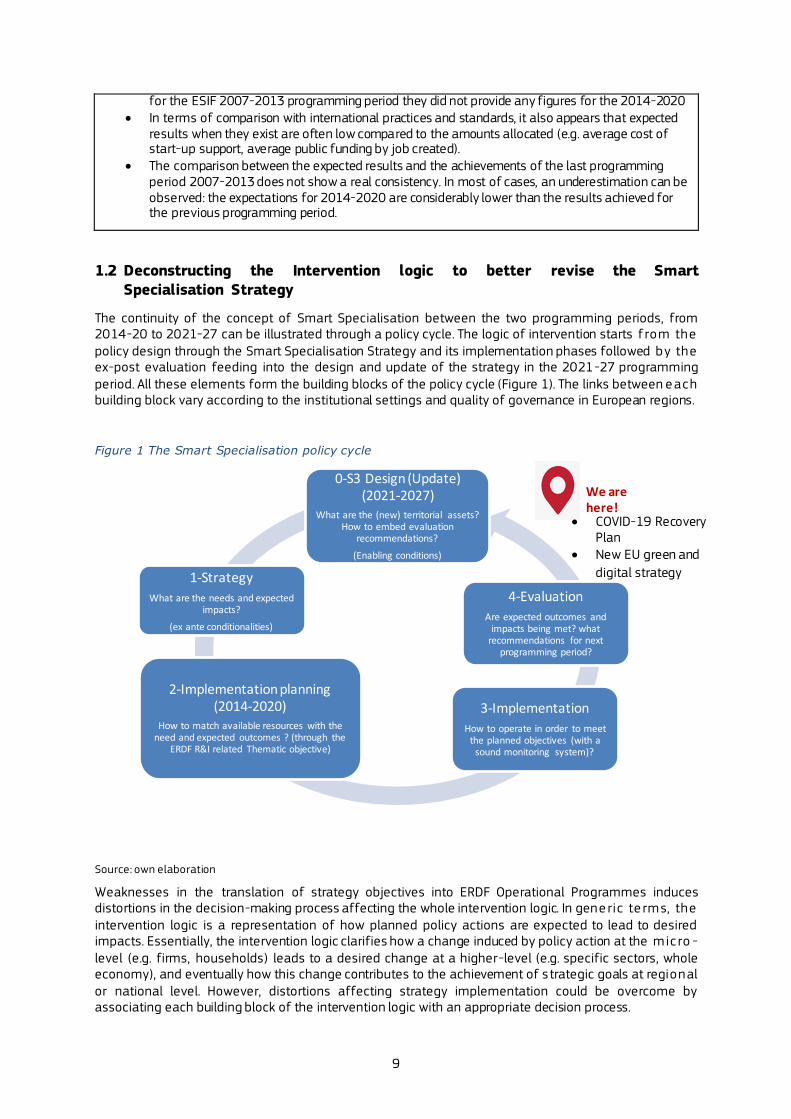
The continuity of the concept of Smart Specialisation between the two programming periods, from 2014-20 to 2021-27 can be illustrated through a policy cycle. The logic of intervention starts from the policy design through the Smart Specialisation Strategy and its implementation phases followed by the ex-post evaluation feeding into the design and update of the strategy in the 2021-27 programming period. All these elements form the building blocks of the policy cycle (Figure 1). The links between each building block vary according to the institutional settings and quality of governance in European regions.
Figure 1 The Smart Specialisation policy cycle
Source: own elaboration
Weaknesses in the translation of strategy objectives into ERDF Operational Programmes induces distortions in the decision-making process affecting the whole intervention logic. In gene ric te rms, the intervention logic is a representation of how planned policy actions are expected to lead to desired impacts. Essentially, the intervention logic clarifies how a change induced by policy action at the mic ro -level (e.g. firms, households) leads to a desired change at a higher-level (e.g. specific sectors, whole economy), and eventually how this change contributes to the achievement of s trategic goals at regional or national level. However, distortions affecting strategy implementation could be overcome by associating each building block of the intervention logic with an appropriate decision process.
0-S3 Design (Update) (2021-2027)
What are the (new) territorial assets? How to embed evaluation
recommendations?
(Enabling conditions)
4-Evaluation
Are expected outcomes and impacts being met? what
recommendations for next programming period?
3-Implementation
How to operate in order to meet the planned objectives (with a
sound monitoring system)?
2-Implementation planning (2014-2020)
How to match available resources with the need and expected outcomes ? (through the
ERDF R&I related Thematic objective)
1-Strategy
What are the needs and expected impacts?
(ex ante conditionalities)
We are here!
COVID-19 Recovery Plan
New EU green and
digital strategy

10
A decision process is the way policymakers inform and implement decisions related to Smart Specialisation Strategy. Such associations would provide policymakers, particularly those in charge of the design, with the guidance required to demonstrate that the place-based assets and capabilities meet the strategic aims. The strategic decisions resulting from this approach should be less contestable because they are based on two inherent bottom-up components:
the place-based assets; and
the needs of the stakeholders to invest in innovation activities.
The new EU policy agenda considering also the Covid-19 recovery plan should strongly influence the S3 strategy design. By definition, the strategy should be first closely linked to the ERDF operational programme including the distribution of funding into specific intervention fields with the quant if ication of target indicators.
Bridging these components requires alignment between EU regulations and the objectives of the regional and national authorities. The following figure (Figure 2) shows the logic paths between the rationale of the strategy, its main objectives, the main activities to be funded through ESIF, and the expected outcomes. The arrows between blocks suggest dependencies reflecting, in some way, the internal coherence of the intervention logic (an activity leads to specific results and outcomes and the converse). Figure 2 From S3 rationale to expected outcomes
Rethinking the logic of intervention for the next generation of strategies can contribute to ove rcoming the complexity arising from the number of stakeholders, the territorial assets and other various constraints linked to each regional context. The difficulty of designing or revising regional strategies lie s
Increasing Innovative entrepreneurs & entrepreneurship
Support to Incubation and incubators
New firms & Start-ups created
Enhancing capacities and capabilities of the regional innovation ecosystems
Re inforcing the collaboration between firms and research
Improving the R&D&I human capital
Creation of growth and jobs in enhancing the regional innovation ecosystem
Support for Research infrastructures & equipment in public organisations
Support to Research & innovation activities public organisations
Support to Innovation process
in SMEs
Support to Technological transfer (commercialisation of R&D results)
Support to Research & innovation activities in private organisations
Support to Clusters
Firms scaled -up through venture capital
Innovations
into the market
Firms’ productivity increase
New Jobs
created
Support for Research infrastructures & equipment in private organisations
New
researchers
S3 rationale S3 main objectives S3 main activities through OP
S3 expected
outcomes
Source: own elaboration

11
in the fact that it requires ‘cascade decisions’ involving a large number of stakeholders with several layers of policymakers (from the designers to implementers).
Any public policy intervention is designed through a range of actions such as assigning budget, decid ing on priorities, sources of funding and the support measures. In public policy evaluation theory, the coherence of a public intervention involves looking at how well or not different actions work togethe r. It may highlight components where there are synergies that improve the overall performance or, conversely, it may point out tensions between objectives and associated activities, which are potentia lly incoherent or inefficient.
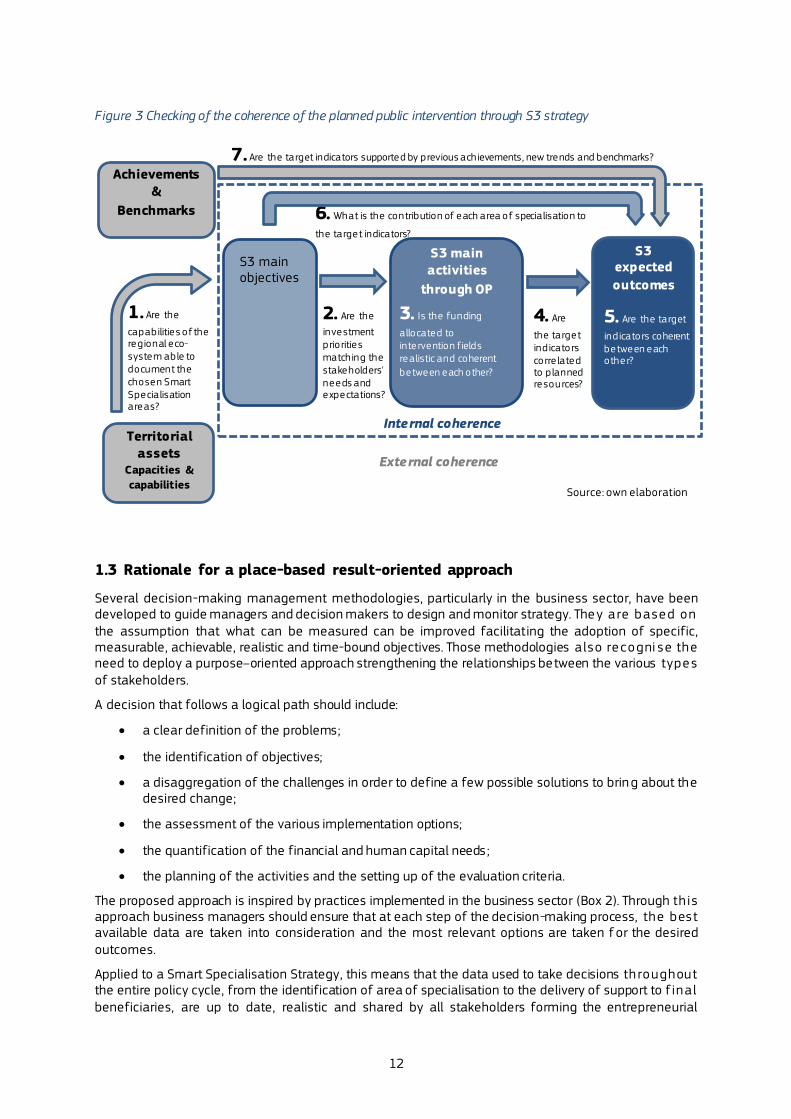
One can then further differentiate between the internal and external coherence of the logic of intervention. Assessing "internal" coherence requires a consideration of how the various components of the same intervention operate together to achieve its objectives. Coherence is also required in relation to other "external" components such as previous achievements or international benchmarking or be tween interventions within the same policy area. To appreciate the strengths of the intervention logic the following questions should be addressed:
1. Are the chosen Smart Specialisation areas related to the existing capabilities of the regional eco-system (external coherence)?
2. Do the investment priorities match stakeholders' needs and expectations (relevance)? 3. Is the funding allocated to intervention fields realistic and coherent between each other (internal
coherence)? 4. Are the target indicators coherent with the planned resources (internal coherence)? 5. Are the target indicators coherent between each other (internal coherence)? 6. What is the contribution of each area of specialisation to the target indicators (impact)? 7. Are the target indicators supported by previous achievements, new trends and benchmarking
(external coherence)?
As shown in Figure 3, all decisions taken to design the strategy and its implementation modalities should be well documented and coherent with other decisions. Regional stakeholders represented in the EDP should take an active part in the process (Gianelle et al, 2016).
This starts with a review of the territorial assets (Coherence Questions 1) followed by a survey of stakeholder needs, and their openness to collaborate (Coherence Question 2) .
Information collected is then used to draw a list of priority investments to be made in capacity build ing , human capital, knowledge and technological development and business exploitation of innovation (Coherence Question 3).
The expected outcomes should then be estimated according to the whole intervention and to the asse ts and planned investments (Coherence Question 4 and 5). Policymakers should then undertake a final assessment in order to verify the consistency between the expected results, the earmarked budge t, the human capital capacities and the objectives in each specialisation area (Coherence Question 6 and 7).
12
Figure 3 Checking of the coherence of the planned public intervention through S3 strategy
1.3 Rationale for a place-based result-oriented approach
Several decision-making management methodologies, particularly in the business sector, have been developed to guide managers and decision makers to design and monitor strategy. They are based on the assumption that what can be measured can be improved facilitating the adoption of specific, measurable, achievable, realistic and time-bound objectives. Those methodologies also recogni se the need to deploy a purpose–oriented approach strengthening the relationships between the various types of stakeholders.
A decision that follows a logical path should include:
a clear definition of the problems;
the identification of objectives;
a disaggregation of the challenges in order to define a few possible solutions to bring about the desired change;
the assessment of the various implementation options;
the quantification of the financial and human capital needs ;
the planning of the activities and the setting up of the evaluation criteria.
The proposed approach is inspired by practices implemented in the business sector (Box 2). Through th is approach business managers should ensure that at each step of the decision-making process, the best available data are taken into consideration and the most relevant options are taken f or the desired outcomes.
Applied to a Smart Specialisation Strategy, this means that the data used to take decisions throughout the entire policy cycle, from the identification of area of specialisation to the delivery of support to f inal beneficiaries, are up to date, realistic and shared by all stakeholders forming the entrepreneurial
S3 main objectives
S3 main activities
through OP
S3 expected
outcomes
Territorial assets
Capacities &
capabilities
Achievements &
Benchmarks
1. Are the
capabilities of the regional eco-system able to document the chosen Smart Specialisation areas?
2. Are the
investment priorities matching the stakeholders' needs and expectations?
3. Is the funding
allocated to intervention fields realistic and coherent
between each other?
4. Are
the target indicators corre lated to p lanned resources?
5. Are the target
indicators coherent between each other?
6. What is the contribution of each area of specialisation to
the target indicators?
7. Are the target indicators supported by previous achievements, new trends and benchmarks?
Source: own elaboration
Internal coherence
External coherence

13
discovery process (EDP) with the involvement of public authorities, business community, academia and civil society.
Box 2 Example of decision-making process in the private sector
An ‘assurance’ process that examines both individual smart-factory projects and a company’s ove rall digital journey helps ensure that all of the elements of project planning are well defined and able to deliver the desired outcomes. An assurance process also ensures that projects remain on budge t and on schedule. Moreover, it helps keep the focus on the key business outcomes of the transformation, in order to identify key risks throughout the project lifecycle.
Consisting of either scheduled “health check” evaluations or day-to-day monitoring, such assurance spots gaps and identifies concerns and provides corrective recommendations for the board , senior executives, the project sponsor, and the manufacturing, logistics, and supply chain leaders who typically drive Industry 4.0 initiatives. As a project matures, regular evaluations keep abreast of both new and old issues to help make sure of positive outcomes across four baseline areas of risk: strategic, delivery, business, and technology.
Source: Industry 4.0: Gaining Confidence over Digital Transformations ©2018 PwC8
8 http ://usblogs.pwc.com/industrialinsights/2018/05/03/industry-4-0-gaining-confidence-over-digital-transformations/

14
2 Approach for a place-based and more result-oriented strategy
This section provides the main elements of an approach for the design of a more result-oriented Smart Specialisation Strategy. The aim is also to ensure as far as possible that all the decisions taken by policymakers and managing authorities match the ESIF implementation modalities and policy objectives. This should not require much additional administrative effort as information regarding territorial asse ts should only need updating from what have been already collected in the context of the first ve rs ion of the strategy. However, the approach outlined in this report should not be seen as prescriptive guidance. It is intended to inspire policymakers to develop rigorous evidence-based approach for strategy de sign , implementation and evaluation.
The approach follows a six-step process (Figure 4) : (1) the identification and collection of stakeholders´ needs; (2) the operationalisation (the implementation planning) of the strategy; (3) the identification and estimation of target indicators; (4) strategy implementation through funding and financing instruments ; (5) the strategy resource allocation; and (6) a final consistency check to validate the overall strategy. Each step of the process starts by utilising the information gleaned from the previous one and concludes with the decision-making. In more practical terms, each step generates tables that are in te rlinked and provides evidence to support policy makers’ decisions.
Figure 4 Synopsis of the place-based result-oriented approach
Prior to the first step, an assessment of territorial assets and a pre-identification of specialisation areas are conducted. This should logically utilise updated information from the previous Smart Specia lisation Strategy, drawing upon the findings and conclusions of any evaluation and the new policy context ( i .e . the new EU Green and digital strategy and the COVID-19 recovery plan).
An updated assessment of territorial assets
The concept of Smart Specialisation is rooted in the utilisation of the assets and resources a te rritory can mobilise in order to address socio-economic challenges. The assessment of territorial capacities and capabilities is a precondition for any strategy design. An analysis of the territorial research and innovation capacities, existing infrastructures and equipment, and human capital are of crucial importance to establish the framework conditions. This assessment of the place-based assets a ims to ensure that regional stakeholders involved in the S3 Entrepreneurial Discovery Process (EDP) and regional intermediary bodies will implement or fully benefit from the strategy.
The review of each specialisation area that could be a unique competitive advantage to the territory should contain the following components to complete the assessment of territorial assets:
Step 1
Assessment of Stakeholders’ needs based on Regional competitive intelligence
Step 2
Strategy operationali-sation
Step 3
Target indicators estimation through Predictive analytics
Step 4
Strategy implementation and management
Step 5
Resource allocation through a reverse action plan
Step 6
Strategy consistency check and enabling condition

15
A complete portfolio of relevant companies An assessment of the capacity of the companies to face global competition and their position in
the global value chain, A mapping of public and private infrastructures and equipment, A qualitative assessment of the entrepreneurial spirit in the region (“would -be entrepreneurs”), An assessment of the capacity and capabilities of intermediary organisations to carry out the
implementation of the strategy, An assessment of stakeholders' ability (readiness) to use public and private support (e.g. in
combining different sources of public and private funding), An assessment of stakeholder’s ability to collaborate internationally with other organisations, An assessment of the capacity for technological transfer to the market (experiences in
commercialisation of research results and in absorption of new knowledge).
The pre-identified specialisation areas
The list of identified Smart Specialisation areas (Table 1) are the basis for the approach. Identified areas can come from the previous strategy or be identified a-posteriori. Table 1 should provide information on how the various elements of the regional economic fabric are taken into account in identifying objectives related to each S3 area. As originally defined, S3 areas should be identified as far as possible in te rms of market niches and cross-sectorial opportunities in order to maximise the unique competitive advantage of the region (Foray & Goenaga, 2013). The table proposes a breakdown of some basic indicators of the regional ecosystem for each area: the number of firms and research laboratories (from public research organisations and Universities), the number of employees, the main targe te d markets and cross-sectoral opportunities.
Table 1 Specialisation areas and their main characteristics
# of firms
# of research lab (PRO and universities)
Employment Main new markets
Main cross-sectoral opportunities
Traditional industry, including social economy Area x High-tech (Key enabling technologies) Area y Industry modernisation (industry 4.0, digitalisation, Green Economy, relocation of strategic production units, …) Area z
2.1 Step 1: Assessment of Stakeholders’ needs based on Regional Competitive
Intelligence
Regional competitive intelligence is defined as a benchmarking process carried out by po licy p lanne rs (designers) whereby firms, academic institutions and other stakeholders forming the regional ecosystem look beyond their boundaries as a way to learn and stimulate innovation (Huggins, 2010 ) . Th is step is based on the collection and analysis of data from multiple sources in order to understand the challenges faced by stakeholders forming the innovation eco-system and to identify the resources and means needed to overcome the identified challenges.
The compiling of stakeholders’ needs , particularly from companies, is the starting point of a result-oriented approach as it helps to present in detail the expectations, strengths and weaknesses of the innovation ecosystem. The objective is also to understand all types of needs expressed by organisations, from R&I infrastructures and equipment to skills development to allow a sound decision making process. Strategic decisions should be above all relevant and coherent with the assets of the region allowing the strategy to be based on a holistic set of place-based information.
Several qualitative and quantitative methods used to design the first generation of smart specialisation strategies (Griniece et al, 2017) can be reemployed (e.g. targeted surveys and questionnaires, and

16
personal or group interviews). The knowledge of the regional ecosystem by intermediary organ isations (clusters, professional or business associations etc.) is also of crucial importance to understand and collect the needs of private stakeholders.
For methodological purpose, we grouped stakeholders into three distinct categories used throughout the methodological process:
1- (IND) ‘Industry’ includes large companies, SMEs, Start-ups (incl. ‘would be’ entrepreneurs) , and social enterprises. These organisations should be the main final beneficiaries of the S3 strategy (Vezzani et al, 2017).
2- (REC & HES) Public research organisations & universities forms an important part of the ecosystem9 (Edwards et al., 2017). The relation with regional companies in provid ing them with complementary research activities and their infrastructures and equipment is important, in particular in relation to technological transfer towards enterprises or d ire c tly into the market with the creation of spin-offs.
3- (INT) Intermediaries include all other stakeholders in involved in the implementation of the Smart Specialisation process, including government and public administration. These organisations need to work in close cooperation in order to fully implement the strategy and create synergies.
The information to be collected from stakeholders is broken down into the seven following asset categories used throughout the methodological process:
i. (I&E) Infrastructures and Equipment: Based on existing assets, what are the future needs foreseen to achieve the objective set by each Smart Specialisation area? This question addressed to the three categories of stakeholders defined previously should be interpre ted accordingly.
ii. (R&I) Research and innovation activities: What are the foreseen research activities for each category of stakeholders? R&I activities should follow different objectives if possible aligned with specialisation areas as they should feed a business plan for companies, and a strategic research agenda for universities and research centres ideally supporting the ecosystem in the achievement of the objectives of the Smart Specialisation Strategy.
iii. (AM) Access to Market activities: What are the foreseen new products & service s to be introduced into the market and what assistance will be required (e.g. prototyping, pilot line , Intellectual property right support etc.)?
iv. (SM) Support Measures: What are estimated support measures helping to achieve Stakeholders’ and strategy objectives?
v. (SD) Skills Development: What are the anticipated skills development required to reach stakeholders’ objectives (Hazelkorn & Edwards, 2019; Paiva et al., 2020)?
vi. (F&F) Funding & Financing: What are the anticipated funding & financing needs in orde r to achieve stakeholders’ and S3 objectives (Doussineau et al, 2018)?
vii. (IC) Interregional/international Collaboration: Depending on the position in the value chain , what are the anticipated needs in terms of external collaboration to achieve stakeholde rs ’ and strategy objectives (Heygi et al., 2020; Rakhmatullin et al., 2020)?
The following table (Table 2) shows how information from regional stakeholders can be collated to inform evidence-based policy decisions and mobilise specific assets to support the strategy and to take advantage from emerging opportunities. As there is no uniform method for information collection, different methods can be used depending on the regional specificity.
9 These two categories of organisations can appear in a region as a merged entity (eg. France ) o r s eparated
(eg. Germany)

17
The objective of the compilation of stakeholders’ needs is to frame the public intervention and identify as early as possible inconsistencies and inefficiencies. The table aims to gather these needs within each asset category and stakeholder type in order to ensure that future investment and supporting measures will target the identified beneficiaries.
Table 2 Decision sheet: Stakeholders needs for the implementation and achievement for each specialisation area
Asset categories
I&E Infrastructur
es & equipment
R&I R&D+I
activities
AM Access to
market
activities
SM Support
measures
SD Skills
development
F&F Funding & financing
IC Interregional/
international collaboration
Sta
kehold
er
cate
gori
es
IND Start-ups SMEs Large firms Social enterprises
Needs in research infrastructure & equipment to implement p lanned R&I activities
Needs in R&I activities to implement business p lan
Identified needs in access to market activities (prototype, p ilot line ) to introduce new product & services on the market
Identified needs in specific support measures to achieve S3objectives
Identified needs in skills deve lopment and vocational education training
Identified needs in funding & financing support to achieve objectives
Identified needs in interregional or international collaboration to complement company’s objectives
RES & HES Research centres & Universities
Needs in research infrastructure & equipment to contribute to the implementation of the S3 strategy
Needs in R&I activities contributing to the implementation of S3 strategy
Needs in technological transfer activities (TTO)
Identified needs in specific support measures to contribute to the implementation of the S3 strategy
Identified needs in skills deve lopment and vocational education training
Identified needs in funding & financing support to achieve objectives
Identified needs in interregional or international collaboration to complement S3 objectives
INT Intermediaries
Needs in infrastructures and equipment to support ecosystem
Not re levant Identified needs to contribute to support access to market
Identified needs (to be implemented by intermediaries) to contribute to the achievement of S3 objectives
Identified needs in skills deve lopment and vocational education training
Identified needs in funding to contribute to the achievement of S3 objectives
Identified needs in interregional or international collaboration, exchange of good practices, networking (eg. Interreg project)
2.2 Step 2: Strategy operationalisation
The link between stakeholders’ needs and the public intervention requires undertaking a comprehensive review of the possibilities offered by the upcoming ESIF regulation. Policy objective 1 related to “a smarter Europe by promoting innovative and smart economic transformation” should include 23 intervention fields (European Commission, 2018, 375 final, Art 17(5))10.
The public intervention materialized by the ESIF investment fields aims to support organisations to transform ideas or research results into new products or services to be introduced on the market. To do so, organisations need access to modern infrastructures and equipment, tailored support se rvices and networks of knowledge holders.
At this stage, policymakers should carefully review the intervention fields and their complementarity. The
10 Please refer to the final version of the regulation when available

18
full range of intervention field need to be considered as vital points in the construction of the strategy intervention logic. The review of the relevance and effectiveness of each field should be implemented in order to avoid duplication, and too generic policy interventions.
Areas where insufficient resources have resulted in weak impact and excessive admin istrative burden should also be taken into consideration. Particular attention should be given to the measures that a llow enterprises to test the technical and economic feasibility of the ir ideas.
In this respect, measures in the form of living-lab, fab-lab, prototyping, design, and demonstration in real working conditions are worth considering. Furthermore, the planned policy intervention should contribute to address some of the top down identified EU challenges in the EU Green Deal and New Industrial strategies. An identification of appropriate intervention fields, as defined in the ESIF regulation, linked with stakeholders’ needs related to the Smart Specialisation Strategy would avoid creating bottlenecks in the innovation ecosystem. Table 3 presents a way to align the proposed intervention fields and their purposes in each ‘asset’ category.
Table 3 Decision sheet: Strategy operationalisation through intervention fields Purpose of public
intervention
Intervention fields as listed in the CPR (Annex 1 of COM(2018)
375)
Ass
et
Cate
gori
es
I&E Infrastructures &
equipment
Buildings, laboratories, fab labs, prototyping and testing equipment and other investment in fixed assets
001-002-003 Investment in fixed assets directly linked to research and innovation activities, 014 Business infrastructure for SMEs (including industrial parks and sites)
R&I R&I activities
Industrial research, collaborative projects, experimental development, feasibility studies, prizes, proof of concept, investment in intangible assets, networking, …
007-008-009 Research and innovation activities including networking (industrial research, experimental development, feasibility studies), 022-023 Research and innovation processes, technology transfer and cooperation between enterprises
AM Access to market
activities
Market validation, marketing, e -commerce , living labs, demand driven innovation, innovation procurement, …
010 Digitizing SMEs (including e -Commerce, e -Business and networked business processes, digital innovation hubs, living labs, web entrepreneurs and ICT start-ups, B2B), 017 Advanced support services for SMEs and groups of SMEs (including management, marketing and design services), 020 Innovation processes in SMEs (process, organisational, marketing, co -creation, user and demand driven innovation), 021 Technology transfer and cooperation between enterprises, research centres and higher education sector, ), 022 023 Research and innovation processes, technology transfer and cooperation between enterprises
SM Support measures
Digitalisation, greening, industry 4.0, clusters, cooperation between SMEs and RES &HES design, IPR valorisation, technology transfer, innovation vouchers, circular economy,
004-005-006 Investment in intangible assets directly linked to research and innovation activities, 011 Government ICT solutions, e-services, applications, 014 Business infrastructure for SMEs (including industrial parks and sites) 016 Skills development for Smart Specialisation, industrial transition and entrepreneurship , 017 Advanced support services for SMEs and groups of SMEs (including management, marketing and design services), 018 Incubation, support to sp in offs and spin outs and start-ups, 019 Innovation cluster support and business networks primarily benefiting SMEs, 020 Innovation processes in SMEs (process, organisational, marketing, co -creation, user and demand driven innovation)
SD Skills development
VET, PHD outplacement, … 004-005-006 Investment in intangible assets directly linked to research and innovation activities, 012 IT services and applications for digital skills and digital inclusion, 016 Skills development for Smart Specialisation, industrial transition and entrepreneurship,
F&F Funding & financing
Grants, loans, guarantees, prize , business angels co-investment fund, seed capital, venture capital, crowdfunding co-investment fund, …
01 Grant, 02 Support through financial instruments: equity or quasi-equity, 03 Support through financial instruments: loan, 04 Support through financial instruments: guarantee, 05 Support through financial instruments: ancillary support, 06 Prize (See Table 2 of annex 1)
IC Interregional/
international collaboration
Brokerage events at National, EU, Non-EU level
010 Digitizing SMEs (including e -Commerce, e -Business and networked business processes, digital innovation hubs, living labs, web entrepreneurs and ICT start-ups, B2B), 015 SME business development and internationalisation

19
2.3 Step 3: Target indicators estimation through Predictive analytics
Taking into account the identification of intervention fields for each asset category (step 2), policymakers should be now in the position to quantify the expected results showing the re levance of their choices. To do so, the relevance of the target indicators is based on benchmarks, trends and foresight studies and also the taking into account past achievements. The quantification of the targe t indicators needs to be realistic but also ambitious, reflecting the chosen S3 areas. The S3 areas should turn competitive advantages into significant socio-economic impacts. To carry out this step, it is suggested to take inspiration from a ‘predictive analytics management’ methodology. Predictive analytics is a practice implemented in the business sector for extracting information from existing data sets (what has been done in the past) in order to determine patterns and predict future outcomes and trends. Predictive analytics do not determine what will happen in the future but it forecasts what might happen. In the context of policy design, the objective is to feed the process with realistic and cohe rent target indicators. It means expected outcomes should be “linked” to multiple dimensions such as:
Temporal coherence: the past: expected outcomes or results should correspond to what has been delivered in
previous programming periods; the present: expected outcomes or results should be realistic considering the territorial assets; the future: expected outcomes or results should be correlated with the intensity of the public
intervention
Structural coherence: Internally: expected outcomes or results should be coherent between themselves. Indicators are
path dependent and should observe an overall coherence (e .g. the creation of jobs depend to a certain extent on the creation of start-ups which are dependent on investment in incubators)
Externally (with the “outside” ): expected outcomes or results should be coherent with European or International averages (e.g. the average cost of the creation of a Start-up)
This step leads to an estimation of result-oriented expected outcomes. The exercise requires information regarding private sector dynamics and a methodology to quantify the outcomes. A way to p resent the outcomes is suggested by the following table.
Table 4 Decision sheet: Target indicators for each specialisation area identified
Asset categories I&E
Infrastructures &
equipment
R&I R&D+I
activities
AM Access to
market
activities
SM Support
measures
SD Skills
development
F&F Funding & financing
IC Interregional/ international collaboration
Sta
kehold
er
cate
gori
es
IND Start-ups SMEs Large firms Social enterprises
# of firms investing in new research facilities and/or equipment
# of firms involved in new R&I activities
# of new products or services re lated to S3 areas # Prototypes, p ilot lines
# of firms supported# of start- up supported
# of firms (or start up) hiring new R&I staff
# of firms (or start up) supported
# of transnational projects
RES &
HES Research centres & Universities
# of organisations investing in new infrastructures or equipment
# of firms involved in new applied or collaborative R&I projects
# of sp in off created to exploit a research result re lated to one of the se lected S3 areas
# of proof of concept projects, licensing agreement signed and spin-off supported
# of new researcher jobs created
# of R&I financial engineering supports captured
# of transnational projects
INT Intermediary organisations
# of organisations investing in new infrastructures or equipment
# of firms put in contact with RES & HES
# of firms advised
# of firms advised
# of firms advised
# of firms advised
# of firms introduced to fore ign partners

20
The following table shows a list of implementation and results indicators according to the stakeholder categories. For each indicator a unit of measurement should be identified. The breakdown of ind icators by stakeholder category is flexible and depends on the territorial context.
Table 5 Quantification of implementation and result indicators for each specialisation area identified
List of implementation indicators (indicators
coming from previous table)
Quantification in # units
List of results
indicators
(indicators coming from
previous table)
Quantification in # units
Sta
kehold
er
cate
gori
es
IND Start-ups
SMEs Large firms
Social enterprises
Stakeholders involved in R&D+I projects
Firms using consultant to manage their innovation process through voucher schemes
Firms rece iving grants Start-ups supported by Business angels funding
Firms rece iving seed capital
Firms rece iving venture capital Would be entrepreneurs launching crowdfunding
campaign
Firms introduced to a regional/national research institutions
Firms introduce to a foreign research institutions
Firms involved in proof of concept, living labs, prototyping and demo activities
SMEs supported to develop for the first time an innovation plan
New researchers
jobs
Transregional cooperation projects
Licensing agreements
SMEs- HEI applied collaborative projects
Innovation into markets
Innovation in firms
Firms investing in ICT based manufacturing systems
Firms investing in e-commerce
Researchers with improved infrastructure
Fore ign student attracted/retained
All firms advised
Start-ups created
Jobs created
Transregional cooperation projects
RES & HES
Research centres & Universities
Researchers receiving proof of concept repayable loans
Stakeholders investing in R&D infrastructure
Firms supported to do a technology transfer project
PHD students p laced in SMEs
INT Intermediary organisations
Start-ups supported by an incubator/acce lerator Firms jo ining a cluster
Training centres offering new vocational courses
2.4 Step 4: Strategy implementation and management
Implementation through funding and financing instruments
The implementation of Smart Specialisation Strategy occurs through a number of different support instruments comprising different scopes, rules and legal frameworks. One of the first challenges for policy makers and stakeholders involved in support to R&I is to have a full picture of all existing instruments available complementing ESIF (funding and financing instruments). Strategic syne rg ies , in terms of broader policy settings, should help to better tackle bottlenecks and thus foster business involvement in the innovation ecosystem. By promoting funding and financing synergies, the purpose is to move from an opportunistic approach to the combination of EU funding schemes to the c reation of real policy synergies through a better planning of the potential resource (Doussineau et al, 2018).
This step aims to identify the resources available to implement the strategy. Each area of specialisation should be supported by the most suitable ESIF intervention fields and complemented by other re levant sources of funding regardless of its sponsor (e.g. Horizon Europe and national funding).
Table 6 provides for each of the asset categories, an overview of the available funding sources: private , EU, national and regional. This step helps to identify if the different parts of the strategy will be elig ib le for one or more funding schemes.
Inte
rventio
n

21
Table 6 Decision sheet: funding sources overview and possible synergies for each specialisation area identified Asset categories
I&E Infrastructur
es &
equipment
R&I R&D+I
activities
AM Access to
market
activities
SM Support
measures
SD Skills
development
F&F Funding &
financing
IC Interregional/
international
collaboration
Sta
kehold
er
cate
gori
es
IND Start-ups SMEs Large firms Social enterprises
ESIF re levant intervention fie lds (with Horizon Europe, national funding and others)
ESIF re levant intervention fie lds (with Horizon Europe, national funding and others)
ESIF re levant intervention fie lds (with Horizon Europe, national funding and others)
ESIF re levant intervention fie lds (with Horizon Europe, national funding and others)
ESIF re levant intervention fie lds (with Horizon Europe, national funding and others)
ESIF re levant intervention fie lds (with Horizon Europe, national funding and others)
ESIF re levant intervention fie lds (with Horizon Europe, national funding and others)
RES &
HES Research centres & Universities
ESIF re levant intervention fie lds (with Horizon Europe, national funding and others)
ESIF re levant intervention fie lds (with Horizon Europe, national funding and others)
ESIF re levant intervention fie lds (with Horizon Europe, national funding and others)
ESIF re levant intervention fie lds (with Horizon Europe, national funding and others)
ESIF re levant intervention fie lds (with Horizon Europe, national funding and others)
ESIF re levant intervention fie lds (with Horizon Europe, national funding and others)
ESIF re levant intervention fie lds (with Horizon Europe, national funding and others)
INT Intermediary organisations
ESIF re levant intervention fie lds (with Horizon Europe, national funding and others)
ESIF re levant intervention fie lds (with Horizon Europe, national funding and others)
ESIF re levant intervention fie lds (with Horizon Europe, national funding and others)
ESIF re levant intervention fie lds (with Horizon Europe, national funding and others)
ESIF re levant intervention fie lds (with Horizon Europe, national funding and others)
ESIF re levant intervention fie lds (with Horizon Europe, national funding and others)
ESIF re levant intervention fie lds (with Horizon Europe, national funding and others)
Ex-ante assessment of the S3 implementation resource requirements
The planning of human capacities and skills to implement the strategy should not be underestimated . It is indeed critical to ensure that the human capacities and accountabilities required to enable the implementation of a strategy are available and identified. It contributes to avoiding implementation being done ‘in silo’ and in a non-transparent way.
It is also good practice to quantify as early as possible the necessary costs related to the implementation of the strategy (e.g. the costs related to the launch of calls, the monitoring and evaluation of projects etc.).
Table 7 shows how management activities can be split according to the implementation requirements with the identification of a body (people or organisation) to be in charge and the necessary skills.

22
Table 7 Decision sheet: Management of the implementation Activities
Organisation/entity in charge
Skills needed
Ass
et
cate
gori
es
I&E Infrastructures & equipment
R&I infrastructure/equipment for public centres
R&I infrastructure for private centres
R&I infrastructure for firms
R&I R&D+I activities
R&I activities in public centres
R&I activities in private centres
R&I activities in firms
AM Access to market activities
Business infrastructure for SMEs
Incubation/acce leration
TTO
SM Support measures
Advanced support services
Innovation process
Clusters
Support to industrial transformation, digitalisation a nd greening
F&F Funding & financing
Management of grants schemes
Management of non-grant financial instruments
IC Interregional/ international
collaboration
Management of transnational partnership Brokerage event
2.5 Step 5: Resource allocation through a reverse action plan
This step focuses on the allocation of resources based on the territorial needs to ensure that genuine requirements of the territory are funded in order to generate impacts. Based on the identification of stakeholders’ needs (step 1) and the related intervention fields (Step 2 and 4) and the expected results (Step 3), the philosophy of this step is to look ‘backwards’ in undertaking a collective self -assessment exercise regarding the strategy effectiveness. This will be done by answering the following five questions:
1) Do the choices really address the policy objectives? 2) Did all stakeholders share their knowledge and expectations during the selection of the areas of
specialisation and in the entrepreneurial discovery process? 3) Are the expected impacts realistic and more ambitious than those in the past? 4) Are the resources appropriate? 5) Are the outcomes providing a good socio-economic return and value for money?
The reverse action plan examines the coherence between each target indicator and the dedicated financial resources through the past and the planned average cost. Such cohe rence could depend on external factors (e.g. Covid-19 crisis affecting the economy) but should in any case be justifiable. Such a decision-making methodology helps policymakers understand the types and volume of resources that are needed to reach the expected objectives.
Furthermore, this step supports the allocation of resources to implement the strategy according to what has been done in terms of budget breakdown and result indicators in the 2014-2020 period. Policymakers and stakeholders should use this step to explain the eventual shift introduced in the quantification of the expected results and budget appropriations. Adaptations may be necessary to reflect different priorities, a new policy agenda, new realities and constraints. It can be also the opportunity to review the contribution of other funding sources and avoid too strong a dependence on a unique funding source. Table 8 proposes a way to verify whether the resources are proportionate to the expected results.

23
Table 8 ESIF resource allocation for each target indicator (for each specialisation area identified)
Implementation indicators
2014-2020 2021-2027 (indicators
coming from Table 5)
Number
Past
period (in
units)
Past
budget volume
(in
000€)
average
costs
since 2014
Number
(in
units)
Budget
volume
(in 000€)
Planned
average
cost
Sta
kehold
er
cate
gori
es
IND Start-ups
SMEs Large firms
Social enterprises
Stakeholders involved in R&D+I projects
Firms using consultant to manage the ir innovation process through voucher schemes
Firms rece iving grants
Start-ups supported by Business angels funding
Firms rece iving seed capital
Firms rece iving venture capital
Would be entrepreneurs launching crowdfunding campaign
Firms introduced to a regional/national research institutions
Firms introduce to a foreign resea rch institutions
Firms involved in proof of concept, living labs, prototyping and demo activities
SMEs supported to dev e lop f o r th e first time an innovation p lan
RES & HES
Research centres & Universities
Researchers rece iving proof of concept repayable loans
Stakeholders investing in R&D infrastructure
Firms supported to do a te chnolo gy transfer project
PHD students p laced in SMEs
INT Intermediary organisations
Start-ups supported by an incubator/acce lerator
Firms jo ining a cluster
Training centres offering new vocational courses
2.6 Step 6: Strategy consistency check and enabling condition
Final consistency check
This final step of the process providing the confirmation that the Strategy through the imp lementation of the place-based result-oriented approach is coherent. It aims to demonstrate through a set of ratios that all decisions taken are well balanced and that the strategy outcomes can meet the policy objectives and stakeholders' expectations. This step leads to take a Go, or Reassess decision:
Go decision: The results indicators are ambitious and realistic and each area of specialisation is contributing to a realistic share of the expected strategy results.
Reassess decision: The result indicators are low or too strongly dependent on a few areas of specialisation. Policy makers are invited to reassess the logic.

24
Table 9 Smart Specialisation areas consistency check # of
innovations
introduced into the markets
and % of the
total
# of innovations
new to firms and % of the
total
# of start-ups created
and % of the total
# of firms put in contact
with RES &HES and %
of the total
Final decision S3
are
as
S3 area x # (%) # (%) # (%) # (%)
1.GO: indicators are in line with an ambitious Strategy 2.STOP: indicators are not ambitious enough, the value for money is too weak →REASSESSMENT of the indicators
S3 area y # (%) # (%) # (%) # (%)
1.GO: indicators are in line with an ambitious Strategy 2.STOP: indicators are not ambitious enough, the value for money is too weak →REASSESSMENT of the indicators
S3 area z # (%) # (%) # (%) # (%)
1.GO: indicators are in line with an ambitious Strategy 2.STOP: indicators are not ambitious enough, the value for money is too weak →REASSESSMENT of the indicators
Total Total (100%) Total (100%) Total (100%) Total (100%)
Addressing the enabling condition on good governance of Smart Specialisation Strategy
In the proposed 2021-2027 common provision regulation, within the policy objective 1 “A smarter Europe” , the enabling condition11 targeting the next generation of strategies focuses on “Good governance of national and regional Smart Specialisation Strategy” (European Commission, 2018, 375, annex IV)12. The enabling condition contains the seven following fulfilment criteria . The fo llowing table shows how the approach can contribute to address the criteria in providing evidence. The criterion should be fulfilled if enough evidence is shown and conversely in the case of insufficient evidence a reassessment could be necessary.
Table 10 Compliance with the seven criteria of the Smart Specialisation enabling condition
Fulfilment criteria for the enabling condition
Step identification
(Which steps are providing evidence that the
enabling condition is addressed)
1-Up-to-date analysis of bottlenecks for innovation diffusion,
including digitalisation
Step 1: Assessment of Stakeholders’ needs
Step 3: Target indicators estimation Step 5: Resource allocation
2-Existence of competent regional/national institution or body,
responsible for the management of the Smart Specialisation Strategy
Step 4: Strategy implementation and management
3-Monitoring and evaluation tools to measure performance
towards the objectives of the strategy
Step 3: Target indicators estimation
Step 4: Strategy implementation and management
4-Effective functioning of entrepreneurial discovery process Step 1: Assessment of Stakeholders’ needs Step 4: Strategy implementation and management
5-Actions necessary to improve national or regional research and innovation systems
Step 1: Assessment of Stakeholders’ needs Step 2: Strategy operationalisation Step 4: Strategy implementation and management
6-Actions to manage industrial transition Step 1: Assessment of Stakeholders’ needs Step 2: Strategy operationalisation Step 4: Strategy implementation and management
7-Measures for international collaboration Step 1: Assessment of Stakeholders’ needs Step 2: Strategy operationalisation Step 4: Strategy implementation and management
11 Thematic enabling conditions applicable to ERDF, ESF+ and the Cohesion Fund – Article 11 (European Commission,
2018, 375, annex IV) 12 P lease refer to the final version of the regulation when available

25
Conclusion
Although the Covid-19 crisis will have major impacts on the socio-economic environment of European regions, the various goals of the EU and national recovery plans should mean that regions can continue their efforts to strengthen R&I activities. It is worth remembering that the past crises always p rovided new market opportunities for the most innovative stakeholders and early innovation adopters.
The ambition of the European Commission with a new round of Cohesion Policy, combined with a new industrial strategy towards a green and digital transition, increases the importance of ambitious and relevant S3 Strategies. An effective Smart Specialisation Strategy should result in the robust translation of specialisation priorities into projects addressing socio economic and environmental impacts. The other challenge lies in the creation of favourable conditions to scale -up project results allowing territorial ecosystems to grow and increase in competitiveness. Smart Specialisation Strategies, if we ll des igned , fuelled with adequate resources and equipped with a suitable management should contribute to addressing the new European challenges.
The proposed approach, directly inspired by regional policy practitioners, members of the EURADA association13, is based on lessons learnt since 2014. It provides a useful instrument for all regional policy makers to quantify the means and the resources needed to enhance the capacities of their respective regional innovation ecosystem. The logical interactions between the various steps should foster a more ‘agile’ management of the S3, to adapt any part of the strategy eventually affected by unexpected circumstances (e.g. crisis, economic shock) generating discrepancies between actual achievements and expected outcomes.
13 www.eurada.org

26
References
Barca, F, (2009), An agenda for a reformed cohesion policy, A place-based approach to meeting European Union challenges and expectations, https://ec.europa.eu/regional_policy/archive/policy/future/barca_en.htm
Doussineau M.,Arregui-Pabollet E., Harrap N. and Merida F., (2018) Stairway to Excellence : Drawing funding and financing scenarios for effective implementation of Smart Specialisation Strategies, JRC Technical Reports JRC11270
Edwards J., Marinelli E., Arregui A., Kempton L., (2017) Higher Education for Smart Specialisation: Towards strategic partnerships for innovation S3 Policy Brief Series No. 23/2017, EUR 29023EN, doi:10.2760/37657
European Commission (2018) Annexes to the proposal for a regulation of the European Parliament and of the Council laying down common provisions on the European Regional Development Fund, the European Social Fund Plus, the Cohesion Fund, and the European Maritime and Fisheries Fund and financial rules for those and for the Asylum and Migration Fund, the Internal Security Fund and the Border Management and Visa Instrument, COM (2018) 375 final.
European Commission (2019) The European Green Deal, COM (2019) 640 final
European Commission (2020) A New Industrial Strategy for Europe, COM (2020) 102 final
European Commission (2020a) The EU budget powering the recovery plan for Europe, COM (2020) 442 final
European Commission (2020b) Europe's moment: Repair and Prepare for the Next Generation, COM (2020) 456 final
European Court of auditors (2019) Delivering performance in Cohesion-Briefing paper, Review No 08/2019
European Union, (2013) Regulation (EU) No 1303/2013 of the European Parliament and of the Council of 17 December 2013.Official Journal of the European Union L, 347, 320–469.
Foray, D., & Goenaga, X. (2013) The Goals of Smart Specialisation (S3 Policy Brief Series. 01/2013). European Commission, Joint Research Centre, Institute for Prospective Technological Studies, Spain
Gianelle C., Guzzo F., Mieszkowski K. (2019) Smart Specialisation: what gets lost in translation from concept to practice?, Regional Studies, DOI:10.1080/00343404.2019.160797
Gianelle, C., Kyriakou D., Cohen C. and Przeor M. (2016) Implementing Smart Specialisation: A Handbook, Brussels: European Commission, EUR 28053 EN, doi: 10.2791/53569
Gianelle C., Kleibrink, A. (2015) Monitoring Mechanisms for Smart Specialisation Strategies, S3 Policy Brief Series 13/2015, ISSN 1831-9408, JRC95458
Griniece E., Panori A., Kakderi C., Komninos A., Reid A. (2017) Methodologies for Smart Specialisation Strategies: a view across the EU regions. University-Industry Links: Coproducing Knowledge, Innovation & Growth, 31 Aug – 1 Sept 2017, Conference proceedings pp 321-331
Hazelkorn, E., and Edwards, J. (2019) Skills and Smart Specialisation: The role of Vocational Education and Training in Smart Specialisation Strategies, Luxembourg: Publications Office of the European Union
Hegyi, F.B., Borbely L., and Bekesi G. (2020) Leadership Impact on Motivation and Commitment in Interregional Collaboration. Pilot Cases of Thematic Smart Specialisation Partnerships. EUR 30152EN, Publications Office of the European Union, Luxembourg, 2020, ISBN 978-92-76-17505-6, doi: 10.2760/79420, JRC120217
Huggins R., (2010) Regional Competitive Intelligence: Benchmarking and Policy-making, Regional Studies, 44:5, 639-658
Kleibrink A., Gianelle C., Doussineau M. (2016): Monitoring innovation and territorial development in Europe: emergent strategic management, European Planning Studies, DOI: 10.1080/09654313.2016.1181717

27
McCann, P., Soete, L. (2020) Place-based innovation for sustainability. First report of the Expert Group on “Linking Smart Specialisation and mission-oriented policy for sustainable development” . JRC report
Mazzucato M., (2011) The entrepreneurial State, Demos, ISBN 978-1-906693-73-2
Mazzucato M., (2018) Mission-Oriented Research & Innovation in the European Union: A problem-solving approach to fuel innovation-led growth, Publications Office of the European Union, ISBN 978-92-79-79918-1
OECD (2020) Strengthening Governance of EU Funds under Cohesion Policy: Administrative Capacity Building Roadmaps,OECD Multi-level Governance Studies, OECD Publishing, Paris, https ://doi.org/10.1787/9b71c8d8-en
Paiva, T., Redford, D., and Edwards, J. (2020) Workshop Report on Vocational Excellence and Smart Specialisation, European Commission
Rakhmatullin R., Hegyi F.B., Ciampi Stancova K., Gomez J., and Mieszkowski K. (2020) Methodological Manual. Developing Thematic Interregional Partnerships for Smart Specialisation. A Practical Guide to Building and Managing Interregional Smart Specialisation Partnerships. EUR 30172 EN, Luxembourg: Publications Office of the European Union. ISBN 978 -92-76-17907-8, doi:10.2760/564759, JRC116630.
Sotarauta M. (2018) Smart specialization and place leadership: dreaming about shared visions, falling into policy traps?, Regional Studies, Regional Science, 5:1, 190-203, doi: 10.1080/21681376.2018.1480902
Vezzani A., Baccan M., Candu A., Castelli A., Dosso M., Gkotsis P. (2017) Smart Specialisation, seizing new industrial opportunities. JRC Technical Report, European Commission. EUR 28801 EN; doi:10.2760/485744

GETTING IN TOUCH WITH THE EU
In person
All over the European Union there are hundreds of Europe Direct information centres. You can find the address of the centre nearest you at: https://europa.eu/european-union/contact_en
On the phone or by email
Europe Direct is a service that answers your questions about the European Union. You can contact this service :
- by freephone: 00 800 6 7 8 9 10 11 (certain operators may charge for these calls),
- at the following standard number: +32 22999696, or
- by e lectronic mail via: https://europa.eu/european-union/contact_en
FINDING INFORMATION ABOUT THE EU
Online
Information about the European Union in all the official languages of the EU is available on the Europa website at: https://europa.eu/european-union/index_en
EU publications
You can download or order free and priced EU publications from EU Bookshop at: https://publications.europa.eu/en/publications. Multip le copies of free publications may be obtained by contacting Europe Direct or your local information centre (see
https://europa.eu/european-union/contact_en).

KJ-N
A-3
05
73
-EN
-N
doi:10 .2760/21167
IS BN 978-92-76-29138-1
![Adderley UJ, Holt IGScampusvirtual.farmacoterapia-sanidadmadrid.org/CURSOS/logic/Consejeria... · [Intervention Review] Topical agents and dressings for fungating wounds Una J Adderley](https://img.pdfslide.net/doc/110x75/5e8aa5d7a399d038d37bfad2/adderley-uj-holt-intervention-review-topical-agents-and-dressings-for-fungating.jpg)