Embed Size (px)
Citation preview
An Introduction to Computational
Macroeconomics
Anelí Bongers Universidad de Málaga, Spain
Trinidad Gómez Universidad de Málaga, Spain
José L. Torres Universidad de Málaga, Spain
Series in Economic Methodology
Copyright © 2019 Vernon Press, an imprint of Vernon Art and Science Inc, on behalf of the authors.
All rights reserved. No part of this publication may be reproduced, stored in a retrieval system, or transmitted in any form or by any means, electronic, mechanical, photocopying, recording, or otherwise, without the prior permission of Vernon Art and Science Inc.
www.vernonpress.com
In the Americas: Vernon Press 1000 N West Street, Suite 1200, Wilmington, Delaware 19801 United States
In the rest of the world: Vernon Press C/Sancti Espiritu 17, Malaga, 29006 Spain
Series in Economic Methodology
Library of Congress Control Number: 2019944475
ISBN: 978-1-62273-654-6
Book is also available in Spanish as Introducción a la Macroeconomía Computacional (Vernon
Press, 2019): 978-1-62273-600-3 [Hardback, US]; 978-84-17332-02-0 [Paperback, Spain Edition];
978-1-62273-811-3 [PDF, E-Book].
Product and company names mentioned in this work are the trademarks of their respective owners. While every care has been taken in preparing this work, neither the authors nor Vernon Art and Science Inc. may be held responsible for any loss or damage caused or alleged to be caused directly or indirectly by the information contained in it. Every effort has been made to trace all copyright holders, but if any have been inadvertently overlooked the publisher will be pleased to include any necessary credits in any subsequent reprint or edition. The accompanying files for this title can be downloaded here: https://vernonpress.com/book/714 Cover design by Vernon Press, using elements created by Starline / Freepik.

Table of Contents
Preface v
Part I: Basic Dynamic Systems 1
1. An introduction to computational dynamic systems 3
2. The dynamic IS-LM model 29
3. Exchange rate overshooting 51
Part II: Introduction to Macroeconomic Dynamic General Equilibrium 69
4. The consumption-saving optimal decision 71
5. The consumption-saving decision and the consumption-leisure decision 95
6. The government and the fiscal policy 115
7. The firm and the investment decision: The Tobin’s Q model 135
8. The basic dynamic general equilibrium model 163
Part III: Economic growth 195
9. The neoclassical model of exogenous growth 197
10. Ramsey's optimal growth model 215
Appendices 239
Appendix A: Some mathematical concepts 241
Appendix B: An example of a dynamic system in MATLAB 255
Appendix C: The arms race model in DYNARE 259
Appendix D: The dynamic IS-LM model in MATLAB 263
Appendix E: The dynamic IS-LM model in DYNARE 267
Appendix F: The overshooting model of the exchange rate in DYNARE 269
Appendix G: The consumption-saving decision in MATLAB 273
Appendix H: The Newton-type algorithm 277
Appendix I: The consumption-saving and consumption-leisure decision in MATLAB 281
Appendix J: The consumer problem with taxes in MATLAB 283
Appendix K: The Tobin Q model in DYNARE 287
Appendix L: The dynamic general equilibrium model in MATLAB 289
Appendix M: The dynamic general equilibrium model in DYNARE 293
Appendix N: Solution of the Dynamic Stochastic General Equilibrium (DSGE) model 295
Appendix O: The neoclassical growth model in MATLAB 303
Appendix P: Ramsey's model in DYNARE 305
Index 307
Preface
Dynamic General Equilibrium (DGE) models, either stochastic or deterministic,
have become a fundamental tool in current macroeconomic analysis. Modern
macroeconomic analysis is increasingly concerned with the construction,
calibration and/or estimation, and simulation of Dynamic Stochastic General
Equilibrium (DSGE) models. Notwithstanding the approach's important
shortcomings, DSGE models are now in common use everywhere, spreading
from academic research to Central Banks and other public and private economic
institutions. This typology of models, which are based on the micro-foundation
of the decisions taken by the different economic agents that are assumed to be
rational, constitutes the reference theoretical framework of current
macroeconomic analysis, and has two main characteristics. Firstly, these are
dynamic models incorporating forward-looking variables, i.e., future variables in
expected terms that are supposed to be determined in a context of rational
expectations. Secondly, they are models in which the determination of
macroeconomic variables is based on microeconomic analysis
(microfoundation) and in a general equilibrium environment. In parallel, there is
another typology of dynamic macroeconomic models, also in a context of
rational expectations, which are non-micro-based, but are in turn based on the
traditional IS-LM approach and the Phillips curve, or on more recent
developments that incorporate monetary policy rules and a micro-based
aggregate demand. Both types of models can be represented through a system of
dynamic equations, which is composed of a set of equations that can be
calculated numerically in a relatively simple way. However, apart from the greater
or lesser complexity of this type of dynamic models at a theoretical level, the
main problem that we find when teaching macroeconomics to undergraduate
students or for those who want to get into this branch of macroeconomic
modeling, is that they do not have an explicit solution, so they can only be solved
numerically or by resorting to graphical analysis, mainly through phase
diagrams, which is an important barrier to their incorporation into the teaching
of advanced macroeconomics at the undergraduate level. This dynamic
theoretical modeling approach makes the interrelation between current
macroeconomics and numerical computing tools very tight, thus making it
necessary to introduce a new approach that includes both elements in the
learning of macroeconomics. Even the teaching of non-micro-based, simple
dynamic models, requires the use of relatively complex analytical tools in order
to work with systems of difference equations or differential equations. In all these
cases, the usual strategy at introductory levels is to apply graphical analysis,
through the construction of the phase diagram, as a basic instrument for
vi Preface
carrying out macroeconomic analysis. However, even the use of the phase
diagram assumes a certain level of difficulty while also presenting a number of
limitations. All these elements result that the macroeconomic analysis scheme
that is used by the majority of economic authorities, from governments to
central banks, international organizations, and research centers, is not known by
economics graduates, which is very striking, as the teaching of macroeconomics
in universities at an undergraduate level is one step behind its use at academic
level and its practical application in the real world.
However, it is feasible to introduce dynamic macroeconomic models in a
relatively understandable way, as well as their numerical solution at a basic
level. In fact, the contents of this book are based on the idea of introducing a
new approach to the teaching of macroeconomics, which allows, through
techniques that are relatively easy to implement and comprehensible at
introductory levels, the numerical solution of these models and their use for
macroeconomic analysis. Although current macroeconomic analysis need
knowledge of some complex computer tools and mathematical techniques, in
practice, these models can be solved with simple computer software as it is
the case of a spreadsheet. A spreadsheet contains a set of tools that can be
used for the numerical solution of any type of dynamic macroeconomic
models. The proposed approach offers a new perspective for the teaching of
macroeconomics at an undergraduate level, since it allows the flexible use of
dynamic models for its application to macroeconomic analysis, being at the
same time an introduction to numerical solution methods. All this can be
done with accessible computational software that is easy to learn and is
already well known, at least to some degree, by undergraduate students. This
is the strategy pursued in this book.
As we have indicated previously, in general terms, we can distinguish two
types of models used in current macroeconomic analysis. Firstly, simple
dynamic models that do not have a microeconomic foundation, but that use
rational expectations. An example of these models is the overreaction or
overshooting of the exchange rate, or the IS-LM traditional Phillips Curve
model. Secondly, the models based on the so-called Dynamic General
Equilibrium model, both stochastic and deterministic, or Ramsey's optimal
growth model, which constitute the theoretical framework of reference used in
current macroeconomic analysis. These macroeconomic models do not have, in
general, a closed-form solution and, therefore, can only be solved using
numerical methods. This makes computational macroeconomics a key element
in current macroeconomic analysis and the introduction of a necessary change
in the way in which students are introduced to macroeconomic analysis.
The objective of this book is to make an introduction, at the most basic level,
to computational macroeconomics and to the resolution of micro-based

Preface vii
macroeconomic dynamic general equilibrium models. The fundamental idea is
to show that it is relatively achievable task to solve a dynamic macroeconomic
model, whether micro-based or not, using tools that are available to everyone,
without the need to learn computer programs and languages of a certain
complexity, which limit their practical application. This book includes a series of
computer exercises with alternative macroeconomic models, divided into three
parts: Basic Dynamic Models, Introduction to Dynamic General Equilibrium,
and Economic Growth. The objective is to solve different and simple models by
using numerical and computational methods. Computation in this context
means we will use a computer to solve these models and that their solution will
be done numerically. All the models that we study are solved and computed in a
deterministic environment, although their resolution in a stochastic
environment does not pose major problems since a spreadsheet contains tools
for the incorporation of random variables. However, we consider that the
deterministic environment is much more illustrative for learning purposes than
a stochastic environment, so we have not considered it relevant to introduce the
stochastic component in the studied models.
The first part of the book includes a series of numerical exercises using
simple linear dynamic models. In Chapter 1, an exercise of a general model,
not representing any specific macroeconomic model, is carried out, based on
a dynamical system composed of two difference equations. The objective of
this exercise is to introduce the fundamental concepts to be use next, as well
as to present the analytical framework to be use for the numerical solution of
these types of models. Next, in Chapter 2, we present a dynamic version of the
IS-LM model. The IS-LM model constitutes the basic theoretical framework
used in the teaching of macroeconomics at intermediate levels. The model
considered here is a dynamic version, where there is a process of adjustment
in the price level over time (the Phillips curve). To close this first part, Chapter
3 presents Dornbusch's overshooting model of the exchange rate. This is a
model for a small open economy that allows explaining the response of the
nominal exchange rate to different shocks.
The second part of the book is composed of five chapters. In Chapter 4, we
present the basic household problem in terms of the consumption-savings
decision. This analysis constitutes a fundamental piece in the dynamic
models of general equilibrium that are used in the current macroeconomic
analysis. Chapter 5 introduces the consumption-leisure decision in the
household problem, including leisure as an additional argument in the utility
function, from which the labor supply is derived. Chapter 6 analyzes the
consumption-savings decisions by households, but also considering the role
of the government, with the objective of studying how households’ decisions
change according to tax rates and social security contributions. Chapter 7

viii Preface
studies the investment decision through Tobin’s Q model. To close this second
part, Chapter 8 presents a very simple version of the dynamic general
equilibrium model.
The last part of the book focuses on the analysis of economic growth
models. We study two different models. First, in Chapter 9, we conduct a
numerical solution of Solow's exogenous growth model, which is the basic
framework for studying the long-term behavior of an economy. Finally, in
Chapter 10, we present Ramsey's optimal growth model. In this case, the
analysis is similar to the dynamic general equilibrium model presented above,
but considering population growth.
The software used in this book is Excel from Microsoft. Excel is a
spreadsheet, similar to others such as Open Office Calc. The advantages of
spreadsheets are that they are easy to handle, widely used and known by a
large number of users, while having a high capacity to perform a wide variety
of numerical operations. Barreto (2015) presents a series of arguments about
why Excel is an adequate tool for the teaching of macroeconomics, indicating
that spreadsheets have important advantages when communicating ideas
and presenting statistical data to students.1 In fact, spreadsheets are a
resource that is increasingly used in the teaching of economics, Strulik
(2004)2, and Gilbert and Oladi (2011)3 being examples. More recently, Barreto
(2016) proposes a set of spreadsheets for the teaching of macroeconomics at
introductory and intermediate levels4. Another macroeconomics manual with
simulations in Excel is that of Carlin and Soskice (2015)5. A book with different
examples of computational economy where other computer programs are
also used, apart from spreadsheets, is Kendrick, Mercado and Amman (2006).6
This book shows that the numerical solution of dynamic general equilibrium
models is a relatively simple task that can be done in a spreadsheet. Micro-
1 Barreto, H. (2015). Why Excel?, Journal of Economic Education, 46(3), 300-309.
2 Strulik, H. (2004). Solving Rational Expectations Models Using Excel, Journal of
Economic Education, 35(3): 269-283.
3 Gilbert, J. y Oladi, R. (2011). Excel Models for International Trade Theory and Policy:
An Online Resource, Journal of Economic Education, 42(1): 95.
4 Barreto, H. (2016). Teaching Macroeconomics with Microsoft Excel. Cambridge
University Press.
5 Carlin, W. y Soskice, D. (2015). Macroeconomics: Institutions, Instability, and the
Financial System. Oxford University Press.
6 Kendrick, D. M., Mercado, P. R. y Amman, H. M. (2006). Computational Economics.
Princeton University Press.

Preface ix
based macroeconomic models can be solved by following two alternative
approaches. First, they can be solved using Excel's Solver tool, which allows the
maximization of an objective function subject to certain restrictions. Secondly,
these models can be solved directly using a linear approximation to the non-
linear equations of the model in terms of the deviations from the steady state.
This allows us to calculate in a simple way the eigenvalues associated with the
system and use them to calculate numerically the readjustment in the forward-
looking variables facing a disturbance when the solution is a saddle-point, in a
similar way to the procedure that we would use for solving more traditional
non-micro-based dynamic models.
Finally, the book includes a series of appendices with some basic mathematical
concepts that are necessary for the performed analysis. These appendices also
include a series of computer code, where the different models are solved in both
MATLAB and DYNARE, which are computational tools commonly used in
current macroeconomic analysis. For those who want to use their smartphone or
tablet for the solution of stochastic dynamic general equilibrium models, see
Blake (2012).7
Anelí, Trinidad and José Luis
Málaga, December 2019
7 Blake, A. P. (2012). DSGE modeling on iPhone/iPad using SpaceTime. Computational
Economics, 40(4): 313-332.

Part I: Basic Dynamic Systems

1. An introduction to computational
dynamic systems
1.1. Introduction
Dynamic macroeconomic model can be written as a system of dynamic
equations: a system of differential equations if the model is defined in
continuous time or a system of difference equations if we define it in discrete
time. The used temporal approach depends on the type of analysis to be
carried out. At a theoretical level, it is usual to develop macroeconomic
models in continuous time, which allows the application of certain analytical
instruments, such as the phase diagram, in order to obtain a graphical
representation of the model to be used for shock analysis. However, if our
objective is the numerical resolution of the model, then the approach to be
used would be the discrete-time approach. In this case, the macroeconomic
model is defined as a system of difference equations. In any case, both
specifications are equivalent and lead to similar results, although the exact
specification of each equation may be different in both temporal contexts.
The set of equations that make up a model includes three elements:
endogenous variables (unknowns), exogenous variables and parameters.
Given some values for the parameters, which have to be calibrated or
estimated, and given some values for the exogenous variables, which are
supposed to be given, we can numerically calculate the corresponding value
of the endogenous variables. On the other hand, the numerical resolution
requires the use of specific functional forms that determine the relationship
between these elements, so it is necessary to have a specific functional form
for each equation.
In this first chapter, we carry out a simple computational exercise with the
aim of illustrating how a computer can be used to perform numerical
simulations of dynamical models. For this, we will use a relatively easy-to-use
tool widely known as a spreadsheet. In particular, we will use the Microsoft
Office Excel spreadsheet, although we could also use other similar
spreadsheets, such as Open Office Calc. In various appendices, we include
similar exercises but using other tools commonly used in macroeconomic
analysis, such as MATLAB, or based in a software designed specifically for the
resolution of dynamic macroeconomic models with rational expectations,
such as DYNARE. The fundamental idea of this first chapter is not to solve a
particular macroeconomic model but to show how to solve and numerically
4 Chapter 1
simulate a dynamic system in discrete time and show that it is a relatively
simple task.
Solving this type of dynamic systems numerically has important advantages
when carrying out different analyses to study the effects of different
disturbances on the economy. In the first place, it allows the obtaining of the
temporary paths of the endogenous variables in response to a shock, that is, it
allows one to know how each macroeconomic variable reacts to a disturbance
represented by a change in the exogenous variables. This is what is known as
impulse-response function or transition dynamics, an instrument widely used
in macroeconomic analysis. For that, it is enough to make a plot of the value of
each variable as a function of time to appreciate its dynamic behavior in
response to a change in the economic environment. Secondly, it allows one to
carry out sensitivity experiments, studying the behavior of the model according
to the value of the different parameters. Thus, once the model is solved and
computed numerically, it is only necessary to change the value of a parameter
to observe how the economy reacts, both in terms of its equilibrium and its
dynamics. This means that we can simulate the different trajectories of the
endogenous variables in response to a change in the exogenous variables,
conditioned to a given value of the parameters of the model.
In this first chapter, we numerically simulate Richardson's model of arms
race. This is a model composed of two linear difference equations that
represent the behavior over time of two countries, potentially enemies, and
their decisions on the stock of weapons of each of them in relation to the
stock of weapons of the other country. The choice of this particular model as
the starting point obeys several factors. First, it is a very popular model in
both political science and economics (used, for example, in microeconomics
to analyze the behavior of a duopoly in a dynamic context where the
endogenous variables are the market shares of the firms). Secondly, it is a
model with a very simple structure, so it is easy to understand. Finally, it is a
model in which, depending on the value of the parameters, we obtain the two
types of solutions we can obtain in a macroeconomic model: global stability
(when all trajectories bring us to equilibrium) or saddle point (when only a
few trajectories take us to the steady state, while the rest take us away from it).
In Section 2, we present a brief description of the difference equations as well
as the notation of the dynamic system that we will solve in discrete time. In
Section 3, we present an example of a dynamic system, and how to simulate it
numerically. Section 4 shows the numerical resolution of the dynamic system
in Excel, describing all the elements that must be entered in the spreadsheet
to obtain the numerical solution. Section 5 uses the previously constructed
spreadsheet to analyze the effects of a given disturbance, that is, a change in
the exogenous variables. Finally, in Section 6, a similar analysis is carried out
An introduction to computational dynamic systems 5
but in terms of a change in the value of the parameters. This is what is called
sensitivity analysis. In the particular case of the model that we are analyzing,
the sensitivity analysis has special relevance, since the system stability can
change from a solution with global stability to a saddle point solution.
1.2. A simple dynamic model
In general, we can write a macroeconomic model as a dynamic system that is
composed of a set of difference equations:
∆�� = �(��, ��) (1.1)
where �� is a vector of endogenous variables of dimension , �� is a vector of
exogenous variables of dimension �, and �(∙) is a particular mathematical
function. The symbol ∆ indicates variation with respect to time, such that:
∆�� = �� � − �� (1.2)
that is, the variation at the moment � is defined as the difference between the
value of the variable at the moment � + 1 and its value in the previous period, �.1 In this way, the value of the endogenous variables at the moment � is equal
to their value in the previous period plus their rate of variation during that
period, so we could define:
�� = ���� + ∆���� (1.3)
Expression (1.1) indicates that the variation with respect to the time of the
vector of endogenous variables is a function of the value of these endogenous
variables and the value of the exogenous variables. In this way, what this
system of equations indicates is how the endogenous variables move along
time as a function of the changes that occur in the exogenous variables.2
1 Another way also used to define the variations of the variables at the moment t is: ∆�� = �� − ���� The use of one specification or another depends on whether the value of the variable is
defined at the beginning of the period or at the end of it. Both specifications are not
equivalent, resulting in different results.
2 Alternatively, the system of equations can be written as: �� = �(��, ��) that is known as normal form (see Appendix A). However, to make the analysis
equivalent to the one carried out in continuous time, in which the equations are
specified in terms of the derivative with respect to the time of the endogenous variables,
which is the form usually adopted in macroeconomic analysis, we have opted to carry
out all the analyzes with the representation given by the specification (1.1).
6 Chapter 1
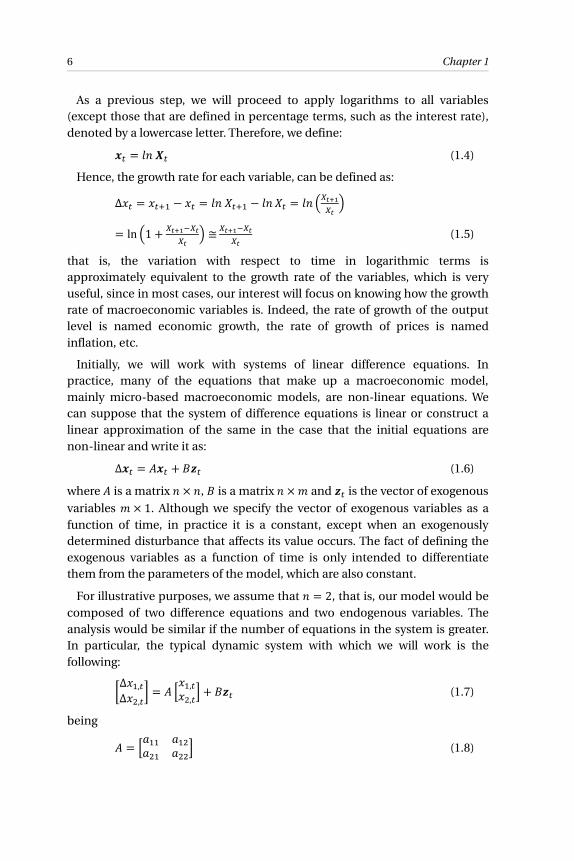
As a previous step, we will proceed to apply logarithms to all variables
(except those that are defined in percentage terms, such as the interest rate),
denoted by a lowercase letter. Therefore, we define:
�� = ��� (1.4)
Hence, the growth rate for each variable, can be defined as:
∆�� = �� � − �� = ��� � − � �� = � ������� �
= ln �1 + ��������� � ≅ ��������� (1.5)
that is, the variation with respect to time in logarithmic terms is
approximately equivalent to the growth rate of the variables, which is very
useful, since in most cases, our interest will focus on knowing how the growth
rate of macroeconomic variables is. Indeed, the rate of growth of the output
level is named economic growth, the rate of growth of prices is named
inflation, etc.
Initially, we will work with systems of linear difference equations. In
practice, many of the equations that make up a macroeconomic model,
mainly micro-based macroeconomic models, are non-linear equations. We
can suppose that the system of difference equations is linear or construct a
linear approximation of the same in the case that the initial equations are
non-linear and write it as:
∆�� = #�� + $%� (1.6)
where # is a matrix × , $ is a matrix × � and %� is the vector of exogenous
variables � × 1. Although we specify the vector of exogenous variables as a
function of time, in practice it is a constant, except when an exogenously
determined disturbance that affects its value occurs. The fact of defining the
exogenous variables as a function of time is only intended to differentiate
them from the parameters of the model, which are also constant.
For illustrative purposes, we assume that = 2, that is, our model would be
composed of two difference equations and two endogenous variables. The
analysis would be similar if the number of equations in the system is greater.
In particular, the typical dynamic system with which we will work is the
following:
(∆��,�∆�),�* = # +��,��),�, + $%� (1.7)
being
# = +-�� -�)-)� -)), (1.8)
An introduction to computational dynamic systems 7
and where the dimension of the matrix $ will depend on the number of
exogenous variables included in the vector %�.
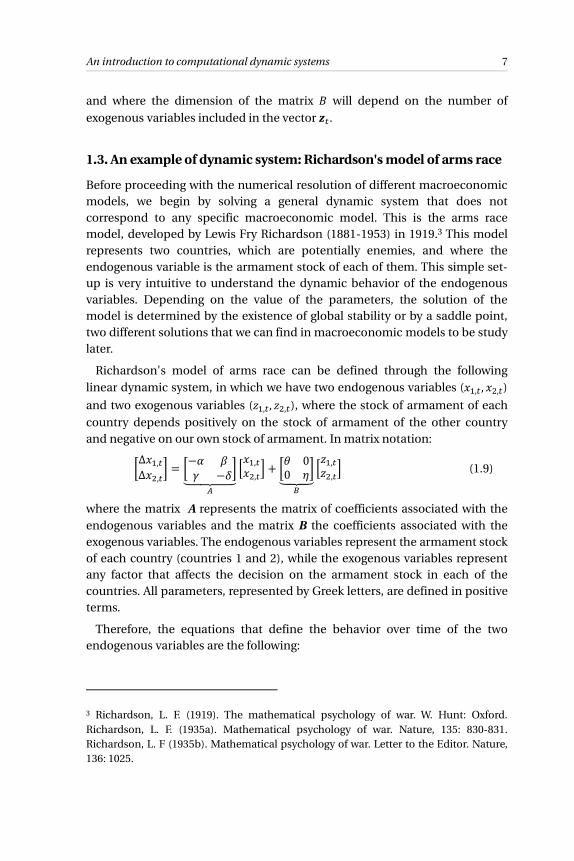
1.3. An example of dynamic system: Richardson's model of arms race
Before proceeding with the numerical resolution of different macroeconomic
models, we begin by solving a general dynamic system that does not
correspond to any specific macroeconomic model. This is the arms race
model, developed by Lewis Fry Richardson (1881-1953) in 1919.3 This model
represents two countries, which are potentially enemies, and where the
endogenous variable is the armament stock of each of them. This simple set-
up is very intuitive to understand the dynamic behavior of the endogenous
variables. Depending on the value of the parameters, the solution of the
model is determined by the existence of global stability or by a saddle point,
two different solutions that we can find in macroeconomic models to be study
later.
Richardson's model of arms race can be defined through the following
linear dynamic system, in which we have two endogenous variables (��,� , �),�) and two exogenous variables (.�,�, .),�), where the stock of armament of each
country depends positively on the stock of armament of the other country
and negative on our own stock of armament. In matrix notation:
(∆��,�∆�),�* = (−/ 01 −2*34454467+��,��),�, + (8 00 :*34546;
+.�,�.),�, (1.9)
where the matrix A represents the matrix of coefficients associated with the
endogenous variables and the matrix B the coefficients associated with the
exogenous variables. The endogenous variables represent the armament stock
of each country (countries 1 and 2), while the exogenous variables represent
any factor that affects the decision on the armament stock in each of the
countries. All parameters, represented by Greek letters, are defined in positive
terms.
Therefore, the equations that define the behavior over time of the two
endogenous variables are the following:
3 Richardson, L. F. (1919). The mathematical psychology of war. W. Hunt: Oxford.
Richardson, L. F. (1935a). Mathematical psychology of war. Nature, 135: 830-831.
Richardson, L. F (1935b). Mathematical psychology of war. Letter to the Editor. Nature,
136: 1025.
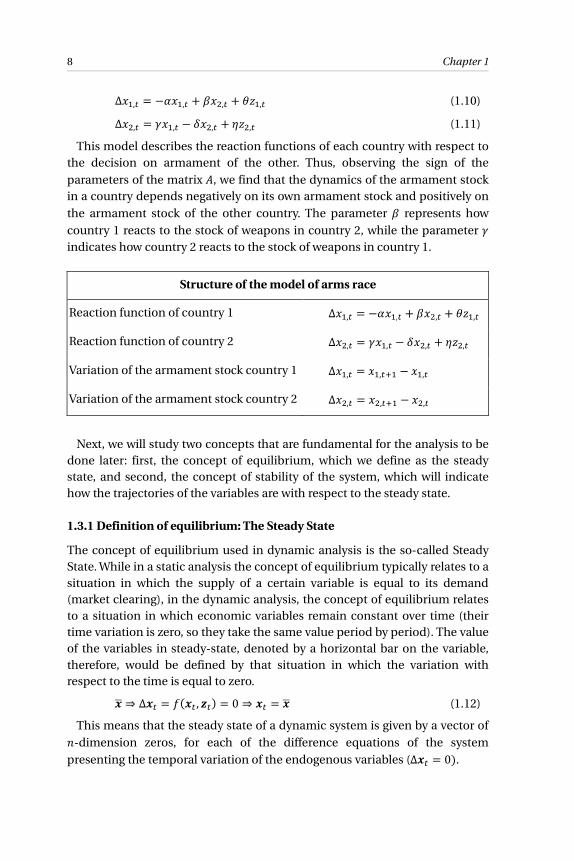
8 Chapter 1
Δ��,� = −/��,� + 0�),� + 8.�,� (1.10)
Δ�),� = 1��,� − 2�),� + :.),� (1.11)
This model describes the reaction functions of each country with respect to
the decision on armament of the other. Thus, observing the sign of the
parameters of the matrix #, we find that the dynamics of the armament stock
in a country depends negatively on its own armament stock and positively on
the armament stock of the other country. The parameter 0 represents how
country 1 reacts to the stock of weapons in country 2, while the parameter 1
indicates how country 2 reacts to the stock of weapons in country 1.
Structure of the model of arms race
Reaction function of country 1 Δ��,� = −/��,� + 0�),� + 8.�,� Reaction function of country 2 Δ�),� = 1��,� − 2�),� + :.),� Variation of the armament stock country 1 Δ��,� = ��,� � − ��,� Variation of the armament stock country 2 Δ�),� = �),� � − �),�
Next, we will study two concepts that are fundamental for the analysis to be
done later: first, the concept of equilibrium, which we define as the steady
state, and second, the concept of stability of the system, which will indicate
how the trajectories of the variables are with respect to the steady state.
1.3.1 Definition of equilibrium: The Steady State
The concept of equilibrium used in dynamic analysis is the so-called Steady
State. While in a static analysis the concept of equilibrium typically relates to a
situation in which the supply of a certain variable is equal to its demand
(market clearing), in the dynamic analysis, the concept of equilibrium relates
to a situation in which economic variables remain constant over time (their
time variation is zero, so they take the same value period by period). The value
of the variables in steady-state, denoted by a horizontal bar on the variable,
therefore, would be defined by that situation in which the variation with
respect to the time is equal to zero.
�= ⇒ Δ�� = ?(�� , %�) = 0 ⇒ �� = �= (1.12)
This means that the steady state of a dynamic system is given by a vector of -dimension zeros, for each of the difference equations of the system
presenting the temporal variation of the endogenous variables (∆�� = 0).

PAGES MISSING
FROM THIS FREE SAMPLE
Index
A
aggregate demand, 29-36.
arm race model, 20.
C
calibration, 30, 35-38, 52, 56, 85,
137, 262.
capital stock, 96, 135-152.
capital income, 122, 125-127.
capital income tax, 125, 128.
computational macroeconomics,
255, 260, 263, 267, 269, 273.
competitive equilibrium, 164, 173,
215, 223.
consumption, 33, 71-115, 118-120.
consumption-leisure decision, 95-
99, 101, 105, 116, 134.
consumption-saving decision, 72,
87-93, 96, 97.
consumption tax, 118, 122, 124,
125, 134.
D
David Ricardo, 121.
depreciation rate, 148-149.
difference equation, 17, 72, 74, 77,
184, 201.
discount factor, 72, 75-81.
discounted utility, 72-73, 80-81.
distortionary taxes, 117, 119, 122-
123, 126, 128.
disturbance, 137, 141, 150, 155-162,
165, 171, 177.
Dornbusch, 51-53, 150, 155.
dynamic general equilibrium, 72,
73, 95, 96, 125, 135, 154, 163,
165.
dynamic IS-LM model, 29-31, 33,
41, 48.
dynamic system, 4-8, 13, 16, 20, 30,
37.
Dynare, 3, 18, 30, 59, 157, 189, 233,
259.
E
economic agent, 71, 135, 136, 140,
166, 170.
eigenvalue, 15, 62, 155, 231, 234,
242, 247.
eigenvector, 24, 62, 242, 299.
endogenous variable, 7, 9, 16-20.
Excel spreadsheet, 3, 30, 116, 165,
233.
exchange rate overshooting, 51-53,
60, 66.
exogenous variable, 14, 17-19.
expectations, 3-4, 31, 34, 51, 54, 59,
62-67, 74.
F
financial assets, 72-75, 77-94.
fiscal policy, 49, 115, 116, 120-122,
127.
fiscal revenues, 115, 117, 127, 134.
firm’s profits, 139, 141.
Frisch elasticity, 110-111.
forward-looking variable, 62, 164,
165, 216, 232, 296.
308 Index
G
global stability, 4-5, 7, 11, 13, 15, 21-
23.
government, 19, 26, 115-119, 121-124.
H
Hansen, 29, 30.
Hicks, 29, 200.
households, 71, 74, 95, 98, 115-119.
I
imaginary number, 14-15, 30, 42,
47, 189.
impulse-response, 4, 19, 30, 43.
inflation, 6, 31-36.
Investment, 29, 31, 71, 95-96, 122,
135-138.
investment adjustment costs, 141.
J
jump variable, 51.
K
Keynes-Ramsey rule, 169.
L
labor income, 72, 75, 80, 86-89.
labor income tax, 117, 134.
labor supply, 95-100.
Lagrange auxiliary function, 77,
110, 122, 123.
Lagrange multiplier, 77-78, 91, 99-
101.
Leisure, 96-103, 106-116.
Log-linearization, 137, 151-153.
Lump-sum tax, 115-118, 121.
M
MATLAB, 3, 18, 30, 79, 102, 125,
178, 205.
maximization, 72-75, 77-79.
Money, 29, 31-38, 42-49, 52-59.
N
Newton algorithm, 81, 277-279.
nominal exchange rate, 51-54, 57,
59-66.
numerical solution, 13-18.
O
optimal consumption path, 72, 76-
79.
output, 6, 30-34-36.
P
perfect foresight, 34, 54, 62-63.
Phillips curve, 30-32, 54.
public spending, 32-33, 115-117,
121-123.
population, 129, 133, 197-204.
potential output, 31-33.
price level, 29, 31-34, 37-39.
production function, 135-139, 143-
148.
purchasing power parity, 52, 54, 65-
66.
Q
q ratio, 138, 288.
R
Ramsey, 170, 215-217, 220, 230-233,
236-238.
Index 309
rational expectations, 3, 34, 51, 144,
163.
real balances, 32, 35-36.
real interest rate, 32-34, 42-45.
real number, 11, 40, 58, 241.
relative risk aversion, 91, 110.
ricardian equivalence, 121, 123.
Richardson, 7.
S
saddle point, 4-7, 11, 21-22, 24-27.
saving, 29, 71-74.
saving returns tax,
sensibility analysis, 67.
shadow price of consumption, 77,
169.
shock analysis, 3, 18, 30.
social security, 115, 116, 128-134.
Solow, 197-198.
Solver, 72, 79, 82-84.
stability, 4-8, 10-13, 21-22.
Stable saddle path, 22-23, 25-27.
state variable, 149, 152, 178, 226.
steady state, 4, 8-20, 37, 137, 149.
Swan, 197-198.
T
taxes, 115-128.
Tobin, 135-138.
Tobin’s Q model, 135, 137-138.
total factor productivity, 166, 170,
173, 181-183.
transition dynamic, 4, 19-20.
U
uncovered interest parity, 52, 54,
64.
utility function, 71-73, 76-80.
working hours, 173.