Embed Size (px)
Citation preview

An Introduction to “Deliverology”Michael Barber
Quality Assurance & Results DepartmentAfrica Development Bank, Tunisia22 March 2010

2
… A MAP OF DELIVERY …
Boldness of reform
Quality of execution
CONTROVERSY WITHOUT IMPACT
STATUS QUO
TRANS-FORMATION
IMPROVED OUTCOMES
Successful delivery
TRANS-FORMATION
IMPROVED OUTCOMES

3
… AND DEVELOPING AMONG STAFF AN UNDERSTANDING OF WHAT DELIVERY REQUIRES
• Structure, culture, results• Avoid celebrating success too soon
Ambition
Irreversibility
Focus
Clarity
Urgency
• Believe in step change• Get it done as well as possible
• Clear sustained priorities• Avoiding distractions
• “Confront the brutal facts”• Know what’s happening now• Understand stakeholders
• People are impatient• “If everything seems under control, you’re
not going fast enough”

4
THE DELIVERY UNIT’S APPROACH: 1
• Targets, which set measurable goals
• Plans, which are used to manage delivery and set out the key milestones and trajectories
• Monthly reports on key themes
• Stocktakes, which the Prime Minister holds every 2/3 months
• Priority reviews, to check the reality of delivery at the frontline
• Problem-solving/Corrective action, where necessary
• Delivery reports, summarising the government’s progress on delivery every six months
5
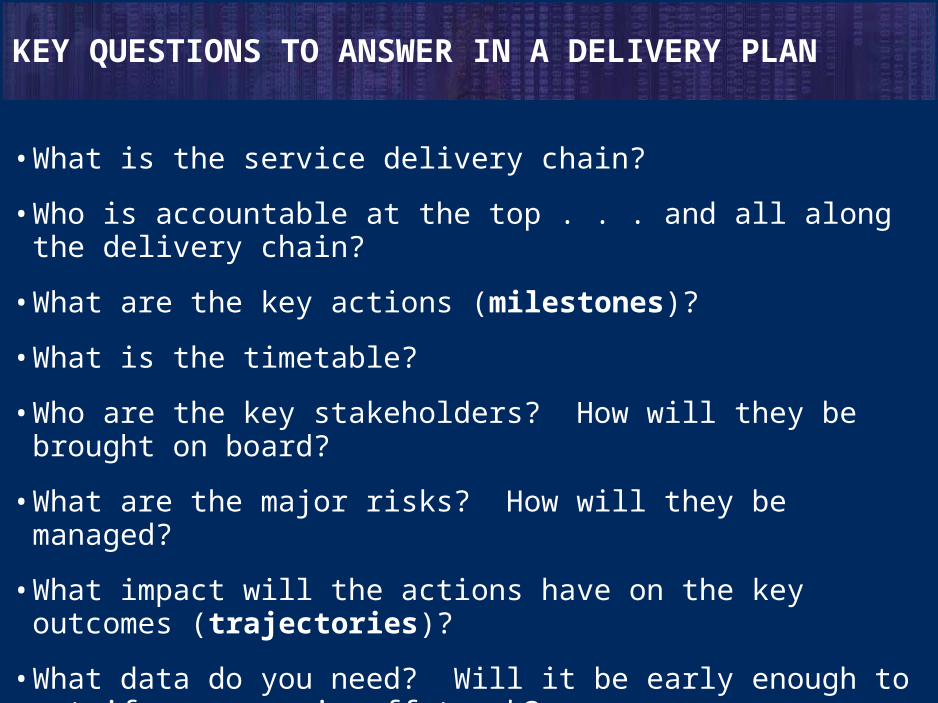
KEY QUESTIONS TO ANSWER IN A DELIVERY PLAN
• What is the service delivery chain?
• Who is accountable at the top . . . and all along the delivery chain?
• What are the key actions (milestones)?
• What is the timetable?
• Who are the key stakeholders? How will they be brought on board?
• What are the major risks? How will they be managed?
• What impact will the actions have on the key outcomes (trajectories)?
• What data do you need? Will it be early enough to act if progress is off track?

6
POLICY DELIVERY – TRAJECTORIES
97 98 99 00 01 0296 03 04 05 06 07 08 09 100
60
65
70
75
80
85
90
95
Mid-term delivery goal
Long-term strategic goal
Historical performance
Delivery indicator
Low trajectory (policy
has a lagged impact)
Mid-trajectory
High trajectory (policy has an immediate impact)
Policy step A
Policy step B
Policy step C
Project plan streams
Project plan streams
progress indicators
Starting Point

7
THE DELIVERY UNIT’S APPROACH: 2
Getting the key relationships right
• The Prime Minister: “Whatever you’re doing we’re focussed on your priorities”
• The Chancellor of the Exchequer: “We’ll make sure the money you allocate delivers results”
• Cabinet Ministers: “We’ll help you get your bureaucracy to deliver the government’s priorities”
• Top Civil Servants: “We’ll sustain a focus on these priorities and help you solve your problems”
• Everyone: “However much we contribute you get the credit”

8
The problem of Autumn: Grinding out improved rail reliability

9
RAIL PUNCTUALITY VARIES SEASONALLY AND REACHED AN ALL-TIME LOW AFTER THE HATFIELD CRASH IN OCTOBER 2000
Source: Department of Transport
National actual PPM (period data)
PP
M
55%
60%
65%
70%
75%
80%
85%
90%
95%
Mar 97 Mar 98 Mar 99 Mar 00 Mar 01 Mar 02 Mar 03 Mar 040%
Hatfield crash

10
RAIL PUNCTUALITY VARIES SEASONALLY AND REACHED A POST-HATFIELD PEAK THIS YEAR
Source: Department of Transport
National Public Performance Measure (PPM) – actual data against Moving Annual Average (MAA)
National actual PPM (period data)
National moving annual average
PP
M
55%
60%
65%
70%
75%
80%
85%
90%
95%
Mar 97 Mar 98 Mar 99 Mar 00 Mar 01 Mar 02 Mar 03 Mar 040%
Post Hatfield peak
Hatfield crash

11
RAIL PUNCTUALITY VARIES SEASONALLY AND REACHED A POST-HATFIELD PEAK THIS YEAR
Source: Department of Transport
National Public Performance Measure (PPM) – actual data against Moving Annual Average (MAA)
National actual PPM (period data)
National moving annual average
PP
M
55%
60%
65%
70%
75%
80%
85%
90%
95%
Mar 97 Mar 98 Mar 99 Mar 00 Mar 01 Mar 02 Mar 03 Mar 040%
Post Hatfield peak
Hatfield crash
Autumn performance almost at pre-Hatfield levels

12
RAIL: THE MESSAGES ARE CLEAR
1. Establish a shared goal
• Demanding and realistic• Align key players around the goal
2. Manage performance
• Don’t just connect the data, use it• Monthly reviews with each train operating company
3. It’s all in the detail
• Whistles and watches• Joint Control Centres
4. Autumn shouldn’t be a surprise
• The weather is a variable• Preparation should be constant

THE ASSESSMENT FRAMEWORK ENABLES THE LIKELIHOOD OF DELIVERY TO BE PREDICTED
Department …………………….
PSA Target ……………………
Degree of challenge
Quality of planning, implementation and
performance management
Capacity to drive progress
Stage of delivery
Judgement Rating Rationale summary
Likelihood of delivery
Recent performance
Likelihood of delivery
Red Highly problematic - requires urgent and decisive action
Amber/Red Problematic - requires substantial attention, some aspects need urgent action
Amber/Green Mixed - aspect(s) require substantial attention, some good
Green Good - requires refinement and systematic implementation

14
ASSESSMENT FRAMEWORK: EXAMPLE
AG
Likelihood of delivery
Red
Amber/Red
Amber/Green
Green
N
Highly problematic - requires urgent and decisive action
Problematic - requires substantial attention, some aspects need urgent action
Mixed - aspect(s) require substantial attention, some good
Good - requires refinement and systematic implementation
Not enough evidence
Additional Comments
We need to achieve 95% in June for the overall rating not to move to amber/red
Evidence for assessment Version 0.3
Jul-04Department
AreaLevel PSA level / PSA sub-
target level / 2005 Delivery Goal
Dept A
PSA 4
PSA level
Recent performance
Performance has lifted from 91.1% for the month of January 2004 to 94.3% for the month of April 2004
JudgementOverall rating
Degree of challenge
Quality of planning,
implementation, and performance
management
Capacity to drive
progress
VH
AR
AG
Rationale summary
Stage of delivery 2
The stage is borderline 2/3. Programme and project management and data collection and monitoring are all fully established and there is full confidence that all of the necessary strategies are now in place as a result of agreement on the 5-point plan. Stakeholder communication is good and pressure and support are being successfully combined to drive implementation forwards.
The target is a complex one. This is due primarily to the agreement on a 5-point plan (to Clarify the Target, Improve Incentives, Refocus Support from Agency , provide tools to improve and strengthen Leadership & Performance) which is now being actively and effectively implemented. Recent progress in two other areas further supports this reassessment. The xxxxx paper for launch in May will put the weight of the colleges behind the change in attitudes and new ways of working required in order to deliver the target. The publication of the xxxx review also sets a clear direction. Together they effect a step change in ability to overcome the key blockages impeding target delivery.
There is now a single plan based on the core 5-point plan agreed with PMDU, a single agenda and a very solid infrastructure to the programme which ensures control of all contributing teams and strategies. Effective governance and rigorous measuring and monitoring of deliverables and performance are fully established alongside a comprehensive and well directed programme of intervention in challenged areas. The management of risks and interdependencies is now well underway. Existing plans just need refinement and systematic implementation. Performance management is already proving effective and will be deployed increasingly as the target date approaches.
A very effective leadership team have ensured that the right people, action plans, knowledge and performance management are all in place for continuing progress on the 5-point plan to be assured. Further capacity to drive is anticipated from the recruitment of an implementation manager and being able to firm up the long term contribution and commitment of key resources. Phased incentives and the star ratings plus clear focus on this have provided the necessary levers and put capacity to deliver on a firm footing.

15
Overall Judgement
DeptDegree of challenge
Quality of planning, implementation and
performance management
Capacity to drive progress
Stage of Delivery
Likelihood of Delivery
V High - High - Red - Amber/Red - Amber/Green - Red - Amber/Red - 1 Policy Red - Amber/Red - VH - H - M - L R - AR - AG - G R - AR - AG - G 1 - 2 - 3 - 4 R - AR - AG - G
July 2004 Rank (out of
21)
Assessment Criteria
THE DELIVERY REPORT: LEAGUE TABLE – JULY 2004
Rank (out of
21)

16
PROGRESS ON THE PRIME MINISTER’S PRIORITIES CAN BE SUMMARISED IN A LEAGUE TABLE
Overall Judgement
DeptDegree of challenge
Quality of planning, implementation and
performance management
Capacity to drive progress
Stage of Delivery
Likelihood of Delivery
V High - High - Red - Amber/Red - Amber/Green - Red - Amber/Red - 1 Policy Red - Amber/Red - VH - H - M - L R - AR - AG - G R - AR - AG - G 1 - 2 - 3 - 4 R - AR - AG - G
A PSA 1 L G G 3 G = 1B PSA 2 L G AG 2 G = 1C PSA 3 H AG AG 3 G 3D PSA 4 H G AG 3 AG 4A PSA 5 VH G AG 2 AG 5B PSA 6 H AG AG 3 AG 6C PSA 7 H AG AG 2 AG = 7D PSA 8 H AG AG 3 AG = 7A PSA 9 H AG AG 2 AG = 7B PSA 10 VH AG AG 2 AG = 10C PSA 11 VH AG AG 2 AG = 10D PSA 12 H AR AG 3 AG 12A PSA 13 VH AR AG 2 AR 13B PSA 14 VH AG AR 2 AR = 14C PSA 15 VH AG AR 2 AR = 14D PSA 16 VH AR AR 2 AR = 16A PSA 17 VH AR AR 2 AR = 16B PSA 18 H AG AR 3 R = 18C PSA 19 H AG AR 2 R = 18D PSA 20 VH AG AR 3 R 20A PSA 21 VH R R 2 R 21
July 2004 Rank (out of
21)
Assessment Criteria
Rank (out
of 21)
= 1= 1
3
456
= 7= 7= 7 = 10 = 10
1213
= 14 = 14 = 16 = 16 = 18 = 18
20
21

A SIMPLE INDICATOR OF OVERALL PERFORMANCE CAN BE DESIGNED
5347
December 2003, %

BETWEEN DECEMBER 2003 AND JULY 2004 THERE WAS A 15% SWING FROM RED TO GREEN …
38
62
July 2004, %
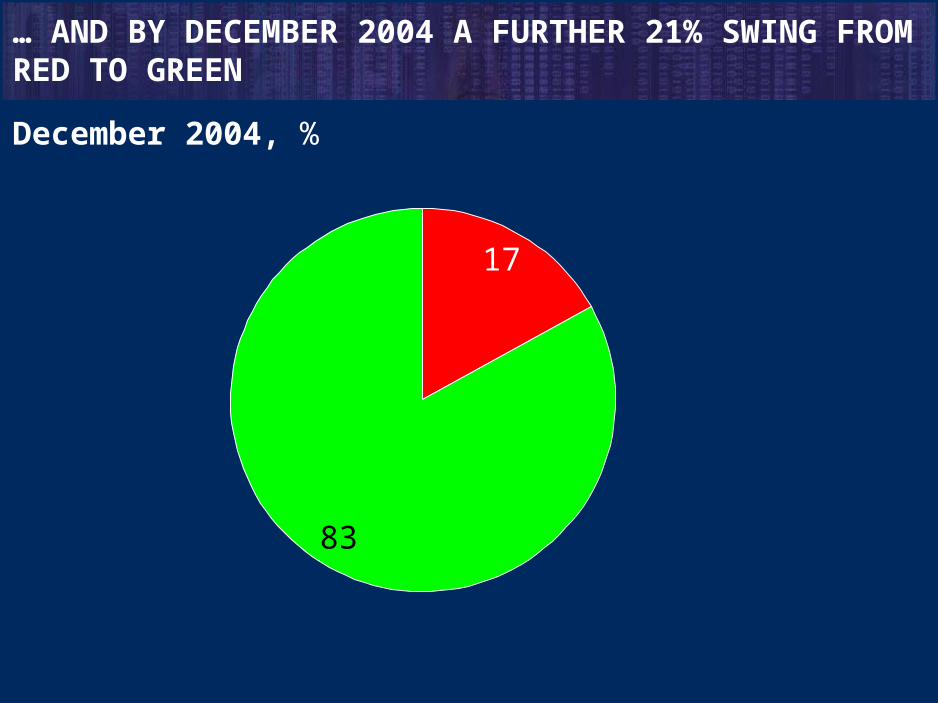
… AND BY DECEMBER 2004 A FURTHER 21% SWING FROM RED TO GREEN
17
83
December 2004, %

20
PRODUCTIVITY EQUATION
Public Sector Productivity
Expenditure
Includes both the cash outgoings (e.g., salaries) as well as depreciation of buildings and equipment
Real world outcomes
Improved health, education, security etc.
Public support
Public perceptions of outcomes and support for public services
Organisational “health”
Qualities, attributes, and actions that will help to sustain future performance
Source: Instruction to Deliver, Michael Barber, Methuen 2008

TRANSFORMATION WILL DEPEND ON COMBINING THREE ELEMENTS
The right mindset
• ‘Guiding coalition’
• Shared vision
• Ambition
• Clear priorities
• Ministerial consistency
• Urgency
• Capacity to learn rapidly
• Collaboration across government
Bold reform
• Choice
• Personalisation
• Responsiveness to the community
• Contestability
• Vibrant supply side
• Serious investment
• 3 year funding for frontline
• Flexible deployment of staff
Effective performance management
• Targets
• Sharp accountability
• Good real-time data
• Best practice transfer
• Transparency
• Management against trajectory
• Capacity to intervene where necessary
• Incentives to reward success