Embed Size (px)
Citation preview


INTRODUCTION TO ECONOMIC DEVELOPMENT
CONTENT
1 INTRODUCTION 1
2 WHAT IS ECONOMIC DEVELOPMENT? 2
2.1 Defining the Concept of Economic Development 2
2.2 Sustainable Economic Development 2
2.3 Economic Growth Trends in the Western Cape 3
2.4 Future Prospects for Economic Growth in the Western Cape 3
3 WHY ECONOMIC DEVELOPMENT? 4
4 KEY CONCEPTS IN ECONOMIC DEVELOPMENT 6
4.1 Gross Domestic Product (GDP) 6
4.2 Inflation 6
4.2.1 Effects of Inflation on Economic Development 8
4.2.1.1 Distribution Effects 8
4.2.1.2 Economic Effects 8
4.2.1.3 Social and Political Effects 8
4.2.2 Problems Related to Inflation 9
4.3 Interest Rates 9
4.3.1 How Interest Rates are Determined 9
4.3.2 Example of the Effect of Inflation on Interest Rates 10
5 DIFFERENT KINDS OF ECONOMIC SECTORS 10
5.1 The Primary Economic Sector 10
5.1.1 Labour Trends in the Primary Economic Sector 10
5.1.2 Agriculture 11
5.1.3 Fishing 12
5.2 The Secondary Economic Sector 12
5.2.1 Prominent Industries in the Western Cape 13
5.2.1.1 Clothing and Textiles 13
5.2.1.2 Metals and Engineering 16
5.2.1.3 Oil and Gas 16
5.2.1.4 Electronics 16
5.2.1.5 Biotechnology 16
5.2.1.6 Crafts 16
5.3 The Tertiary Economic Sector 17
5.4 The Quaternary Economic Sector 19
6 THE ENVIRONMENT AND ECONOMIC DEVELOPMENT 20
7 CHARACTERISTICS OF LEVELS OF ECONOMIC DEVELOPMENT 20
7.1 Relative Characteristics of Development 20
7.1.1 High Levels of Development 20
7.1.2 Low Levels of Development 21
8 THE LABOUR MARKET AND JOB CREATION 21
8.1 Elements of the Labour Market 21
8.2 Demand and labour supply in the Western Cape 22
8.3 Expansion of the Labour Market 24
8.4 The Need for Employment Creation 27
8.5 Challenges Facing the Labour Market 28
9 UNEMPLOYMENT 29
9.1 Reasons Why People are Unemployed 29
9.2 Effects of Unemployment 31
10 POVERTY REDUCTION AND ALLEVIATION 31
10.1 Defining the Concept Poverty 31
10.2 Gini-Coefficient 32
10.3 Poverty Reduction and Economic Development 33
10.4 Poverty Alleviation Strategies 35
11 ECONOMIC INDICATORS 35
11.1 Daily Indicators 35
11.2 Trendsetting Indicators 36
11.3 Other Indicators 36
11.4 The Influence of Economic Indicators 36
11.5 Bankers Acceptance (BA) Rate 37
11.6 Stock Exchange Indices 37
12 ETHICS 38
13 INCENTIVES THAT CONTRIBUTE TOWARDS ECONOMIC DEVELOPMENT 39
13.1 Savings and Investments 39
13.2 Long-Term Security 40
14 GLOBAL/INTERNATIONAL ECONOMIC DEVELOPMENT 40
14.1 Global / International Shift to Knowledge-Intensive Activities 41

14.2 Globalisation and Tourism 42
14.3 The Effect of Global /International Participation on Poverty and Inequality 42
14.4 Summary of International Trends 42
15 ECONOMIC DEVELOPMENT IN AFRICA 43
15.1 Labour Market Dynamics in Africa 43
15.2 Economic Development in sub-Saharan Africa (SSA) 44
15.3 Poverty and Inequality in sub-Saharan Africa 44
15.4 Economic Growth and Poverty reduction in sub-Saharan Africa 45
15.5 Labour Market Dynamics 45
16 ECONOMIC DEVELOPMENT IN THE SOUTHERN AFRICAN DEVELOPMENT COMMUNITY (SADC) 46
16.1 Objectives 46
16.2 Trade, Industry, Finance, and Investments 47
16.3 Infra-structure and Services 47
16.4 Food, Agriculture and Natural Resources 48
16.5 Social and Human Development and Special Programmes 48
17 SOUTHERN AFRICAN CUSTOMS UNION (SACU) 49
18 ECONOMIC DEVELOPMENT IN SOUTH AFRICA - NATIONAL DEVELOPMENT 49
18.1 National Policy 50
18.2 Economic Growth 51
18.3 Poverty 51
19 PROJECTS IN ECONOMIC DEVELOPMENT IN THE WESTERN CAPE 52
19.1 The RED Door Project 52
19.2 The PLEK PLAN 56
20 CONCLUSION 60
BIBLIOGRAPHY 61

DIAGRAMS
Diagram 1 The three major flows in the economy
Diagram 2 Consumer Price Index (CPI) inflation Western Cape versus South Africa 1970 - 2008
Diagram 3 Western Cape Sector Contribution to GDPR, 1995 - 2003
Diagram 4 Employment Expansion by Sector, 1995 - 2002
Diagram 5 Employment and Labour Force Growth, 1995 - 2002
Diagram 6 Demographic Characteristics of the employed, 1995 and 2002
Diagram 7 Age Pyramid for the Western Cape and South Africa, 2001
Diagram 8 Target and Actual Employment Growth, 1995 - 2002
Diagram 9 Unemployment by Location 1995 and 2002
Diagram 10 Lorenz Curve
Diagram 11 Gini Coefficients by Province, 1995 and 2000
Diagram 12 Daily Indicators

ABBREVIATIONS
BMR Bureau of Market Research
CCDI Cape Craft and Design Institute
CMA Cape Metropolitan Area
COGSI Cape Oil and Gas Supply
CPI Consumer Price Index
CTP Committee of Technikon Principals
DED Department of Economic Development (provincial)
DPP Die PLEK PLAN
DPRU Development Policy Research Unit
dti Department of Trade and Industry (South Africa)
EDU Economic Development Units
FDI Foreign direct investment
GEAR Growth Employment and Redistribution
GDP Gross Domestic Product
GHS General Household Survey
GNI General National Income
GNP Gross National Product
HIV/AIDS Human Immunodeficiency Virus/ Acquired Immune Deficiency Syndrome
ICT Information and Communication Technology
JSE Johannesburg Stock Exchange
LED Local Economic Development
LFS Labour Force Survey
MDG Millennium Development Growth
MEDS Micro-economic Development Strategy
OHS October Household Survey
RED Door Real Enterprise Development Initiative
SACU Southern African Customs Union
SADC Southern African Development Community
SADCC Southern African Development Coordination Conference
SMME Small Medium Micro Enterprise
SSA Sub-Saharan Africa
UNCTAD United Nations Conference on Trade and Development

OUTCOMES
• To empower people to become economically independent.
• To build the capacity of all stakeholders to manage economic development.
• To facilitate participatory support in economic development.
• To create a positive attitude towards sustainable economic development
1. INTRODUCTION
In the modern, highly competitive world of today, important sources of wealth and economic development are knowledge, learning
and innovation (Committee of Technikon Principals 2003). All three reside in people. If we are to become successful in our bids
and endeavours to become economically viable, we will have to develop (have available) an adequate skills pool. We also need to
expand the range of available skills.
For the Western Cape Province to formulate and implement successful, well-targeted policies on economic development it needs
to identify the projects that contribute to economic development, the skills involved, labour market development and job creation,
employment factors and poverty reduction.
The vision of the Department of Economic Development is encapsulated in the vision of the National Growth and Development
Strategy which requires the Province to be:
• A leading emerging market and destination of first choice for investors while retaining and expanding social equity and fair
labour standards
• A productive economy with high levels of service, a highly skilled workforce, and modern systems of work organisation and
management.
• A society in which there are economic opportunities for all, poverty is eradicated, income inequalities are reduced and basic
services are available to all
• A society in which our people, our most precious resource, are given the opportunity and support to develop to their fullest
potential
• A society that promotes the values of social equity, fairness, and human dignity.
Our vision is one of a Western Cape which offers dignity, equity and prosperity to all those who make it their home.
In essence, our vision is one of a shared, sustainable, growing, labour-absorbing, globally competitive economy.
Economic development is heterodox, i.e. it happens in different ways in different countries and regions of the world. The environment
and the available skills to develop the environment play an important role. Economic development is also a complex phenomenon
that involves a variety of social and economic processes. These issues will be discussed in the sections that follow.
The positive turnaround of the South African economy has created a strong platform for accelerated growth in the next decade, with
an emphasis on achieving higher levels of productive investment, employment creation, exports and productivity (Parliamentary
Monitoring Group South Africa 2005). Reducing cost structures and increasing competition are high priorities for achieving accelerated
growth. Government intends sending a strong message to all sectors and firms in the economy that there should be increased
competition to promote the growth of downstream and value-adding economic activity, which holds the key to a sustainable and
job-creating economy (2005).
1
2. WHAT IS ECONOMIC DEVELOPMENT?
2.1 Defining the concept economic development
Economic development requires improved competitiveness and employment creation across many sectors of the economy.
Economic development is the sustained increase in income of all members of society so as to be free from material want.
One aspect of that challenge is to achieve development in an interdependent world, that is a world in which goods, services,
people, capital and knowledge flow relatively easily across national borders with large net benefits to economies (Trevor
Manuel, 2 December 2004, University of Sussex).
The bottom line for South Africa's future economic development and prosperity lies in our national ability to master the
processes of change and make meaningful progress towards our international competitiveness. Our future success depends,
to an increasing extent, on our ability to mobilise more effectively the imagination, creativity, skills and talents to all our
people. We must become more successful in harnessing knowledge to competitiveness and wealth creation (Committee
of Technikon Principals (CTP) 2003).
Within economic development on local level we find the Local Economic Development (LED)
The LED is a process of identifying and using local resources to create sustainable economic and social development in
local areas to assist in;
• creating more jobs;
• developing local markets;
• growing small, medium and micro enterprises (SMMEs);
• addressing poverty;
• ensuring community development.
There are many stakeholders at local level that participate in local economic development. Local government is one of the major
stakeholders.
The South African economy is greatly influenced by the world economy and is characterised by the continuing recovery of the rand
and the rising gold price (Fourie, 2003).
Economics is the study of how individuals, firms, governments and other organizations within our society make choices and how
those choices determine how the resources of society are used. - Joseph Stiglitz.
When the South African economy is analysed it can be stated that there should be transformation and job creation. The challenge
to South Africa is to obtain greater transformation and growth.
2.2 Sustainable Economic Development
Sustainable means to support something over time or continuously. There should be progression and growth.
Communities that attain social cohesiveness and are stable with viable institutions, sustainable economies and universal access
to social amenities will contribute towards economic development (Leiman, 2005). Other factors that will contribute are access to
2

social amenities, skilled and knowledgeable people who are equipped to contribute to their own and the nation's growth and
development and the empowerment of all stakeholders.
In the Western Cape the following could help for sustainability:
• Investing in the road and transport system.
• Maintaining the infra-structure.
• Decentralisation of the industries.
Developing industries should adhere to criteria for sustainability to make it viable for all the stakeholders.
2.3 Economic Growth Trends in the Western Cape
The Western Cape has out-performed the national economy over the period 1999 to 2003. Real GDPR growth for the Western Cape
economy averaged 3.9 percent over the period, compared to the national average of 3.1 percent (Western Cape Provincial Economic
Review & Outlook, 2005:6).
On average, however, the superior growth of the Western Cape economy over the past five years is largely due to the strong growth
of the region's service industries, such as transport and communication, financial and business services and internal trade and
catering (which grew by 6.6 % per annum between 1999 and 2003 compared to 5.3 % nationally) and financial and business
services (6.3 % versus 5.4 %).
The Western Cape has a well diversified and open economic structure. The coastal location contributes towards the export and
import of commodities. There is strong export growth and new markets were established.
In contrast, the growth of the Western Cape overall manufacturing industry has been disappointing. Real Western Cape manufacturing
value-added grew at half the pace of the national average, or at 1.4 percent per annum between 1999 and 2003 compared to 2.8
percent nationally. The growth in the Province's service industries is projected to equal or exceed the national performance and a
more competitive exchange rate should allow for a firmer recovery in the Province's embattled manufacturing sector, as well as
the agricultural sector, on the assumption of normal climatic conditions.
There are a number of significant opportunities for output and employment growth in the Western Cape. If it is able to capitalise
on the opportunities presented, the Province may significantly exceed projections.
The Western Cape is doing better than Gauteng and the national average in the knowledge and information economy. A knowledge-
intensive Province needs highly-skilled people. This suggests that the Micro-Economic Development Strategy (MEDS) should consider
both stocks and flow of people in the Province to determine how many highly-skilled people do we have and how many do we need.
The Western Cape is undoubtedly the country's most attractive Province. For every person leaving, four others are coming in.
Exchange students, from Europe, Africa and America to South Africa is on the rise of which the Western Cape attracts probably at
least a quarter of the total. The province needs students, including from outside the country. These students contribute towards
the already existing knowledge pool.
2.4 Future Prospects for Economic Growth in the Western Cape
Solving the unemployment problem in the Western Cape is a challenge of enormous proportions for which neither historical experience
3

nor economic theory or current international practice suggest an obvious or easy solution. Stakeholders need the courage to
experiment, along with the hope that mistakes may be made along the way will eventually be vindicated by success. Since the
Micro-Economic Development Strategy for the Western Cape (MEDS) is an interactive process, as time goes by, all the stakeholders
will have the opportunity to improve how they impact on the Provincial roadmap and, by implication, how the MEDS in turn affects
their activities.
The MEDS has mostly been about building on a vision articulated by the Provincial Government in conjunction with numerous
stakeholders, it gathered information about core economic activities in the Western Cape and assessed them in respect of their
potential contribution to the aims and objectives of this strategy. Making the analysis public allows all stakeholders to familiarise
themselves with what goes on in those sectors that currently account for the bulk of output and employment, and which strategies
key actors in these sectors pursue. This is the first step toward reducing uncertainty about collective performance of actors in the
region which in itself enhances its innovative potential and is especially helpful when economic change is rapid or mainly takes
place in complex activities associated with the knowledge economy.
Collective endeavours such as the MEDS pre-suppose that stakeholders take each other seriously and have a measure of trust in
each other's actions. In the beginning a great deal of explaining, motivating and coaxing on the part of the Provincial Government
will be required, and an appropriate institutional and organisational framework will need to be devised to make this possible.
To be sure, the onus is equally on business. Leaders from the business community in the Western Cape should engage with the
complicated socio-economic challenges facing the Province, regardless of whether their individual company is directly affected by
poverty, unemployment, and other forms of economic exclusion in the short term because we are all affected in the long term.
Rising to the challenge is about securing our joint future. Business leaders should seek the dialogue with government.
The regional economy in the Western Cape is expected to catch up with South Africa's economic recovery over the short term.
Prospects vary, inter alia, depending on the direction of the rand exchange rate and/or business adjustment to the new macro-
economic parameters, as well regional policy support.
The growth in the Western Cape's service industries is projected to equal or exceed the national performance and a more competitive
exchange rate should allow for a firmer recovery in the Provinces manufacturing sector, as well as the agricultural sector on the
assumption of normal climatic conditions.
3. WHY ECONOMIC DEVELOPMENT?
When one examines these explanations it is clear that economics and economic development plays a major role in the lives of all
human beings:
• Economics is the art of making the most out of life (George Bernard Shaw).
• Economics is a study of mankind in the ordinary business of life (Alfred Marshall).
• Economics is concerned with the efficient use or management of limited productive resources to achieve maximum satisfaction
of human material wants (Campbell McConnell).
• Economics is the social science that studies the efforts of society to obtain the maximum satisfaction of wants from the
utilisation of resources that are scarce relative to the wants of society (Colin McCarthy).
4

To make a living one has to do business in one form or another. The resources that we have should be utilised in a profitable manner,
this include natural resources as well as human resources. The resources that nature provides us should be used productively,
manufactured into valuable commodities and be distributed among the different partners with whom we are dealing.
Activity
How does economic growth complement economic development?
Economics is essentially concerned with what to produce, how to produce it and how to distribute the products between the various
participants. There are three major flows in economy.
Diagram 1: The three major flows in the economy (Mohr & Fourie, 2005:47)
Production generates income (for the various factors of production) and part of all this income is then spent to buy the available
goods and services. All these things are happening at the same time.
These factors govern our daily lives. We should be aware of how these processes work and the forces that govern them.
Economic development includes economic growth.
There is another version that provides an explanation of the flows of goods and expenditure that is provided by Tony Leiman
The firms generate income (for the various factors of production) that has a direct influence on households. Firms deliver goods
5
Firms
Households
GoodsServices FactorsExpenditures

and services that influences the functioning of households. All of these processes have an influence on the standard of living of
people. The emphasis is on households.
The following sections will deal with the different kinds of industries, sectors of development, labour and employment, poverty
alleviation, economic indicators and projects to help with job creation. The emphasis will be on developments in the Western Cape.
4. KEY CONCEPTS IN ECONOMIC DEVELOPMENT
4.1 Gross Domestic Product (GDP)
The gross domestic product (GDP) is the total value of all final goods and services produced within the borders of a country in a
particular period (usually one year) (Mohr & Fourie, 2005:63).
The GDP is one of the most important barometers of the performance of the economy. There are three methods of calculating the
GDP, namely:
• The production method (value added)
• The expenditure method (final goods and services)
• The income method (incomes of the factors of production)
Economic success is measured by how much wealth has been created.
Economic growth is simply reflected by changes in this production figure. If it goes up by two per cent over a year, then the economic
growth has been two per cent. If it falls then one is faced with a 'negative' growth rate.
Gross Domestic Product should represent the total of everything to which value is added. G.D.P. includes many things that may
not at first be obvious - such as entertainment (e.g. theatrical productions) and services (e.g. hairdressers, doctors) (Schuitema,
1998:16).
The rate of growth in the Gross Domestic Product (GDP) decreased from 3,5 % in 2002 to approximately 2% in 2003. This was partly
due to the decrease in net exports and is closely connected with a decrease in international demand for South African goods (especially
minerals and metals), as well as to the recovery of the rand and more expensive exports (Fourie, 2003:8).
Gross Geographic Product (GGP) is important for a province. It measures the total value of all goods and services within the Western
Cape. The GGP is an outcome of the products delivered by the province.
4.2 Inflation
Inflation has a great influence on economic development in the sense that it affects the way in which people make a living. It also
affects the purchasing power of people, if inflation increases, prices increase and when inflation decreases, prices decreases.
Inflation is a general increase in prices and fall in the purchasing value of money and a drop in the value of people's cash
savings.
Inflation in South Africa has decreased from 11,3 % in October 2002 to 4,1 % in November 2003 (Fourie, 2003:8). The decrease
was supported by the recovery of the rand and, to an extent the lesser decrease in food prices. As the inflation figures in 2003
6

improved, the Reserve bank adapted the monetary policy of cutting the repo rate by 550 basic points (5.5 %). This in term reduced
the interest rate that banks charged to their clients. Average inflation expectations among South Africans, as measured by the
headline consumer price index (CPI) and CPI less mortgage rate changes (CPIX), rose across the board during the third quarter of
2005, with expectations for 2005 rising by 0.2 percentage points to 4.7 percent from 4.5 percent in the second quarter of 2005.
Average expectations for 2006 inflation rose by 0.3 percentage points to 5.2 percent from 4.9 percent in the second quarter. According
to the latest survey the household inflation expectations for 2005 remained unchanged at 3.3 percent.
The economy is firmly on a higher growth range, emphasising the economic turnaround that has been achieved. Our fiscal deficit
has been reduced from 4.6 % in 1996 to 1.5 % of our Gross Domestic Product in 2005, and interest rates and inflation rates are
both at their lowest levels in decades (2005). Business confidence is at record levels and South Africa has had its credit rating
upgraded.
Inflation in the Western Cape is highly correlated with that of the rest of the country. Inflation is expected to accelerate to levels of
five to six percent during 2005/06 due to cyclical pressures and some depreciation in the exchange rate. Given the maturing anti-
inflation process in South Africa, wage and price setting is expected to take account of competitive forces in the local and global
arena (Western Cape Provincial Economic Review & Outlook, 2005:9)
Diagram 2: Consumer Price Index (CPI) inflation Western Cape versus South Africa, 1970 - 2008
If the output gap is positive inflation tends to rise and vice versa if the gap is negative (Smit & Burrows, 2002:1). Potential output
is determined mainly by the quantity and quality of its productive factors and the level of technology. It follows, therefore, that potential
output is related to the capacity of the economy to supply goods and services. Thus, the growth rate of potential output is the rate
of growth that the economy can sustain for long periods. The problem, however, is that potential output cannot be directly observed
(Smit & Burrows, 2002:1).
The difference between the potential and actual levels of output, is called the output gap. It shows the relative supply/demandsituation in a economy at a particular time.
The Consumer Price Index (CPI)
Inflation is currently one of the most important indicators to watch. As long as our annual average increase in costs of living is near
double digits (i.e. around 10 per cent) it will have an inordinate sway on policy and individual economic decisions as well as investment
decisions. This figure has a crucial bearing on your economic life, what one earns, how one spends and what one saves. It is released
7

monthly through the Central Statistical Services in the form of the Consumer Price Index.
The early-bird signal on inflation is the Producer Price Index, which monitors costs in the manufacturing sector, and eventually
impacts on retail prices, or the Consumer Price Index.
4.2.1 Effects of Inflation on Economic Development
There are three sets of effects of inflation, namely distribution effects, economic effects and political effects.
4.2.1.1 Distribution effects
Inflation affects the distribution of income and wealth among the various participants in the economy. The first significant distribution
effect is the redistribution between creditors and debtors. The basic rule is that inflation benefits debtors (borrowers) at theexpense of creditors (lenders).
Example: People with mortgage bonds are debtors who benefit from inflation because the real value of their loans decreases as
prices increase. People who borrow money to purchase expensive consumer goods such as motorcars also benefit from inflation
because it reduces the real value of their debt.
It should be clear, therefore, that many people benefit from inflation.
Inflation tends to redistribute income and wealth from the elderly to the young. Apart from the distribution between private lenders
and private borrowers, there is also a significant redistribution from the private sector to the government. The government is always
a debtor. In times of inflation the government gains at the expense of the holders of the public debt (e.g. the holders of government
stock). The government can also gain via the tax system.
4.2.1.2 Economic effects
Inflation has various economic effects which may result in lower economic growth and higher unemployment than would otherwise
have occurred. For example, decision makers in the private sector tend to become more concerned with anticipating inflation than
with seeking out profitable new production opportunities. Inflation also stimulates speculative practices that do not add to the
country's productive capacity.
By reducing the value of existing savings, inflation may discourage saving in traditional forms such as fixed deposits, life insurance
policies and pension fund contributions.
One of the most serious economic effects of inflation is that it can produce balance of payment problems.
Inflation increases the costs of export industries and import-competing industries. If inflation in South Africa is higher than in the
economies of our major trading partners and international competitors, the result will be a loss of international competitiveness,
unless the rand weakens to compensate for the loss.
4.2.1.3 Social and Political Effects
Price increases make people unhappy and different groups in society start blaming one another for increases in the cost of living.
When rents, service charges, bus fares or taxi fares go up, the frustration often gives rise to social and political unrest. Inflation
creates a climate of conflict and tension, which is not conducive to economic growth (Mohr & Fourie, 2005: 541-542).
8
4.2.2 Problems Related to Inflation
More than 25 years ago South Africa had an annual inflation rate of less than 3 percent. For 20 years between 1973 and 1993 we
had a double digit inflation rate - in other words it was never below 10 percent in that period. In the mid-eighties it touched 20
percent at times (Schuitema, 1998:46).
We had an inflation rate of more or less 15 per cent a year for 15 years. At this rate, a trolley of grocery items that would have cost
you R100 fifteen years ago, will cost R800. It means that the R1 of 15 years ago is worth only 12,5 cents. Most people have become
very insensitive to these calculations, because we have by and large been able to keep pace with them in our wage and salary
packages, in addition to which credit has been easier to obtain and lifestyles have changed.
The inflation rate has changed, inflation rose across the third quarter in 2005, with expectations for 2005 rising by 0.2 percentage
points to 4.7 percent .
Inflation has a serious effect on the pricing structure of items and it takes away our 'questioning' role in price movements.
Activity
Why is inflation such an important indicator to watch?
4.3 Interest Rates
There are numerous interest rates, each associated with the borrowing and lending of specific funds. For example, there is the repo
rate (which plays a dominant role in the money supply process), the interbank lending rate, the prime rate of banks, various rates
on deposits, mortgage rates and the rate on government stock. These rates differ as a result of factors such as differences in risk,
maturity, the liquidity or marketability of the instrument, the size of loans and market structure (including market imperfections).
Although all these rates differ and there are sound economic reasons for these differences, the rates nevertheless tend to move in
harmony with each other. Therefore we refer to the "interest rate", it should be regarded as a representative rate for all the individual
rates encountered in practice (Mohr and Fourie, 2005:370-371).
4.3.1 How Interest Rates are Determined?
There is a distinction between the nominal interest rate and the real interest rate. The real interest rate is the difference between
the nominal interest rate and the inflation rate.
For example, if the nominal interest rate is 15 percent and the inflation rate is 10 percent, the real interest rate is (15-10) = 5 percent.
Free market philosophy dictates that interest rates are determined by supply and demand of goods.
Few features of the economy are more complicated than mechanisms to transfer money from those who have to those who want.Out of this process has grown a number of highly technical and involved institutions and instruments, namely the banks, insurance
companies, trust companies, discount houses, the stock market, and their bonds, mortgages, banker's acceptances and Higher
Purchase (H.P.) agreements.
The crux of the matter is that money moves from lender to borrower, or from those that have cash lying idle, to those who want to
use it. Rates are determined on the basis of how many want in proportion to how many have.
9

Banks lend money to their clients and when they run short, in other words when they lend more than they have and can raise, they
borrow from the Reserve Bank at the so-called repo rate. The shortfall is reflected in the shortage on the money markets.
Because interest rates are so important, directly affecting each individual in the country, and because they are flexible and subject
to fairly complex forces, one should be careful when borrowing money. A crucial calculation of the level of an interest rate is how
it compares with inflation. The real cost of money must take into account the erosion of the value of money over a year in the first
place. This is called the real - as opposed to nominal - rate of interest.
4.3.2 Example of the effect of inflation on interest rates
If Joe borrows R100 from Sue for one year at 15 per cent interest per annum, he will have to repay R115 after a year. If inflation is
15 per cent, the purchasing power of the R115 is the same as that R100 a year earlier, meaning no return to Sue, but giving Joe
the use of the R100 for a year at no real cost. This shows that low real interest rates favour borrowers and spenders, and penalise
savers (Schuitema, 1998:57).
Flexible interest rates demand a new level of sophistication from the average consumer. Consumers should, therefore, bear the
following in mind:
• Be aware of which way interest rates are moving when committing to borrowing money;
• Calculate how these movements will affect us, and if rates move up whether we will be able to keep up payments;
• Calculate possible loss of income on interest-bearing investments if rates decline;
• Shop around, and never accept that an interest rate is the one best suited to us, whether as a deposit, or as a loan rate,
including the bank overdraft rate; and
• Be equipped to decide between fixed or flexible rates in different circumstances;
Interest rates, first and foremost, reflect the cost of money. In modern economies, rising interest rates are a reflection of measures
to reduce money creation and dampen demand. Therefore they are always part of any policy to curb inflation. Hence, for businesses
to convert their money costs into higher prices, there has to be an expanding money supply and, if that were the case, there would
not be higher interest rates in the first place. Therefore, business is compelled to scale down operations and consumers are forced
to borrow and spend less.
5. DIFFERENT KINDS OF ECONOMIC SECTORS
We distinguish between the following economic sectors, namely primary, secondary, tertiary and quaternary.
5.1 The Primary Economic Sector
The primary economic sector refers to all those activities based on the direct exploitation of the physical environment, e.g. agriculture,
forestry, fishing or mining i.e. the basic production of food, fish, timber or stone
In the Western Cape the following primary activities are prominent.
• Fishing - aquaculture
• Agriculture - wine farming, Rooibos tea, buchu and other fynbos products, fruit farming, forestry, wheat and livestock.
5.1.1 Labour Trends in the Primary Economic Sector
10

When the labour trends are analysed in the primary sector for South Africa and in particular the Western Cape the following could
be observed.
• Within the primary sectors, employment change was minimal with the total increase in agriculture, forestry and fishing
employment balancing out the decrease in employment in mining and quarrying.
• Within agriculture, while the large decline in the share of those in the unskilled farming occupations explained most of the
labour demand trends, there were significant shifts at the higher-end of the job ladder. There was a notable increase within
this sector for Transport workers, whose share rose by over 2000 %, representing 130 000 new jobs.
5.1.2 Agriculture
The Western Cape's agriculture is distinguished in several ways from that in the rest of South Africa, largely because of the
difference of physical resource. The winter rainfall region of the Boland and the year-round rainfall of the Southern Cape provide
agricultural conditions that make the crop mix and productive potential unique. A main feature of the region's agriculture is production
stability. Agriculture is one of the primary pillars of the Western Cape economy. Although the province contributes some 14 % to
the country's Gross Domestic Product, it generates about 23 % of the total value added of the agricultural sector in South Africa.
Agriculture accounted for 5.2 % of the Western Cape's Gross Regional Product in 2001. As many as 11 commodities contribute
significantly to agriculture production. Diversity of agricultural enterprises also contributes to agriculture's general stability.
Agriculture is an important employer in the Western Cape, providing jobs to 13 to 14 per cent of total employed provincially as
opposed to eight per cent nationally. Production processes are also more labour-intensive than in the case nationally, and worker
remuneration is higher (farm workers in the Province earn 24 per cent of all farm wages yet account for only 18 per cent of all farm
workers in South Africa). The incomes of farmers are also higher.
Agriculture, together with the production of food and beverages, is one of the main pillars of the Western Cape economy. It is a
significant exporter and has been a primary contributor to the export boom of recent years. The two largest categories of exports
of the Province are agriculture, i.e. fresh, dried and processed fruit (19.4 % of total Provincial exports) and wine, beer and spirits
(12.5 %), both of which have strong growth potential.
Various topographic features divide the province into a number of sub-regions, each with its own distinct climate. There are seven
main climate zones.
While there is agricultural activity in the Cape Metropolitan area, including some high value enterprises, the economic and social
character of this sub-region is definitely urban.
The South coast sub-region, produces mainly wheat and malting barley in rotation with planted pastures under rainfed conditions.
In the George, Knysna region forestry is important. Large sawmills are found that process the wooden logs. Intensive production
under irrigation of vegetables and hops, mainly in the George area, and irrigated pastures for milk production can be found towards
the escarpment.
The Little Karoo, stretching from Barrydale to the upper reaches of the langkloof, is renowned for its ostrich industry around
Oudtshoorn, the production of deciduous fruit for canning, drying and increasingly export, and for lucerne hay.
The Boland produces mainly deciduous fruit and wine grapes, with Elgin and Ceres being the main centres for apple and pear
production and the Hex River Valley and Paarl for table grapes.
11

The Western Cape's favourable climatic and soil conditions make it home to most of South Africa's wineries, accounting for 90.5
% of production. The gross output value of wine-industry-related firms is R14.6 billion. In 2001, there were 4 390 primary wine
producers and 388 cellars - an increase of 15 % over 1999.
Western Cape wineries have proven competitive, particularly those wineries producing fine wine, a quality at a premium price. The
South African wine industry is encouraging people of previously disadvantaged communities to emerge as winemakers. The Wine
Industry Trust was established in 1999, with funding of R370 million over ten years. One of its responsibilities is investment in 'wine
education' to facilitate entry into the industry.
Wine tourism has potential with 43 % of tourists to South Africa visiting the winelands. The wine industry indirectly contributes more
than R3.5 billion annually to the tourism industry.
The Swartland is confined primarily to rainfed pastures. Sheep and dairy farming are also found in rotation with wheat. Canola is
also planted. A move away from monoculture wheat toward mixed crop-livestock systems is occurring at present and should continue
in the near future.
The Northwest sub-region produces mainly wine grapes and citrus under irrigation along the Olifants River. The rooibos tea industry
has been established around Clanwilliam. The grazing areas, such as those in the Great Karoo, are used for the production of meat,
wool and mohair.
One of the main reasons for the greater contribution of agriculture to the Western Cape economy is the boom in exports. Agriculture's
contribution to South Africa's exports has expanded rapidly. A rapid increase in agricultural exports, mainly from the Western Cape,
has seen this share increase to 8.3 percent in 2002.
5.1.3 Fishing
The fishing industry is a major employer and income generator in the Western Cape. The Province accounts for 70 per cent of
national employment and 71 per cent of income earned from fishing in South Africa. In total, approximately 27 000 people are
employed in the industry in the Western Cape, predominately from historically disadvantaged groups and in jobs of a semi-skilled
nature (Western Cape Provincial Economic Review & Outlook 2005:117).
The key market for fishing is exports, and the industry is the third-largest exporter in the Province after fruit and wine, representing
8.5 % of total Western Cape exports, which have been growing in both mass and value terms in recent years.
Fishing activity in the Western Cape is centred predominantly along the West Coast, that is from Simons Town to Saldanha. The
Western Cape exported fish with a total value of R2 418.4 million, representing 8.5 % of total Western Cape exports and 73 % of
total of South African fish exports
The fishing stocks need to be managed. Fishing quotas have been introduced.
5.2 The Secondary Economic Sector
Secondary economic activities include those human activities in which the form of the original material (the raw material) is
manufactured into a more useful and valuable product. This is where you find your manufacturing industries.
Production is equal to goods plus services.
12

Industries have as many price and market problems as agriculture. It is only when there exists a surplus of productive capacity at
a lower level, to act as a base, that a society can develop at a higher one. To express this in practical terms, if a developing country
diverts labour from fields (agriculture) to industry, the workers on the land must produce food both for themselves and for the factory
workers
When the labour trends were analysed in secondary sector for South Africa the following trends could be observed:
• In the period 1995 to 2002 the secondary employment grew by 16.0 per cent, equivalent to 2.1 per cent annually. Between
them, Manufacturing and Construction added more than 300 000 jobs, while employment in the Utilities sector, which is
very small in terms of employment, was barely changed.
• In the manufacturing, the share of the top two occupations increased dramatically since 1970, while that of production
workers declined and the share of labourers remained constant. There was a large increase in the share of transport employees
in this sector. The number of managers and professionals in this sector increased, by at least 100 % since 1970, while it
was primarily the labourers that lost their jobs (Bhorat, 2004:5).
• While the industries in the Western Cape have suffered from the same slump that affected the country as a whole, there
has been growth of output and employment over the last three years with employment in 2003 being nine per cent higher
than in 2000.
• In many industries, small enterprises are at the heart of growth and dynamism. In South Africa, a recent survey research
has estimated that there are 4.9 million people in the 'small business sector' (in firms with 10 or fewer employees). Often
small enterprises dominate in the more labour-intensive downstream sectors, as well as in industries based on design and
craft skills such as boat-building.
The level of entrepreneurial activity is thus clearly important for the growth of provincial and local economies. It is important to
distinguish between entrepreneurial drive (which may underpin the growth of established firms) from the establishment of new firms.
While new firms have an important impact in creating new employment, increased employment still derives to a great extent from
the growth of established firms. The key challenge is the survival rates of firms once established. This depends on the entrepreneurs,
but also on the environment in which entrepreneurs operate.
In the Western Cape, all owner-managed businesses were estimated to employ approximately 542 000 people, excluding the owner-
managers. Opportunity-motivated owner-managed businesses employed 312 000 people, compared with 53 000 in necessity-based
owner-manager enterprises. The main sector in which entrepreneurial activity occurs is the retail, restaurants and hotel industry.
Thirty nine per cent of established and new firms are is this sector, as well as 47 per cent of start-ups (Western Cape Provincial
Economic Review & Outlook 2005:132).
5.2.1 Prominent Industries in the Western Cape
5.2.1.1 Clothing and Textiles
The Western Cape clothing and textiles sectors are intensive and compared to the other provinces, they have a solid foundation.
Internationally, the clothing industry both expanded and shifted its course dramatically during the 1990s. Clothing is increasingly
considered a perishable good where time to market matters. This will render producers in more remote locations at a disadvantage,
especially in the fashion segments. Retailers increasingly manage the supply chain of both textiles and clothing sectors following
a demand-pull system. Information flows directly from retailers to clothing manufacturers, but also, in many cases to textile plants,
13

where decisions are made on patterns, colour and material.
The textile sector is traditionally far more capital intensive and automated in relation to the clothing industry, consisting of spinning,
weaving and /or knitting and finishing, with these functions often undertaken in integrated plants. The lead times in the textiles
industry are generally quite long and the capital-intensive nature results in large minimum quantities and less flexibility.
Although there are some textile plants that have seen the opportunity of short production runs and quick turnaround times, as well
as those who are able to increase capacity fairly substantially, the textiles sector is generally perceived as being the bottleneck in
the apparel supply chain. Given the commodity type nature of much of the fabric produced for clothing manufacturers, textile firms
in industrialised economies are increasingly producing household and other industrial fabric. Although there have been substantial
losses, employment in the textiles sector in developed countries has generally held up much better than clothing employment.
It is generally perceived that the clothing industry is more suited to developing countries as it offers entry-level jobs for unskilled
labour and that relatively modern technology can be adopted at comparatively low investment costs. Therefore, clothing is suited
as a first rung on the industrialisation ladder in poor countries. However, it has been difficult for poor countries to create backward
linkages in the sector and therefore the import content of the clothing industry is typically high in developing countries. Parts,
components and semi-finished goods often cross the border several times before the final product reaches the consumer, which
means that tariff rates have a multiplicative effect on costs, rendering the industry very sensitive to tariffs.
The South African Textiles and Clothing Industries
Currently South Africa's clothing industry is protected by a tariff rate of 40 % - one of the highest tariff rates for a SA manufacturing
sector and higher than all of the textiles sub-sector tariffs. The following factors have led to a decline in the competitiveness of SA's
clothing and textiles industries;
• Negative growth.
• Declining employment.
• Increased competition because of liberalisation.
• Dumping of cheap and illegal imports.
• A strong South African rand
Meanwhile, competitor countries such as China, Pakistan and Indonesia have been investing in technology and improving their
competitiveness dramatically. The indexed value of inflation-adjusted sales depicted, shows that total manufacturing sales substantially
outperformed both textiles and clothing sales over the period 1998 to 2003. Real manufacturing sales increased rapidly from 1999
to 2002, but declined in 2003. Textile sales declined between 1998 and 2001, experienced positive growth between 2000 and 2002
(reaching its peak of R11.5 billion at the end of 2002) and then fell to R10 billion at the end of 2003.
Employment in the clothing and textile sector
Wesgro (2002) has identified two major trends in relation to clothing industry employment:
• Formal employment has been fairly stable, while informal employment has increased as a result of formal factory downsizing
and the establishment of micro-enterprises, home industries and unregistered firms;
• Formal employment under Bargaining Council jurisdiction has declined as formal enterprises relocated to decentralised areas;
there are lower rates of unionisation due to unemployment pressures; and firms increasingly subcontract and change
relationships from employees to independent contractors.
Official clothing employment has decreased from 125,181 employees in 1994 to 113,464 employees in 2003 - a decline of 9.4 %.
14

Textiles employment increased to its peak of 76,930 employees in 1996, but then plummeted from approximately 76,000 employees
in 1997 to 50,596 in 1998. SA textiles employment recovered slightly in 1999, but by 2003 employment was down to 53,736. In
2003, clothing and textiles only accounted for 4.2 % of total manufacturing sales, but 13.4 % of total manufacturing employment,
thus highlighting the labour intensive nature and thus the importance of the sector to the SA economy (Micro-Economic Development
Strategy for the Western Cape, Research Papers 2005 - Volume A : 17).
Capital Expenditure
When compared to manufacturing as a whole, both textiles and clothing sectors spend only a small proportion of their sale on capital
goods. Even taking into consideration the labour-intensive nature of clothing manufacture, capital expenditure in this industry is
still very low. Being a comparatively more capital-intensive industry, the capital expenditure on new assets for textiles should exceed
that of clothing, which it does, but the textiles industry still significantly lags behind the total manufacturing sector.
Strengths of this Sector
• Many South African firms are very good at adhering to international standards, e.g. labour and social standards (Ralis 2004).
• Cheap utility costs e.g. electricity, in comparison to competitor countries provides SA firms with an advantage, particularly
in the textiles industry which is a major user of electricity.
• The industry has some government support programs, such as DCCS
• The Western Cape firms are in a better geographical position than firms in other provinces because of closer proximity to
major export markets (i.e. shipping times from Cape Town to North America and the EU are shorter than from Port Elizabeth
or Durban). Many of the local retailers have their head offices in the Western Cape and the majority of clothing firms are
located in this region.
• Textile and clothing firms that presently make up the industry have already proven their capabilities to a large extent as they
have survived the trade liberalisation of the 1990's.
• The textiles and clothing industries have well-established relationships with buyers in Western Europe (especially the UK)
and North America.
Weaknesses
• Many firms relied on the weak currency to be competitive in the export markets. The volatility and current strength of the
Rand makes this a disadvantage for firms.
• Labour rates and ancillary labour costs (e.g. overtime, sick leave) result in a higher labour cost in SA when compared to
many competitor countries such as China, India, Pakistan and Indonesia (Ralis 2004, Economist Intelligence Unit).
• South Africa's geographical location (to the US market in particular) is a disadvantage as the proximity from exports markets
increases lead times dramatically and hampers firms' ability to respond to customer needs.
• SA clothing and textiles manufacturing have relatively low productivity and inefficient manufacturing processes.
• There is a critical shortage of management, as well as technical skills especially pertaining to textiles and a lack of training
in both the textiles and clothing industries. A major problem is that there are no adequately skilled people to replace those
who retire.
• The industry has a negative attitude and is unwilling to change, invest and take risks in order to survive in the current
economic climate.
• Co-operation amongst manufacturers in both industries, as well as along the value chain is not common.
• The clothing manufacturers' bargaining power with retailers is very poor.
• A lack of capital expenditure has resulted in outdated equipment. Unless firms invest in capital, technology and innovation
SA will not be able to be internationally competitive.
• Although there are some proficient textile firms, the quality and delivery of fabrics is often not satisfactory.
15

• The development of new fabrics is slow in the textiles industry and some high quality fabrics (e.g. lightweight synthetics)
are not produced in SA. Limited innovation is further hampered by the lack of co-operation and innovative ability of yarn
suppliers.
On the basis of the current trends, both internationally and domestically, the Western Cape clothing and textiles sector faces extremely
serious challenges in the coming five years. Firms should significantly internalise the principles of world class manufacturing and
recognise the importance of upgrading.
5.2.1.2 Metals and Engineering
While the metals and engineering sectors have not been part of the Western Cape's historical manufacturing base, the Western
Cape's proximity to the coast, a relatively good skills base and the importance of Saldanha as ore-export harbour have created a
new competitive niche for these industries in the Western Cape.
The tooling industry and foundries, in the Western Cape has a long history of successful small to medium-sized enterprises, that
are well-adapted to demand niches and top-quality output. The yacht-building industry is viewed as a great success.
5.2.1.3 Oil and Gas
The Cape Oil and Gas Supply Initiative (COGSI), is currently the only identifiable institution in the Western Cape constituted formally
to promote an upstream oil and gas (UOG) cluster. COGSI specifically sees its role as promoting, the supply of services, the repairs
and maintenance of offshore installations and vessels and the fabrication of pre-assembled units.
5.2.1.4 Electronics
Electronics firms in the Western Cape contribute about a quarter of total sector output in the country. More than 70 firms are activein
the sector of which the large majority are small and medium-sized enterprises that manufacture components. The industry focuses
on niche applications. South Africa's first satellite, produced by the University of Stellenbosch, is a high profile example.
5.2.1.5 Biotechnology
Biotechnology is one of the key technologies promoted by the South African Government. The Western Cape hosts one of three
regional innovation centres (BRIC) plus the Bioinformatics Network at UWC. There are a sizeable number of research groups in the
province. There are less than 20 firms with core activities in biotechnology. The activities of the firms range from research into plant
properties to life sciences, which is why the activities of this sector in the Western Cape are so diverse.
5.2.1.6 Crafts
Although not a huge sector, the craft sector in the Western Cape is a labour intensive sector, is very Small Medium Micro Enterprises
SMME based, has a high concentration of national enterprises in the Western Cape and contributes significantly to the region's
revenue generation.
The total number of enterprises is estimated at 2010 (with 1662 producers and 348 retail outlets) employing 7165 people. Seen
from a national perspective 27 % of all producers in the country are estimated to be located in the region, whilst an overwhelming
proportion of retailers (60 %) are found in the Western Cape. This sector has significant linkages to the tourism sector and acts as
an important drawcard for tourists. It exhibits greater diversity than most other sectors. Materials, specific techniques, scale of
production and product types and quality may vary significantly. Market positioning also varies from functional items to fashion-
16

led items and gifts and souvenirs to collectibles or craft art. Most producers operate on micro or small scale. Production is oriented
towards mid-to-high end pricing, with a very diverse product range. Enterprises are linked into established and local and global
value chains and hence intermediaries play an important role.
The craft sector is thus making a meaningful contribution to the provincial economy, in particular in terms of enterprise development.
It appears that the sector may be particularly important to women and new entrants to the formal economy as a "stepping stone"
to other activities. It also has an impact on enhancing the attractiveness of the Province as a destination by creating unique retail
and cultural experiences.
A key sectoral institution in the province is the Cape Craft and Design Institute(CCDI), originally set up local and provincial government
in collaboration with the Peninsula Technikon. The CCDI plays a critical role in coordinating various activities, initiating projects and
representing interests.
In conclusion the following can be observed there has been a decline of the manufacturing industry in the Western Cape.Once a manufacturing 'heartland', the Province has now shifted the emphasis towards tertiary services. This has had aparticularly severe impact on manufacturing employment in the Province, particularly in the clothing and textile industry.
Diagram 3: Western Cape sector contribution to GDPR, 1995 - 2003
5.3 The Tertiary Economic Sector
Tertiary economic activities are concerned with the provision of various types of services. The main economic functions of these
services are to facilitate the provision and consumption of tangible products. Professional services are rendered, people who are
trained for a profession, for example, teachers, nurses, doctors and attorneys.
In South Africa the labour trends in this sector were the following: managers and professionals saw their numbers increase; in all
four sectors, apart from community and social services, the share of service staff increased; the share of labourers again declined;
and, in the case of two sectors the actual number employed fell (Bhorat, 2004:5).
17

In the broader national context, Gauteng and the Western Cape have the highest provincial labour force participation, due most likely
to their urbanised nature.
By far the largest formal sector in the Western Cape in terms of employment is the tertiary sector, which in 2003 employed over
one million people. Provincial employment expansion has far outpaced national employment expansion in the internal trade sector
(averaging 4.6 % per annum, compared to 0.4 % per annum nationally), but employment in the finance sector grew slightly slower
in the Western Cape than it did nationally (4.6 % per annum versus 5.2 % per annum).
The internal trade and catering sector benefited from tourism, which has been a fast growing sector in the Western Cape. The
proportionately larger financial and business services sector in the Western Cape benefited from the property boom and the recovery
in asset markets following the 2000 global meltdown in the ICT sector.
Generally, the employment growth in the Western Cape in the tertiary sector has equalled or surpassed the country as a whole.
Finance, Insurance and real estate (FIRE) is responsible for almost one-third of provincial investment. Financial services have
grown in the Western Cape. Rapid growth of over 6 percent per annum over the period 1995-2003 has resulted in the financial
service sector's share of provincial GGP to 13.8 percent. What is of particular significance is the very high levels of investment. There
are two key sub-sectors in which the Western Cape has a particular strong presence, notably asset management and, more
importantly, insurance.
Financial services employment in the province is heavily skewed towards insurance with 58 percent of the labour force, while the
banking sector provides 31 percent and the securities trading segment 11 percent. The Western Cape has one-third of the national
labour force in the insurance branch.
The three branches of financial services have a broadly similar occupational structure; about half the labour force in clerical and
sales occupations where the entry requirement is matric. About one fifth are technicians and associate professionals and another
fifth professionals. Senior management comprise ten percent. Coloureds fill a very large proportion of the technical and clerical jobs
in insurance. Women are well-represented at the top of the occupational ladder.
Three of the top five insurance head offices are in the province (and ten insurance companies in total), but only one domestic bank
and one foreign bank. Most stockbrokers have Western Cape branches rather than head offices, but eleven of 26 management
companies are based in the province.
Call Centres and Business Process Outsourcing (BPO) is already a significant industry in the Western Cape. There are 100
companies employing 11 000 people and it is growing rapidly, 25 percent in 2004. This is a labour intensive industry and labour
costs, by comparison with our competitors, are high. There is a distinct possibility of creating up to 20 000 new call centre "seats".
Together with associated employment opportunities in management and support and utilising an employment multiplier of 3.5 job
creation could be in the order of 92 400.
Information and Communication Technologies (ICT) is an area of considerable growth potential. The longer-run potential has
been much enhanced with the recent announcement of further measures of liberalisation in this sector. The ICT sector is an area
where there are strong institutional underpinnings of active players and organisations. It is a sector that whose growth and development
promises many positive externalities and benefits to other sectors. ICT can provide business opportunities for many small players
and there are growing signs of black advancement.
ICT has immediate implications for schooling methods and the need to ensure that all school leavers are computer literate.
18
Tourism is spanning both domestic and international travel and is world-wide in a long-term expansion phase. The Western Cape
is often viewed as South Africa's most developed tourism region, with contribution of travel and tourism to the provincial economy
close to 10 percent in value added and in employment. This sector has grown and broadened steadily over the past decade and it
now includes an amazing range of well-developed tourism and leisure-market segments, including, sight-seeing-, cultural and
heritage-, sports-, adventure-, events and conference-, youth-, coastal/marine-, health and medical- and special interest tourism.
The Western Cape has six of the country's top ten international tourist attractions or icons. A further strength of the Western Cape's
tourism sector is its relatively wide geographic spread, reaching virtually all the corners of the province from Plettenberg Bay at
the eastern edge of the Garden Route to Lamberts Bay and Vredendal in the north-west and Beaufort West along the N1 route north.
The mix of tourist places range from the Cape Town metropolis with its many attractions to medium-sized tourism jewels like Knysna
and Ceres, and small coastal resorts like Stilbaai and Arniston. This diversity with many of the tourism niches still in the process of
being "discovered" and developed to their real potential, adds to the national and international attraction and growth potential of
the tourism industry in the Western Cape.
The service sectors, on the whole are more skills-intensive than the secondary or primary sectors. Hence, any growth in these
sectors will result in a skewed preference for those individuals with a greater quantum of human capital. The onset of the
microelectronics revolution, epitomised by greater computer usage, has spurred on this preference within services for higher skilled
individuals.
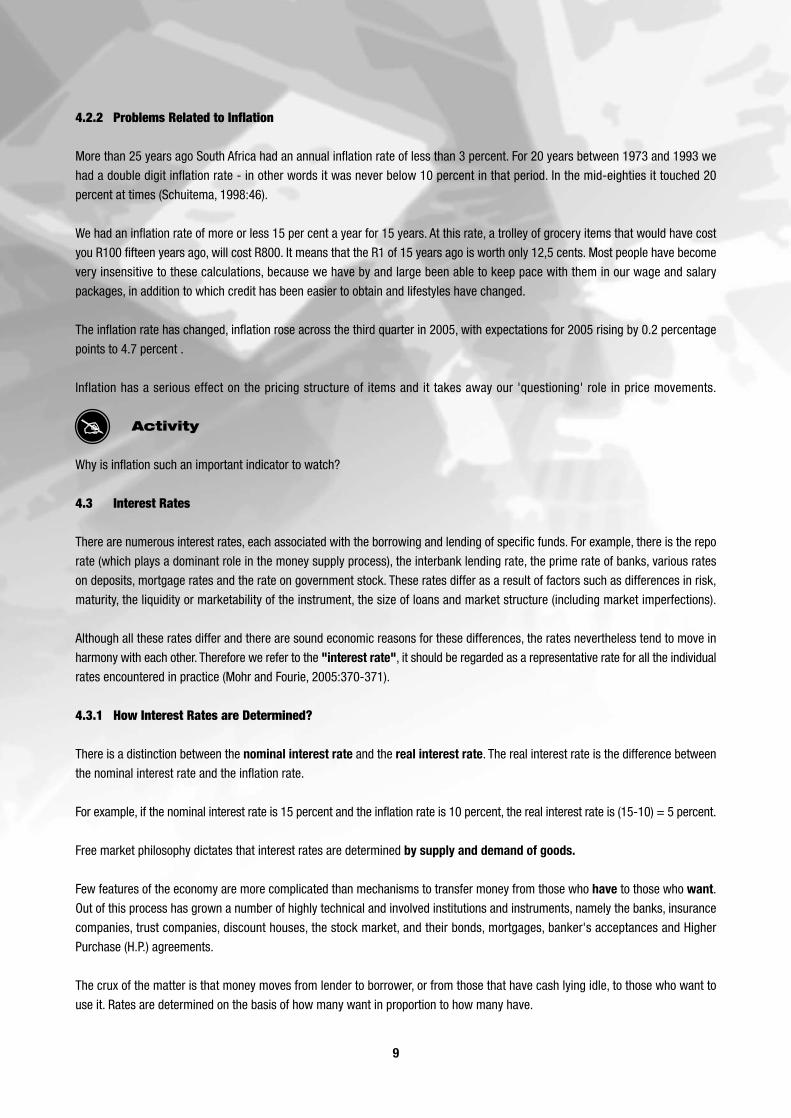
5.4 The Quaternary Economic Sector
Quaternary economic activities are closely connected to tertiary activities and basically also refer to services. They refer specifically
to that group of services which require advanced training, e.g. research. This is the supply of mainly intellectual services to the
community, as in administration, research, education or finance.
Diagram 4: Employment Expansion by Sector, 1995-2002 (Bhorat & Oosthuizen, 2005:21)
19

6. THE ENVIRONMENT AND ECONOMIC DEVELOPMENT
In South Africa, as in other countries, there is an unequal distribution of economic activity (income and wealth) between the various
provinces, regions and cities. On a provincial basis, Gauteng, KwaZulu-Natal and the Western Cape contribute by far the largest share
of the South African GDP. As far as metropolitan areas are concerned it is estimated that Johannesburg, Cape Town, Durban, Pretoria
and the East Rand together contributed more than 53 per cent of the GDP in 2000 (Mohr & Fourie, 2005:91).
The environment impacts greatly on economic development. The Western Cape relies greatly on agriculture, fishing and tourism,
while mining is prominent in Gauteng .
The coastal location of the Western Cape and the opportunities that arise from it is favourable for economic development. The
opportunities are not only in exports, but also in deepening international links around investment, technology and production networks.
The challenge is to translate the opportunities into output growth and employment in relative labour-intensive areas of manufacturing
and other sectors.
The geographical distribution of economic activity in South Africa has strong racial and political overtones. The disparities between
rural and urban areas and even more between the metropolitan areas and the rest of the country have given rise to large-scale
movements of people to the more developed and dynamic urban areas
One of the first features to consider when examining a country's resources is its geographical location. Generally, the location of
South Africa at the southern end of the Africa continent is not so favourable, but despite of this the economy has shown great
potential.
South Africa can produce a variety of agricultural products because the variety of climatic conditions allows farmers to grow a variety
of crop and to rear all types of livestock.
7. CHARACTERISTICS OF LEVELS OF ECONOMIC DEVELOPMENT
Geographers and economists have identified a range of common economic, social, cultural and political attributes of the developing
countries. The discussion that follows shows, in general terms only, the position of the developing countries and the developed
countries with respect to certain of such characteristics. The discussion serves to highlight what has generally become known as
the development gap between the rich and poor countries.
7.1 Relative characteristics of development
7.1.1 High levels of development
• Per capita incomes are high (above R1875 per capita per month) and capital are readily available
• There is a comparatively even distribution of wealth within individual countries (e.g. in the USA 10 % of the population owns
27 % of the national wealth).
• Manufacturing and service industries dominate national economies.
• A very small proportion (under 10 %) of population engaged in agriculture.
• Farming is mostly commercial, efficient and highly mechanised. Farm holdings are generally large and crop yields high.
• Populations are predominately urban, with over 70 % living in towns.
• Women are increasingly being treated on equal terms with men, and children with adults.
• Birth and death rates are low and life expectancy is high. The population structure is stationary or regressive and there is
20
often a high proportion of people over 60 years of age.
• There are generally adequate supplies of food, allowing for balanced diets. In fact, overeating is sometimes a problem.
• There is a surplus wealth with investment in poorer countries and capital and high technology are exported.
• There are good medical services, generally good social conditions with adequate housing space and a high level of public
health facilities and sanitation.
• The infrastructure is highly developed
• There are highly developed educational facilities and low levels of illiteracy.
7.1.2 Low levels of Development
• Per capita incomes are low (below R174 per capita per month) and capital is scarce.
• There is an uneven distribution of wealth within individual countries.
• Primary industries dominate national economies.
• A high proportion (over 70 %) of population engaged in agriculture.
• Farming (apart from plantation agriculture) is mostly at the subsistence level and is characterised by inefficient methods
and underemployment. Farm holdings are small, mechanisation is limited and crop yields are low.
• Women held an inferior position in society.
• Populations are predominately rural, with over 80 % living in the countryside.
• Birth and death rates are high and the life expectancy is low. The population structure tends to be progressive with a high
proportion of children.
• Diets are inadequate or unbalanced, resulting from relatively low output of protein foods. Hunger and malnutrition are
common.
• There are balance of payments deficits and international debts. Importers of capital and high technology.
• There is a high incidence of diseases and poor medical services. Social conditions are very poor with overcrowding, poor
housing, few public services and bad sanitation.
• The infrastructure is poorly developed.
• There are poor educational facilities and high levels of illiteracy, which hinder scientific and technological advancement.
Activity
What do you think is the position in the Western Cape?
8. THE LABOUR MARKET AND JOB CREATION
The South African economy today faces some important challenges. Probably the most important is the challenge ofgenerating job opportunities in sufficient numbers to halt and then reduce the rise in unemployment.
The division of labour among the employed population of any country reveals something of the level of economic developmentof that country (Paterson, 1976:37).
8.1 Elements of the Labour Market
Those who supply labour to the market constitute the labour force. As only individuals between the ages of 16 and 65 years
are legally eligible for the labour force, the size of this age-group or cohort plays an important role in determining the size of the
labour force.
21

The labour force or economically active population is the total supply of labour in a country that is available to participate in
the production of goods and services. It therefore comprises everyone who is willing and able to work. Individuals sell their labour,
through the labour market while earning incomes that enable them to purchase the goods and services they require.
The economically active population includes both employed and unemployed persons. It also includes the informal sector and the
formal sector. The size and growth of the economically active population or labour force are determined by the size and growth of
the population and the propensity to participate in the labour force.
Like any other market, the labour market is a link between potential sellers (suppliers) and potential purchasers (demanders).
Individuals (or households) supply their labour services to firms and the government, who hire these services at a price, called wages
and salaries. Labour services are embodied in the persons concerned and are therefore not transferable to other people (Mohr &
Fourie, 2005:315).
Labour markets are typically characterised by trade unions, employees' associations, collective bargaining and governmentintervention. Labour is intrinsically heterogeneous and unlike goods it cannot be classified or standardised. There are a variety of
labour markets, each with its own features. For example, there are different markets for different occupations, different skills and
different geographical locations. The labour market is therefore often described as a segmented market. Each segment has its own
particular characteristics and workers cannot in the short run, move freely between different segments. There can thereforesimultaneously be a shortage of labour in a certain segment of the market and an oversupply in another segment.
Labour is an important factor of production. The cost of labour is the largest cost factor in the economy. Changes in the cost factor
of labour therefore have a significant impact on cost and price trends in the economy. The cost of labour depends on the wages
and salaries paid to workers and the productivity of labour.
The remuneration of labour is affected by a number of factors which are not directly related to labour market conditions, for
example, taxation and views as to what constitutes a living wage or a reasonable standard of living. The remuneration of labour
can take different forms, for example wages, salaries, bonuses, commissions, fees, allowances, royalties, overtime payments and
fringe benefits (e.g. housing subsides, car allowances, medical and pension fund contributions).
8.2 Demand and Labour Supply in the Western Cape
There has been an increase in the labour force and this causes a demand for labour. Employment of women has increased more
rapidly than that of men. Employment absorption has been almost twice as high amongst women, at 35 per cent, reflecting the
increased feminisation of the South African work force. However, the relatively high rate of employment absorption amongst females
obscures marked racial differences. A comparison of employment absorption amongst African and White males reveals a substantial
gap in the employment absorption rates between African females and White females (31.4 per cent versus 75.5 per cent respectively)
and between African males and White males (14.3 per cent versus 51.7 per cent respectively). This means that target and actual
employment growth are most closely matched for White females and least for African males. The rapid growth in the number of
female labour force participants is evidenced by the target employment rate for African females of 115.0 per cent, indicating that
employment would have had to more than double to accommodate the net increase in the number of African females.
It has been shown that economic growth has been unable to provide the necessary employment opportunities, resulting in a rapidly
rising rate of unemployment, which stands at 41,8 percent of the labour force (Bhorat & Oosthuizen, 2005:52). The problem has
been exacerbated by the high number of new entrants into the labour force participation rates rising across the board. This has
meant that actual labour absorption has been far lower than the rates required just to keep unemployment levels constant.
22

At provincial level, the Western Cape's labour market performance holds brighter prospects when compared against its national
counterpart. Since 2000, nearly 200 000 jobs were created in the Western Cape at a rate of 4 percent per year. This has seen that
the province raise its share of national employment from 13 percent to 15 percent (Western Cape Provincial Economic Review &
Outlook 2005:20).
Unfortunately, although employment growth has been above the national average, unemployment in the province has expanded at
a more rapid rate. This trend sees the official (narrow) unemployment rate rising from 17.1 percent in 2000 to 20.6 percent in 2003
and the broadly defined unemployment rate rising from 22.6 percent to 26.1 percent respectively.
In-migration has changed the demographics of the Western Cape. It has also resulted that there is an increase in unemployment.
The flow of individuals to the province from other provinces appears to be motivated primarily by brighter employment prospects
and higher incomes in the Western Cape relative to the sending provinces, with the largest single stream of migrants originating in
the Eastern Cape.
The flow of African in-migrants into the Western Cape has been described as the largest and most rapid demographic flow into South
Africa. Migrants come from Nigeria, Zimbabwe, Botswana, Erithrea and other African countries. Each in-migrant has a unique set
of characteristics and this means that they place demands on the province in different ways.
Slow employment growth relative to labour force growth, has resulted in both official and broadly defined unemployment rates rising
between 1995 and 2002. The official unemployment rate has risen from 17.6 percent to 30.5 percent, while broad unemployment
had increased from 30.8 percent of the labour force to 41.8 percent (Bhorat & Oosthuizen, 2005:3).
The labour force growth translates into a combination of two phenomena, namely increased absolute employment and/or increased
absolute unemployment. While employment has expanded, it has not been able to keep pace with labour force growth, meaning
that the increase in the labour force has largely translated into increasing unemployment.
The following data are used in employment analysis;
• The October Household Surveys (OHSs)• The Labour Force Surveys (LFSs)
The October Household Surveys (OHSs) were Statistics South Africa's first major household surveys conducted on a national level
that included the former homelands and self-governing territories. These surveys were conducted annually in October between 1995
and 1999. The surveys collected a variety of information, including demographic, living conditions, education, health, social security,
migration and labour market information.
In 2000, the OHS was discontinued and subsumed into the new LFS, which provides the most comprehensive house-hold based
look at labour force of any survey of its magnitude currently undertaken by Statistics South Africa. The LFS is conducted twice each
year in February/March and September. The LFS has as its primary focus the labour market, although it also collects much of the
information previously collected in the OHS.
23

This inability of the economy to create jobs at the same pace at which the labour force has been growing is clearly stated in the
following table
Diagram 5: Employment and Labour Force Growth, 1995 - 2002 - Bhorat & Oosthuizen, 2005:9).
The table compares employment, broad and narrow unemployment and the total labour force over the seven years between 1995
and 2002. Growth in unemployment over the period has been rapid, with the rates of broad and narrow unemployment growth
exceeding that of employment growth by factors of 5.5 and 8.7 respectively.
8.3 Expansion of the Labour Market
The bulk of employment expansion between 1995 and 2002 occurred in the tertiary sectors which added more than 1.1 million jobs,
equivalent to an average annual rate of 2.6 percent per annum. Three sectors added jobs at a rate higher than the tertiary sector
average, namely, Finance, Internal Trade and so-called Private Households (the Domestic Worker sector). Employment in Finance
expanded by three-quarters over the period, representing an increase of 440 000 jobs, while the growth in the Internal Trade sector
of 500 000 jobs occurred at a rate of 30.5 percent (or 3.9 percent annually). While employment expansion in Finance and Internal
Trade was most rapid, these sectors also accounted for a net increase of almost 950 000 jobs over the period.
According to Chamberlain and van der Berg (2002:5) the individual can choose to participate in the labour market. This choice will
be affected by several factors such as the individual's preferences, location, level of education and general circumstances. The
individual's choice to participate does not guarantee employment. The selection into employment may be influenced by the same
factors as the choice to participate, but also by other factors such as demand for labour and the characteristic of competing
participants.
24

Diagram 6: Demographic Characteristics of the Employed, 1995 and 2002 (Bhorat & Oosthuizen, 2005:28)
Urban areas have proved more able to create the jobs required by the growing labour force. The bulk of the labour force was located
in urban areas, with less than 38 percent in rural areas in 2002 (Bhorat & Oosthuizen, 2005:6).
Like other markets, the labour market functions through the interaction of supply and demand. Individuals supply or offer their labour
to the market. Firms and other potential employers source or demand labour from the market.
Western Cape employment growth between 2000 and 2003 has been relatively rapid but has not been high enough to absorb all
new labour market entrants. Employment growth has been most rapid amongst Africans, females and older age-groups (36 to 55
years), although Coloureds, males and older individuals filled most jobs. The Province is also experiencing a clear trend towards a
more educated workforce, with two-thirds of net employment expansion occurring amongst holders of matric certificates and the
share and levels of employment of individuals with no education, or incomplete or complete primary education, declining.
Despite this trend, in occupational and broad skill-level terms, most employment growth occurred at the middle and lower end of
the skills ladder. The tertiary sector has been the main driver of employment expansion in the province, accounting for more than
two-thirds of the provincial total increase, with internal trade and community, social and personal services the key factors. At the
same time, employment in the Province has become more formal as the informal sector shed jobs and the formal sector employment
grew rapidly.
A key determinant of labour is the size and structure of the population. As the Western Cape is a recipient of in-migration, the size
and age profile of the present Provincial population, as well as the numbers and characteristics of individuals migrating into the
Province, are important factors that determine the present and future Provincial labour supply.
The following diagram represents the age pyramid for Western Cape and South Africa, 2001
25

Diagram 7: Age pyramid for Western Cape and South Africa, 2001(Western Cape Provincial Economic Review & Outlook 2005:139)
Although the pyramid shows that the Provincial population is relatively young in that less than 15 per cent is older than 50 years,
relative to the country as a whole the Province's population is slightly older. The Western Cape pyramid is broader at higher age-
groups, particularly between the ages of 26 and 45 years. Approximately two-thirds (66 %) of the population is between the agesof 16 and 65 and is therefore of working age. Children aged 15 years or younger constitute 29 per cent of the Province's population.
Interestingly, the five age-groups between six and 30 years of age are similar in size, indicating that the working age population in
the Province is likely to grow as these relatively large age-groups grow older and enter the working age population, while fewer
older individuals exit the working age population. This change will filter through to the labour force, and the Provincial economy will
therefore remain under significant pressure to create jobs for the foreseeable future.
In order to address the rapidly increasing unemployment rate, it is key for analysts to focus on understanding the reasons underlying
the dramatic increase in labour force participation in a relatively short period, particularly in this context in which unemployment
has been high and rising for an extended period of time. The South African economy has experienced 'jobless growth' during the
expansionary phase.
Jobless growth may refer to a situation whereby the overall economy is growing, but the absolute employment level is stagnant
or falling, rendering near-zero or negative employment rates. Alternatively, the term may be used to describe a situation whereby
the overall economy is growing, while the rate of unemployment is rising, but the absolute employment level is stagnant or falling,
rendering near-zero or negative employment growth rates. Alternatively, the term may be used to describe a situation whereby the
overall economy is growing, while the rate of unemployment is rising, equating to employment growth lagging labour force growth
(Bhorat & Oosthuizen, 2005:14).
Structural change in the economy will impact on labour requirements between sectors. As product demand patterns vary, some
sectors expand while others contract. Technological structure changes, such as the increased preference for capital over labour,
effect the quantity and level of skills required within a sector itself (Poswell, 2002:9).
26

There has been much debate in South Africa over the past decade concerning national employment and unemployment statistics
(Casale, Muller & Posel, 2005:1). The macro-economic strategy named Growth, Employment and Redistribution (GEAR) was
unveiled in 1996 (Bhorat & Oosthuizen, 2005:1). This strategy predicted employment growth averaging 270 000 jobs per annum
from 1996 to 2000, with the number of new jobs created rising over time from 126 000 in 1996 to 409 000 in 2000 (GEAR 1996).
Unfortunately, for a variety of reasons, these projections were not realised.
The South African labour market faces the problem of falling quality of employment with the rise of low paid, insecure and unprotected
employment in the formal sector.
Diagram 8: Target and Actual Employment Growth, 1995-2002 (Bhorat & Oosthuizen, 2005:11)
8.4 The Need for Employment Creation
The Western Cape launched its own projects locally for employment creation and alleviation of unemployment. These projects, which
will be discussed later, are
• RED Door,
• PLEK Plan
The Contribution of Small, Medium Micro Enterprises (SMME) to Employment creation.
There are two main reasons for starting up a small business, namely:
• A business may be started to take advantage of some opportunity that exists in the market;
• An individual may have no other option but to start some kind of business in order to support themselves and their families.
SMMEs are either opportunity-motivated or necessity-motivated.
27
Necessity-motivated businesses are likely to be engaged in less productive, lower remunerating activities than opportunity-motivated businesses. Necessity is more likely to motivate women in the Western Cape than men when starting businesses, while
Whites and Coloureds most often found opportunity-motivated businesses. Amongst businesses started by African entrepreneurs,
though, necessity and opportunity motives are equally prevalent. As a result, one can expect that the returns on their businesses
for Africans and females will be lower than for Whites, Coloureds and males.
Efficiently targeted policy requires the identification of entrepreneurs; who starts businesses?
Men are 1.4 times more likely than women to be self-employed, with the September LFS estimating 6.8 per cent of men between
the ages of 15 and 65 years are self-employed. Amongst Coloureds, Asians and Whites, males, on average are three times more
likely than females to be self-employed.
Owner managers with matric certificates also tend to employ more additional workers than those without. The age groups 25- to
34- year olds in the Province are most likely to be involved in start-up and new businesses, while 45- to 54-year olds are most likely
to be engaged in established business activities.
The survival of small businesses is to be seen as a key criterion according to which pro-SMME policy can be judged, as well as
being crucial to the expansion of employment in this sector. Although it is not possible to track small businesses accurately over
time at a national level, the Western Cape is fortunate to have a relatively good source of information on small business survival in
the form of the Regional Services Council (RSC) Levy data for the Cape Town Unicity, containing 40 000 accounts of businesses
and institutions paying the levy. While almost 4 000 new levy-payers are added to the database annually, equivalent to about one-
tenth of the total, a similar number is dropped due to de-registration, liquidations or dormancy (the dti, 2004). On average, though,
the database grows by between one per cent and four per cent per year, a range may be under-estimated due to the inclusion of
low turnover institutions such as schools and hospitals.
Those firms with the longest life-spans are generally found in agriculture (13.4 years), manufacturing (11.7 years), and construction
(11.6 years). At the other end of the scale, firms that do not survive for very long tend to operate in transport and communication
(8.5 years), internal trade (9.1 years) and finance (9.7 years). The dti (2004) finds that the most vulnerable firms, as defined by being
those with the shortest average life-spans, are restaurants and businesses operating in the leisure and information technology sub-
sectors, where the average lifespan is, at most, between four and five years.
Recommendations for the SMMEs
• Steps need to be taken to encourage individuals to establish small businesses and raise the rate of participation in this sector.
• Quality should not be sacrificed for quantity, and policy should seek to promote the most viable and sustainable forms of
small business activities where possible.
• The Province's Human Resource Development Strategy is also key in this regard, as it should help to foster entrepreneurial
talents and help to equip individuals to identify opportunities.
• It should be important to ensure that younger businesses reach the established phase of development.
8.5 Challenges Facing the Labour Market
• In the Western Cape the labour force is likely to experience continued growth as the number of young individuals joining
the working age population exceeds the number of older individuals leaving this group.
• Migration is likely to continue to play an important role by impacting on the demographic composition of the population, as
well as the skills distribution of the labour force.
28

• Migration is one of the important challenges facing policy-makers, particularly since a large proportion of migrants slot in
at the 'lower end' of the socio-economic distribution of the population, making the absorption and re-skilling of lower skilled
labour key to the realisation of Government's ideals for the Province.
• Women also appear to find it more difficult than men to secure employment.
• To solve the problems of racism, social conflict and violence in the competition for employment (job opportunities).
• The youth appear to be marginalised from the growth in job opportunities in the Western Cape, as is the case nationally.
This is cause for great concern, not least because young labour force members are not able to use skills they have, leading
to an erosion of skills and preventing a transfer of knowledge and expertise from older workers through employment
experience.
• Employment growth is required across the skills spectrum and particularly amongst less skilled occupations if inequality
levels are to be reduced via the labour market.
9. UNEMPLOYMENT
The question arises what is meant by unemployment?
There is a broad and a narrow definition of unemployment
The narrow definition refers to all those people in the labour force who are jobless and have actively looked for work oversome previous time period (typically a week to a month).
Broad unemployment includes all those without a job who claim they would like to work, even if they have not exhibitedany search effort in the stipulated period - the so-called discouraged workers (Poswell, 2002:6).
Unemployment is a costly phenomenon. It entails a variety of costs both to the unemployed and to society at large. To keep
unemployment as low as possible, jobs must be created at a sufficient rate. This, in turn, requires a well-disciplined, productive
workforce and a steady expansion of aggregate demand (Mohr & Fourie, 2005:314).
9.1 Reasons Why People are Unemployed
The following are reasons for unemployment:
• The person may be a new entrant into the labour force, looking for work for the first time, or a re-entrant, returning to the
labour force after not having looked for work for some time;
• A person may leave a job in order to look for other employment and will be counted as unemployed while searching;
• The person may be laid off. A lay-off means that the worker is not fired but might return to the old job if the demand for
the firms' product recovers;
• A worker may loose a job to which there is no chance of returning, either on account of being retrenched (or fired) or because
the firms closes down (Mohr & Fourie, 2005:562)
Seasonal unemployment occurs when people only work for certain seasons of the year, for example in the agricultural sector, during
harvesting many workers are needed but for the rest of the year there is no work for them.
When the growth in the labour force is greater than the growth in the number of job opportunities, unemployment increases. In South
Africa the rapid increase in the unemployment rate in the past two decades originated from the supply side of the labour market
as well as the demand side. A large number of workers (approximately 350 00) entered the labour market each year, but few new
job opportunities were created in a stagnating and declining economy.
29
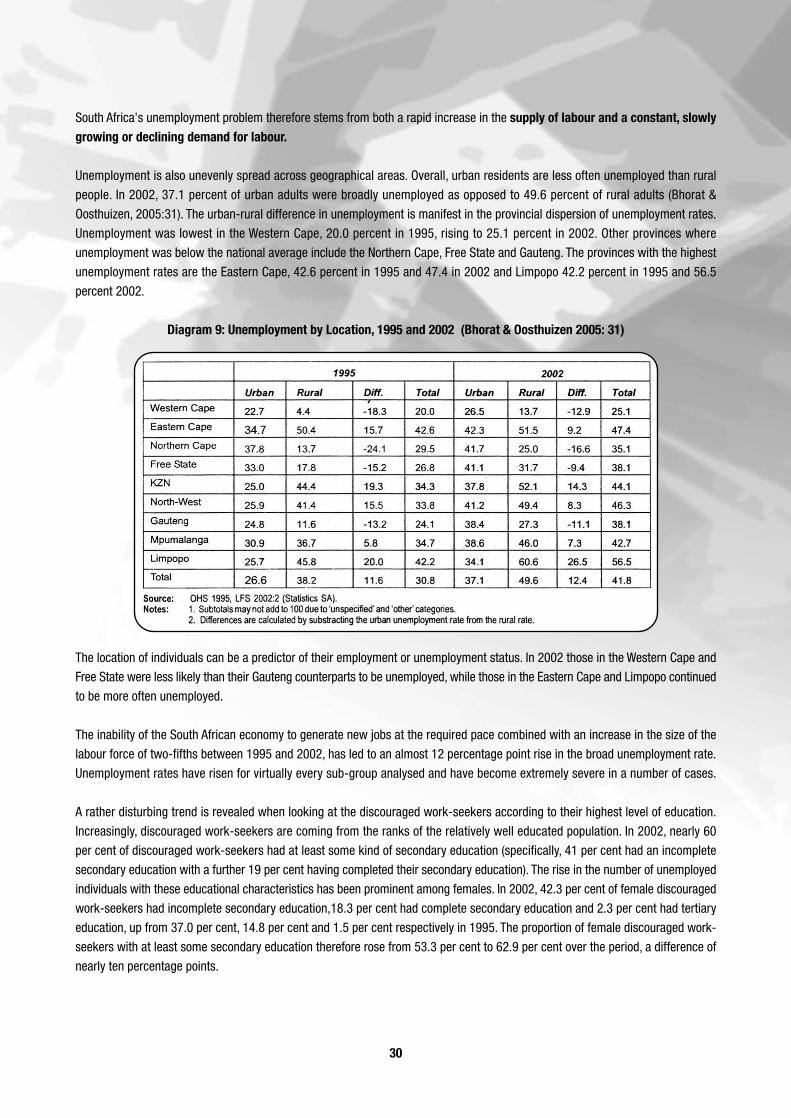
South Africa's unemployment problem therefore stems from both a rapid increase in the supply of labour and a constant, slowlygrowing or declining demand for labour.
Unemployment is also unevenly spread across geographical areas. Overall, urban residents are less often unemployed than rural
people. In 2002, 37.1 percent of urban adults were broadly unemployed as opposed to 49.6 percent of rural adults (Bhorat &
Oosthuizen, 2005:31). The urban-rural difference in unemployment is manifest in the provincial dispersion of unemployment rates.
Unemployment was lowest in the Western Cape, 20.0 percent in 1995, rising to 25.1 percent in 2002. Other provinces where
unemployment was below the national average include the Northern Cape, Free State and Gauteng. The provinces with the highest
unemployment rates are the Eastern Cape, 42.6 percent in 1995 and 47.4 in 2002 and Limpopo 42.2 percent in 1995 and 56.5
percent 2002.
Diagram 9: Unemployment by Location, 1995 and 2002 (Bhorat & Oosthuizen 2005: 31)
The location of individuals can be a predictor of their employment or unemployment status. In 2002 those in the Western Cape and
Free State were less likely than their Gauteng counterparts to be unemployed, while those in the Eastern Cape and Limpopo continued
to be more often unemployed.
The inability of the South African economy to generate new jobs at the required pace combined with an increase in the size of the
labour force of two-fifths between 1995 and 2002, has led to an almost 12 percentage point rise in the broad unemployment rate.
Unemployment rates have risen for virtually every sub-group analysed and have become extremely severe in a number of cases.
A rather disturbing trend is revealed when looking at the discouraged work-seekers according to their highest level of education.
Increasingly, discouraged work-seekers are coming from the ranks of the relatively well educated population. In 2002, nearly 60
per cent of discouraged work-seekers had at least some kind of secondary education (specifically, 41 per cent had an incomplete
secondary education with a further 19 per cent having completed their secondary education). The rise in the number of unemployed
individuals with these educational characteristics has been prominent among females. In 2002, 42.3 per cent of female discouraged
work-seekers had incomplete secondary education,18.3 per cent had complete secondary education and 2.3 per cent had tertiary
education, up from 37.0 per cent, 14.8 per cent and 1.5 per cent respectively in 1995. The proportion of female discouraged work-
seekers with at least some secondary education therefore rose from 53.3 per cent to 62.9 per cent over the period, a difference of
nearly ten percentage points.
30

Although discouraged work-seekers are predominately poorly educated with around 80 per cent not having completed matric, there
is also an increasing proportion that have completed secondary or tertiary education, a group which is often assumed to be more
able to find employment than less educated individuals.
To combat unemployment, steps need to be taken to limit the supply of labour and to stimulate the demand for labour
One of the greatest challenges of the South African economy is to generate job opportunities in sufficient numbers so as first to
halt the rise in unemployment and then reduce it. There are increasing numbers of highly educated people without employment.
This represents one of the most important challenges facing government, ensuring that the education system produces the mix of
skills required by the labour market, as well as ensuring quality education at all educational institutions.
9.2 The Effects of Unemployment
The following are some of the effects of unemployment
• The unemployed also suffer psychological costs, enforced joblessness is demoralising and results in a loss of confidence
and self esteem;
• Increased unemployment tends to result in an increase in psychological disorders, divorces, suicides and criminal activity;
• Unemployment also means a loss of experience and human development. Workers become unaccustomed to using their
skills and may even lose them. When they apply for a position, workers who have lost their jobs may find it difficult to compete
with others who are simply changing jobs or who are entering the labour market for the first time;
• Included amongst the unemployed are people who have never been able to find employment. This is the most serious aspect
of unemployment in South Africa. If new entrants to the labour market cannot find a job, they often resort to crime to survive;
• Unemployment is also a loss to society. Unlike other factors of production, labour cannot be saved and used later. If labour
is not used when it is available it is lost forever;
• Unemployment is also damaging to the social and political structure. It tends to give rise to crime as well as demonstrations,
riots and other violent forms of unrest;
• In South Africa there appears to be a strong correlation between criminal, social and political violence and the level of
unemployment.
10. POVERTY REDUCTION AND ALLEVIATION
10.1 Defining the Concept of Poverty
People live in poverty when they do not have enough resources to live according to a 'minimum living standard'.
A distinction is made between absolute and relative poverty.
Absolute poverty is used to describe the material conditions of people who earn less than a specific amount of money (less than
$ 1 per day), R174 per month, or has less belongings, especially food and shelter.
Relative poverty describes the economic position of people who lack resources to enjoy healthy diets that enable them to participate
in activities and to maintain a living standard that is customary or that is promoted or is approved by the society to which they
belong.
Relative poverty refers to the comparative economic position of individuals or groups. For example it can be said that, in comparison,
31
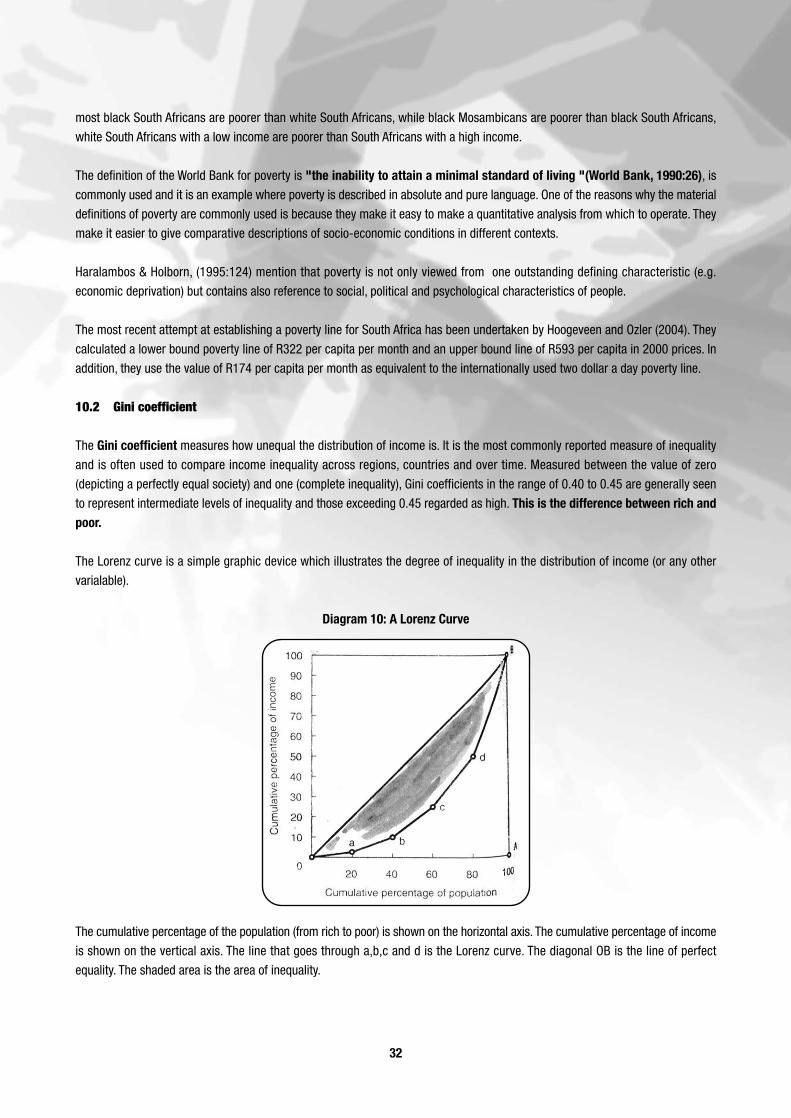
most black South Africans are poorer than white South Africans, while black Mosambicans are poorer than black South Africans,
white South Africans with a low income are poorer than South Africans with a high income.
The definition of the World Bank for poverty is "the inability to attain a minimal standard of living "(World Bank, 1990:26), iscommonly used and it is an example where poverty is described in absolute and pure language. One of the reasons why the material
definitions of poverty are commonly used is because they make it easy to make a quantitative analysis from which to operate. They
make it easier to give comparative descriptions of socio-economic conditions in different contexts.
Haralambos & Holborn, (1995:124) mention that poverty is not only viewed from one outstanding defining characteristic (e.g.
economic deprivation) but contains also reference to social, political and psychological characteristics of people.
The most recent attempt at establishing a poverty line for South Africa has been undertaken by Hoogeveen and Ozler (2004). They
calculated a lower bound poverty line of R322 per capita per month and an upper bound line of R593 per capita in 2000 prices. In
addition, they use the value of R174 per capita per month as equivalent to the internationally used two dollar a day poverty line.
10.2 Gini coefficient
The Gini coefficient measures how unequal the distribution of income is. It is the most commonly reported measure of inequality
and is often used to compare income inequality across regions, countries and over time. Measured between the value of zero
(depicting a perfectly equal society) and one (complete inequality), Gini coefficients in the range of 0.40 to 0.45 are generally seen
to represent intermediate levels of inequality and those exceeding 0.45 regarded as high. This is the difference between rich andpoor.
The Lorenz curve is a simple graphic device which illustrates the degree of inequality in the distribution of income (or any other
varialable).
Diagram 10: A Lorenz Curve
The cumulative percentage of the population (from rich to poor) is shown on the horizontal axis. The cumulative percentage of income
is shown on the vertical axis. The line that goes through a,b,c and d is the Lorenz curve. The diagonal OB is the line of perfect
equality. The shaded area is the area of inequality.
32

Gini coefficients move extremely slowly over time. Even fairly rapid change in the income ranking of certain individuals or households
can coincide with surprisingly little change in the overall income distribution if these changes occur at both ends of the income
distribution and, hence, cancel each other out. For instance, income distribution patterns will widen if those at the higher end of
the income spectrum improve their prospects more than those at the lower end of the income scale.
Inequality in South Africa is exceptionally high and, if anything, has worsened in the period from 1995 to 2000. Use of the Gini
coefficient analysis in this respect, however, should be interpreted with care. Calculating the Gini coefficients by province for 1995
and 2000 shows that inequality has increased across the board. In 1995, in relation to other provinces, the Western Cape, was the
third least unequal province with a Gini coefficient of 0.584, following Mpumalanga (0.582) and Gauteng (0.545) and in 2000 the
least unequal with a Gini coefficient of 0.616 (Western Cape Provincial Economic Review & Outlook 2005:27-29).
Diagram 11: Gini coefficients by province, 1995 and 2000 (Western Cape Provincial Economic Review & Outlook 2005:29)
With labour market earnings being the key driver of inequality in South Africa, rising unemployment coupled with improvement in
average real earnings in the Western Cape would be expected to lead to a widening of the income distribution.
This means that the Gini coefficient and/or complementary inequality analysis should be carefully interpreted, as there are many
casual factors to rising inequality that may or may not have to do with increased poverty levels.
10.3 Poverty Reduction and Economic Development
Poverty reduction and alleviation are main priorities in economic development.
Poverty is a real problem in the Western Cape. For the Western Province to formulate and implement successful, well-targeted
policies aimed at reducing poverty it is important to identify exactly who the poor are and which groups are most prone to beingor becoming poor (Oosthuizen & Nieuwoudt, 2002:1).
Those groups most afflicted by poverty are identified by describing their characteristics. This will be done by focussing on the location,
demographic and economic characteristics of the poor, as well as the characteristics of the heads of poor households.
33

The average annual household income for the Province as a whole was just under R13 300 per person, while average household
expenditure was just over R13 050 per capita. This compares favourably with the national average of per capita income and
expenditure of almost R8 980. Significant variations between regions in the Western Cape occur. The Winelands (mean per capita
household income/expenditure of R15 769), CMA R15 121 and Overberg (R14 973) are the richest regions, followed closely by the
West Coast (R14 380). The remaining regions are below the provincial average, with the Breede River (R8 321) and Central Karoo
(R7 271) below the national average (Oosthuizen & Nieuwoudt, 2002:3).
Considering the actual poverty rates for the Western Cape, the groups of concern are Coloureds and Africans. Even at extremely
low poverty line of R174 per month, between 15 per cent and 18 per cent of Africans in the Western Cape were poor in 2000. At
the same level, approximately eight per cent of the Coloured population was also poor. At the R322 per capita poverty line we see
an alarmingly high 45 per cent to 50 per cent of Africans poor in 1995 with the range rising to 50 per cent to 56 per cent in 2000.
An extremely high one in three Coloureds was also classified as poor in 1995, by this standard, and although this number drops
impressively in 2000, it is still a high one in four. These estimates put the number of poor in 2000 at almost 600 000 Africans and
610 000 Coloureds.
The Western Cape's poor as well as the ultra poor are most likely to be found in the peripheral Breede River, South Cape, and Central
and Klein Karoo regions. Although households in rural areas are more likely to be poor most poor and ultrapoor households are
situated in urban areas. In general, ultrapoverty rates are significantly lower in the Western Cape than they are in the rest of the
country, although the elderly in the country as a whole have a higher poverty rate than other adults.
For a poverty profile to properly characterise the poor, appropriate measures of poverty need to be applied. Although poverty usuallyentails much more than merely lacking sufficient means to purchase basic goods and services (including all aspects relatedto a households well-being such as vulnerability), it is common practice to utilise monetary measures in determining theextent of poverty in any given population (Oosthuizen & Nieuwoudt, 2002:4).
The minimum cost of eliminating poverty is the amount required to raise the incomes of the poor to the level of the poverty line. In
the Western Cape, the total elimination of ultra poverty would theoretically cost R44.5 million annually, while eradicating relative
poverty in the province would cost more than R2.5 billion.
According to Statistics South Africa, in 1995, it is estimated that approximately 28 % of households and 48 % of the population were
living below the estimated poverty line. This was calculated on the basis of expenditure, thus excluding access to services and
assets. In 1999, there were 3.7 million such households out of 11.4 million (just under 33 %) living below the poverty line
A study that was undertaken by Van der Berg & Louw (2003) draws the following conclusion. Rising black per capita incomes over
the past three decades have narrowed the interracial income gap, although increasing inequality within the black population seems
to have prevented a significant decline in aggregate inequality and poverty in the latter part of 2000. Analysis also reveals that it is
unlikely that rising intra-racial inequality has been sufficiently large to increase the proportion of the population living in poverty,
given the upward trend in per capita incomes. At least by money-metric measures, poverty appears to have been relatively stable
in terms of the poverty headcount and using a poverty line of R3 000 per capita per year (2000 Rand values). The number in poverty
has increased only because of a growing population (Van der Berg & Louw, 2003:21).
Who are the poor?
In identifying the poor, the focus is on the location, demographic and economic characteristics of the poor, as well as the characteristics
of the heads of poor households. According to the international analysis households of one dollar per person per day (the ultrapoor)
- while the poverty line for household level analysis is one dollar per person per day.
34
Region: Although one in five CMA residents are poor, this region's poverty rate is the lowest in the province, with more than 35 %
of non-CMA residents classified as poor. The Central and Klein Karoo suffer the highest poverty rates of 56.9 % and 53.9 %
respectively.
As levels of education rise, poverty rates continue to decline, with fewer than 2 % of degree-holders classified as being poor. In
terms of ultrapoverty, it would seem that a secondary education holds the key to lower ultrapoverty rates; individuals with incomplete
secondary education experience an ultrapoverty rate less than half that those with no secondary education, while a Matric certificate
lowers the ultrapoverty rate further. Almost no individuals with post-matric qualifications are ultrapoor (Oosthuizen & Nieuwoudt,
2002).
The agriculture, forestry and fishing sector is the economic sector in the Western Cape, as well as in the rest of South Africa, where
the incidence of poverty is most severely felt. Construction has the next highest poverty rate, but this sector's share of poverty at 9
% is not much greater than its share of employment. Similarly, Community, Social and Personal Services constitute just under one-
quarter of poverty, and also of Western Cape employment. Manufacturing and Wholesale Retail Trade are two sectors with low shares
of poverty relative to employment. Agriculture, Forestry and Fishing and Community, Social and Personal Services, comprising just
over 40 % of employment in the Western Cape, account for 65 % of poverty.
There are a number of initiatives that were instituted to bring about poverty reduction and alleviation and to increase employment.
In the Western Cape, there are the RED Door. PLEK PLAN.
10.4 Poverty Alleviation Strategies
Economic growth is necessary to reduce poverty, but equity concerns are also a critical factor. That is, improving distribution and
enhancing growth should reinforce each other, having a greater impact on poverty reduction.
Improving the long-term growth potential of an economy in turn depends on a more equitable distribution of income, capabilities
and geographic location of communities and economic activity that 'shares' the benefits of growth. This 'sharing' of economic yields
enhances social and economic participation, which in turn feeds back into raising the economy's long-term growth potential.
11. ECONOMIC INDICATORS
Indicators tell you what is (or will be) happening in the economy.
There are a variety of indicators and can be divided into a variety of categories, such as the following:
• Leading indicators - those that help you to predict what is going to happen.
• Coinciding indicators - those that confirm trends or support information already found elsewhere.
Indicators can be divided into two broad categories, i.e. those that are a reflection of the economy on a day-to-day basis and those
that help reveal major trends in the economy and, possibly, big shifts in economic policy. The latter are normally revealed monthly,
or sometimes even only quarterly.
11.1 Daily Indicators
These are broadcast on television every night, they can also be found in the daily newspapers and in specialist magazines.
35

Diagram 12: Daily IndicatorsThe following are examples of the daily indicators:
11.2 Trendsetting Indicators
These are mostly released once a month, or sometimes only quarterly. They do not appear at the same time, so that keeping track
of them may be difficult. Their relevance and importance vary according to the state of the economy.
11.3 Other Indicators
Other indicators are of a more "coinciding" nature, such as the economic growth figures and employment. Some are useful in
gauging levels of economic activity and therefore can help show whether policy is on target or not.
11.4 The Influence of Economic Indicators
Indicator watching has become a key element in international economics and in the individual economic policies of the various
nations.
Economists and the public watch the daily indicators to monitor their investments. Indicators like the monetary exchange rate for
example the dollar-rand, dollar- Japanese yen and rand-euro influences, the import and export of the various commodities.
36

Movement in the gold price has a fundamental impact on the economy. Gold makes up by far the biggest single economic activity
in South Africa. A sharp fall will put downward pressure on the rand and upward pressure on domestic interest rates. Conversely, a
rapidly rising price will strengthen the exchange rate and tend to depress interest rates. There's a direct link between the world
gold market and your monthly bond repayments (Schuitema, 1998:91).
Rand-Dollar and Dollar-Japanese Yen.
The American dollar is the world's most important currency and all international currency prices are basically determined in relation
to it. The movement of the American dollar has a direct influence on the gold price. The dollar makes up a third of the weight of
foreign exchange currency influence on the rand and all foreign exchange transactions are done with the dollar as "lead" currency.
Thus if one buys euro or yen, the rand is first converted into dollars and then the dollars into the other currencies to get the so-
called "cross-rate". Major prices in the South African economy, like gold and oil, are quoted in American dollars.
Sharp movements in the dollar abroad put a perspective on the performance of the rand itself and will not necessarily imply upward
pressure on interest rates, for example, should the rand fall because of the dollar's international strength. A consistent decline in
the dollar will signal the likelihood of interest rates going up and increase in the prices of those items which are fully or partially
imported. On the other hand, if there is not a strong enough response in interest rate adjustment then the likely outcome is going
to be higher inflation and that should also help us decide about certain buying and investment strategies (Schuitema, 1998:92).
11.5 Bankers' Acceptance (BA) Rate
The B.A. rate is a very useful indicator of the underlying trend in interest rates. An increase in the B.A. rate is always followed by
increases in both the prime rate and the bond rate. Should this 'margin' fall below three per cent, we should prepare for an increase
in the prime rate. Should the margin widen to beyond five per cent a fall in the prime looks likely.
The B.A. rate is based on foreign trade. When a company exports goods it only receives payment six months later. If they are short
of cash they can ‘discount’ the trade bill, i.e. sell their loans to a bank. The bank’s margin on it is expressed as a percentage of the
B.A.rate.
11.6 Stock Exchange Indices
At one stage, these were very useful barometers of economic confidence in the country. Today they do little more than reflect the
performance of the stock market. One could argue that today the indices have been turned on their heads because, perversely, they
have become mirrors of a lack of confidence in other, longer-term investments and barometers of inflationary fears. The Johannesburg
Stock Exchange is pivotal to all investments. Its performance has a direct bearing on the yields of most financial and investment
institutions and, in turn, it strongly affects the performances of pension funds, retirement annuities, life and endowment policies
and unit trusts.
Watching the indicators will enormously enhance your awareness of what is happening around you and help you to makefar more economically sensible decisions.
Activity
Why do people watch the daily indicators?
Choose any three indicators from today’s paper and discuss what they tell you.
37

12. ETHICS
Empirical research by economists has generally been concerned with its measurement in terms of income, economic indicators,
developments and consumption. There has been little attempt to discuss the concept of utility, or welfare, that people are assumed
to derive from income and consumption (Kingdon & Knight, 2005:1). There has been little discussion on ethics involved when
transactions in economic development are being undertaken.
The Ethics that Govern Economic Development?
At societal level, values are generalised conceptions of a particular and acceptable moral order that will promote some form of social
cohesion between members of a society. Moore (1963:93) says that values provide a rationale for particular norms, or rules of
organisation and conduct.
The value of economic growth requires, for example, a fairly high degree of individual mobility and a placement systemgrounded on merit in performance and that requirement is likely to come into conflict with a number of strongly supportedvalues relating to the primacy of kinship position and obligations as a moral virtue.
Human ethical issues are complex. These include deciding and acting, reflecting and contemplating, sustaining habits over time,
nurturing character, and many other kinds of activities. This process is part logic, part acts of will, part tuning of emotional sensibilities
and part feast of imagination. When people are involved in interactions as is the case with economic transactions, ethical issues
are involved. These ethical issues are important in our young democracy and should not be avoided. There can be a kind of ethical
relativism, where morality is left to the "inherent goodness" of human nature. Values like integrity, honesty, industry, hope and
patience are needed for a sound economic environment.
Economic research on the well-being of people is sparse and recent, but growing rapidly. Research that was done in this regard
reported the following.
• Happiness increases with absolute income, ceteris paribus, but not proportionately and at a diminishing rate.
• Differences in income explain only a small proportion of the variation in happiness among people.
• Happiness depends in part on the gratification of certain absolute biological and psychological needs (Kingdon & Knight,
2005:2).
Perceptions of relative deprivation are expected to reduce well-being. It is also possible that perceptions of relative advantage will
raise well-being. A person's position in the income distribution may govern happiness. Well-being might be responsive to income
ranking over the range. Absolute and relative incomes are not the only economic determinants of well-being. Being unemployed is
found to reduce well-being independently of its effect on income. Having a higher risk of becoming unemployed reduces well-being.
Another indication of economic insecurity is inflation, countries and periods with higher inflation display lower well-being, ceteris
paribus. Subjective well-being is influenced by several factors that are non-economic or potentially so, such as age, sex, marital
status, health status, education, social capital, religion and social and political institutions.
Inadequate physical functioning (such as hunger, lack of shelter and lack of warmth) may cause unhappiness. It is also plausible
that adequate social functioning (such as alienation, shame and lack of self-respect) causes unhappiness. When an individual's
income rises from a low level, well-being rises as the extent of both absolute and relative poverty is reduced, when physical functioning
is achieved, a further rise in income can still raise well-being if social functioning is improved.
When transactions between parties are undertaken there are always ethical implications. The terms Moral hazard and adverseselection are normally used.
38

Moral hazard occurs when one party to a transaction has both the incentive and the ability to shift the cost of its behaviour onto
the other party. The classic example is insurance contracts which cause those who are insured against certain risks to take risks
that they would have avoided if they had not been insured. In this way the cost of the insured person's behaviour is passed on to
the insurance company. This raises social costs and causes inefficient allocation resources (Mohr & Fourie, 2005:391). Another
example is when people drive carefully before they receive insurance than they would after they have received insurance.
The problem of moral hazard is also related to the principal-agent problem. Suppose you ask an attorney whether you need legal
assistance, a doctor whether you require medical treatment or a mechanic whether there is something wrong with your car's engine.
In each case you, as the client, face moral hazard, since the service providers all have financial interest in providing answers that
will encourage you to buy their service. Moreover, it is difficult (and costly) for you to find out whether their advice is appropriate.
Adverse selection exists when the parties on the one side of the market, who have information not known to others, self-select in
a way that adversely affects the parties on the other side of the market. The classic example again relates to the insurance market,
in which people most at risk tend to buy the most insurance.
Adverse selection occurs in other markets as well. A well-known example is the used car market, where adverse selection tends
to cause an increase in the supply of bad cars and a decrease in the supply of good cars. The problem arises because the sellers
know more about the conditions of the cars than the buyers.
The concept of poverty requires a value judgement to what constitutes a good life or a bad one. The individual's own perception of
well-being is less imperfect, or more quantifiable, or both, as a guide forming that value judgement than are the possible approaches
(Kingdon & Knight, 2005:8).
The new research on the economics on well-being (happiness), although still in its infancy, does indeed offer promise ofsuccessful adaptation for the analysis of poverty in poor countries. Income and well-being are positively correlated butthat the association is not exclusive. Income enters positively and significantly into the subjective well-being function butso also do several other variables. These include proxies for the fulfilment of various needs which cannot normally be metby spending income. Many of the variables that determine income also determine subjective well-being, but their effectscan differ in relative importance and even in direction.
13. INCENTIVES THAT CONTRIBUTE TOWARDSECONOMIC DEVELOPMENT
There are several incentives that citizens of a country can do to contribute towards economic development. One of them is savings
and investments.
13.1 Savings and Investments
It is an accepted principle that savings should equal at least 10 % of one's income. In the highly simplified economy, households
can only do two things with their income; they can save it or they can spend it. All income is either spent (on consumer goods or
services) or saved.
Motive and purpose are very important when examining one's savings and investments. One's approach can be divided into three
categories, i.e.:
• Longer-term security.
39

• Regular income.
• Short and medium- term capital gain.
Owning your own home fits each of the categories. It gives you long term security because it is known to have the best record of
all, over time, in beating inflation and showing high capital growth. It is tax free; it saves you rent, thereby, in a reverse sense at
least, giving you monthly income or saving you monthly expense. Short-terms gains are also possible by investing tax-free in your
bond when they are low.
13.2 Long-Term Security
Pension and provident funds, retirement annuities and life endowment policies fall into this category. They are, by their nature
intended to preserve our standards of living when we are retired. The sensible thing to do is start with your pension and determine
the likely benefits from your pension or your provident fund.
Life assurance
Technically, of course, life assurance should not fall under 'investments' unless the policy is linked to an endowment or some or
other pay-out facility without death.
Regular Income
Regular income is an important consideration for everybody. Here one can include a whole host of popular 'saving' instruments
regularly promoted by the financial institutions. They range from meagre returns on transmission accounts to attractive rates on
fixed deposits and even more attractive rates on instruments on such as participation bonds and gilts.
14. GLOBAL / INTERNATIONAL ECONOMIC DEVELOPMENT
World economic growth accelerated across a broad base during the second half of 2003 and early 2004. The International Monetary
Fund IMF estimates that the world economy expanded at an annualised rate of six percent during the second half of 2003 and this
growth momentum continued during the first quarter of 2004.
It is widely accepted nowadays that the most successful, economies are those that have strong economic links with the rest of the
world and are able tot compete successfully in international markets. Economies that cannot compete tend to stagnate or decline.
Exports, imports and international capital movements have all been important in the development of the South African economy.
The global economy has a significant influence on the economic development in the Western Cape. The Western Cape being a coastal
Province is ideally situated for imports and exports. One of the most significant spatial dimensions of global growth is that coastal
economies have tended to grow significantly faster than hinterland economies. This is true globally, for fast growing Asia, as well
as for Africa. Coastal regions have grown far more rapidly in Africa than the hinterland.
The principal factor underlying the enhanced economic performance of coastal regions is that their location allows for easier
engagement in the global economy, particularly if, as is the case of the Western Cape, it sits astride established trading routes. Global
trade and commerce have consistently expanded at much more rapid rates than growth in global GDP. Similarly, the growth in South
Africa's exports significantly exceeds its growth in GDP. For the Western Cape, the rise in exports has exceeded the growth rate of
the regional economy.
40

Globalisation of economic development is characterised by the following processes:
• A rapid expansion of global trade in manufacturing and services fuelled by the systematic reduction in international barriers
to trading, and secondly, a major shift in the global dispersion of industrial production towards locally owned and/ or managed
firms in developing countries, especially in respect to products with high labour intensive components. Manufactured exports
grew rapidly from developing countries, accounting for more than 70 % of all their merchandise exports by 2000, as compared
to 20 % in the 1970s and 1980s (UNCTAD, 2002:51).
• In sub-Saharan Africa, exports of manufactured products exceed agricultural exports.
• Throughout the developing world there has been a pervasive shift away from resource-based manufactured products to low-
tech manufactured products.
• A new layer of dynamic Asian Economies (principally China and India) has emerged, impacting on the manufacturing sectors
of the developing economies, especially Africa.
• These Asian economies have a cheap labour advantage but are also highly competent in production performance; hence,
their export drives are carving out a huge global terrain especially in lower end manufacturing goods (e.g. clothing). A major
reason has been their ability to not only meet the production standards dictated by the global value chain drivers, but also
to continuously cut prices for low technology products, hence cutting global market shares of producers in other developing
countries.
• There has been a general global fall in prices of low tech manufactured products since 1990.
This global dispersion of production offers new export opportunities to manufacturers in the Western Cape, but only if they meet
the exact technical requirements, operational parameters, and pricing structures specifies by their global value chains.
14.1 The Global /International Shift to Knowledge-Intensive Activities
Within global value chains knowledge intensive functions and activities- 'branding', 'marketing', 'design', 'research and product
development', 'logistics', 'organising sourcing', managerial skills', financial services' are increasingly important. The further up the
value chain or more knowledge intensive (hence complex) the activities, or meeting specialist standards, or producing branded
country of origin products, the greater the financial gains and wage income returns.
Value chain transactions require sourcing arrangements involving obligational relationships. There is a major organisational/logistics
function between the various chain links, ensuring adequate sourcing, meeting technical parameters and achieving chain
competitiveness. Hence those firms who organise relationships (a knowledge intensive function) are in an extremely good position
to appropriate high rents and income.
Industrial development is increasingly more dependent on the transmission and acquisition of appropriate knowledge. Information
communication technology (ICT) is transforming business by enabling customers to access information about new products and
suppliers, revolutionising distribution and supply chain management, and enabling a much tighter integration in the management
of inputs and design to marketing and sales.
Continuous innovation in design, manufacturing processes, and marketing has become the driving force of successful economies
- and innovation requires accelerating knowledge intensity. Economists increasingly argue that countries specialising in technologically
rich (i.e. call centres) will experience faster growth than those that do not. This is in particularly important for developing countries
and regions unable to compete using cheap labour.
International competitiveness is, therefore increasingly based on the capacity to master information technology, to exploitall of the knowledge resources available, and to innovate.
41

14.2 Globalisation and Tourism
Globalisation has also produced a massive movement of people across national boundaries. Between 1990 and 2001, global tourists
doubled from 325m to 688m, and the value of earnings from tourism rose from US$256bn to US$426bn (Kaplinsky 2005). International
and domestic tourism combined is estimated to generate up to 10 % of the world's GDP and international tourism is the world's
largest export earner. Globally, international tourism outstripped exports of petroleum products, motor vehicles, telecommunications
equipment, textiles or any other product or service. Travel and tourism are also important job creators, employing an estimated 100m
people globally. Globally, employment in tourism is growing one and a half times faster than any other industrial sector, mostly in
SME sized, family-owned enterprises.
Globalisation has focussed attention on competitiveness, as destination countries fight for market share, while tourists have become
more sophisticated in their destination choice and expectations. The structure and operation of the global industry consists of tour
operators, travel agents and transport services selling integrated packages to tourists, containing complex linkages to various tourist
activities. The more diversified a destination's portfolio of products, services and experiences, the greater its ability to attract different
tourist segments.
Two recent tourism studies of Africa show that tourists to Africa are not solely interested in sun, sea beaches holidays, but are
travelling to experience Africa's culture, wildlife and diversity. The availability of Internet and IT tools play an increasingly important
role both for the visitor and the tourist business.
A major development governing destination competitiveness and sustainability is establishing broad community participation, effective
co-ordination and support between all stakeholders. These tourism forums enable the many parts of the industry to work together,
compete more effectively, and design and implement public consultation so as to ensure that stakeholders are involved in making
tourist-related decisions.
14.3 The Effect of Global/International Participation on Poverty and Inequality
Deeper engagement in the global economy does not necessarily increase employment opportunities or reduce poverty and inequality.
Simply participating in price based global markets, and consequently being continually faced with having to reduce prices through
lowering wages, or participating in the wrong markets and being forced out by more competitive countries can result in a deepening
of poverty.
The policy issue is therefore not whether to participate in globalisation, but rather how to do so in a way which producessustainable income growth and spreads the gains throughout income groups.
The policy challenge is devising appropriate strategy levers so that firms and sectors do not rely on low wages as the basis for a
competitive position, but rather seek to lever the region's capacities in dynamic knowledge-intensive activities.
14.4 Summary of International Trends
International trends can be summarised as follows:
• As we have already discussed the coastal regions grow faster, hence, economic growth in the Western Cape has been faster
than the rest of the country.
• Global trade is growing faster than the GDP.
• There is a global division of labour. The global value chains have been discussed and also the dispersion of production,
42

manufacturing, marketing and tourism.
• China and India have been emerging as cheap and efficient markets.
• Competitiveness is increasingly based on capacity;
• To master Information Technology IT
• To exploit knowledge resources
• To innovate
15. ECONOMIC DEVELOPMENT IN AFRICA
Development challenges facing the African continent are most succinctly captured through a variety of poverty and inequality
indicators, either over time or in comparison with other regions of the world. These measures of welfare will elucidate, at least
initially, on how the performance of African economies have not been able to deliver a sufficient quantum of jobs to the population
of working age, and as a consequence have generated the extraordinary levels of indigence on the continent (Bhorat, 2005:1).
Africa's struggle to overcome poverty and the effects of natural disasters in the medium term could be energised by positive
demographic changes that are defying HIV/Aids.
Job creation is one of the main economic issues in Africa. If there are not enough job opportunities poverty will increase. While there
is a less clear set of answers on the relationship and interaction between economic growth, poverty and inequality - a stronger and
more widely accepted correlation does exist between economic growth and levels of absolute poverty.
For countries in Africa where positive income growth is reported, levels of poverty will fall as a result, but this reduction will be
intermediated through simultaneous changes in the distribution of income. If income growth is not sufficiently high, the distributional
shifts may in fact reverse any poverty gains. For the numerous economies on the continent where negative income growth is reported,
this invariably means an increase in poverty given that inequality is very unlikely, under the existing circumstances in Africa, to
decline.
15.1 Labour Market Dynamics in Africa
The data available is uneven both in terms of quantity and quality across individual countries in Africa. Despite difficulties, on the
basis of the available data, there are some important deductions that can be made concerning the nature and character of the African
labour market.
The labour force data by gender indicates that across all regions of the world, the share of women in the economically active
population either increased or remained constant. This supports the international evidence, of how the changing structure of production
in developing and developed countries has lowered the barriers to entry for women into the labour market.
A positive feature for Sub-Saharan Africa, in this context is, that the region does have a large proportion of women in the labour
force, which is indeed higher than the international average. The steady growth in the labour force and the predicted increase in
this rate to 2010, does mean that it remains a huge challenge for policymakers concerned with the region to ensure that the
environment and conditions are created to match the growth in labour supply with an expansion in labour demand (intermediated
through economic growth) in the region (Bhorat, 2005:16).
Coupled with the growth in the population of working age, it is necessary to determine the extent to which these individuals are
likely to be working or seeking work in the labour market. In this case, the participation rate of the economy is an indication of the
pressure on a given economy or region to ensure that sufficient labour absorption is occurring to minimise the incidence of joblessness.
43

15.2 Economic Development in sub-Saharan Africa (SSA)
According to the International Monetary Fund (IMF), despite the scourge of HIV/Aids, the working age population in Sub-Saharan
Africa is on the rise and should increase substantially in the next 40 years, holding out for welcome prospects for faster growth and
healthier investment.
The IMF predicted that after slowing to 4.8 per cent 2005 from 5.4 per cent in 2004, economic growth in Sub-Saharan Africa should
jump to 5.9 per cent in 2006. The IMF attributed the expected slowdown this year (2005) to weaker rises in non-oil commodity prices
than were enjoyed in 2004, notably in the cotton sector.
It is said that major textile producers such as Kenya, Lesotho, Madagascar, Mauritius and Swaziland had been affected by the
elimination last January 2004 of worldwide quotas on textile trade.
The IMF said that overall growth prospects in 2006 should be boosted by the start of operations at new oil production facilities in
Angola and Mauritania and higher oil production in Nigeria.
There has been a rapid growth in the urban population across sub-Saharan Africa, but this growth should not mask the fact that,
in absolute terms the region is still predominantly rural-based. The upshot from this is that, in addition to focussing on the
microeconomic constraints of greater involvement in the labour market, it is critical that a rural bias be given to interventions aimed
at improving the functioning of output and factor markets in sub-Saharan Africa.
One of the outcomes of the rapid urbanisation of sub-Saharan Africa has been to rapidly alter the nature of labour markets within
urban areas. Rural households have moved to urban areas in search of improved access to incomes. Probably the most important
labour market consequence of this has been the rapid growth in the informal sector in urban areas around the region.
People of working age account for just under 55 per cent of the overall population. In 1990 that figure was close to 50 per cent.
The growth in working people could help strengthen growth prospects if these additional workers are absorbed into the labour force.
Since workers have a higher propensity to save, their earnings could also help finance investment and raise output.
The IMF stressed that for sub-Saharan Africa to take full advantage of the growing trend, there should be a "vibrant private sector-
based" economy in place, founded on open trade and administrative transparency.
15.3 Poverty and Inequality in sub-Saharan Africa
Internationally SSA has the highest incidence of poverty. Headcount indices, recorded from the period of 1981 and 2001, indicate
that across all points in time close to a third of the region's population were classified as poor (Development Policy Research Unit
DPRU Policy Brief Series, 2005:3).
The poor in sub-Saharan Africa are relatively worse off than the poor in the rest of the world. Poverty gap measures show the
following:
• The average poor household reaches earnings of only a fifth of the 1$ a day line, which is accepted as the poverty line;
• 46 per cent of the continent's inhabitants survive on less than 1$ a day; 21 % on 0.50$ and 6 per cent on 0.025$, providing
an indication of the vast number of ultra-poor in SSA
• The majority of the world's ultra-poor (those living on 0.50$ a day or less) live in SSA.
44

Poverty levels in sub-Saharan Africa have increased over the past decade. Sub-Saharan Africa exhibits the highest levels of poverty
and income inequality world-wide over 4 decades.
Although there has been a slight increase in inequality, a Gini of 0.47 reflects a highly unequal region.
15.4 Economic Growth and Poverty Reduction in sub-Saharan Africa
Over the past two decades sub-Saharan Africa has failed to deliver the economic performance necessary to alleviate poverty.
Despite economic growth the per capita mean income in sub-Saharan declined over the past decade.The rate of decline however was less in 1990-2001 relative to 1981-1987; where decline was measured at an annualised rate of
2.3 per cent as opposed to 4.42 per cent.
Although economic growth has had a positive impact on poverty alleviation there are still concerns. The impact is not adequate to
exhibit a downward trend.
Although sub-Saharan Africa has indicated positive economic growth, the massive levels of inequality in the region maymean that this growth does not translate into poverty reduction, especially when it comes to the poor and ultra-poor.
15.5 Labour Market Dynamics
Sub-Saharan Africa's labour force was the third fastest growing in the world from 1980-2000 (reference here is made to the growth
in individuals of working age). Projections for 2000-2010 reveal that despite a predicted decrease in the SSA labour force, it will
be the second fastest growing in the world.
The share of economically active women in Africa is higher than the international average.Across the continent, women have a lower labour force participation rate than men. Statistics for Africa in total demonstrates
that in 2010, 85.2 percent of men were actively participating in the labour force, as compared to 59.2 percent of women.
There has been rapid urbanisation in sub-Saharan Africa over the past two decades with the annual growth in urbanisation over
this period being 2.39 percent. It is clear that this places massive demands on the urban labour market.
The majority of the population is still rural-based.
Within rural areas there has been exceptional growth in informal sector employment and in many cases women are dominant in
this sector. The concentration of productive activities still lies in rural areas.
In urban areas the vast majority of the labour force is seeking employment in agriculture.68 percent of all individuals were seeking employment in agriculture, and 24 percent in the services sector. It is important to note
that that the share of the labour force in the secondary industries is extremely low (9 percent).
This point to important challenges for policymakers in increasing the demand for labour (intermediated through economic growth)
to match the increase in labour supply, especially in rural areas and the informal sector, with a focus on the following:
• Removing stereotypes that discourage participation of women in the labour market
• Improving productivity, worker safety and wage levels in smaller enterprises, and to significantly improve the ability of the
formal sector to absorb large numbers of the urban labour force into long-term employment.
• Uplifting, growing and developing the poor agrarian base.
45
This section is based on research done by the Development Policy Research Unit, University of Cape Town Policy Brief Series -
Poverty, Inequality and Labour Markets in Africa: A descriptive Overview.
16. ECONOMIC DEVELOPMENT IN SOUTHERN AFRICANDEVELOPMENT COMMUNITY SADC
The Southern African Development Community (SADC) has been in existence since 1980, when it was formed as a loose alliance
majority-ruled States in Southern Africa known as the Southern African Development Coordination Conference (SADCC), with the
need to coordinating development projects in order to reduce economic pressure on the then apartheid South Africa. The founding
members; Angola, Botswana, Lesotho, Malawi, Mozambique, Swaziland, Republic of Tanzania, Zambia and Zimbabwe.
SADCC was formed in Lusaka, Zambia on April 1, 1980, with the adoption of the Lusaka Declaration - Southern Africa: Towards
Liberation. In August 1992 the 10 member countries of the SADCC signed a treaty establishing the Southern African Development
Community (SADC), which replaced SADCC. The treaty places binding obligations on member countries, with the aim ofpromoting economic integration towards a fully developed common market.
A tribunal was established to arbitrate in the case of disputes arising from the treaty by member states. By September 1993 all of
the member states had ratified the treaty and it came into effect in early October. A protocol on the establishment of the long-
envisaged SADC tribunal was adopted in 2000. The protocol on Politics, Defence and Security Co-operation, regulating the structure,
operations and functions of the Organ on Politics, Defence and Security, was established in June 1996 with effect from March 2004.
Members of the SADC are Angola, Botswana, Congo Democratic Republic, Lesotho, Malawi, Mauritius, Mazambique, Namibia, South
Africa, Swaziland, Tanzania, Zambia, Zimbabwe.
The Seychelles withdrew from SADC in July 2004. In the following month Madagascar applied for membership of the Community;
it was expected to be admitted in 2005.
16.1 Objectives
The objectives of SADC, as stated in Article 5 of the Treaty, underscore the need to ensure poverty be addressed in all SADC activities
and programme with the ultimatum of eradicating it. HIV/AIDS is as major threat to the attainment of the objectives of SADC, and
therefore is accorded priority in programmes and activities. The objectives are to;
• Achieve development and economic growth, alleviate poverty, uplift the standard and equality of life of the people of Southern
Africa and support the socially disadvantaged through regional integration;
• Evolve common political values, systems and institutions;
• The establishment of a single regional market;
• Promote and defend peace and security;
• Promote self-sustaining development on the basis of collective reliance, and the interdependence of Member States;
• Achieve complementarity between national and regional strategic programmes;
• Promote and maximise productive employment and utilisation of resources of the region;
• Achieve sustainable utilisation of natural resources and effective protection of the environment;
• Strengthen and consolidate the long-standing historical, social, cultural affinities and links among people of the Region;
• The progressive removal of barriers to the movement of goods, services and people and the promotion of cross-border
investment;
• SADC supports programmes for industrial research and development and standardisation and quality assurance, and aims
to mobilise industrial investment resources and to coordinate economic policies the development of the financial sector;
46

• Combat HIV and AIDS and other deadly or communicative diseases;
• Consolidate, defend and maintain democracy, peace security and stability;
16.2 Trade, Industry, Finance and Investments
Under the treaty establishing SADC, efforts were to be undertaken to achieve regional economic integration. The Directorate of Trade,
Industry, Finance and Investment aims to facilitate such integration, and poverty eradication, through the creation of an enabling
investment and trade environment in SADC countries.
In October 1999 representatives of the private sector in SADC member states established the Association of SADC Chambers of
Commerce, based in Mauritius. The Protocol on Trade entered into force in January 2000, and an Amendment Protocol on Trade
came into force in August, incorporating renegotiated technical details on the gradual elimination of tariffs, rules of origin, customs
cooperation, special industry arrangements and dispute settlement procedures. The implementation phase of the Protocol on Trade
commenced in September 2000. Annual meetings are convened to review the work of expert
teams in the areas of standards, quality assurance, accreditation and metrology.
The mining sector contributes about 10 percent of the SADC region's annual GDP. The principle objective of the SADC's programme
of action on mining is to stimulate increased local and foreign investment in this sector, through the assimilation and dissemination
of data, prospecting activities, and participation in professional forums.
In July 1998 a Banking Association was officially constituted by representatives of SADC member states. The Association was to
establish international banking standards and regional payments systems, organise training and harmonise banking legislation in
the region. In April 1999 governors of SADC central banks determined to strengthen and harmonise banking procedures and technology
in order to facilitate the financial integration of the region. Efforts to harmonise stock exchanges in the region were also initiated in
1999.
16.3 Infra-structure and Services
The Directorate of Infrastructure and Services focuses on transport, communications and meteorology, energy, tourism andwater. At SADC's inception transport was seen as the most important area to be developed, on the grounds that, as the Lusaka
Declaration noted, without the establishment of an adequate regional transport and communications system, other areas of cooperation
become impractical. Priority was given to the improvement of road and railway services.
SADC development projects have aimed to address missing links and over-stretched sections of the regional network, as well as
to improve efficiency, operational coordination and human resource development, such as management training projects. Other
objectives have been to ensure the compatibility of technical systems within the region to promote the harmonisation of regulations
relating to intra-regional traffic and trade.
SADC policy guide-lines on 'making information and communications technology a priority in turning SADC into an information-
based economy' were adopted in November 2001. Policy guide-lines and model regulations on tariffs for telecommunications services
have also been adopted. An SADC Expedited Mail Service operates in the postal services sector.
Areas of activity in the energy sector include: joint petroleum exploration, training programmes for the petroleum sector and studies
for strategic fuel storage facilities, promotion of the use of coal, development of hydroelectric power and the coordination of SADC
generation and transmission capacities, new and renewable sources of energy, including pilot projects in solar energy; assessment
of the environmental and socio-economic impact of wood-fuel scarcity as well as relevant education programmes, and energy
conservation.
47

The tourism sector operates within the context of national and regional socio-economic development objectives. It comprises four
components:
• Tourism product development
• Tourism marketing and research
• Tourism services
• Human resources development and training
SADC has promoted tourism for the region at trade fairs in Europe, and has initiated a project to provide a range of promotional
material and a regional tourism directory.
SADC aims to promote equitable distribution and effective management of water resources. A regional strategic action plan for
integrated water resources development and management in the SADC region was being implemented during the period from 1999
to 2004.
16.4 Food, Agriculture and Natural Resources
The Directorate of Food, Agriculture and Natural Resources aims to develop, coordinate and harmonise policies and programmes
on agriculture and natural resources with a focus on sustainability. The Directorate covers the following sectors; agricultural research
and training; inland fisheries; forestry; wildlife; marine fisheries and resources; food security; livestock production and animal disease
control ; and environment and land management.
According to SADC figures, agriculture contributes one-third of the region's GNP, accounts for one-quarter of total earnings of foreign
exchange and employs some 80 percent of the labour force. SADC 's average level of per capita income as measured by the General
National Income (GNI), is very low. If the region is to achieve Millennium Development Growth (MDG) of halving the poverty level by
2015, GNI per capita should grow consistently over the next few years at approximately 10 percent.
SADC aims to promote inland and marine fisheries as an important, sustainable source of animal protein. Marine fisheries are also
considered to be a potential source of income from foreign exchange.
A SADC Protocol on Forestry was signed in October 2002 and in November 2003 the Protocol on Wildlife Conservation and Law
enforcement came into effect.
Under the food security programme, the Regional Early Warning Unit aims to anticipate and prevent food shortages through the
provision of information relating to the food security situation in member states. As a result of the drought crisis experience, SADC
member states have agreed to inform the food security sector of their food and non-food requirements on a regular basis, in order
to access the needs of the region as a whole. A regional food reserve project was also developed.
16.5 Social and Human Development and Special Programmes
SADC helps to supply the region's requirements in skilled manpower by providing training in the following categories: high-level
managerial personnel; agricultural managers; high-and medium- level technicians; artisans; and instructors. The Technical Committee
on Accreditation and certification aims to harmonise and strengthen the education and training systems in SADC through initiatives
such as standardisation of curricula and examinations.
In August 1999 an SADC Protocol on Health was adopted. SADC has adopted a strategic framework (currently covering the period
2004 - 2007) and programme of action for tackling HIV/AIDS was established.
48

SADC seeks to promote employment and harmonise legislation concerning labour and social protection. Activities include:the implementation of International Labour Standards, the improvement of health and safety standards in the workplace,combating child labour and the establishment of a statistical database for employment and labour issues.
17. SOUTHERN AFRICAN CUSTOMS UNION (SACU)
South Africa has been part of the Southern African Customs Union (SACU), since 1910. The countries which comprise this union
are Botswana, Lesotho, Namibia, Swaziland and South Africa. Since its initial establishment, the SACU has changed significantly
in response to both political and economic changes in southern Africa.
In 1910 SACU decided to give member countries a fixed proportion of the common revenue pool irrespective of their share of total
imports. The 1969 SACU treaty, negotiated after the independence of Botswana. Lesotho, Namibia and Swaziland, the BLNS countries,
introduced the 'enhancement' factor designed to compensate the latter for any deleterious impact SACU might have on their
economies. In 1976 a 'stabilisation' factor was introduced in order to keep fluctuations in SACU revenue from BLNS countries within
the range of 17 - 23 percent of the value of the imports and excisable production of the BLNS countries.
The existence of the customs union has meant that while there have been common external tariffs on goods imported from outside
the SACU, there has been virtually free trade among the five countries which are part of the customs union. SACU provides a common
pool of customs, excise and sales duties, according to the relative volume of trade and production in each country. Goods are traded
within the union free of duty and quotas, subject to certain protective measures for less developed members. The South African rand
is legal in Lesotho and Swaziland. The Customs Union Commission meets annually in each of the member's capital cities in turn.
SACU members have a common external tariff. Excepting Botswana, they also belong to the Common Monetary Area (CMA), but as
Botswana's currency is convertible, there are virtually free flows of currency within the SACU area. Different currencies can under
special arrangements be convertible into each other at par. In Southern Africa, for example, the Namibian currency (Namibian dollar)
is convertible into South African rand at a rate of one rand to a dollar. The same applies for the currencies of Lesotho and Swaziland.
These arrangements result from the Common Monetary Agreement, which integrates Lesotho, Namibia and Swaziland into the South
African money and capital markets, with the same foreign exchange regulations applying in all four countries.
The external tariffs around the SACU have been kept high to promote the domestic production of goods inside the customs union.
This has encouraged the establishment and development of a wide range of industries inside the customs union, most notably in
South Africa. Improving the competitiveness of established industries is one of the major challenges facing the South African
government.
18. ECONOMIC DEVELOPEMNT IN SOUTH AFRICA-NATIONAL DEVELOPMENT
This section has been discussed to a certain extent in the previous sections of economic development of the Western Cape.
Historically, South Africa has had a centralist approach to economic development strategising, with provincial government and local
authorities having no explicit developmental role. Accordingly, the role of National Government has been critical, with the private
sector the only other major partner in the process. Several developments over the past few years have, however, led to a wider range
of players now having considerable influence.
During the first five years of the new democratic government, economic policies strongly focussed on macro-economic reforms,
including the strengthening of fiscal discipline and the liberalising of markets. These steps were relatively effective with South Africa
49
achieving a far more stable and predictable macro-economic environment with a moderate but sustained growth rate.
South Africa has an open economy, which means that the economy has strong links with other economies. Openness is usually
measured either by the proportion of GDP that is exported, or the proportion of domestic spending. South Africa's exports are
dominated by mining products. Although the general economic importance of gold declined significantly from the early 1980s, gold
exports still constituted 13.1 percent of all merchandise exports in 2002. In 1980, an extraordinary year, the figure was as high as
51 percent.
The fact that South Africa still exports mainly mineral and other primary commodities and related manufactured goods means that
the economy is very vulnerable to changes in demand and prices in the international markets. For example, when the price of gold,
platinum or diamonds falls, it has a strong impact on the value of South African exports and therefore also on the welfare of South
Africans.
South Africa's imports consist mainly of capital and intermediate goods. On average, capital goods and intermediate goods each
constitute about 40 percent of total merchandise imports. The rest consists of consumer goods. The South African manufacturing
sector is heavily dependent in imports. When the manufacturing sector grows, there is therefore a strong surge in imports. This often
creates serious problems for policymakers.
18.1 National Policy
By the year 2000 it was clear that macro-economic reform alone was insufficient to mobilise investment and spur economic growth
and employment commensurate with national policy objectives.
In February 2002, President Mbeki proposed a new direction to national policy. This was an integrated action plan that was focused
on overcoming the micro-economic constraints to growth. This plan aimed to increase rates of growth and employment creation,
reduce income inequality, and promote a more even geographical spread of economic activity.
To succeed in such an integrated way, attention had to be given more or less simultaneously, to the following three dimensions of
development support:
• Certain sectors were identified as growth sectors, to be targeted with special co-ordinated efforts on the part of government,
complemented by other players (like national parastatals, provincial authorities and local bodies).
• Concentrated attention was to be given to cross-cutting areas of concern, including technology development and transfer,
infrastructure development, better access to business finance and human resources development.
• Increased efforts were to go into key input sectors, in particular transport facilities, telecommunications and energy supplies,
which, if lagging, could endanger all attempts to accelerate development.
National Government initially identified five growth 'sectors', namely exports, tourism, agriculture, ICT and cultural industries.
These sectors were selected because of their potential for increased output, exports and employment.
The IMS established a framework for industrial and sectoral policy and there are strong indications that National government is likely
to accelerate the application of industrial policy in the near future. Research and consultancy reports have been commissioned by
the dti to develop the sector programmes (the so-called customised sector programmes). Coordination of industrial policy across
the different levels of government is critical to success.
Provincial strategies for the development of particular sectors need to be contextualised within national programmes. Provincial
authorities have to ensure that national policies are:
50

• appropriately adapted
• generally known to local players
• effectively implemented at local level.
18.2 Economic Growth
The government is committed to accelerating the country's economic growth rate to 4.5 percent between 2004 and 2009, to six
percent between 2010 and 2014 and above 6 percent thereafter. These are the predictions for the economic growth for the country.
There are, however, 'binding' constraints on the country's economic growth, which means that unless these were not resolved, the
economy could not grow. These include, the availability of labour with suitable skills at suitable costs, regulation and compliance
costs, input costs, access to funding (especially for small businesses), increasing research and development as a percentage of
GDP, and the quality of governance of social services.
Sectors in which much work had already been done to develop globally competitive investment opportunities and overall strategies
included business process outsourcing, agriculture and agro-processing, mineral beneficiation, tourism and travel, cultural industries,
and clothing and textiles.
South Africa's real gross domestic product (GDP) grew by 3.0 percent in 2002 as against 2.8 percent in 2001. Gross domestic savings
as a proportion of GDP rose from 14.8 percent in 2001 to 16.1 percent in 2002. The producer price index increased 8.4 percent in
2001 to 14.2 percent in 2002. The South African Reserve Bank pushed interest rates up four times in 2002. Imported producer
inflation was 15.5 percent 2002, 5.5 percent points higher than in 2001.
According to the International Monetary Fund said that the rand was the best-performing currency against the American dollar during
2002, gaining 38 percent (against a 37 percent drop in 2001). At the end of April 2003 the rand had appreciated by 21.4 percent
against the dollar, when compared to the exchange rate on 31 st December 2002. Gold closed the year 2002 at $348.05 an ounce
against $278.95 in 2001 and $272.35 in 2000.
According to Statistics SA's quarterly employment statistics (QES) survey, September 2005, the number of people employed in the
formal non agricultural business sector grew by 131 000 from March 2005 (6.945 million employees) to June (7.076 million
employees) an increase of 1.9 percent. Gross earnings paid to employees during the quarter to June 2005 amounted to R151.981
billion, an increase of R5.535 billion, or 3 percent, compared with the three months to March 2005.
These statistics are a clear indication that there is growth in the economy. Citing figures published by the reserve bank, the private
sector's role in the total productivity capacity of the South African economy had increased from just under 52 percent in 1994 to
55 percent at the end of 2001. This was in line with a longer term trend.
Reserve bank figures showed that South African companies had brought back a sizeable amount of foreign direct investment (FDI)
capital from offshore in 2002, marking a change from years of strong FDI outflows. South Africa attracted $2.7bn in FDI in 2002,
higher than its 1994 to 2001 average of $2.5bnbut still far less than other developing countries.
According to a survey by the Bureau of Market Research (BMR) at the University of South Africa, there were about 100 000 spaza
shops countrywide, providing between 230 000 and 300 000 jobs supporting more than a million people. The survey indicated that
spaza retailers made up about 2.7 percent of the country's retail trade. Spaza shops, defined as small retail enterprises trading in
consumer goods often operated residential areas to reduce overheads.
18.3 Poverty
According to a report by the South African Human Rights Commission, the government has massively failed South Africa's most
51

needy citizens. The report said that poverty alleviation reached only three million of 20 million people living below the poverty line.
According to the Institute for Democracy in South Africa (Idasa), more than five million children in South Africa, of which 30 percent
under the age of 17, regularly go hungry.
According to Van der Berg and Louw (2003:4) inequalities in South Africa has changed, it was estimated that by 1996 a striking 67
per cent of overall inequality in South Africa was due to drop within group dispersion of income. They further state that income-
distribution is slow-moving, thus distributional changes seldom drive aggregate poverty results in the presence of strong economic
growth. Only in very extreme cases would it be likely that growing inequality could prevent strong economic growth from reducing
poverty.
According to Van der Berg and Louw (2003:12) the income per capita of all race groups has been growing rapidly than the national
average, an arithmetical quirk brought about by the fact that the poorest race groups (blacks) has been experiencing a relative
population increase, dragging down average incomes. The conclusion that they make is that the rising black per capita incomes
over the past three decades have narrowed the interracial income gap, although increasing inequality within the black population
seems to have prevented a significant decline in aggregate inequality and poverty in the latter part of the period 1995 to 2000 (Van
der Berg & Louw. 2003:20).
This section has been discussed previously.
19. PROJECTS IN ECONOMIC DEVELOPMENTIN THE WESTERN CAPE
19.1 The RED DOOR - project
The RED Door is a conveniently located centre that offers information and advice to any potential and existing business entrepreneur
whether he or she wants to start a new business or expand an existing business. This project also includes a number of other
projects, namely the Enterprise Shop. The RED Door is staffed by personnel who are well-trained, competent, sensitive to the needs
of entrepreneurs and focussed on delivering a service to clients that not only increases the number of businesses in the community,
but also increases the sustainability of existing businesses. The services offered by each RED Door will be determined by the
needs of the clients in the area in which it is located. All advice and support will be provided to the client in a language in which
the client feels comfortable (i.e English, Afrikaans or Xhosa) and on a level that they understand.
Why the RED Door?
In South Africa small business development initiatives have often been fragmented with considerable duplication of support services.
These services although limited in variety, seem to be available only in certain areas and non-existent in many rural areas. The
survival rate of small businesses in South Africa do not compare favourably to similar developing countries. In addition, research
shows that entrepreneurial activity within existing small businesses is not at desired levels. These and many other challenges, e.g.
broad based Black Economic Empowerment, have prompted the establishment of the RED Doors.
Partners and stakeholders
The successful establishment and running of the RED Door will be impossible without buy-in and support of local and national
stakeholders. Partners in this project will include national and provincial government departments, parastatals. Members of the DTI,
COTTI (e.g. CSIR, Khula, NTSika, Umsobomvu Youth Fund and NPI) local government, Library Business Corners, labour, civil society,
business associations and chambers of commerce, informal business associations (e.g. hawker associations), big business and local
SMME-support organisations (both private and NGO sectors).
52
The local authority will need to view the facility as a means of giving impetus to SMME development in the area, especially where
this has been identified in its Integrated Development Plans. The RED Door will play an important role in the local authority's
implementation of its preferential procurement policy. The RED Door will serve as an access point for the products of provincial
and national governments, DTI and its associates (e.g. CSIR, Khula), providing easier access to rural inhabitants. The facility will
also serve as a point of delivery for the programmes and projects run by e.g. provincial Public Works' emerging contract or programme,
Economic Development & Tourism's SMME-support programmes. Success will be dependant on the value that the local business
communities attach to the concept.
Research and experience has shown that such initiatives become meaningless to the very communities they were meant to serve
when service standards are poor, staff lack capacity and are insensitive to the needs of the clients, products and services are limited
to that which the staff are able to offer and the organisational model is inappropriate.
Strategic Objectives
The strategic objectives of the RED Door programme is to implement support programmes and develop a service deliverynetwork that will increase the contribution of small businesses to the economy of the Western Cape.
FunctionsThe functions of the RED Door are to:
• Provide advice, information and support to small businesses
• Design, develop and implement small business support programmes in order to:
• Build sustainable and competitive enterprises;
• Promote and enhance entrepreneurship;
• Assist in the creation of an enabling operating environment for small business;
• Provide access to non-financial resources and capacity building services;
• Facilitate access to finance by service providers to small businesses and small enterprise organisations;
• Provide market access, procurement and market linkages for small businesses;
• Strengthen the capacity of small businesses to compete successfully domestically and internationally;
• Build and maintain a network of competent support service providers;
Client Approach
The RED Door approach recognises that different people need different types of support and information at different times and that
people have different learning styles. To accommodate this individuality, the RED Door offers one-on-one personalised support
services to clients to assist them in choosing the right public and private sector resources to access and in an appropriate sequence.
In effect, the RED Door staff members are peer navigators - they assist clients to discover what they should do next andwhere they can look for assistance.RED Door not only demystifies the process of starting a business, but also breaks down the barriers that hinder entrepreneursto establish and run a business.
Once a client has started a business, the RED Door's job is far from over. Ongoing access to peers, mentors, planning support and
information will then be provided by the centre.
53

Outreach Programmes
RED Door outreach will extend throughout the community, working closely with education, social services, the business community
and other entrepreneurship-related stakeholders to heighten awareness of all available support services, nurture an entrepreneurial
culture and create options for people in their home communities.
The outreach programme can include courses and projects run off-site engaging with the following:
• Schools and other educational institutions - youth entrepreneurial development;
• Farms - small scale emerging farmers;
• Community centres and multi-purpose centres - areas on the periphery of the RED Door;
All programmes and projects need to be properly structured addressing the needs of the targeted audience. The appropriate level
(pitch) and language of the programme is of paramount importance. Where training programmes are run these must be accredited
by the South African Qualifications Authority (SAQA).
Target Market
The RED Door's broad target market is any entrepreneur who wants to start, expand or fine-tune a small business or micro enterprise.
Youth from the previously disadvantaged backgrounds are a focus, as are women entrepreneurs, although not exclusively. It will
also assist disabled individuals and provide access to relevant opportunities and support groups. The facility will serve as an important
source of tender information and support - for both public and private organisations.
Benefits of RED Door
Benefits for government
RED Door will act as funnel in channelling all relevant government small business support services to a point (centre), which is
convenient to the local community. In heeding the President's call, all spheres of government are obliged to support entrepreneurship
and small business development. A RED Door site can only be successful if it is owned and operated at the community level.
Community stakeholders will set the targets and direction of programme delivery. Utilising the RED Door system, the following can
be anticipated:
• The RED Door will act as a marketing agent to heighten the community's awareness about available programmes, support
services and initiatives and celebrate local entrepreneurship related successes
• Celebration and drawing awareness of the successes of entrepreneurs from the community.
Benefits for local youth
The RED Door will:
• Introduce entrepreneurship to youth and get them excited about exploring entrepreneurship;
• Act as a stepping-stone to jumpstart ideas and build on local youths' potential;
• Act as a catalyst in nurturing partnerships focussed on initiating meaningful interventions and initiatives and accessing/drawing
needed resources to the community
54

Benefits for funders and partners
Building partnerships and working in a complementary manner with all community stakeholders is key to sustainable success.
Funding and delivery will enjoy the following benefits:
• RED Door staff will maintain high activity levels in the community, heightening awareness and interest in available community
programmes, services and initiatives;
• The RED Door will act as a bridge to available community resources and support services;
• The informed and calculated referral services will better prepare clients to take their next steps and result in an increased
number of better informed clients for other community support services;
• Provincial government will endeavour to work co-operatively and collaboratively with community agencies, support organisations,
schools, the business community and other stakeholders to achieve a more integrated and client centred approach to service
delivery; pool resources in promoting common mandates; promote discussions to increase the efficiency and reduce the
cost of entrepreneurship-related service delivery in the community; propose joint client support/interventions/initiatives in
the furtherance of common objectives; and initiate joint mapping of the gaps in service delivery/support and promote
partnering to address such areas.
How are services delivered?
• Three languages (English, Afrikaans, Xhosa)
• Two educational levels
• Well-mapped plan of action for individual needs
Online Information
Start here to access the online RED Door business toolkit is by means of online information regarding the following:
• Starting a small business
• Managing a small business
• Government support
• Small business support
• Business opportunities
Implementation of RED Doors
Currently there are nine RED Doors in operation. The first was launched in November 2004 at Khayelisha. In April 2005, six RED
Door offices were launched at Atlantis, Hermanus, Oudtshoorn, Knysna, Beaufort West and Paarl.
Conclusion
It is envisaged that the RED Door through the direct intervention of the Provincial Government and in collaboration with various
stakeholders will begin to address the key objectives of government, which is ultimately job creation and stimulation, a vibrant
Western Economy and the creation of sustainable livelihoods for all her citizens.
55

19.2 DIE PLEK PLAN
Die Plaaslike Ekonomiese Plan / The Local Economic Plan
The Need
The Municipal Systems Act 2000, set in motion a process of transformation for municipalities and the adoption of a developmental
approach in delivering services. Promoting economic development at the local level is a challenging constitutional responsibility
for local authorities. All municipalities are required to strategically plan for their developmental interventions.
The first round of integrated development planning (IDP) by the 30 municipalities in the Western Cape highlighted capacity challenges
within local government to deliver on their economic development responsibilities in their respective geographic areas.
The unfolding of the IDP process and the municipal experiences to date, have clearly demonstrated that an economic developmentplan as part of a municipal IDP, has been a tremendous challenge due to a lack of skills and capacity in local municipalities; little
or no coordination and integration within district areas; and within national and provincial objectives and support programmes.
Local authorities face numerous challenges that affect the effective delivery on local economic development. The most common of
these challenges are the following:
• A lack of common understanding and therefore little coordination in LED activity.
• Municipal structures do not yet reflect the provision of suitable or appropriate institutional arrangements, human resources
and financial capacity to deliver on LED.
• LED policies, strategies and projects are not based and therefore not suitably tailored to the economic profiles of the geographic
spread of the region.
• Studies and strategies are commissioned to deliver on LED; the end-products however, struggle to translate into implementable
projects and programmes.
• LED projects identified in IDP's are survivalist in nature and have little or no impact on sustainable economic development
• Inability to budget and access finance for LED programmes.
• There is poor access to accurate information and ineffective monitoring and evaluation.
Response
The department's response to this is to develop strategy and intervention that fast track the process. The department will help with
fully trained and equipped staff into municipalities, with a full 'head office' support to get high quality LED initiatives going in all
municipalities over the next three years.
This intervention aims to identify economic opportunities that local people can take up in their regions. It also intends to assist
the local municipalities to articulately define their local economic development strategies and the implementation plans.
Evolution of DIE PLEK PLAN (DPP)
To start addressing some of the challenges facing municipalities, the department decided to target the lack of organisational skills
and capacity in economic development within the municipalities. It insisted in establishing economic development units (EDUs) which
intended to:
56
• Be an access point for local information
• Be an access point for relevant external information
• Assist the municipality in LED strategy and plan development.
It is envisaged that an EDU or LED division in a municipality will promote the increased alignment of activities with the other spheres
of government and the external environment, that impacts on LED in a municipal region.
This has led to the proposal of a structured programme within which to operate. This programme will facilitate the flowof economic information that will be informed globally, aligned provincially and nationally and sensitised locally. It will thentranslate this information into intelligence that will identify local opportunities and support the creation of enterprises.This structured support programme is - DIE PLEK PLAN (DPP)DIE PLEK PLAN will look to develop the potential or general opportunities for local people in the rural areas.
Description
DIE PLAASLIKE EKONOMIESE PLAN will deliver information and advice through the identification, creation and provision of economic
opportunities, in a local region. This service will be provided to local people in a conducive environment for economic activity.
The DPP unit will be sensitised to the needs of locals and focussed on delivering a service that will increase the economic activity
in a region.
Example
The economic profile of the Cederberg region indicates economic activity in the Rooibos industry. The Medium Economic Development
Strategy (MEDS) may identify that within the agricultural sector the Rooibos industry has considerable potential for development
and growth i.e. local comparative advantage would exist. Applying a matrix approach identifies small farmer development in the
Rooibos industry, in Wuppertal, as a possible targeted intervention. This informs the DPP of the Cederberg region to make available
information to local people about opportunities for Rooibos farming in the region. The DPP will also provide access to support for
local people who wish to take up identified opportunities in this industry, through the Enterprise Shop and the nearest RED Door.
Client approach and service delivery
The DPP programme recognises that different local regions will require different types of support to promote and stimulate economic
activity. The DPP manager will have extensive training and engage in hands-on local experience and knowledge about his/her specific
region. We need to ensure that the broad category business interventions identified, are suited to the region and that the local people
are linked to the right public and private sector resources and assistance.
DPP's broad target market is anyone who is willing and prepared to take up an opportunity in the local economy of theregion.
Access to support services to realise and unlock local opportunities.
To support uptake of opportunities and successful implementation of projects, the DPP will provide linkages with resources, markets
and technical advice to promote enterprise development, identify local competitive advantage and promote increased economic
participation in rural areas.
This will be facilitated by means of the following:
57

• Creating awareness and provision of access for individuals and communities to departmental and national support programmes
and benefits, i.e. RED Doors, the Enterprise Shop, cooperative development, incentives programmes
• Assisting in the design and support of pioneer pilot projects that will have a catalytic impact on the local economy. These
pilot projects identified will need to be linked with financial, management and market support to ensure their sustainability.
Partners and stakeholders
It is critical to establish partnerships in order to ensure more effective local economic development at municipal level.
Head office will manage the programme administration issues (HR and financial), the programme logistics (inputs, outputs, information
systems, regional / location issues).
The successful establishment and implementation of a DPP programme will be impossible without the buy-in and support of local
government. Municipalities will need to view DPP as a catalyst in promoting local economic development in a region.
Support by national and provincial government departments, parastatals, labour, civil society is important.
The contribution by the private sector is crucial to the realisation of the objectives of DPP. Buy-in and commitment is required from
big business, local business associations and chambers of commerce, informal business associations (e.g. hawker's associations)
and local SMME and cooperative-support organisations (both private and NGO sectors).
Strategic Objectives
The strategic objectives of the DPP unit and programme, speaks to assisting in developing a coherent and integrated environment
in which to achieve local economic development, focussing on HDI ownership and geographic spread of economic activity in the
province.
Aims of DPP
The aims of DPP are to
• Increase the quality and quantity of economically meaningful and viable projects.
• To assist with the design and appraisal of tailor made projects that will encourage participation of all in the local economy.
• Increase number of projects properly linked with available resources and markets of sustainability.
• Ensure provision of adequate and proper advice to local people and prospective investors on economic opportunities and
threatening matters within the area.
• Guide local municipalities on economic policy formulation and strategy development and IDPs with appropriate economic
development plans
• Improve alignment of municipal economic development plans and programmes with provincial and national policies and
interventions.
• Provide quality service to all its clients
Functions of DPP
The functions of DPP are to:
• Ensure the effective sourcing of data / information from the relevant input departmental units / organisations / agencies.
58

• Develop a matrix approach that will lead to the identification of broad category business interventions for the region.
• Design and develop opportunities from the interventions identified.
• Ensure the distribution of these opportunities to the Enterprise Shop, the RED Doors, local businesses and people.
• Provide advice, information and support to municipalities, local people and possible investors on economic opportunities in
the area.
• Provide access to management, financial and market linkages for identified projects.
• Assist in strengthening the capacity of municipalities to support these projects.
• Strengthen the capacity of projects to compete successfully domestically and internationally.
• Link provincial pioneered pilot projects with community based business organisations and cooperatives.
• Identify suitable partnership in a project to ensure a viable deal is structured to support the enterprise development
• Build and maintain a network of competent stakeholders and partners, to strengthen the resource base of projects and to
provide reputable reference that act as a non financial collateral when further funding is required.
• Build capacity of municipalities to provide an enabling environment for increasing competitive advantage of the people and
municipal areas.
• Ensure increased relations and collaborations of municipalities with the provincial government in economic related matters.
Challenges
• The biggest challenge will be the availability and willingness of suitably skilled people to be deployed as DPP managers. A
number of models will be investigated to determine the most suitable arrangement.
• A good support system that will capture a collective pool of knowledge that would impact on the work of the DPP manager.
A strong highly competent technical team is required for the head office support to ensure delivery in all regions, to compliment
and substitute for DPP managers if and when it is required.
• A system is required to ensure all the information that is received from their sources, may be collated in a format that the
DPP managers are able to use efficiently and effectively and to ensure it allows the DPP managers to distribute the information
into the regions.
• Through the PSDF, corridors of high potential will be identified for regions and across regions. DPP managers will be aware
of these and adapt opportunities identified.
Ownership and governance
The model is one of cooperation. Partnerships, participation and buy-in will be voluntary and flexible as far as possible. However, a
municipality keen on this intervention will have to make accommodation for this intervention within its budget, at the start of the
nearest budget cycle.
The following types of ownership or membership combinations can be explored:
• 100 % managed and funded by the Department (with non-financial support being received from any other private or public
sector).
• 100 % managed and funded by a local authority (with non-financial support being received from any other private or public
sector).
• Funded and managed through a partnership agreement between local and provincial government.
• Funded and managed by both private and public sector organisations
59
In adopting an ownership model, the following will serve as guidelines:
• Good corporate governance;
• Community and stakeholder inclusivity;
• Appropriateness for local conditions
Conclusion
It is envisaged that DIE PLEK PLAN programme by Provincial Government, in collaboration with stakeholders, will impact on a key
objective - to create jobs for people and a vibrant Western Cape economy for all citizens.
20. CONCLUSION
Economic development involves all the citizens of the country in one way or another. The economy has grown and development is
taking place. In the Western Cape the four core sectors - agriculture, manufacturing, trade and financial and business services,
are each well diversified, reducing the risk of over-dependence on any single industry or sub-sector.
In addition, the region has a well-developed tourism sector, as well as reasonably strong and dynamic construction, fishing, professional
services, higher education and transport sectors. A small mining base is mitigated by Saldanha's emergence as a major export
harbour for minerals, as well as a key base for the iron and steel industry.
We end by stating the essence of the vision of a shared, sustainable, growing, labour-absorbing and globally competitive economy
is what economic development is striving for.
60
BIBLIOGRAPHY
Bhorat, H. 2000. Decomposing Sectoral Employment Trends in South Africa. Conference Paper.
Bhorat, H. 2005. Poverty, Inequality and Labour Markets in Africa: A Descriptive Overview. Development Policy Research Unit. Working
Paper 05/92. University of Cape Town.
Bhorat, H & Oosthuizen, M. 2005. The Post-Apartheid South African Labour Market. Development Policy Research Unit. Working Paper
05/93. University of Cape Town.
Business. Iafrica.com 24 September 2005.
Cape Argus. August 2, 2005. Africa needs capitalism to thrive, not more foreign handouts. Walter. E Williams.
Casala, D., Muller, C., Posel, D., 2005. 'Two Million Net New Jobs': A Reconsideration of the Rise in Employment in South Africa,
1995-2003. Development Policy Research Unit. Working Paper 05/97. University of Cape Town.
Chamberlain, D & van der Berg, S. 2002. Earnings Functions, Labour Market Discrimination and Quality of Education in South Africa.
Stellenbosch Economic Working Papers: 2/2002. Stellenbosch University.
Dieden, S. 2004. Homing in on the Core: Households Incomes, Income Sources and Geography in South Africa. Development Policy
Research Unit. Working Paper 04/90. University of Cape Town.
Development Policy Research Unit. 2005. Poverty, Inequality and Labour markets in Africa: A Descriptive Overview. DPRU Policy Brief
Series, April 2005. University of Cape Town.
Development Policy Research Unit 2005. Emergent Black Affluence and Social Mobility in Post-Apartheid South Africa. DPRU Policy
Brief Series. August 2005. University of Cape Town.
Fourie, L.C.H. 2004. Die Ekonomie in 2003. SA Ensiklopedie. Naspers. Johannesburg.
Gelderblom, D. 2005. Limits to the Urbanisation of Poverty in South Africa. Department of Sociology, University of South Africa,
Pretoria.
Goodison, P. 1999. Marginalisation or Integration? Implications for South Africa's Customs Union partners of the South Africa-European
Union trade deal. IGD Occasional Paper No 22. Braamfontein. The Institute for Global Dialogue.
Kingdom, G.G. & Knight, J., 2005. Subjective Well-being Poverty versus Income Poverty and Capabilities Poverty? Development Policy
Research Unit, Working Paper 05/96. July 2005. University of Cape Town.
Meth, C. 2004. Half Measures: The ANC's Unemployment and Poverty Reducation Goals. Development Policy Research Unit. Working
Paper 04/89. December 2004. University of Cape Town.
Micro-Economic Development Strategy for The Western Cape. Synthesis Report: Version 1: July 2005.
Micro-Economic Development Strategy for the Western Cape Research Papers 2005: Volume A.
61

Manuel, T.A. 2004. Africa's economic renaissance: development and interdependence. MP Minister of Finance Republic of South
Africa. Paper delivered at the University of Sussex. 2 December 2004.
Mohr, P., Fourie, L., Third Edition. 2005. Economics for South African students. Paarl.Van Schaik Publishers.
Oosthuizen M.J., Nieuwoudt, L. 2002. A Poverty Profile of the Western Cape Province of South Africa. Bureau for Economic Research
Working Papers: 3/2002. Department of Economics. Stellenbosch University.
Poswell, L. 2002. The Post-Apartheid South African Labour Market: A Status Report. Development Policy Research Unit. University
of Cape Town.
Regional Surveys of the World. Africa South of the Sahara. 2005. 34th Edition London. Europa Publications.
Roberts, B. 2005. Introducing the Western Cape's Micro-economic Development Strategy (MEDS). 2 August 2005.
Schuitema, J. 1998. 2nd Edition. Econosense- Understanding your Economic environment. Johannesburg. International Thomson
Publishing (Southern Africa) (Pty) Ltd.
Smit, B.W. & Burrows, L. 2002. Estimating Potential Output and Output Gaps for the South African Economy. Bureau for Economic
Research Working Papers: 5/2002. Department of Economics. Stellenbosch University.
South African Survey 2002/2003. South African Institute of Race Relations. Johannesburg.
Van der Berg, S., Louw, M. 2003. Changing patterns of South African income distribution: Towards time series estimates of distribution
and poverty. Bureau for Economic Research. Department of Economics. Working Papers: 2/2003. Stellenbosch University.
Western Cape Provincial Economic Review & Outlook 2005. Cape Town. Government Printers Cape.
www.capegateway.gov.za/eng/pubs/reports_research/w
www.sadc.int
62