Embed Size (px)
DESCRIPTION
An Introduction to Quantitative Research Peter Harper. Quantitative Research is dominated by two approaches The Experiment and The Survey. The Experimental Method. William Harvey (1578 - 1657). - PowerPoint PPT Presentation
Citation preview

An Introduction to
Quantitative ResearchPeter Harper

Quantitative Research is dominated by two approaches
The Experiment and The Survey
The Experimental Method
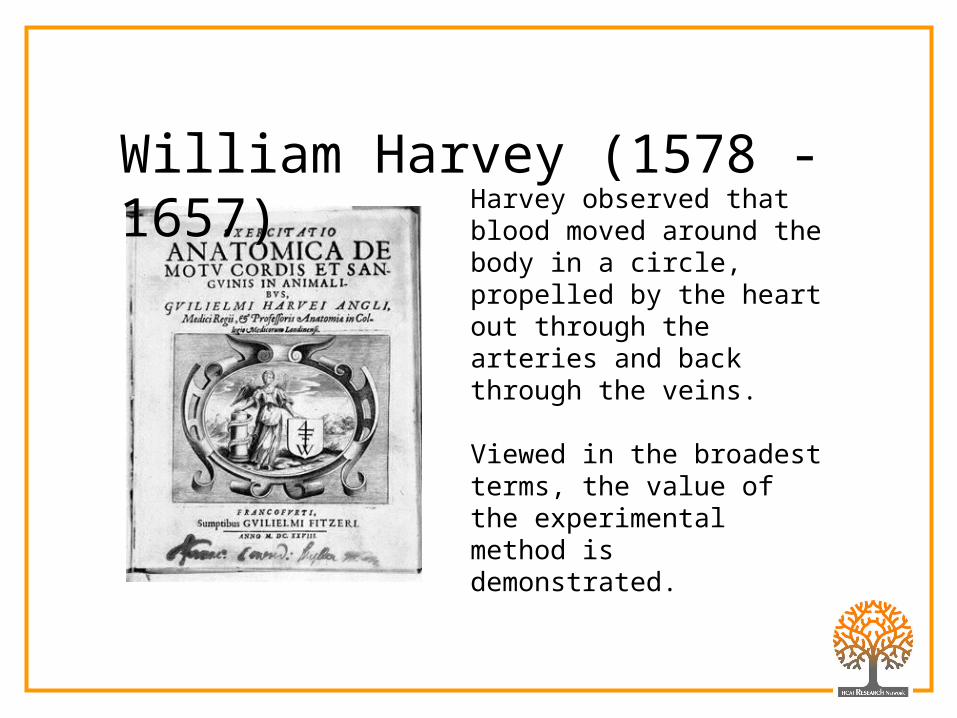
Harvey observed that blood moved around the body in a circle, propelled by the heart out through the arteries and back through the veins.
Viewed in the broadest terms, the value of the experimental method is demonstrated.
William Harvey (1578 - 1657)

In the 1600s, it was widely believed that living things could spontaneously generate from non-living, dead, or waste materials because people saw such materials "generate" living things such as mould or maggots.
In 1688 the Italian naturalist Francesco Redi set out to test the idea that flies were responsible for the maggots by placing decaying meat in two containers: one open to the air, the other sealed. Meat in the open container eventually became infested with maggots.
Francesco Redi (1626 -1697)
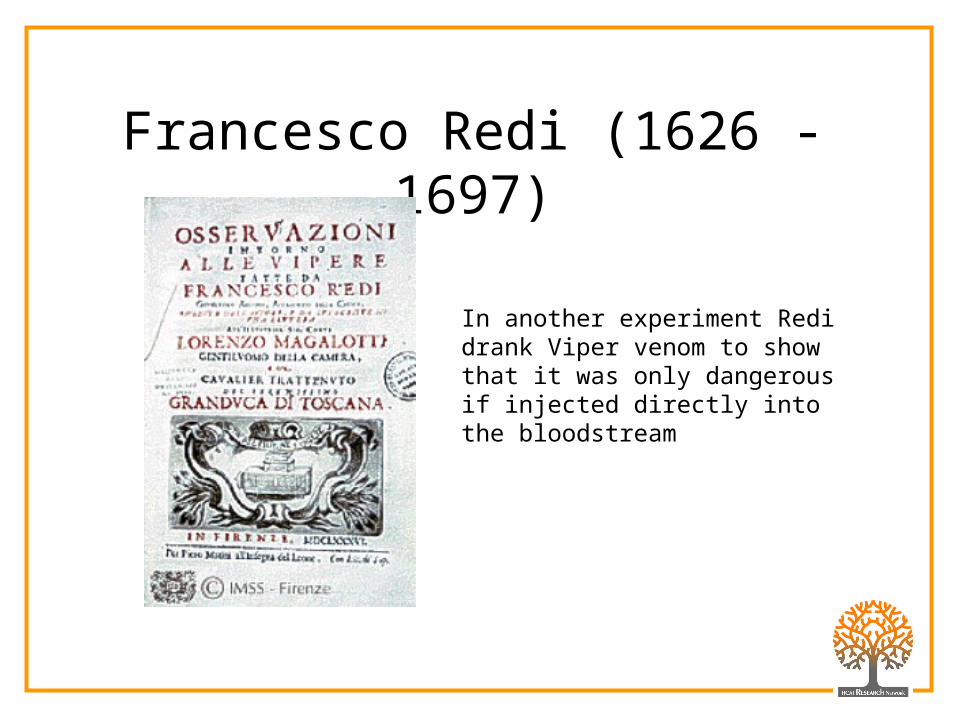
In another experiment Redi drank Viper venom to show that it was only dangerous if injected directly into the bloodstream
Francesco Redi (1626 -1697)
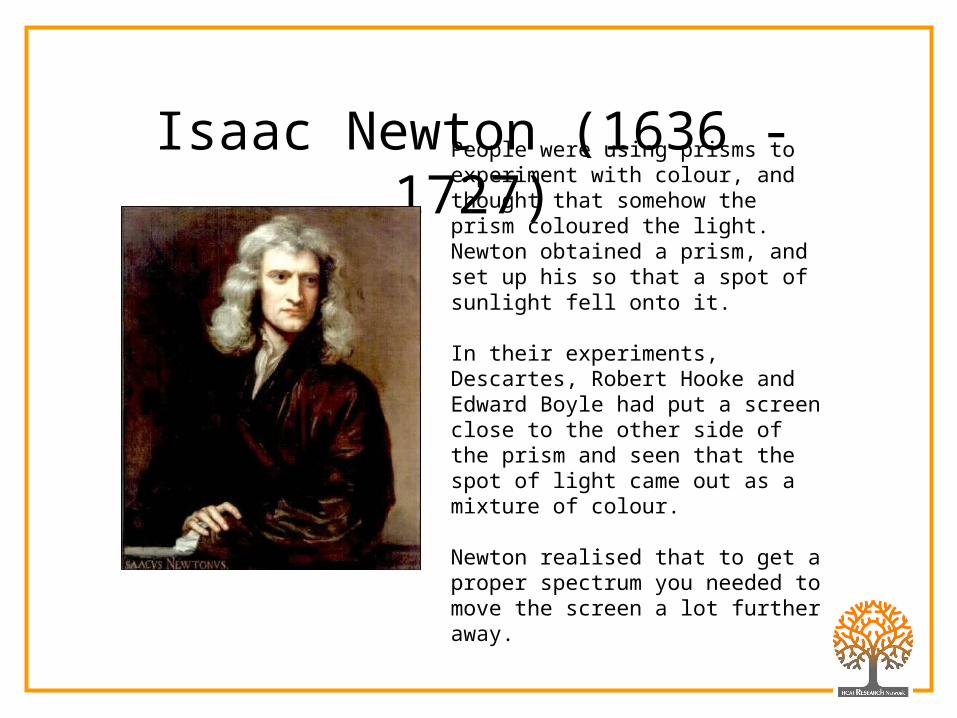
People were using prisms to experiment with colour, and thought that somehow the prism coloured the light. Newton obtained a prism, and set up his so that a spot of sunlight fell onto it.
In their experiments, Descartes, Robert Hooke and Edward Boyle had put a screen close to the other side of the prism and seen that the spot of light came out as a mixture of colour.
Newton realised that to get a proper spectrum you needed to move the screen a lot further away.
Isaac Newton (1636 -1727)
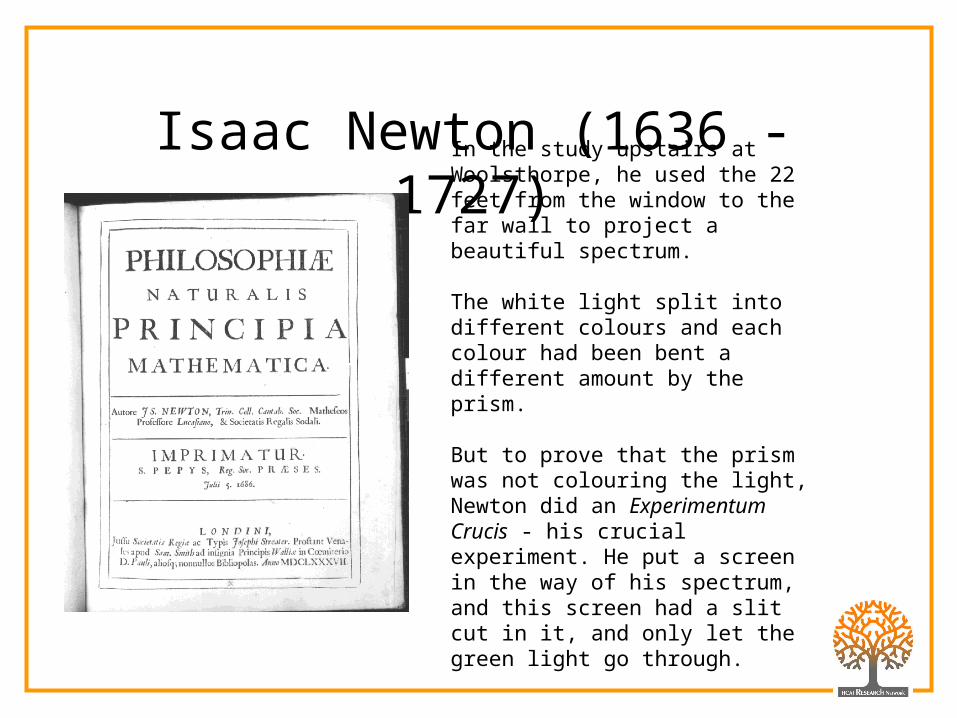
In the study upstairs at Woolsthorpe, he used the 22 feet from the window to the far wall to project a beautiful spectrum.
The white light split into different colours and each colour had been bent a different amount by the prism.
But to prove that the prism was not colouring the light, Newton did an Experimentum Crucis - his crucial experiment. He put a screen in the way of his spectrum, and this screen had a slit cut in it, and only let the green light go through.
Isaac Newton (1636 -1727)
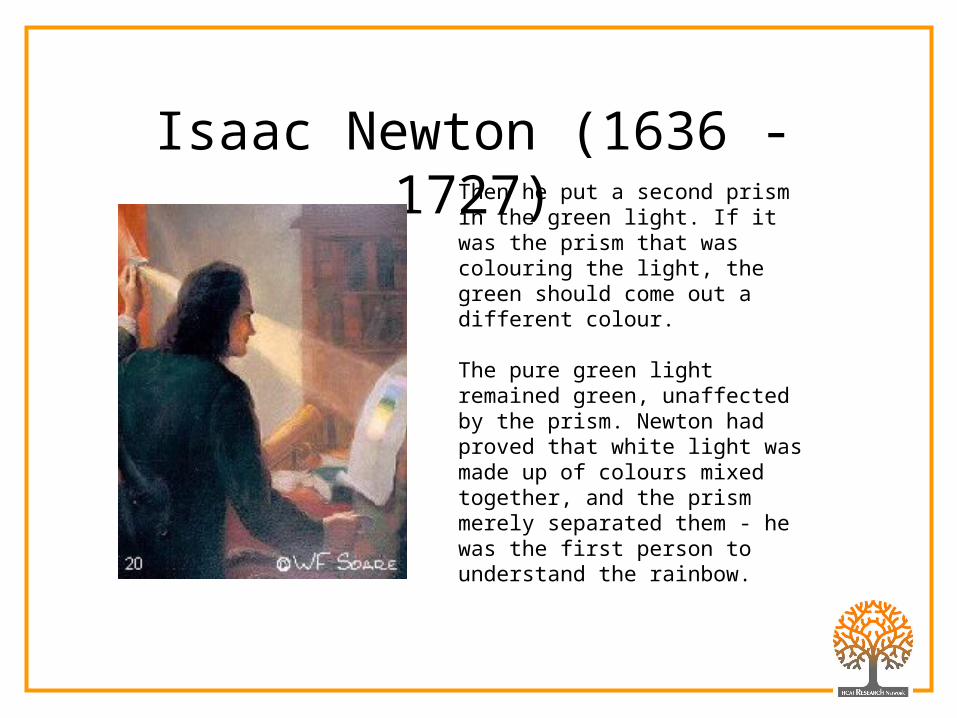
Then he put a second prism in the green light. If it was the prism that was colouring the light, the green should come out a different colour. The pure green light remained green, unaffected by the prism. Newton had proved that white light was made up of colours mixed together, and the prism merely separated them - he was the first person to understand the rainbow.
Isaac Newton (1636 -1727)
Are there methodological differences between the “experiments” undertaken by Harvey and Redi?

Harvey’s experiment illustrates an inductive approach to scientific method.
Inductive reasoning is based on meticulous observation, e.g., we can observe that metal expands when it is heated.
Inductive Reasoning
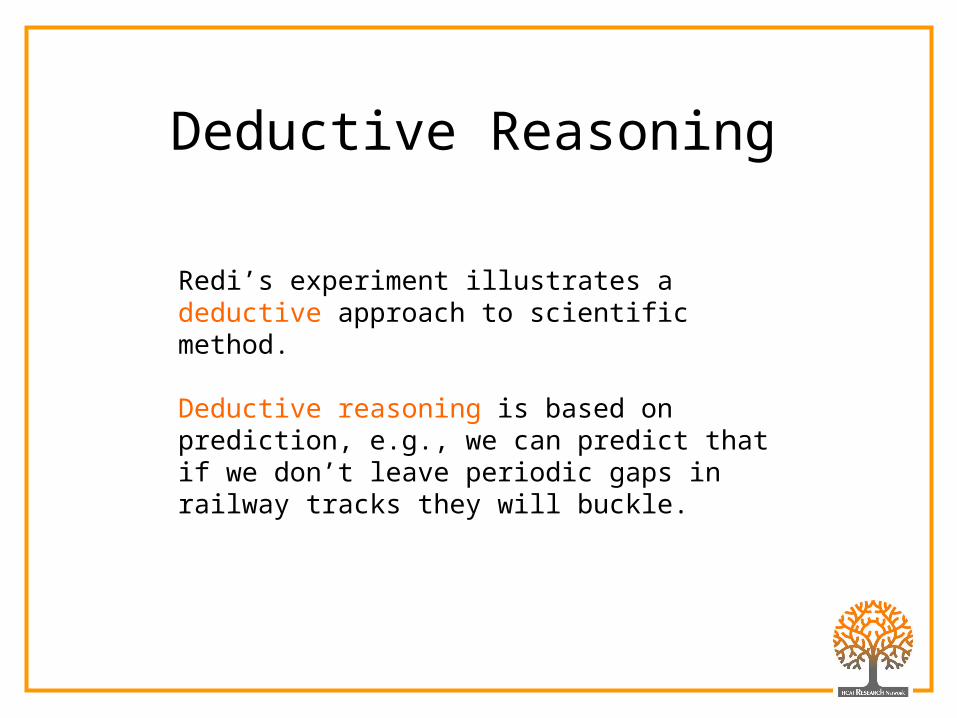
Redi’s experiment illustrates a deductive approach to scientific method.
Deductive reasoning is based on prediction, e.g., we can predict that if we don’t leave periodic gaps in railway tracks they will buckle.
Deductive Reasoning
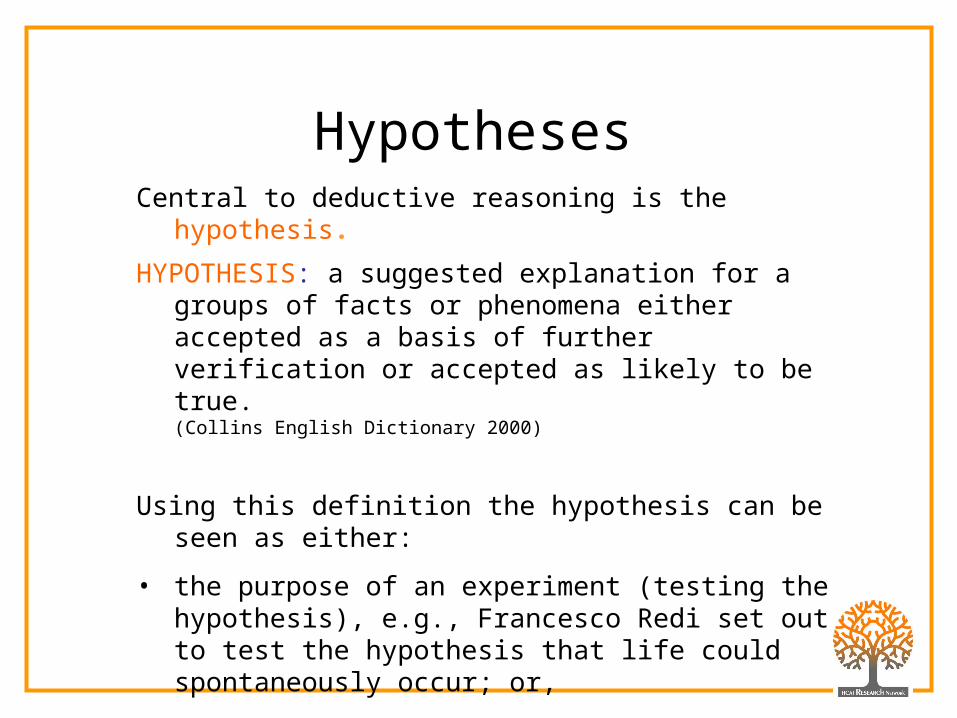
Central to deductive reasoning is the hypothesis.
HYPOTHESIS: a suggested explanation for a groups of facts or phenomena either accepted as a basis of further verification or accepted as likely to be true.(Collins English Dictionary 2000)
Using this definition the hypothesis can be seen as either:
• the purpose of an experiment (testing the hypothesis), e.g., Francesco Redi set out to test the hypothesis that life could spontaneously occur; or,
• the product of an experiment (generating the hypothesis), e.g., William Harvey
Hypotheses

Experimental Method
do something observe hypothesise
hypothesise do something
(Intervene)
observe
(measure)
hypothesise measure intervene measure
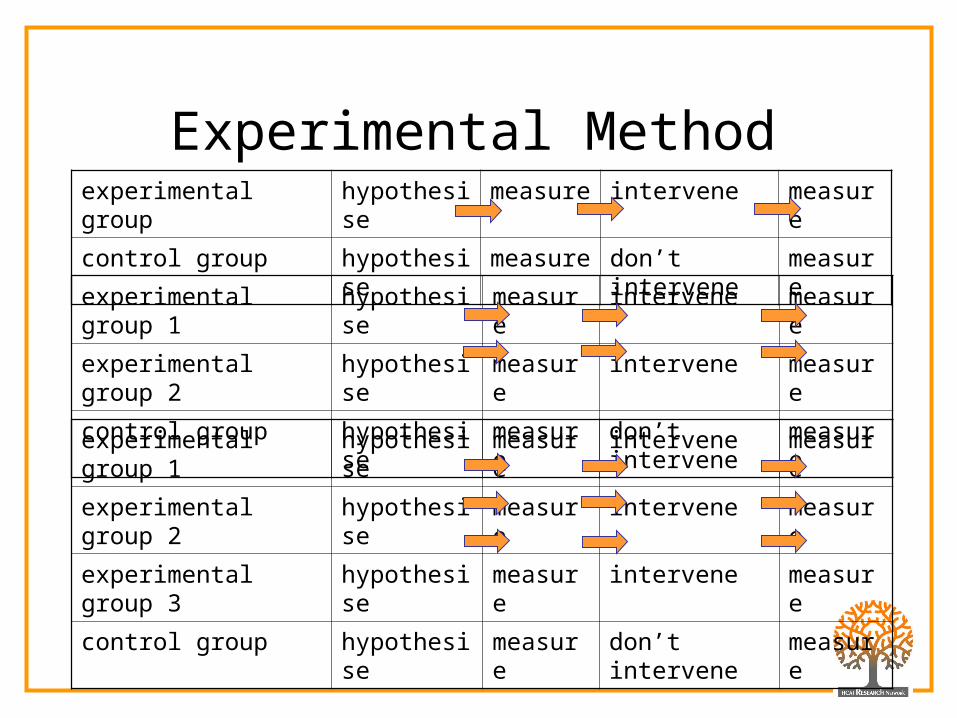
Experimental Methodexperimental group hypothesise measure intervene measure
control group hypothesise measure don’t intervene measure
experimental group 1 hypothesise measure intervene measure
experimental group 2 hypothesise measure intervene measure
control group hypothesise measure don’t intervene measure
experimental group 1 hypothesise measure intervene measure
experimental group 2 hypothesise measure intervene measure
experimental group 3 hypothesise measure intervene measure
control group hypothesise measure don’t intervene measure
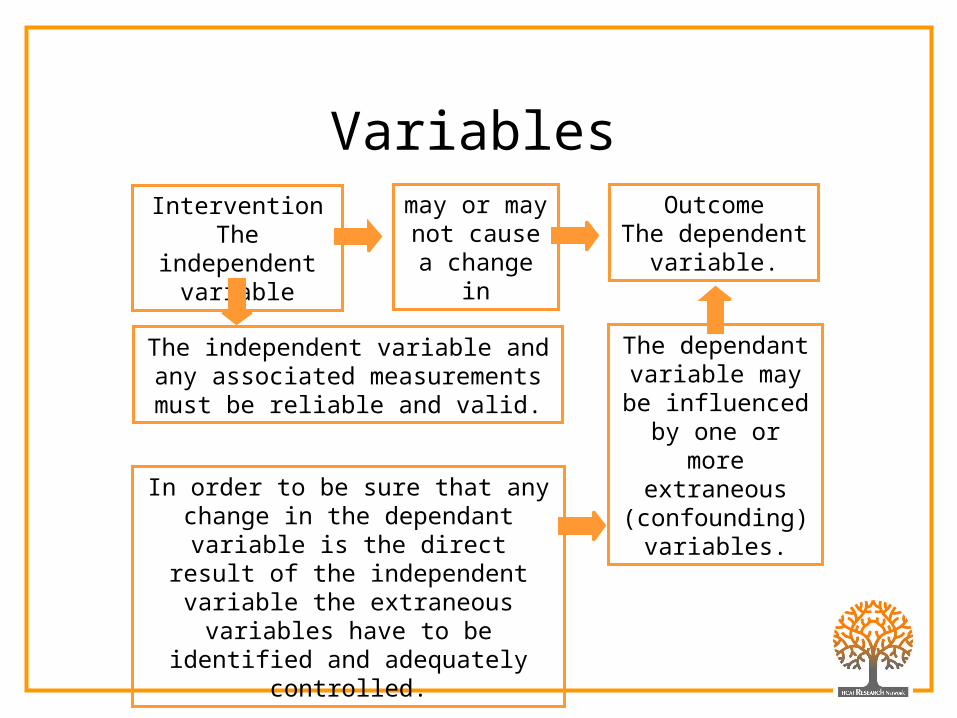
VariablesIntervention
The independent variable
OutcomeThe dependent
variable.
may or may not cause a change in
The dependant variable may be
influenced by one or more
extraneous (confounding)
variables.In order to be sure that any change in the dependant variable is the direct
result of the independent variable the extraneous variables have to be
identified and adequately controlled.
The independent variable and any associated measurements must be
reliable and valid.
Types of Quantitative Design
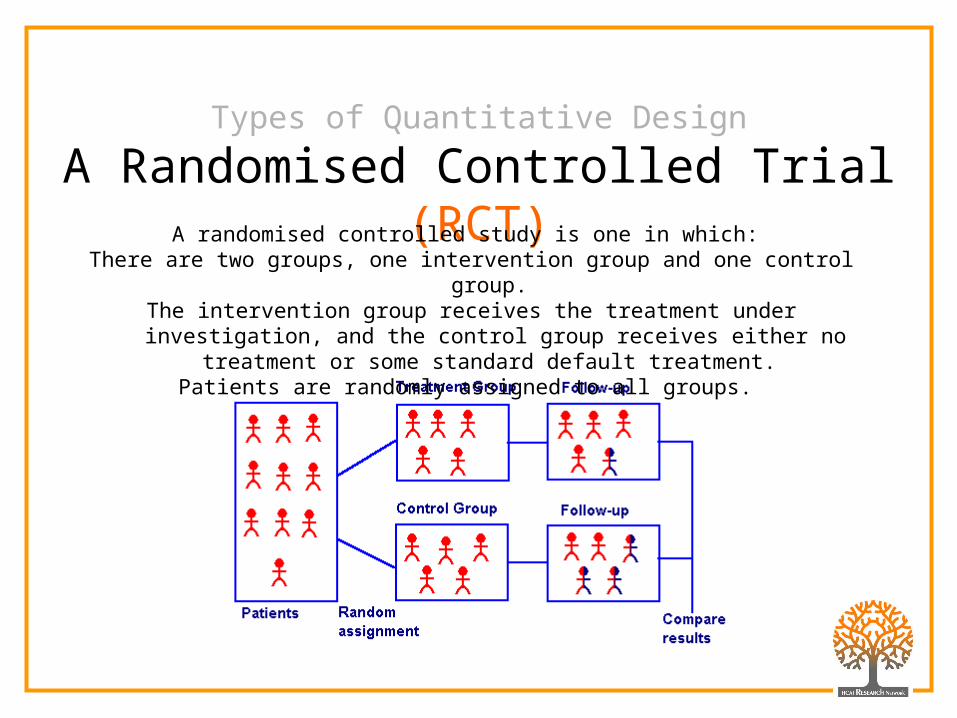
A Randomised Controlled Trial (RCT)A randomised controlled study is one in which:
There are two groups, one intervention group and one control group. The intervention group receives the treatment under investigation, and the control
group receives either no treatment or some standard default treatment. Patients are randomly assigned to all groups.
Types of Quantitative Design
A Quasi Experiment
“A quasi-experimental design is one that looks a bit like an experimental design but lacks the key ingredient -- random assignment.
My mentor, Don Campbell, often referred to them as "queasy" experiments because they give the experimental purists a queasy
feeling. With respect to internal validity, they often appear to be inferior to randomized experiments. But there is something compelling about
these designs; taken as a group, they are easily more frequently implemented than their randomized cousins.”
Trochim WM. The Research Methods Knowledge Base, 2nd Edition.
Available at: http://trochim.human.cornell.edu/kb/index.htm
(version current as of August 16, 2004).

Types of Quantitative Design
A Case Control StudyCase control studies are studies in which people who are already
in a certain condition are compared with people who are not.
Types of Quantitative Design
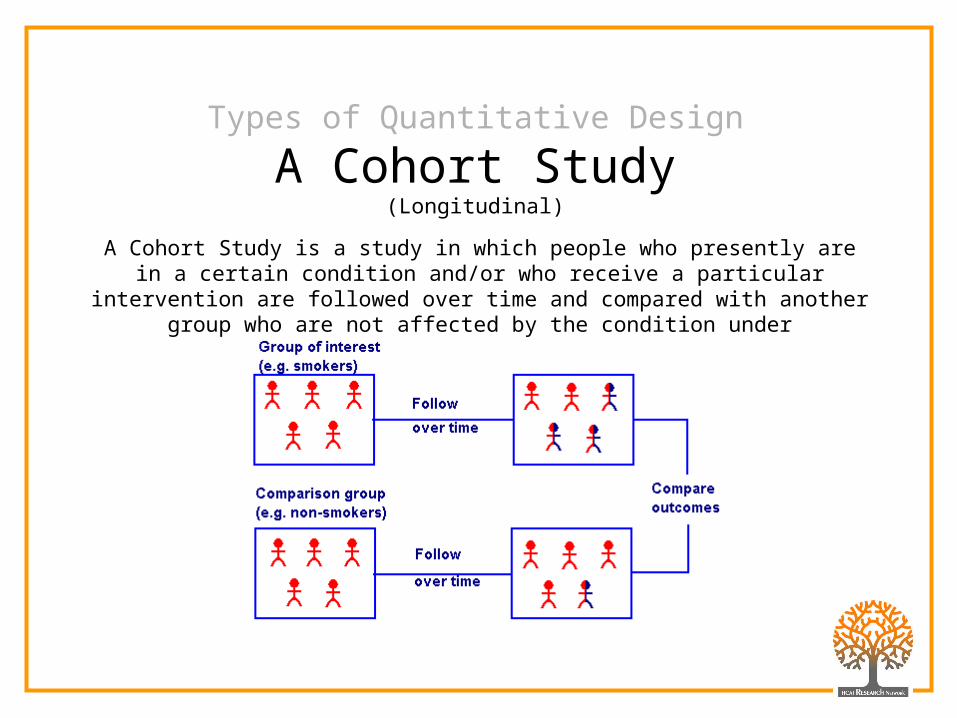
A Cohort Study(Longitudinal)
A Cohort Study is a study in which people who presently are in a certain condition and/or who receive a particular intervention are followed over time and compared
with another group who are not affected by the condition under investigation.

Types of Quantitative Design
A Typical Pyramid of Evidence
Source = http://servers.medlib.hscbklyn.edu/ebm/2toc.htm
A systematic review is a comprehensive review of a topic in which all of the primary studies of the highest level of
evidence have been systematically identified, appraised and then summarised according to an explicit and reproducible
methodology.
A systematic review may or may not include a meta-analysis.
Systematic Review
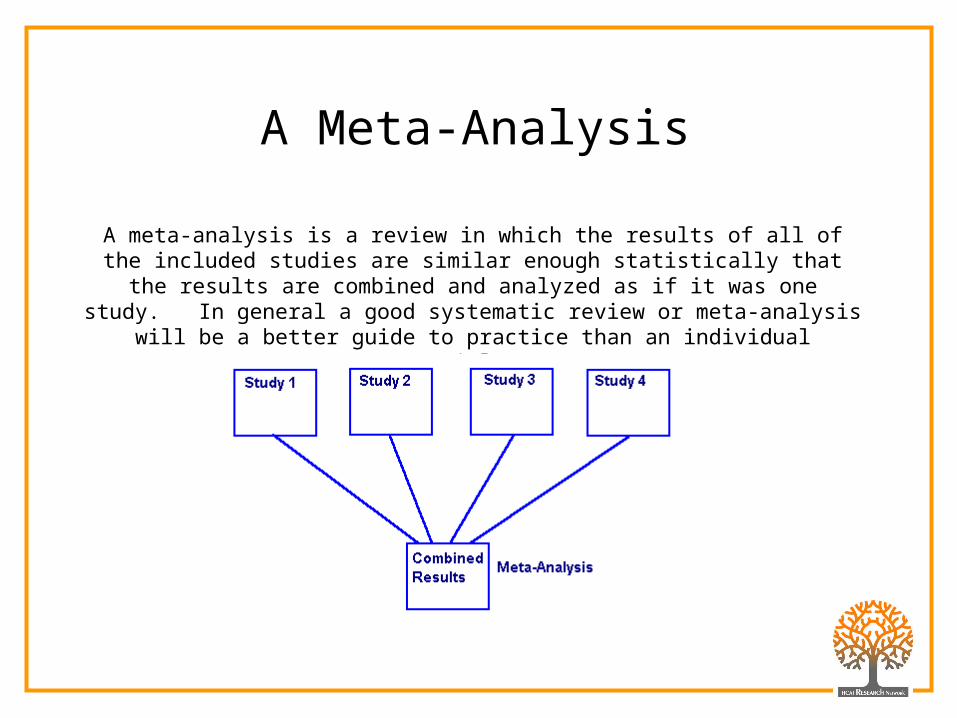
A Meta-Analysis
A meta-analysis is a review in which the results of all of the included studies are similar enough statistically that the results are combined and analyzed as if it was one study. In general a good systematic review or meta-analysis will be a better
guide to practice than an individual article.

Survey Method
The most common way of collecting survey data is via a questionnaire.
Questionnaires can include both open and closed questions.
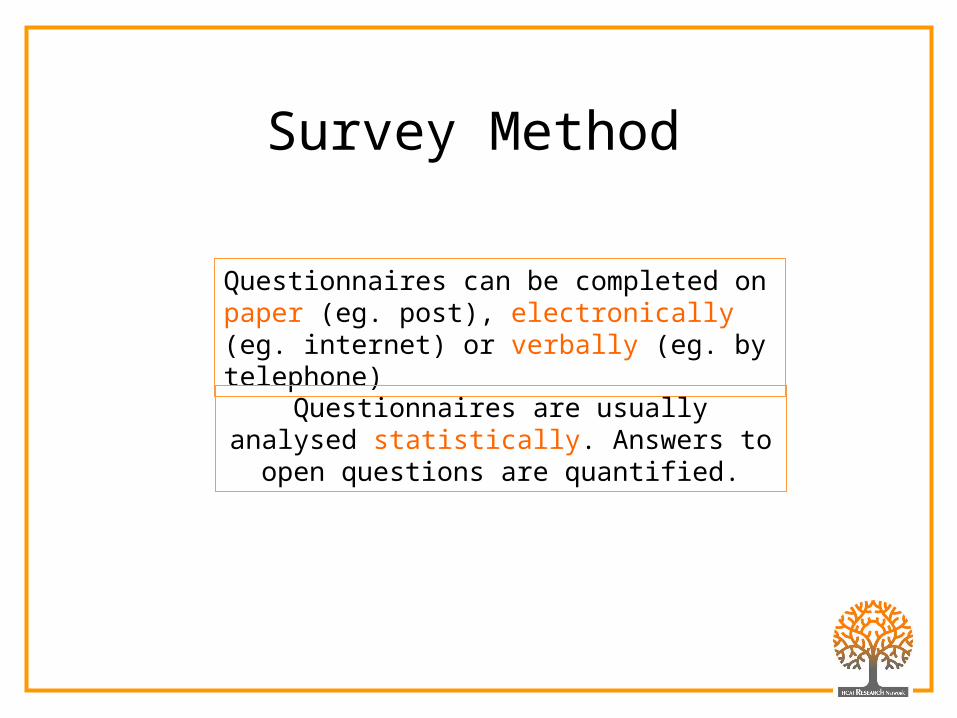
Questionnaires can be completed on paper (eg. post), electronically (eg. internet) or verbally (eg. by telephone)
Questionnaires are usually analysed statistically. Answers to open questions are
quantified.
Survey Method
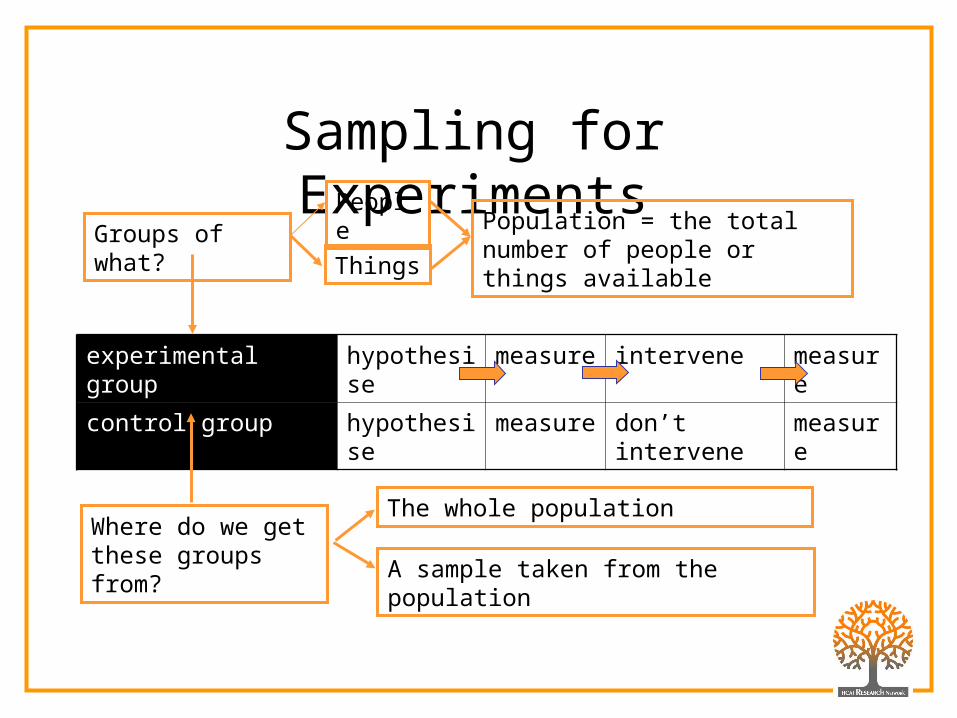
Sampling for Experiments
experimental group hypothesise measure intervene measure
control group hypothesise measure don’t intervene measure
Groups of what?People
Things
Population = the total number of people or things available
Where do we get these groups from?
The whole population
A sample taken from the population
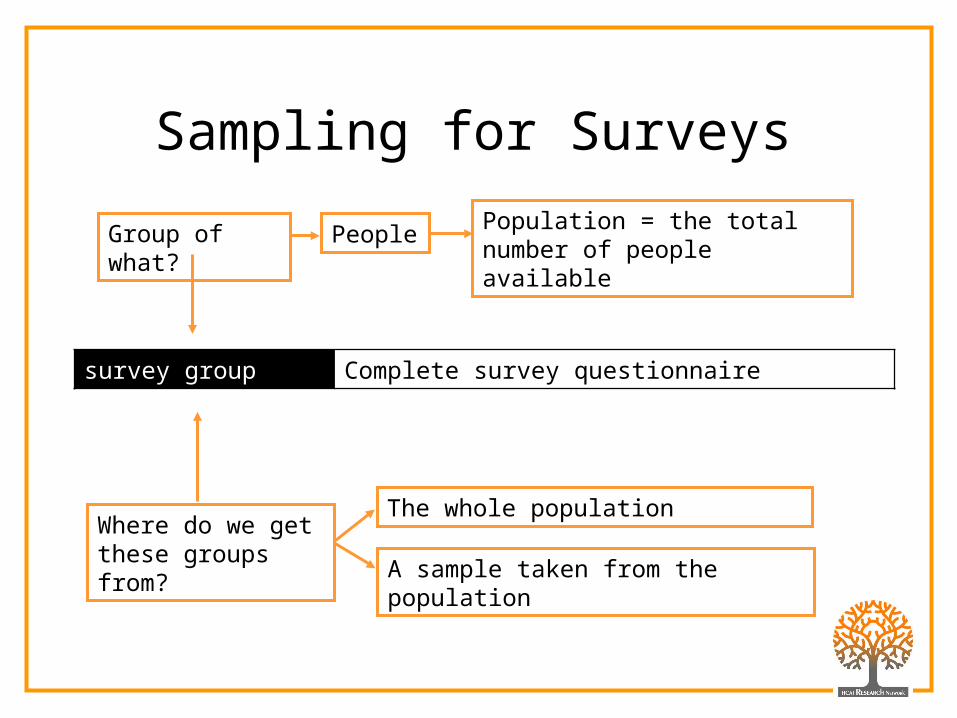
Sampling for Surveys
survey group Complete survey questionnaire
Group of what? PeoplePopulation = the total number of people available
Where do we get these groups from?
The whole population
A sample taken from the population
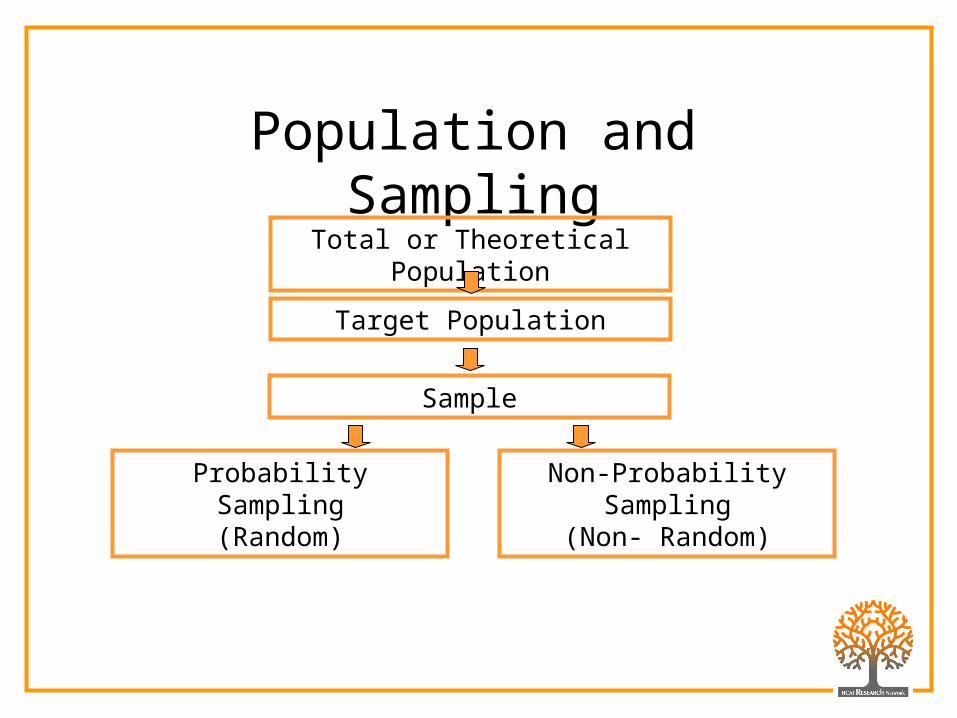
Population and Sampling
Total or Theoretical Population
Sample
Target Population
Probability Sampling(Random)
Non-Probability Sampling(Non- Random)

Stratified Random
Simple Random
Probability Sampling
Systematic Random
Cluster Random
Suitable for homogenous populations each unit should have an equal chance of being chosen.
Suitable for populations which vary greatly in terms of age, gender, education, experience, illness condition.
Units are chosen from the sample frame list at predetermined chosen intervals starting from a randomly chosen point.
Suitable for populations which are arranged in clusters e.g.. Hospitals. Clusters are sampled first followed by units within clusters e.g.. Wards.

Population and SamplingWhat are the characteristics of an ideal
sample for quantitative research?
The sample is representative of
the population
The size of the sample reflects the population diversity
and the study variables
The sample is randomly
selected and if grouped, randomly allocated

Statistical Analysis
There are two main types of statisticsDESCRIPTIVE and INFERENTIAL
Experiments are usually analysed using inferential statistics in which statistical significance is inferred. i.e., that the
difference observed between two or more variables did not happen by chance alone
Surveys are often analysed using both descriptive and inferential statistics

GeneralisationThe ultimate purpose of quantitative research is to be able to generalise the
outcome/s to the population from which the sample was drawn.
In order to be able to generalise the outcomes the research must have:
a randomised, representative sample of an adequate size
Survey & Experiment
reliable and valid interventions and
associated measurements
Experiment
adequate identification and
control of extraneous variables
Experiment

Thank you
Any Questions