Embed Size (px)
Citation preview

An Introduction to XAFS
Matthew Newville
Center for Advanced Radiation SourcesThe University of Chicago
21-July-2018
Slides for this talk: https://tinyurl.com/Larch2018
https://millenia.cars.aps.anl.gov/gsecars/Data/Larch/2018Workshop
M Newville U Chicago 21-July-2018

X-ray Absorption Spectroscopy: XAS, XAFS, EXAFS and XANES.
X-ray Absorption Spectroscopy (XAS) is the modulation of the X-rayabsorption coefficient at energies at and above an X-ray absorption edge.
XAFS X-ray Absorption Fine-Structure Spectroscopy (= XAS)XANES X-ray Absorption Near-Edge SpectroscopyEXAFS Extended X-ray Absorption Fine-Structure
These contain information about an element’s chemical state (XANES)and local atomic environment (EXAFS).
Fe K-edge XAFS for FeO.
Main XAS Characteristics:
local atomic coordination
valence, oxidation state
applies to any element (Z > 2) .
works at low concentrations (ppm, µM)
minimal sample requirements.
independent of crystal structure, isotope.
X-ray Absorption / X-ray Fluorescence M Newville U Chicago 21-July-2018

X-Ray Absorption and the Photo-Electric Effect
X-rays are absorbed by all matter through the photo-electric effect:
An atom absorbs an x-ray when thex-ray energy is transferred to acore-level electron (K, L, or M shell).
The atom is left in an excited statewith a core hole – an emptyelectronic level.
Any excess energy from the x-ray isgiven to an ejected photo-electron.
A. Einstein, Nobel Prize, 1921 “For his services to
Theoretical Physics, and especially for his discovery
of the law of the photoelectric effect”. 1s K
2s L1
2p L2, L3
3s M1
3p M2,M3
3d M4,M5
valence bandEFermi
conduction bandEvacuum
Energy
X-ray
photoelectron
X-ray Absorption / X-ray Fluorescence M Newville U Chicago 21-July-2018

X-ray Fluorescence and Auger emission
After X-ray absorption, the excited atom relaxes to the ground state. A higher levelelectron fills the core hole, and a fluorescent X-ray or Auger electron is emitted.
X-ray Fluorescence: Emit an X-ray withenergy given by core-levels energies.
1s K
2s L1
2p L2, L3
3s M1
3p M2,M3
3d M4,M5
Evacuum
Energy
Kα Kβ
Charles Barkla, Nobel Prize, 1917 “discovery of the
characteristic Rontgen radiation of the elements”
Auger Effect: Promote an electron fromanother core-level to the continuum.
1s K
2s L1
2p L2, L3
3s M1
3p M2,M3
3d M4,M5
Evacuum
Energy
Auger e−
Lise Meitner, no Nobel Prize, first to discover
Auger effect, explained nuclear fission.
X-ray fluorescence and Auger emission have discrete energies, characteristicof the absorbing atom – very useful for identifying atoms!
X-ray Absorption / X-ray Fluorescence M Newville U Chicago 21-July-2018

The X-ray Absorption Coefficient: µ
The intensity of an x-ray beam passing through a material of thickness t is given by theabsorption coefficient µ:
I = I0e−µt I0 I
t
where I0 is the x-ray intensity hitting the material, and I is the intensity transmittedthrough the material.
µ depends strongly on x-rayenergy E atomic number Z ,and also on density ρ, andAtomic mass A:
µ ∼ ρZ 4
AE 3
Plus: µ has sharp Absorption Edges corresponding to the characteristiccore-level energies of the atom.
X-ray Absorption / X-ray Fluorescence M Newville U Chicago 21-July-2018

EXAFS: Extended X-ray Absorption Fine Structure
We’re interested in the energy oscillations in µ(E), as these will tell us some-thing about the neighboring atoms. We define the EXAFS as:
µ(E) = µ0(E)[1 + χ(E)] χ(E) =µ(E)− µ0(E)
∆µ0(E0)
Subtract off a smooth “bare atom” background µ0(E), and divide by the“edge step” ∆µ0(E0) to get the oscillations normalized to 1 absorption event:
µ(E) and smooth µ0(E) for FeO χ(E) for FeO, with E0 = 7122 eV.
X-ray Absorption / X-ray Fluorescence M Newville U Chicago 21-July-2018

EXAFS: χ(k) and XAFS Fourier Transforms
XAFS is an interference effect, using the wave-nature of the photo-electron. We expressthe XAFS in terms of photo-electron wavenumber, k:
k =
√2m(E − E0)
~2
We’ll also then use Fourier Transforms to convert from k to R.
k2χ(k) for FeOFourier Transform |χ(R)| for FeO.Similar to a Pair Distribution Functionfrom scattering techniques.
X-ray Absorption / X-ray Fluorescence M Newville U Chicago 21-July-2018
The EXAFS Equation
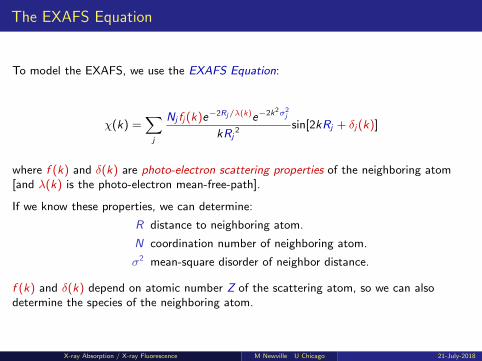
To model the EXAFS, we use the EXAFS Equation:
χ(k) =∑j
Nj fj(k)e−2Rj/λ(k)e−2k2σ2j
kRj2 sin[2kRj + δj(k)]
where f (k) and δ(k) are photo-electron scattering properties of the neighboring atom[and λ(k) is the photo-electron mean-free-path].
If we know these properties, we can determine:
R distance to neighboring atom.
N coordination number of neighboring atom.
σ2 mean-square disorder of neighbor distance.
f (k) and δ(k) depend on atomic number Z of the scattering atom, so we can alsodetermine the species of the neighboring atom.
X-ray Absorption / X-ray Fluorescence M Newville U Chicago 21-July-2018

XAFS Theory
Development of the EXAFS Equation
the short version
Theory / X-ray Absorption M Newville U Chicago 21-July-2018

X-ray Absorption by a Free Atom
An atom absorbs an x-ray (energy E), destroying a core electron (energy E0) and creatinga photo-electron (energy E − E0). The core hole is eventually filled, and a fluorescencex-ray or Auger electron is ejected from the atom.
absorbing atom
E0Energy
µ
λ ∼ 1/√
(E − E0)
photo-electron
X-ray
1s core level
X-ray absorption needs an avail-able state for the photo-electronto go into:
No available state:No absorption
Once the x-ray energy is largeenough to promote a core-levelto the continuum, there is asharp increase in absorption.
µ(E) has a sharp step at the core-level binding energy, andis a smooth function of energy above this absorption edge.
Theory / X-ray Absorption M Newville U Chicago 21-July-2018

X-ray Absorption with Photo-Electron Scattering
With another atom nearby, the ejected photo-electron can scatter from a neighboringatom. The amplitude of the photo-electron scattered back to the absorbing atom willcause oscillations in µ(E).
absorbing atom scattering atom
E0Energy
µ
λ ∼ 1/√
(E − E0)
photo-electron
X-ray
1s core level
The photo-electron scatteredback will interfere with itself.
µ depends on the presence ofan electron state with energy(E − E0), at the absorbing atom.
The scattered photoelectron par-tially fills that state.
XAFS oscillations are due to the interference of the outgoing photo-electronwith the photo-electron scattered from neighboring atoms.
Theory / X-ray Absorption M Newville U Chicago 21-July-2018

The EXAFS Equation: simple description
The XAFS – the change in µ – is the overlap of the returning, scatteredphoto-electron with the tightly bound core electron
With a spherical wave for the photo-electron:
ψ(k, r) = e ikr/kr
χ(k) is due to the photo-electron:
1 leaves the absorbing atom
2 scatters from the neighbor atom
3 returns to the absorbing atom
absorbing atom scattering atom
E0Energy
µ
λ ∼ 1/√
(E − E0)
photo-electron
X-ray
1s core level
χ(k) =e ikR
kR[2kf (k)e iδ(k)]
e ikR
kR+ C .C .
f (k) the scattering amplitude for the atom.
δ(k) the scattering phase-shift for the atom.
Theory / X-ray Absorption M Newville U Chicago 21-July-2018
Development of the EXAFS Equation: Coordination Sphere
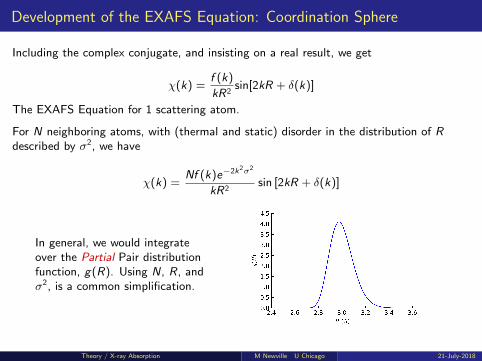
Including the complex conjugate, and insisting on a real result, we get
χ(k) =f (k)
kR2sin[2kR + δ(k)]
The EXAFS Equation for 1 scattering atom.
For N neighboring atoms, with (thermal and static) disorder in the distribution of Rdescribed by σ2, we have
χ(k) =Nf (k)e−2k2σ2
kR2sin [2kR + δ(k)]
In general, we would integrateover the Partial Pair distributionfunction, g(R). Using N, R, andσ2, is a common simplification.
Theory / X-ray Absorption M Newville U Chicago 21-July-2018

Photo-Electron Mean-Free Path
We used a spherical wave for the photo-electron, ψ(k, r) ∼ e ikr/kr to get to
χ(k) =∑j
Nj fj(k)e−2k2σ2j
kRj2 sin[2kRj + δj(k)]
The photo-electron can also scatter inelastically, and may not be ableto get back the absorbing atom in tact (in phase, at energy).
Plus: the core-level has a finite lifetime, before it is filled. This alsolimits how far the photo-electron can go out.
A mean free path – λ – describes how far the photo-electron can go before it losesenergy/coherence.
ψ(k, r) ∼ e ikre−r/λ(k)
kr
Theory / X-ray Absorption M Newville U Chicago 21-July-2018

Photo-Electron Mean-Free Path
Using ψ(k, r) ∼ e ikre−r/λ(k)
kradds a term to the EXAFS equation:
χ(k) =∑j
Nj fj(k)e−2Rj/λ(k)e−2k2σ2j
kRj2 sin[2kRj + δj(k)]
λ . 30 A for k > 3 A−1.
This (and the R−2) makes EXAFS alocal atomic probe.
λ increases at low k.
XANES is less a local probe thanEXAFS.
λ has a universal and strong k dependence, but is mostly independent of the material.
Theory / X-ray Absorption M Newville U Chicago 21-July-2018
Scattering Amplitude and Phase-Shift
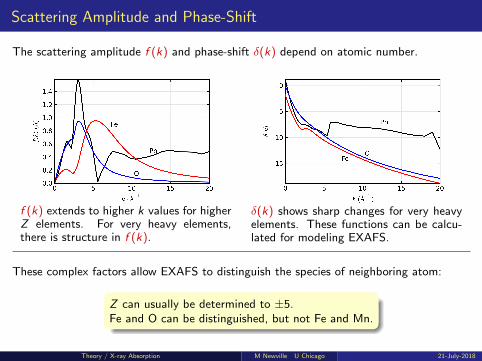
The scattering amplitude f (k) and phase-shift δ(k) depend on atomic number.
f (k) extends to higher k values for higherZ elements. For very heavy elements,there is structure in f (k).
δ(k) shows sharp changes for very heavyelements. These functions can be calcu-lated for modeling EXAFS.
These complex factors allow EXAFS to distinguish the species of neighboring atom:
Z can usually be determined to ±5.Fe and O can be distinguished, but not Fe and Mn.
Theory / X-ray Absorption M Newville U Chicago 21-July-2018

The EXAFS Equation
To model the EXAFS, we use the EXAFS Equation:
χ(k) =∑j
Nj fj(k)e−2Rj/λ(k)e−2k2σ2j
kRj2 sin[2kRj + δj(k)]
where f (k) and δ(k) are photo-electron scattering properties of the neighboring atom[and λ(k) is the photo-electron mean-free-path].
If we know these properties, we can determine:
R distance to neighboring atom.
N coordination number of neighboring atom.
σ2 mean-square disorder of neighbor distance.
f (k) and δ(k) depend on atomic number Z of the scattering atom, so we can alsodetermine the species of the neighboring atom.
Theory / X-ray Absorption M Newville U Chicago 21-July-2018

XAFS Data Reduction
XAFS Data Reduction M Newville U Chicago 21-July-2018

XAFS Data Reduction
We begin with Data Reduction:
Converting measured data to µ(E) and then to χ(k)
This won’t tell us R, N, and neighbor species, but it will:
1 help us determine data quality
2 can be useful for “spectroscopic” analysis:fingerprinting, linear combinations of spectra, etc.
3 needed to get to χ(k) for further modeling.
XAFS Data Reduction M Newville U Chicago 21-July-2018

XAFS Data Reduction: Strategy
Step for reducing measured data to µ(E) and then to χ(k):
1 convert measured intensities to µ(E)
2 subtract a smooth pre-edge function, to get rid of any instrumental background, andabsorption from other edges.
3 normalize µ(E) to go from 0 to 1, so that it represents the absorption of 1 x-ray.
4 remove a smooth post-edge background function to approximate µ0(E) to isolatethe XAFS χ.
5 identify the threshold energy E0, and convert from E to k space: k =√
2m(E−E0)
~2
6 (optional) weight the XAFS χ(k) and Fourier transform from k to R space.
7 (optional) isolate the χ(k) for an individual “shell” by Fourier filtering.
XAFS Data Reduction M Newville U Chicago 21-July-2018

Data Reduction: Converting Raw Data to µ(E )
Starting with measured intensities, we construct µ(E):
I0 I
For Transmission XAFS
I = I0e−µ(E)t
µ(E)t = − ln(I/I0)
XAFS Data Reduction M Newville U Chicago 21-July-2018

Data Reduction: Normalized XANES and E0
XANES
The XANES portion (below)shows a fairly rich spectralstructure. We’ll come backto this for XANES analysis.
Derivative
We can select E0 easily as theenergy with the maximumderivative. This is somewhatarbitrary, so we may need torefine this value later on.
XAFS Data Reduction M Newville U Chicago 21-July-2018

Data Reduction: Pre-Edge Subtraction, Normalization
Data reduction of µ(E) data goes like this:
Pre-Edge Subtraction
We subtract away the back-ground that fits the pre-edgeregion. This gets rid of theabsorption due to other edges(say, the Fe LIII edge).
Normalization
We estimate the edge step,∆µ0(E0) by extrapolating asimple polynomial fit to µ(E)to the edge energy E0. Wedivide by this value to get theabsorption from 1 x-ray.
XAFS Data Reduction M Newville U Chicago 21-July-2018
Data Reduction: Post-Edge Background Subtraction
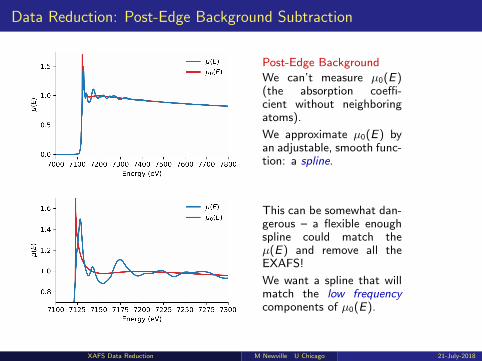
Post-Edge Background
We can’t measure µ0(E)(the absorption coeffi-cient without neighboringatoms).
We approximate µ0(E) byan adjustable, smooth func-tion: a spline.
This can be somewhat dan-gerous – a flexible enoughspline could match theµ(E) and remove all theEXAFS!
We want a spline that willmatch the low frequencycomponents of µ0(E).
XAFS Data Reduction M Newville U Chicago 21-July-2018

Data Reduction: χ(k), k-weighting
χ(k)
The raw EXAFS χ(k) usuallydecays quickly with k, and dif-ficult to assess or interpret byitself.
It is customary to weight thehigher-k portion of the spec-tra by multiplying by k2 or k3.
k-weighted χ(k): k2χ(k)
χ(k) is composed of sinewaves, so we’ll Fourier Trans-form from k to R-space. Toavoid “ringing”, we’ll multiplyby a window function.
XAFS Data Reduction M Newville U Chicago 21-July-2018
EXAFS Fourier Transform: χ(R)
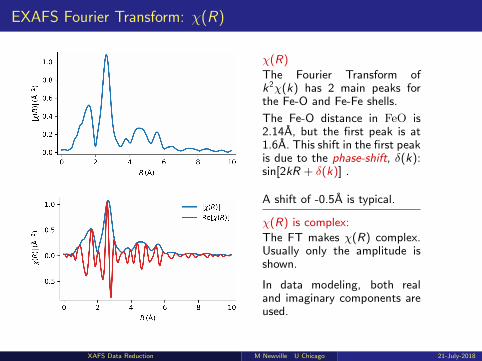
χ(R)
The Fourier Transform ofk2χ(k) has 2 main peaks forthe Fe-O and Fe-Fe shells.
The Fe-O distance in FeO is2.14A, but the first peak is at1.6A. This shift in the first peakis due to the phase-shift, δ(k):sin[2kR + δ(k)] .
A shift of -0.5A is typical.
χ(R) is complex:
The FT makes χ(R) complex.Usually only the amplitude isshown.
In data modeling, both realand imaginary components areused.
XAFS Data Reduction M Newville U Chicago 21-July-2018

XANES
XANES M Newville U Chicago 21-July-2018

XANES: X-ray Absorption Near-Edge Spectra
XANES (within 30eV of the absorption edge) gives the chemical state and formal valenceof selected element:
what are the lowest-energy unoccupied states?
XANES Analysis approaches:
Linearly combine known spectra to match measured spectra.
ab initio calculations to map features to electronic density of states.
XANES M Newville U Chicago 21-July-2018

Fe K-edge XANES
Edge shifts and Heights and positions ofpre-edge peaks can also determine valencestate.
Fe K -edge XANES for several compounds.XANES can be used to fingerprint chemi-cal and mineral phases.
XANES M Newville U Chicago 21-July-2018

XANES Interpretation
The EXAFS Equation breaks down at low-k, as the mean-free-path goes up. Thiscomplicates XANES interpretation:
We do not have a simple equation for XANES.
XANES can be described qualitatively and semi-quantitatively in terms of
coordination chemistry regular, distorted octahedral, tetrahedral, . . .molecular orbitals p-d orbital hybridization, crystal-field theory, . . .band-structure the density of available electronic states.multiple-scattering multiple bounces of the photo-electron.
What electronic states can the photo-electron fill?
XANES calculations are becoming reasonably accurate. These can help interpret spectrain terms of bonding orbitals and/or density of states.
XANES M Newville U Chicago 21-July-2018

XANES: Summary
XANES is a much larger signal than EXAFS
XANES can be done at lower concentrations, andless-than-perfect sample conditions.
XANES is easier to crudely interpret than EXAFS
For many systems, the XANES analysis based on linearcombinations of known spectra from “model compounds” issufficient.
XANES is harder to fully interpret than EXAFS
The exact physical and chemical interpretation of all spectralfeatures is still difficult to do accurately, precisely, and reliably.
This situation is improving, so stay tuned to the progress inXANES calculations . . . .
XANES M Newville U Chicago 21-July-2018


![12. [INITIAL] SOFT X-RAY ABSORPTION SPECTROSCOPY · The boron K X-ray absorption spectroscopy (XAS) of polycrystalline MgB2 has been the subject of several studies.2–5 The energies](https://img.pdfslide.net/doc/110x75/5fcf47803ff63b053e78d513/12-initial-soft-x-ray-absorption-spectroscopy-the-boron-k-x-ray-absorption-spectroscopy.jpg)