Embed Size (px)
Citation preview
An investigation into genome-scale ordered RNA
structure (GORS) in murine norovirus and other
positive-stranded RNA viruses
Richard James Blundell
Thesis submitted for the degree of Doctor of Philosophy
University of Edinburgh
March 2010

i
Declaration
I declare that this thesis has been composed by myself and has not been
submitted for any other degree. The work described herein is my own except
where otherwise indicated and all work of other authors is duly acknowledged.
Richard Blundell
March 2010
Centre for Infectious Diseases
Royal (Dick) School of Veterinary Studies
University of Edinburgh
Summerhall Square
Edinburgh, EH9 1QH
ii
Acknowledgements
Firstly, I’d like to thank my supervisor Professor Peter Simmonds for the
opportunity to do this project; my second supervisor Professor Tony Nash and
the other members of my thesis committee for their contributions along the way
in keeping me on track.
Many thanks go to all the members of the Simmonds group with whom I’ve
shared these last four years: especially Dr Matt Davis with whom I worked most
closely on parts of this PhD; along with Dr Carol Leitch, Dr Colin Sharp, Dr Jill
Douglas, Ingrid Imhof, Ellie Gaunt and all other lab members who have come
and gone during my time, or I’ve known only briefly: Gareth, Sam, John,
Alison, Paivi, Thaweesak, Kathleen, Chloe, honours students various – thanks
for the companionship, and the incredible level of help you gave in trying to turn
a vet into a lab scientist. A special word of thanks to Dr Selena Sagan, who
appeared in our midst like a Canadian whirlwind and worked with me for a
couple of months before leaving again, but made a great contribution. Thanks
also to Anna Meredith for access to her wild rodent samples, source of one of
my biggest Eureka moments.
A big thank-you to everyone in the building: Rennos, Gerald and others in that
group for really helpful advice and ideas, to other students, post-docs and
academic staff, all of whom are ready to offer encouragement and support, of
both the scientific and moral variety; especially the 10.30 regulars – thanks for
tolerating my “getting things off my chest”, and the random pathology stories,
of course.
Thanks must go to my friends and family outside of work, who believed in me
even when experiments didn’t work, and told me I’d get to the end still smiling.
Finalmente, a Julia, quien me ha apoyado a lo largo de estos años con la
paciencia de un santo, mi amor y mi gratitud.
iii
Abstract
Genome-scale ordered RNA structure (GORS) was first identified in 2004. It
refers to the presence of secondary structure throughout the length of the RNA
genomes of certain genera of RNA virus families, as predicted by bioinformatic
analysis. It was also observed that the viruses containing GORS were able to
establish persistent infections in their natural hosts, raising the possibility that
the presence of GORS could play a role in viral avoidance of the innate immune
system.
This thesis describes the first study of GORS and its possible role in persistence.
Two GORS viruses have been studied, equine rhinitis A virus (ERAV) and
murine norovirus (MNV). A 55% seroprevalence of ERAV has been
determined in a cohort of Scottish horses indicating a wide exposure to the
virus. Equine faecal samples were screened for ERAV by PCR with the
intention of identifying a virus, possibly from a persistently infected animal,
which would not have undergone any cell culture adaptations as laboratory
strains have. Newly identified viruses would then be sequenced, their secondary
structures predicted and further studies carried out. Unfortunately, none of the
50 faecal samples screened were positive and clinical isolates of ERAV
provided by the Animal Health Trust were sequenced but were identical to
laboratory strains, so the study then focussed on MNV. Prevalence of MNV in
laboratory mice was determined by PCR of faecal samples to be 67%. MNV
was also discovered in the faeces of a pet shop mouse and a wild wood mouse
(Apodemus sylvaticus). The complete genomes of 4 laboratory mouse MNVs,
the pet shop mouse and wood mouse MNVs were sequenced. Phylogenetic
analysis showed the wood mouse MNV had a p distance of 23% from other
MNVs, although the laboratory mice and pet shop mouse were closely related to
other MNVs. Structural analysis of the genomes of 6 sequenced MNVs,
including the wood mouse virus, showed all were GORS viruses. A laboratory
strain of MNV, MNV-3, was serially passaged in RAW 264.7 cells to test the
hypothesis that in an animal with an intact immune system, there is a pressure
for GORS viruses to maintain their genomic RNA structure as a means of
immune avoidance, and that cell culture adaptation would attenuate the degree
of secondary structure. The complete genome of passage 33 was sequenced,
iv
which revealed 7 base mutations, a mutation rate of 0.1 %, which was not
considered significant enough to have affected the degree of secondary
structure.
In order to assess if structured and unstructured RNA behaved differently in
cells, replication deficient RNA transcripts were made from the infectious
clones of a panel of GORS and non-GORS viruses. These transcripts were
electroporated into cells and their rate of decay measured, but there was no
difference between the GORS and non-GORS transcripts. The full length and 4
kilobase transcripts were transfected into NIH3T3 cells and the degree of
interferon-β induction measured by quantitative PCR and a luciferase reporter
assay. The IFN-β response differed across the panel of viruses, and although
none of the GORS viruses induced strongly, the non-GORS viruses were
variable in their ability to induce an IFN-β response, some inducing strongly,
other not at all. This result indicates that during exposure of viral genomes in
the cytoplasm during infection, GORS-virus RNAs are unlikely to induce an
interferon response, possibly contributing to their ability to persist. It is unclear
why some non-GORS-viruses failed to induce IFN and there are likely to be
other contributory factors.
v
Contents
Declaration………………………………………………………………
Acknowledgments……………………………………………………….
Abstract…………………………………………………………………..
Contents………………………………………………………………….
List of figures…………………………………………………………….
List of tables……………………………………………………………
Abbreviations…………………………………………………………….
i
ii
iii
v
xi
xiv
xvi
Chapter 1 General introduction………………………………………
1.1 Caliciviridae………………………………………………………...
1.2 Noroviruses………………………………………………….……...
1.2.1 History of noroviruses…………………………….……...
1.2.2 Norovirus classification…………………………..………
1.2.3 Norovirus virion structure………………………….……..
1.2.4 Norovirus genome structure……………………….……..
1.2.5 Norovirus attachment and cell entry……………….……..
1.2.6 Calicivirus / Norovirus replication………………….…….
1.2.7 Norovirus infections of humans…………………….…….
1.2.8 Noroviruses in animals……………………………….…..
1.2.9 Murine norovirus…………………………………….……
1.2.10 Immunity to noroviruses…………………………….…..
1.2.11 Diagnosis of noroviruses…………………………….…..
1.3 Viruses and innate immunity………………………….…………….
1.3.1 Introduction to interferon system…………….……………
1.3.2 Detection of viral PAMPs…………………………………
1.3.3 IFN induction pathways…………………………………...
1.3.4 Signalling responses to IFN………………….……………
1.3.5 IFN effector mechanisms…………………….……………
1
2
5
5
5
7
7
8
9
10
11
12
14
18
19
19
20
24
25
28
vi
1.3.5.1 Antiviral state……………………………………
1.3.5.2 PKR……………………………………………...
1.3.5.3 2’5’ OAS…………………………….……….….
1.3.5.4 Mx…………………………………….…………
1.3.5.5 ISG15……………………………………………
1.3.5.6 PML nuclear bodies……………………………..
1.3.5.7 Adenosine deaminases (ADARs)……………….
1.3.5.8 Viperin…………………………………………..
1.3.5.9 Apoptosis………………………………………..
1.3.5.10 Cell-cycle arrest………………………………..
1.3.5.11 Immunomodulation…………………………….
1.3.6 Viral strategies for avoidance of IFN system……….……..
1.3.6.1 Interference with host-cell gene expression…….
1.3.6.2 Minimizing IFN production……………….…….
1.3.6.3 Inhibition of IFN signalling……………….…….
1.3.6.4 Inhibition of IFN induced enzymes……………..
1.4 RNA stability………………………………………………………..
1.5 Persistent infections…………………………………………………
1.6 Genome-Scale Ordered RNA Structure (GORS)……………………
1.6.1 RNA secondary structures in viruses……………….……..
1.6.2 Bioinformatic prediction of RNA secondary structure……
1.6.3 Discovery of GORS……………………………………….
1.6.4 Possible roles of GORS in viral persistence………………
1.7 Project aims…………………………………………………………
Chapter 2 Materials and Methods…………………………….……..
2.1 Cell culture…………………………………………………………..
28
28
28
29
30
31
31
32
32
33
33
34
34
36
40
42
44
46
50
50
51
53
55
57
58
59
vii
2.1.1 Cell Culture………………………………………………..
2.1.2 Cell Counting……………………………………………...
2.1.3 Freezing and thawing cells………………………………...
2.2 PCR screening of ERAV and MNV………………………………...
2.2.1 Collection and processing of equine samples……….…….
2.2.2 Collection and processing of murine faecal samples……...
2.2.3 Extraction of viral RNA…………………………………..
2.2.4 Reverse transcription………………………………….…..
2.2.5 Design primers for screening of ERAV and MNV….……
2.2.6 Polymerase chain reaction (PCR)…………………………
2.2.7 Agarose gel electrophoresis……………………………….
2.2.8 PCR of two regions of MNV for phylogenetic analysis….
2.3 Sequencing of ERAV and MNV genomes………………….………
2.3.1 Design of primers for complete genome sequencing.……..
2.3.2 Sequencing reaction………………………………….……
2.3.3 Genome sequencing of a novel norovirus…………………
2.4 Phylogenetic analysis………………………………………….…….
2.5 Prediction of folding free energy and RNA structure prediction.…..
2.6 Virus growth and titration……………………………………….…..
2.6.1 Infection of cells with virus and creation of virus stocks…
2.6.2 Titration of viruses………………………………………...
2.6.3 Virus neutralisation assay…………………………………
2.6.4 MNV passage………………………………………….…..
2.7 Creation of RNA transcripts………………………………….……..
2.7.1 Plasmids used in the generation of RNA transcripts….…..
2.7.2 Generation of RNA transcripts from plasmids……………
2.7.3 Enzymatic treatment of RNA transcripts……………….…
59
59
60
61
61
62
62
63
64
65
66
67
67
67
75
76
78
78
79
79
80
81
82
83
83
84
84
viii
2.8 RNA stability study……………………………………………….…
2.8.1 Electroporation of cells……………………………………
2.8.2 Extraction of total cellular RNA…………………………..
2.8.3 Quantitative real-time PCR………………………………..
2.8.4 Creation of standard curves for stability study……………
2.9 Four kilobase transcripts ……………………………………………
2.9.1 Creation of 4 kb RNA transcripts…………………………
2.9.2 Four kilobase PCR………………………………………...
2.9.3 Gel purification of 4 kb PCR products……………………
2.9.4 Second PCR and PCR purification………………………..
2.9.5 DNA Precipitation…………………………………...……
2.9.6 Determination of nucleic acid concentration……………...
2.9.7 In vitro transcription………………………………………
2.9.8 RNA Cleanup………………………………………….…..
2.9.9 Calculation of RNA copy number…………………….…..
2.9.10 Phosphatase treatment……………………………….…..
2.10 Interferon induction study……………………………………….…
2.10.1 Transfection of RNA transcripts………………………
2.10.2 Quantitative real-time PCR of IFN-β and 18SrRNA……
2.10.3 Luciferase reporter assay………………………………..
Chapter 3 Equine Rhinitis A Virus – prevalence in Scottish
horses……………………………………………………………………
3.1 Introduction………………………………………………………….
3.1.1 Picornaviridae……………………………………………..
3.1.1.1 Virion structure………………………………….
3.1.1.2 Genome structure………………………………..
3.1.1.3 Attachment and cell entry of aphthoviruses…….
3.1.1.4 Translation of Picornavirus RNA……………….
85
85
85
86
88
88
88
89
90
91
91
91
92
92
93
93
94
94
95
96
98
99
99
100
100
101
101
ix
3.1.1.5 Assembly of virus particles……………………..
3.1.2 Equine Rhinitis A virus…………………………….……..
3.1.2.1 Clinical features and epidemiology of ERAV….
3.1.2.2 Classification of ERAV as an aphthovirus……...
3.2 Objectives…………………………………………………………..
3.3 Results……………………………………………………………….
3.4 Discussion…………………………………………………………...
Chapter 4 Murine norovirus – prevalence, genomic RNA structure
and the identification of a novel MNV in the wood mouse
(Apodemus sylvaticus)……………………………………………….…
4.1 Introduction………………………………………………………….
4.2 Objectives……………………………………………………………
4.3 Results……………………………………………………………….
4.3.1 Prevalence of MNV……………………………………….
4.3.2 Phylogenetic analysis………………………….…………..
4.3.3 MNV secondary structure prediction………….…………..
4.3.4 Effect of serial passage……………………………………
4.4 Discussion…………………………………………………………...
Chapter 5 A Study of the Interactions of GORS and non-GORS
RNA Transcripts With Cellular RNA Stability Mechani sms and
Innate Cellular Immunity …………………………………………..…
103
103
102
105
106
107
109
111
112
114
116
116
116
124
132
133
139
x
5.1 Introduction………………………………………………………….
5.2 Objectives……………………………………………………………
5.3 Results
5.3.1 Stability of GORS and non-GORS RNA transcripts in
NIH3T3 cells…………………………………………………….
5.3.2 IFN-β induction by full length/truncated RNA transcripts
of GORS and non-GORS viruses in NIH3T3 cells and A549
cells……………………………………………………………...
5.3.3 IFN-β induction by GORS and non-GORS viral RNA
transcripts pre- and post-phosphatase treatment………………..
5.3.4 IFN-β induction by GORS and non-GORS transcripts in
A549 and A549 NPro cells……………………………………..
5.3.5 IFN-β induction by 4 kb GORS and non-GORS transcripts
5.3.6 IFN-β induction: dose response to long and 4 kb RNA
transcripts………………………………………………………..
5.4 Discussion…………………………………………………………..
5.5 Future work………………………………………………………….
Chapter 6 Final discussion…………………………………………....
List of references………
Appendix Original sequence data generated during project
…………………………………………………………..
140
146
147
155
162
164
165
170
173
181
185
193
234
xi
List of figures
Figure 1.1 Phylogenetic trees showing calicivirus genera Figure 1.2: Phylogenetic tree of norovirus genus Figure 1.3: Genome of MNV Figure 1.4: Diagram of MNV polyprotein Figure 1.5 TLR3 signal transduction pathway Figure 1.6 RIG-I and MDA-5 signal transduction pathway Figure 1.7 IFN effector transduction pathway Figure 1.8 IFN effector mechanism pathways Figure 1.9 Viral strategies for evasion of detection and induction of IFN-β Figure 1.10 The distributions of MFEDs across the genomes of genera of picornaviruses and flaviviruses Figure 1.11 Correlation between secondary structure and persistence Figure 2.1. Position of primers on ERAV genome Figure 2.2. Position of primers on MNV genome Figure 2.3 Table used in recording result of virus neutralisation assay Figure 3.1: FMDV genome Figure 3.2: FMDV polyprotein Figure 3.3: Gel showing result of screening with ERAV capsid primers on AHT clinical isolates Figure 4.1 Phylogenetic analysis of almost complete MNV genome nucleotide sequences Figure 4.2 Phylogenetic analysis of almost complete MNV amino acid sequence Figure 4.3 Phylogenetic analysis of a region of non-structural MNV genome nucleotide sequence
3 6 8 9 24 24 27 34 39 54 55 68 71 81 101 103 108 118 119 120
xii
Figure 4.4 Phylogenetic analysis of a region of structural MNV genome nucleotide sequence Figure 4.5 Phylogenetic analysis of the amino acid sequence of the norovirus capsid protein VP1 Figure 4.6 A-J Distribution of average MFEDs of consecutive fragments along the genomes of 10 MNVs Figure 4.7 Distribution of MFED of all fragments along the genomes of 10 MNVs Figure 4.8 PCR of dilution series of pMNV using MNV caps and degenerate norovirus primers Figure 5.1 Real-time PCR standard curves, melt curves and efficiency data of 6 viruses for RNA stability study Figure 5.2 Graph showing % decline of 6 viral RNA transcripts Figure 5.3 Real-time PCR standard curves, melt curves and efficiency data of murine and human IFN-β and 18SrRNA Figure 5.4 IFN-β induction in NIH3T3 cells following transfection of predicted GORS and non-GORS viral RNA transcripts measured by quantitative real-time PCR Figure 5.5 Expression of luciferase reporter in NIH3T3 cells following transfection of predicted GORS and non-GORS viral RNA transcripts Figure 5.6 IFN-β induction in A549 cells following transfection of predicted GORS and non-GORS viral RNA transcripts measured by quantitative real-time PCR Figure 5.7 Expression of luciferase reporter in A549 cells following transfection of predicted GORS and non-GORS viral RNA transcripts Figure 5.8 IFN-β induction in NIH3T3 cells following transfection of predicted GORS and non-GORS viral RNA transcripts, phosphorylated and dephosphorylated measured by quantitative real-time PCR Figure 5.9 Expression of luciferase reporter in A549 cells following transfection of predicted GORS and non-GORS viral RNA transcripts, phosphorylated and dephosphorylated transcripts Figure 5.10 IFN-β induction in A549n and A549 NPro cells following transfection of a predicted GORS and non-GORS viral RNA transcript, phosphorylated measured by quantitative real-time PCR.
121 122 125 130 134 148 154 156 160 160 161 161 163 163 164
xiii
Figure 5.11 IFN-β induction in NIH3T3 cells following transfection of predicted GORS and non-GOR) viral RNA transcripts, long transcripts and 4 kb transcripts measured by quantitative real-time PCR. Figure 5.12 Expression of luciferase reporter in NIH3T3 cells following transfection of predicted GORS and non-GORS viral RNA transcripts, long transcripts and 4 kb transcripts Figure 5.13 Expression of luciferase reporter in A549 cells following transfection of predicted GORS and non-GORS viral RNA transcripts, long transcripts and 4 kb transcripts Figure 5.14 Expression of luciferase reporter in A549 cells following transfection of 4 kb transcripts predicted GORS and non-GORS viral RNA transcripts, phosphorylated and dephosphorylated transcripts Figure 5.15 IFN-β induction in NIH3T3 cells – dose response to long transcripts of GBV-C and BV RNA transcripts measured by real-time PCR Figure 5.16 IFN-β induction in NIH3T3 cells – dose response to long transcripts of MNV and TMEV RNA transcripts measured by real-time PCR Figure 5.17 IFN-β induction in NIH3T3 cells – dose response to 4 kb transcripts of GBV-C, MNV (blue bars) and BV (green bars) RNA transcripts measured by real-time PCR Figure 5.18 Expression of luciferase reporter in NIH3T3 cells – dose response to 4 kb transcripts of GBV-C and BV RNA transcripts Figure 5.19 A-F Growth curves of 6 viruses measured by real-time PCR
166 168 168 169 171 171 171 171 183
xiv
List of tables
Table 1.1: Viruses that avoid the IFN system by global inhibition of host cell gene expression Table 1.2: Viruses that inhibit IFN production in infected cells Table 1.3: Viruses that inhibit IFN signalling Table 1.4: Viral anti-PKR mechanisms Table 1.5 A selection of persistent viral infection with mechanisms of persistence Table 2.1 List of cell lines used in this project Table 2.2 List of screening primers for ERAV, MNV and norovirus Table 2.3 List of degenerate bases Table 2.4 Standard PCR conditions Table 2.5 Primers used for PCR of two MNV sequences for use in phylogenetic analysis Table 2.6 Primer sets used in almost complete genome sequencing of ERAV Table 2.7 Primer sets used in almost complete genome sequencing of MNV Table 2.8 Primers specific for Apodemus MNV Table 2.9 Primer sets fro complete genome sequencing of Apodemus MNV Table 2.10 Viruses used in this project and cell lines Table 2.11 Infectious clones used to manufacture RNA transcripts; and source Table2.12 Restriction enzyme used to truncate plasmids Table 2.13 Primers used in RNA stability study Table 2.14 Condition used in real-time PCR Table 2.15 Primers used to create 4 kb transcripts, with T7 sequence attached to sense primers
35 39 40 42 49 60 65 65 66 67 70 74 76 77 79 83 84 87 87 89
xv
Table 2.16 4 kb PCR conditions Table 2.17 Primes for human IFN-β PCR Table 3.1: Neutralisation titres of 53 equine sera Table 3.2: Result of prevalence screen of ERAV by PCR Table 3.3: PCR result of AHT ERAV isolates Table 4.1 Table showing prevalence of MNV in faecal samples by PCR Table 4.2 Table showing p distances based on nucleotide sequence of the complete genome from 6 novel MNVs: and published MNVs Table 4.3 Table showing p distances based on amino acid sequence of the complete genome from 6 novel MNVs: and published MNVs Table 4.4 Showing single base mutations after 33 passages of MNV-3 at high moi Table 5.1 Table of viruses used in this study Table 5.2 Table showing truncated viruses Table 5.3 Standard deviations of % changes at each time point for each virus
90 95 107 107 108 116 123 123 124 142 145 154
xvi
Abbreviations 2’5’OAS 2’5’ oligoadenylate synthetase
A Adenosine
ADAR Adenosine deaminase
BV/BUNV Bunyamwera virus
C Cytosine
CaCV Canine calicivirus
CARD Caspase recruitment domain
Cardif CARD adaptor IFN-β
cDNA complementary DNA
CMV Cytomegalovirus
CPE Cytopathic Effect
CRE cis-acting replication element
CTD C terminal domain
CTL Cytotoxic T-Lymphocyte
D-MEM Dulbecco’s Modified Eagle’s Medium
DMSO Dimethylsulphoxide
DNA Deoxyribonucleic Acid
dNPT Deoxy-Nucleoside Triphosphate
dsDNA Double Stranded DNA
dsRNA Double-stranded RNA
E11 Echovirus 11
EDTA Ethylenediaminetetraacetic acid
EEEV Eastern Equine Encephalitis Virus
eGFP Enhanced Green Fluorescent Protein
EMCV Encephalomyocarditis Virus
ER Endoplasmic Reticulum
ERAV Equine rhinitis A virus
FCS Foetal Calf Serum
FCV Feline calicivirus
FMDV Foot-and-Mouth Disease Virus
G Guanosine
GBV-C GB virus-C
GORS Genome-scale ordered RNA structure
HCV Hepatitis C Virus
HIV Human Immunodeficiency Virus
HSV Herpes Simplex Virus
I Inosine
xvii
IFN Interferon
IKK I κB kinase
IL Interleukin
IPS-1 IFN promoter stimulator
IRAK Interleukin-1 receptor-associated kinase
IRES Internal Ribosome Entry Site
IRF IFN regulatory factor
IRF-3 IFN regulatory factor 3
ISG IFN stimulated gene
JAK Janus kinase
Kb Kilobase
LCMV Lymphocytic Choriomeningitis Virus
M.O.I Multiplicity of Infection
MAVS Mitochondrial activated signalling
MCP Monocyte chemotactic protein
MDA-5 Melanoma differentiation associated gene 5
MDCK Madin-Darby canine kidney
MFE Minimum free energy
MFED Minimum free energy difference
MHC Major Histocompatibility Complex
MHV Mouse Hepatitis Virus
MLN Mesenteric lymph node
MNV Murine norovirus
MV Measles Virus
NEMO NF-κB essential modifier
NF-κB Nuclear factor κB
NK cell Natural killer cell
nsP Non Structural Protein
OD Optical Density
ORF Open Reading Frame
P Protruding domain
PAMP Pathogen associated molecular pattern
PBS Phosphate Buffered Saline
PCR Polymerase Chain Reaction
pDC Plasmacytoid dendritic cells
PEMV Pea enation mosaic virus
PKR dsRNA-activated protein kinase
PML NB Promyelocytic leukaemia nuclear bodies
PRR Pattern recognition receptor
PV Poliovirus
xviii
RAG Recombination activating gene
RD Rhabdomyosarcoma
RHDV Rabbit haemorrhagic disease virus
RIG-I Retinoic acid inducible gene-I
RIP Recptor interacting protein
RNA Ribonucleic Acid
RT Reverse transcription
RV Rubella virus
S Shell domain
SFV Semliki Forest Virus
SINTBAD Similar to NAP1 TBK1 adaptor
STAT Signal Transducers and Activators of Transduction
SV Sindbis Virus
T Thymine
TAB TAK binding proteins
TAK TGF-β activated kinase
TBE Tris borate EDTA
TBK TANK-binding kinase
TCID50 Tissue culture infective dose 50
TGF-β Transforming growth factor β
TLR Toll-Like Receptor
TMEV Theiler’s Murine Encephalitis Virus
TNF Tumour Necrosis Factor
TRAF TNF receptor associated factor
TRIF Toll IL-1 domain-containing adaptor inducing IFN
TRIM Tripartite motif containing
Tyk Tyrosine kinase
U Uracil
UTR Untranslated region
VEEV Venezuelan Equine Encephalitis Virus
Visa Virus-induce signalling adaptor
VLPs Virus-Like Particles
VPg Viral protein genome-linked
VSV Vesicular stomatitis virus
VZV Varicella Zoster Virus
WEEV Western Equine Encephalitis Virus
WT Wild-type
1
Chapter 1 Introduction
1.1 Caliciviridae 1.2 Noroviruses 1.3 RNA viruses and innate immunity 1.4 RNA stability 1.5 Persistent viral infections 1.6 Genome-scale ordered RNA structure 1.7 Project aims
2
Chapter 1 General introduction
Genome-scale ordered RNA structure (GORS) is a phenomenon first described
by Simmonds et al. in 2004. Using bioinformatic analysis of viral RNA
genomes, based on energy minimising algorithms, regions of secondary
structure were predicted. The term “GORS” describes the occurrence of
extensive RNA formation throughout the length of the RNA genomes in many
families and genera of positive-sense RNA virus families. While the high
degree of structure in these genomes appeared to be unrelated to fundamental
function in viral replication, there was an observed association between the
presence of GORS and the ability of the virus to establish persistent infections.
This thesis presents the first investigation of the biological effect of GORS by
studying aspects of the biology of predicted GORS viruses and the interactions
between structured and unstructured viral RNA with cells.
1.1 Caliciviridae
The Caliciviridae are a family of non-enveloped, single-stranded, positive-sense
RNA viruses. Members of this family cause a range of human and veterinary
diseases. There are four genera within the family, each named after a typical
member of the genus (Green et al., 2000); the four genera are:
i) Vesivirus e.g. Vesicular exanthema of swine virus, Feline calicivirus
ii) Lagovirus e.g. European brown hare syndrome virus, Rabbit haemorrhagic
disease virus
iii) Norovirus e.g. Norwalk virus, Murine norovirus
iv) Sapovirus e.g. Sapporo virus
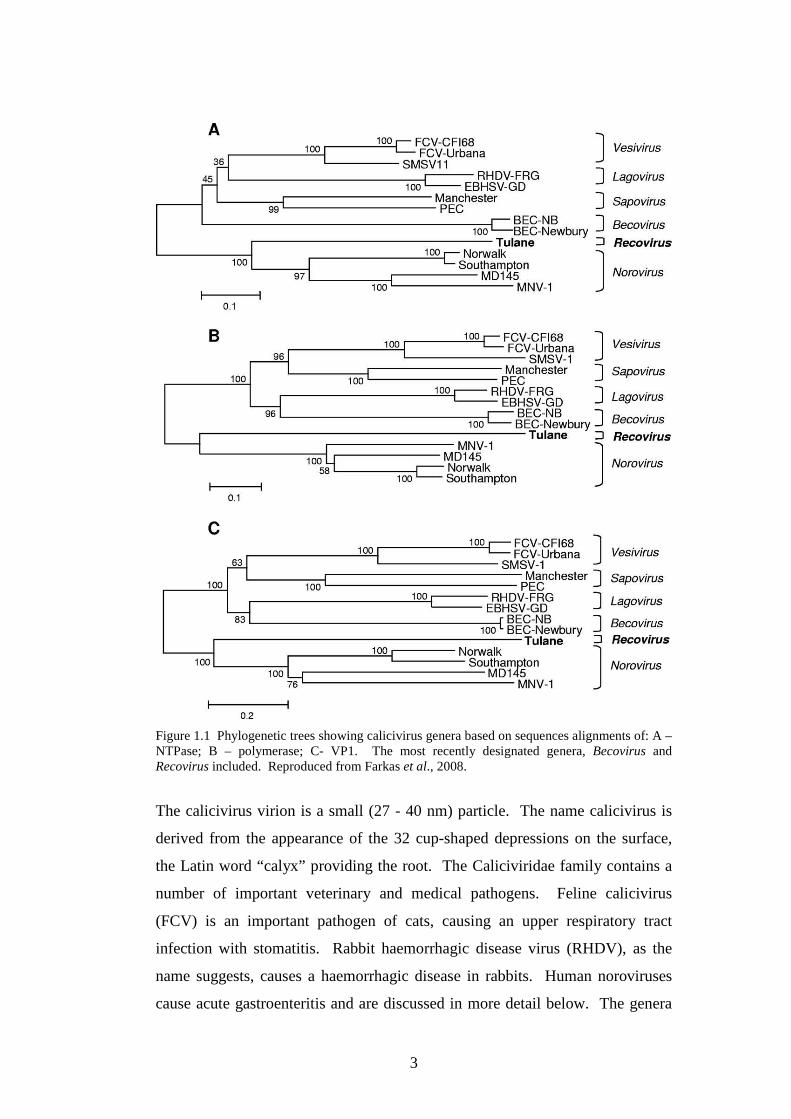
Recent studies have proposed two new genera; bovine enteric virus has been
assigned to a genus with the proposed names of Becovirus or Nabovirus (Oliver
et al., 2006); and the Tulane virus, isolate from rhesus macaques, to a genus
named Recovirus, derived from rhesus enteric calicivirus (Farkas et al., 2008).
3
Figure 1.1 Phylogenetic trees showing calicivirus genera based on sequences alignments of: A – NTPase; B – polymerase; C- VP1. The most recently designated genera, Becovirus and Recovirus included. Reproduced from Farkas et al., 2008.
The calicivirus virion is a small (27 - 40 nm) particle. The name calicivirus is
derived from the appearance of the 32 cup-shaped depressions on the surface,
the Latin word “calyx” providing the root. The Caliciviridae family contains a
number of important veterinary and medical pathogens. Feline calicivirus
(FCV) is an important pathogen of cats, causing an upper respiratory tract
infection with stomatitis. Rabbit haemorrhagic disease virus (RHDV), as the
name suggests, causes a haemorrhagic disease in rabbits. Human noroviruses
cause acute gastroenteritis and are discussed in more detail below. The genera

4
of Caliciviridae share similar virion structures, genome arrangements and
replication strategies (Green, 2007; Fields Virology 5th Edition, Ed by Knipe
and Howley).
5
1.2 Noroviruses
1.2.1 History of noroviruses
The genus Norovirus took its name from the first discovered member of the
genus, Norwalk virus, which cause acute gastroenteritis in humans. Before the
discovery of the virus, episodes of acute non-bacterial gastroenteritis were
known as “winter vomiting disease”, first described by Zahorsky in 1929.
Throughout the 1940s and 1950s volunteer studies in the United States and
Japan demonstrated that the disease was transmissible after administration of
bacteria-free faecal suspensions (Reimann et al., 1945; Jordan et al., 1953;
Fukumi et al., 1957) indicating a viral aetiology. An outbreak of gastroenteritis
in Norwalk, Ohio in 1968 at school affected 50 % of the pupils and teachers
(116 / 232). The disease had an incubation period of ~48 h and the clinical
course lasted ~24 h. The clinical signs of the disease were acute nausea,
vomiting, diarrhoea and abdominal cramps. This was described as an outbreak
of winter vomiting disease due to its similarity to the disease described in 1929
(Adler and Zickl, 1969). The aetiological agent was identified by the discovery
of a 27 nm particle, by immune electron microscopy, in the faecal filtrate of one
of the case from the Norwalk school outbreak (Kapikian et al., 1972). This was
the discovery of Norwalk virus, which became the prototype member of the
genus now known as Norovirus.
1.2.2 Norovirus classification
The classification of noroviruses has been determined predominantly by genetic
analysis as, until the discovery of a cell culture system for murine norovirus
(MNV), propagation of noroviruses in cell culture had not been possible.
Phylogenetic analysis of the sequence of norovirus VP1 sequence divided the
genus into five genogroups: genogroups I, II and IV contain human noroviruses,
genogroup III contains bovine noroviruses and genogroup V contains MNV.
Genogroup II also contains porcine noroviruses (Figure 1.1). The genogroups
are also divided into genotypes, also known as phylogenetic clusters (Green et
al., 1999; Ando et al., 2000; Vinje et al., 2000; Zheng et al., 2006). Human
noroviruses diverge by up to 45 % at the nucleotide level (Zheng et al., 2006)
6
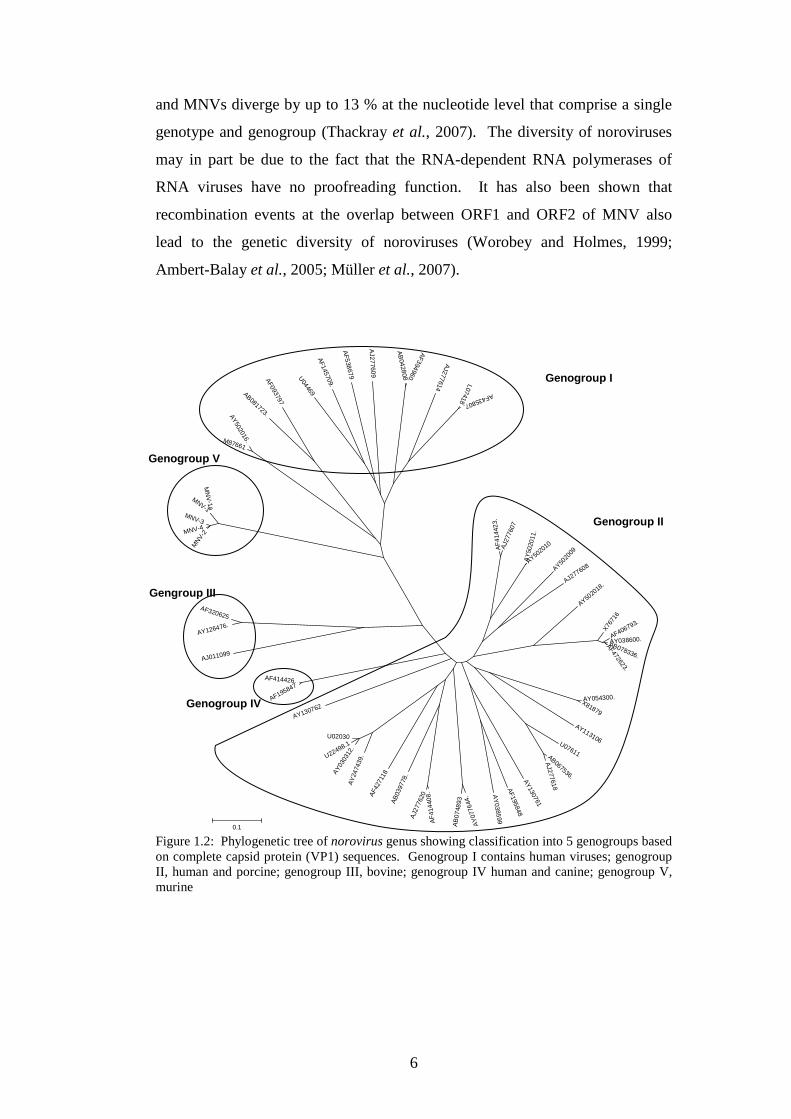
and MNVs diverge by up to 13 % at the nucleotide level that comprise a single
genotype and genogroup (Thackray et al., 2007). The diversity of noroviruses
may in part be due to the fact that the RNA-dependent RNA polymerases of
RNA viruses have no proofreading function. It has also been shown that
recombination events at the overlap between ORF1 and ORF2 of MNV also
lead to the genetic diversity of noroviruses (Worobey and Holmes, 1999;
Ambert-Balay et al., 2005; Müller et al., 2007).
AF
4144
23.
AJ2
7760
7
AY
5020
11.
AY502010AY50
2009
AJ277608
AY5020
18.
X767
16
AF406793.
AY038600.AB078336.
AF472623.
AY054300.X81879
AY113106U07611AB067536.
AJ277618
AY130761
AF195848
AY
038599
AY
0776
44.
AB
0748
93
AF
4144
08.
AJ2
7762
0
AB
0397
78.
AF42
7118
AY
2474
39.
AY03
0312
.
U22498.1U02030
AY130762AF195847
AF414426.
AJ011099
AY126476.
AF320625
MNV-
2MNV-4
MNV-3
MNV-1
MN
V-1a
M87661
AY502016.
AB081723.
AF093797
U04469
AF145709.
AF
538679
AJ277609
AB
042808
AF394960.
AJ277614 L07418
AF435807.
0.1 Figure 1.2: Phylogenetic tree of norovirus genus showing classification into 5 genogroups based on complete capsid protein (VP1) sequences. Genogroup I contains human viruses; genogroup II, human and porcine; genogroup III, bovine; genogroup IV human and canine; genogroup V, murine
Genogroup I
Genogroup II
Genogroup V
Gengroup III
Genogroup IV
7
1.2.3 Norovirus virion structure
The norovirus virion has a diameter of ~38 nm, and exhibits T=3 icosahedral
symmetry made up of 90 dimers of the capsid protein. The capsid structure
contains arch-like capsomeres, creating large hollows at the icosahedral 5- and
3-fold axes (Prasad et al., 1994; Prasad et al., 1999). The capsid protein (VP1)
self-assembles into virus-like particles which resemble native capsids in both
appearance and size (Jiang et al., 1992). The structure of this protein is
modular, consisting of the lower shell domain (S) and protruding domain (P)
connected by a flexible hinge. The protruding domain is then split further into
the central stem domain (P1) and distal globular domain (P2). It is the
protruding domains that make up the arch-like structures, with the S domain
acting as an icosahedral scaffold (Chen et al., 2006). Katpally et al showed that
the protruding domain is lifted off the shell by ~16Ǻ and rotated in a clockwise
direction by 40°, forming new interactions at the base of P1, creating a cage-like
structure that engulf the shell domains (Katpally et al., 2008). The amino acid
sequence of the S domain is relatively conserved throughout the noroviruses,
whereas the P2 domain is the most variable, indicating its role in receptor
binding and antigenicity (Prasad et al., 1999; Nilsson et al., 2003; Tan et al.,
2003).
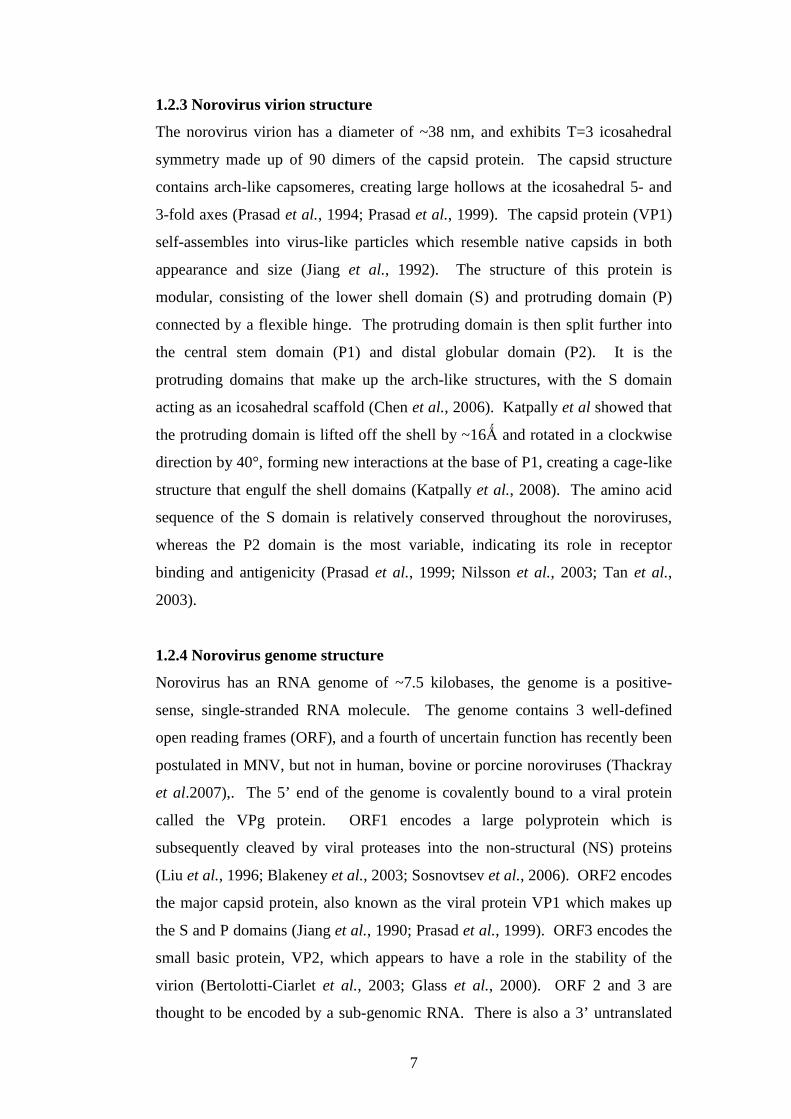
1.2.4 Norovirus genome structure
Norovirus has an RNA genome of ~7.5 kilobases, the genome is a positive-
sense, single-stranded RNA molecule. The genome contains 3 well-defined
open reading frames (ORF), and a fourth of uncertain function has recently been
postulated in MNV, but not in human, bovine or porcine noroviruses (Thackray
et al.2007),. The 5’ end of the genome is covalently bound to a viral protein
called the VPg protein. ORF1 encodes a large polyprotein which is
subsequently cleaved by viral proteases into the non-structural (NS) proteins
(Liu et al., 1996; Blakeney et al., 2003; Sosnovtsev et al., 2006). ORF2 encodes
the major capsid protein, also known as the viral protein VP1 which makes up
the S and P domains (Jiang et al., 1990; Prasad et al., 1999). ORF3 encodes the
small basic protein, VP2, which appears to have a role in the stability of the
virion (Bertolotti-Ciarlet et al., 2003; Glass et al., 2000). ORF 2 and 3 are
thought to be encoded by a sub-genomic RNA. There is also a 3’ untranslated
8
region in noroviruses, consisting of a stem loop of 47 nucleotides and a poly(A)
tail of 24 nucleotides (Gutierrez-Escolano et al., 2003).
Figure 1.3: Genome of MNV showing ORF1, the sub-genomic ORF2 and ORF3 with putative ORF4 and proteins encoded. Taken from Thackray et al., 2007.
1.2.5 Norovirus attachment and cell entry
Noroviruses are usually transmitted orally, and the virions are acid-stable which
enables them to pass through the stomach and cause enteritis in humans.
Human noroviruses have been shown to bind histo-blood group antigens and to
carbohydrate antigens in the gut, specifically Lewis type antigens (Hutson et al.,
2003). The part of the capsid that interacts with the cellular receptor has also
been shown to be the hyper variable P2 domain (Lochridge et al., 2005).
Recently it has been reported that the receptor for MNV has been identified as
ganglioside-linked terminal sialic acid moieties on murine macrophages (Taube
et al., 2009). After attachment of the virus and entry into cells the genome must
be uncoated. Bhella et al showed that the capsid of feline calicivirus (FCV) (a
member of the genus Vesivirus of the family Caliciviridae) underwent a
conformational change induced by binding to its cellular receptor (Bhella et al.,
2008). FCV, however, has also been shown to enter cells by clathrin-mediated
mechanism in acidified endosomes (Stuart and Brown, 2006), whereas MNV
entry into permissive macrophages and dendritic cells is pH independent (Perry
et al., 2009).
9
1.2.6 Calicivirus / Norovirus replication
As noroviruses have proven difficult to grow in cell culture until the recent
success in growing MNV in RAW264.7 cells, much of what is known about
calicivirus replication has come from work on FCV. This section will discuss
calicivirus replication based on work on FCV and MNV. As single-stranded,
positive-sense RNA viruses, calicivirus RNA acts as a messenger RNA when
released into cells. The RNA is translated by using the cellular machinery for
the creation of progeny virus particles which are then released from the cell.
Unlike other families of RNA viruses, viruses of the family Caliciviridae have
neither a long 5’ UTR, with highly structured regions such as internal ribosome
entry sites (IRES), nor a 5’ 7-methylguanosine cap with which to interact with
host ribosomes. The VPg protein at the 5’ end of the genome has been shown to
bind to translation initiation factors in infection by Norwalk virus
(Daughenbaugh et al., 2003) FCV (Goodfellow et al., 2005; Chaudhry et al.,
2006) and MNV (Daughenbaugh et al., 2006). MNV1 VPg, for example, was
co-precipitated with eIF4GI and eIF4E from infected murine macrophages
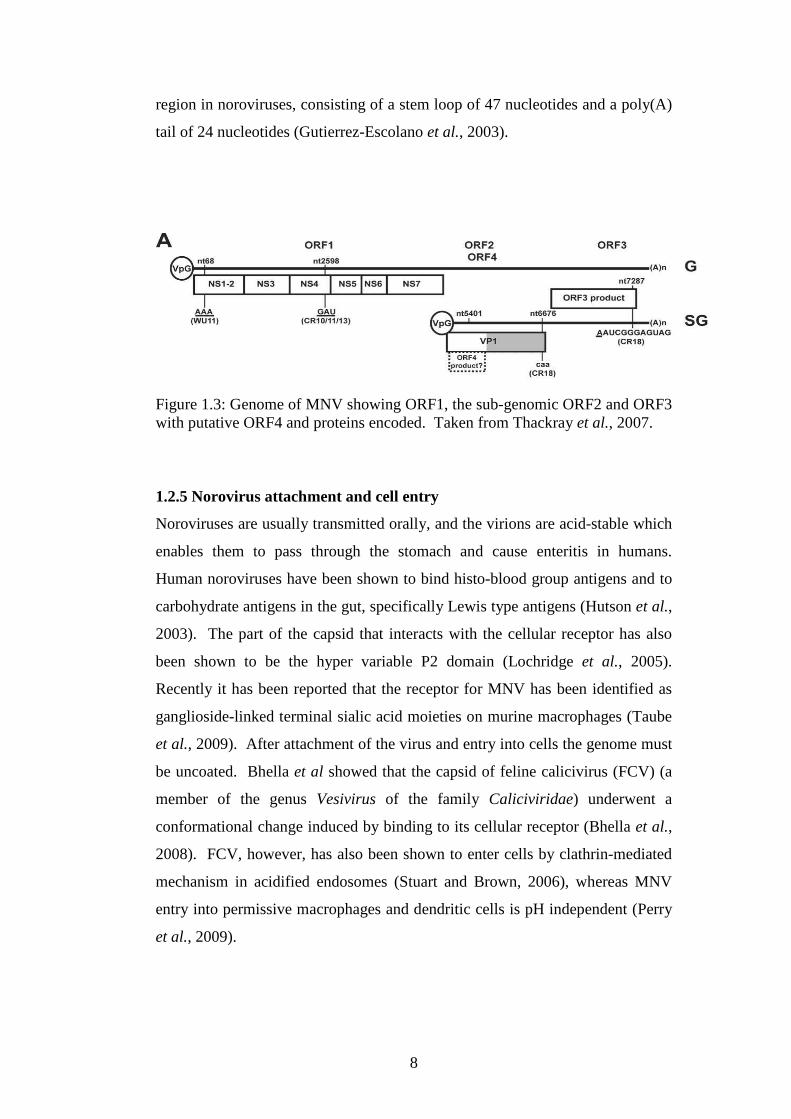
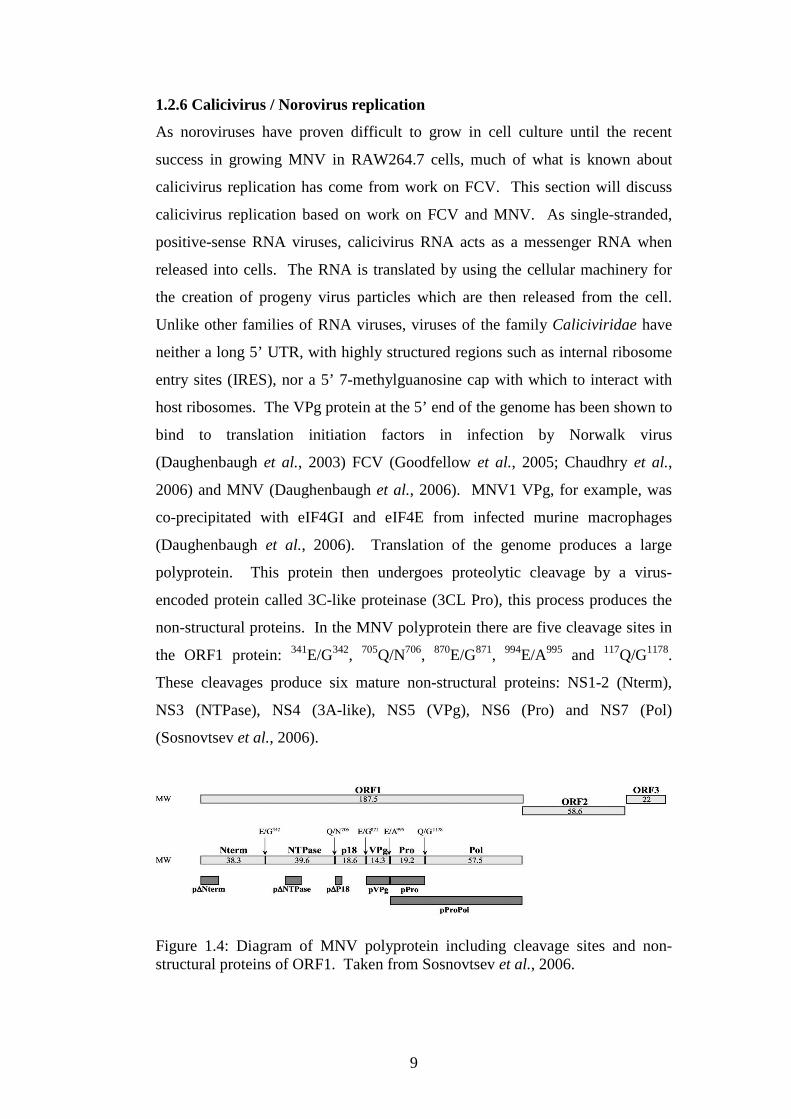
(Daughenbaugh et al., 2006). Translation of the genome produces a large
polyprotein. This protein then undergoes proteolytic cleavage by a virus-
encoded protein called 3C-like proteinase (3CL Pro), this process produces the
non-structural proteins. In the MNV polyprotein there are five cleavage sites in
the ORF1 protein: 341E/G342, 705Q/N706, 870E/G871, 994E/A995 and 117Q/G1178.
These cleavages produce six mature non-structural proteins: NS1-2 (Nterm),
NS3 (NTPase), NS4 (3A-like), NS5 (VPg), NS6 (Pro) and NS7 (Pol)
(Sosnovtsev et al., 2006).
Figure 1.4: Diagram of MNV polyprotein including cleavage sites and non-structural proteins of ORF1. Taken from Sosnovtsev et al., 2006.
10
RNA replication then occurs by the action of the RNA-dependent RNA
polymerase. This takes place from the polyadenylated tail of the 3’ end of the
genome which creates a negative-sense strand of RNA, the reverse complement
of the genomic RNA. In cells infected with FCV it has been shown that there
are two double-stranded RNA molecules corresponding to the genomic (8.2 kb)
and sub-genomic (2.4 kb) RNAs. The negative strands then act as a template for
the production of progeny genomic RNAs (Neill and Mengeling, 1988). FCV
viral RNA replication is associated with host cell membranes (Green et al.,
2002). The positive-strand subgenomic RNA then acts as a template for the
translation of ORF2 and ORF3, producing the major capsid protein VP1, and the
small basic protein VP2. As noted above, the capsid proteins undergo self-
assembly very readily to produce virus-like particles, giving an indication to
how the virus particles assemble. The packaging signal for norovirus RNA may
be found in the non-structural region of the genome, or that the non-structural
proteins, or even VPg, may be necessary for packaging of RNA (Asanka et al.,
2005). Recent work has revealed that MNV-1 replication is associated with
cellular membranes similar to many other RNA viruses; MNV-1 replication
complexes have been identified in a perinuclear location involving membranes
derived from the endoplasmic reticulum, Golgi and endosome (Hyde et al.,
2009). It has been suggested that caliciviruses induce cells to undergo apoptosis
as a means of releasing progeny virus. Another feature of MNV-1 infection of
RAW264.7 cells, is that it is able to inhibit the expression of the antiapoptotic
protein survivin, and that there was an increase in levels of caspase-3, a factor
involved in the execution of cellular disassembly. Changes were also noted in
the nuclear chromatin and DNA fragmentation, other markers of apoptosis (Bok
et al., 2009). These observations support the theory that noroviruses are able to
use apoptosis as a mechanism for virus release.
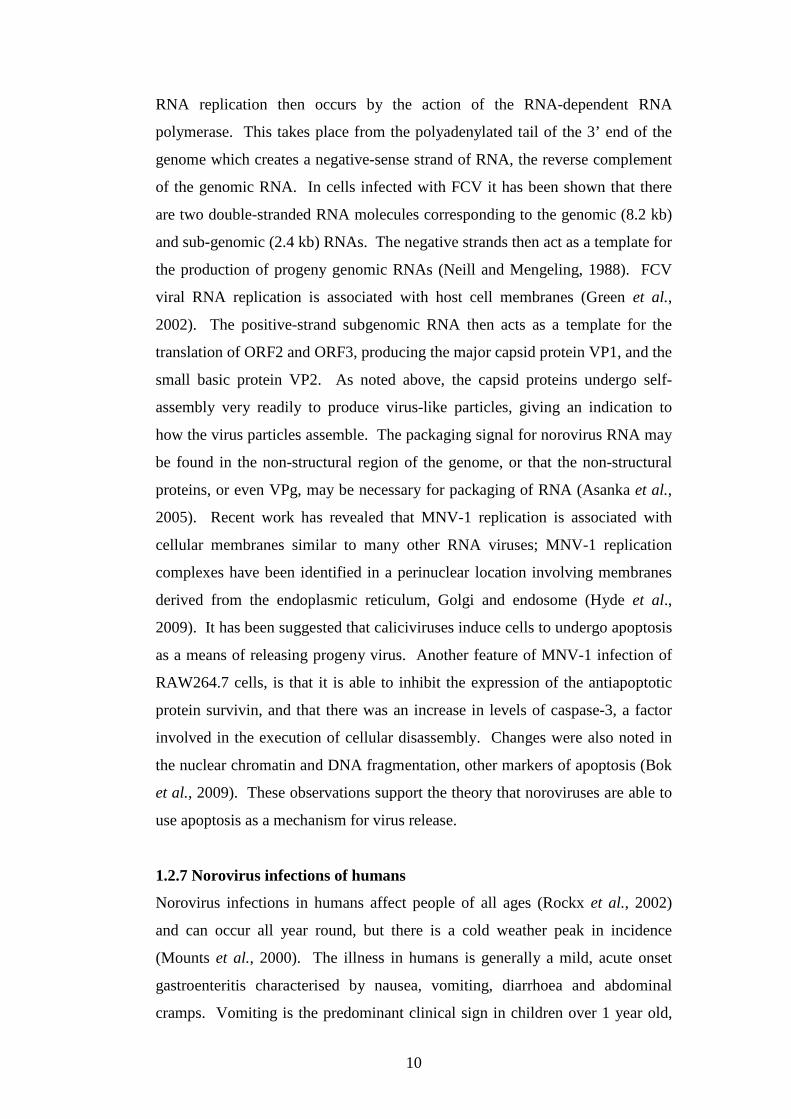
1.2.7 Norovirus infections of humans
Norovirus infections in humans affect people of all ages (Rockx et al., 2002)
and can occur all year round, but there is a cold weather peak in incidence
(Mounts et al., 2000). The illness in humans is generally a mild, acute onset
gastroenteritis characterised by nausea, vomiting, diarrhoea and abdominal
cramps. Vomiting is the predominant clinical sign in children over 1 year old,
11
and diarrhoea is the main feature in children under 1 year and adults (Kaplan et
al., 1982). The cause of the clinical disease typically lasts 2-3 days, although
this may be longer during hospital outbreaks (Lopman et al., 2004).
Transmission is by the faecal-oral route, by aerosolisation of viral particles from
infectious vomit or person-to-person contact. These routes of transmission
enable the rapid spread of norovirus during outbreaks in enclosed environments
such as hospitals, schools and cruise ships (Widdowson et al., 2005; Becker et
al., 2000; Gunn et al., 1980). Outbreaks usually begin after exposure to
contaminated food or water (Kaplan et al., 1982b). Spread of the virus is made
easier by the fact that it has a very low infectious dose, and the probability of
infection of a single Norwalk virus particle estimated to be close to 0.5 (Teunis
et al., 2008), the prolonged viral shedding after resolution of clinical signs and
the stability of the viral particle in high concentrations of chlorine (Duizer et al.,
2004). Immunity to norovirus has been demonstrated in volunteer studies, but it
is short-lived (6-12 weeks), and subjects were susceptible to infections when
challenged 2-3 years later (Parrino, et al., 1977). Susceptibility to norovirus
infection is determined by the presence of specific human histo-blood group
antigen (HBGA) receptors. These are present in the gut which is the presumed
site of virus replication (Lindesmith et al., 2003; Hutson et al., 2004).
1.2.8 Noroviruses in animals
Since their recognition as significant human pathogens, noroviruses have also
been detected in other species, such as cattle, pigs and mice. Norwalk-like virus
genes were discovered in the caecal contents of healthy pigs in Japan in 1998.
There was 58.2 % to 59.9 % similarity between Norwalk virus and those
detected in the pigs, and the new viruses were placed in the norovirus genogroup
II (Sugieda et al., 1998). Small, round viruses were first identified in the UK by
electron microscopy in calf diarrhoea in 1978 (Woode and Bridger, 1978) and in
Germany in 1980 (Gunther and Otto, 1987). The German virus, known as Jena
virus, was sequenced in 1999 and was shown to have a markedly similar
genome organisation to Norwalk virus, and phylogenetic studies of the RNA
polymerase sequence placed it with other noroviruses (Liu et al., 1999; van Der
Poel et al., 2000). Bovine noroviruses were later classified as genogroup III
(Liu et al., 1999; Oliver et al., 2003). Porcine noroviruses appear to cause only
12
sub-clinical infections (Wang et al., 2007) but are relatively prevalent, 17 % - 20
% (Reuter et al., 2007; Wang et al., 2006). Porcine noroviruses are often
monitored due to their genetic relatedness to human noroviruses and potential
for zoonotic spread (L’Homme et al., 2009). Bovine noroviruses are associated
with diarrhoea in gnotobiotic calves (Woode and Bridger, 1978) although their
impact in the wider cattle population is not clear. A recent study has shown the
prevalence in Belgium to be 7.5 % by faecal RT-PCR (Mauroy et al., 2009).
1.2.9 Murine norovirus
Murine norovirus was first described by Karst et al. in 2003. It was observed
that laboratory mice deficient in the recombination-activating gene 2 (RAG2)
and signal transducer and activator of transcription 1 (STAT1) (RAG/STAT-/-
mice) would sporadically succumb to an unknown pathogen. RAG2 plays an
essential role in the development of T and B lymphoid cells and their diversity
of cell surface receptors, enabling them to recognise numerous pathogens; thus
it plays a crucial role in the development of adaptive immunity (reviewed by
Sobacchi et al., 2006). These mice were severely immunocompromised and the
infection would produce meningoencephalitis, cerebral vasculitis and
pneumonia. The pathogen was more virulent in mice which were deficient in
the interferon (IFN) αβ and interferon γ receptors. The aetiological agent was
suspected to be viral as it could be passed through a 0.2 µm filter. Rational
difference analysis was carried out and the sequences obtained were similar to
calicivirus genomes (Karst et al., 2003). The ability of this virus to cause
disease was then tested in mice which had normal expression of STAT1 but
were deficient in RAG1 or RAG2. The mice were inoculated by intracranial,
intranasal and peroral routes, but 90 days later a significant number of mice had
not succumbed to the infection. The RAG-/- mice in fact became persistently
infected, indicating that T and B cell adaptive immunity was not necessary for
protection against the lethal disease. It was hypothesised that the innate immune
system was primarily responsible for protection against the virus. Mice with
various parts of the innate immune system, IFNαβ and IFNγ receptors, protein
kinase RNA-activated (PKR) or inducible nitric oxide synthetase (iNOS),
knocked out were challenged again with the virus. Mice with IFNαβ and IFNγ
receptors knocked out were 10,000 fold more susceptible, showing that
13
interferons were essential for resistance (Karst et al., 2003). Macroscopic
pathological changes present in the affected RAG/STAT-/- mice included
splenomegaly and multifocal pale foci on the liver. Hepatitis ranging in severity
from mild to severe has been described consisting of focal to diffuse
inflammatory infiltrates of mononuclear cells and neutrophils. Focal interstitial
pneumonia, consisting of macrophages within the alveolar air-spaces and walls,
was seen in some mice but was usually mild. Immunohistochemistry against an
MNV antigen identified infected cells to be those of macrophage or dendritic
cell type in the liver (Kupffer cells), red pulp of spleen, intestinal lamina propria
and mesenteric lymph nodes (Ward et al., 2006). Infection in
immunocompetent mice occurs, with MNV-1, which has been shown to
replicate and disseminate to various parts of the body. Histological examination
of normal mice infected with MNV1 has revealed: mild enteritis consisting of
increased numbers of granulocytes; the spleens showed red pulp hypertrophy
and white pulp activation at 72 hours post infection. MNV-1 was shown to be
present in the spleen, lung, liver and lymph nodes. The function of STAT1 is to
inhibit viral replication and thus the prevention of virus-induced apoptosis
resulting in little spread of the virus, resulting in the absence of clinical disease
in immunocompetent mice (Mumphrey et al., 2007; Perdue et al., 2007).
After the discovery of MNV-1, further MNVs were discovered and described.
In 2006, Hsu et al. described the identification of MNV-2, MNV-3 and MNV-4.
Immunocompetent mice from geographically separate laboratories in the United
States were euthanased and their mesenteric lymph nodes (MLN) screened for
MNV by a multiplex fluorescent assay. MLN material was inoculated onto
permissive cells and 3 novel strains of MNV were isolated. It was also shown
that these novel strains persisted in mice as MNV was detected in faeces by RT-
PCR for up to 8 weeks post-infection, whereas MNV-1 only produced a
transient infection which was quickly cleared (Hsu et al., 2006). Further
characterisation of the novel MNVs, from comparison of full length nucleotide
sequences, showed that despite their different biological behaviours they had a
high degree of sequence homology with MNV-1, but not with human or bovine
noroviruses (Hsu et al., 2007). Thackray et al. in 2007 conducted a study into
MNV diversity by sequencing the complete genome of 21 novel MNVs and
14
compared them to the 5 sequences published at that time. They discovered 15
distinct strains of MNV, with up to 13 % divergence at the nucleotide level.
These 15 strains, however, made up a single genogroup, genotype and serotype;
there was also evidence of recombination within ORF2 in several of the MNV
genomes (Thackray et al., 2007). The study of MNV, and of noroviruses in
general, was made easier with the development of a cell culture system which
could support the growth of MNV. Efforts had been made to cultivate human
noroviruses in the laboratory but were unsuccessful (Duizer et al., 2004). The
observation that MNV had been identified in the macrophage/dendritic cells in
the liver, spleen and small intestine lead to the attempt to grow MNV in this cell
type. Bone marrow derived macrophages and bone marrow derived dendritic
cells were inoculated with MNV-1 stock, derived from the brains of the mice
that had originally lead to the discovery of MNV (Karst et al., 2003). MNV-1
had a marked tropism for both cell types as infection produced cytopathic effect
in both. The cell line RAW 264.7, a macrophage cell line transformed by
Abelson leukaemia virus (Raschke et al., 1978), was found to support MNV
replication with visible CPE and plaque formation (Wobus et al., 2004). This
cell line has since become the standard means of growing MNV in laboratories.
A further advance in the study of noroviruses has been the development of
reverse genetics system for MNV. In 2007, Ward et al described the recovery
of infectious MNV after the baculovirus delivery of MNV cDNA into human
hepatoma cells using an inducible DNA polymerase promoter (Ward et al.,
2007). Chaudhry et al. also demonstrated the recovery of genetically defined
MNV using the fowlpox virus T7 RNA polymerase system (Chaudhry et al.,
2007). The ability to manipulate the MNV genome in future will surely reveal a
great deal about norovirus replication and pathogenesis.
1.2.10 Immunity to noroviruses
The identification of MNV in RAG/STAT-/- mice and subsequent studies lead to
the conclusion that the innate immune system was primarily responsible for
protection against fulminate clinical disease associated with MNV infection
(Karst et al., 2003; Mumphrey et al., 2007). A functional innate immune system
does not protect the mice from infection though, as several strains of MNV have
been shown to infect mice sub-clinically and to persist in immunocompetent
15
hosts (Hsu et al., 2006). These observations are consistent with the clinical
course of human norovirus infections i.e. acute onset and short duration. The
rapid resolution of the disease suggests that an adaptive immune response would
not have time to have been invoked to play a role in the course of the disease;
however, adaptive immunity does have a role to play in clearing the norovirus
infection. Since MNV-1 infections of RAG-/- mice, which have impaired
adaptive immunity but unaffected innate immunity, did not succumb to clinical
disease, but had higher levels of viral RNA in lung, liver, spleen, proximal
intestine, brain, blood and faeces 90 days after peroral inoculation (Karst et al.,
2003). The conclusion was that the adaptive immune system is necessary for
the clearance of MNV.
The innate immune system will be discussed in more detail later in this
introduction. Briefly, it consists of the detection of pathogen-associated
molecular patterns by cellular receptors which lead to the production of type I
interferons (IFN-αβ). The pattern recognition receptors (PRR) that initiate the
response to viruses include: toll-like receptor 3 (TLR3) and the Rig-I-like
helicases, RIG-I and MDA-5 (Takeuchi and Akira, 2007). IFN-αβ then acts in a
paracrine fashion, binding to its cellular receptors and act via the JAK-STAT
pathway to upregulate the expression of numerous genes which collectively
produce the antiviral state. The antiviral molecules include: protein kinase R
(PKR), 2’ 5’oligoadenylate synthetase (OAS) and ISG15 (reviewed by Randall
and Goodbourn, 2008). The pathogenicity of MNV-1 in STAT-/- mice
demonstrates how significant this system is in protecting mice from disease. As
MNV has a tropism for cells of the macrophage/dendritic cell lineage, a study
was conducted by McCartney et al. in 2008 in which bone marrow derived
dendritic cells (BMDC) from wild-type, TLR3-/- and MDA5-/- mice were
infected with MNV-1. They showed that MDA-5 recognises MNV-1 which
stimulates the production of type I IFN, along with IL-6, MCP-1 and TNFα.
The MDA-5-/- cells had a severe deficit in IFN production, although MDA-5-/-
mice were still able to clear MNV-1 infection. It was concluded that MDA-5 is
the predominant sensor in BMDCs, but that other sensors may play a role in
other cell types which are important during infection of an animal. It was also
suggested that the 5’ VPg is essential for MDA-5 recognition of MNV-1
16
(McCartney et al., 2008). Changotra et al have recently elucidated part of the
mechanism by which the IFN response is able to abrogate MNV infection. They
have shown that there is an IFN-mediated blockage to MNV-1 replication after
virus entry and genome uncoating, but before the translation of the non-
structural polyprotein. The most likely explanation was considered to be that
the production or accumulation of the non-structural polyprotein is being
prevented by an IFN-induced product. They have also shown that PKR is not a
requirement for type I IFN-induced block to virion production. A possible
mechanism for the IFN antiviral effect is that it affects the association of the
VPg with the cellular translation machinery, leading to a failure to translate viral
genomes (Changotra et al., 2009).
Antibodies generated against noroviruses have been shown to recognise epitopes
on the protruding domain (P2) of the VP1 protein which contain conserved
amino acids sequences across human, murine, bovine and porcine noroviruses
(Lochridge et al., 2005). A single amino acid substitution in the P2 domain of
MNV was actually sufficient for escape from antibody neutralisation (Lochridge
et al., 2007). A recent study in which mice were infected with a high dose of
MNV-1, followed by a secondary challenge 6 weeks later, revealed that there
was no protection from a homologous virus (Liu et al., 2009). Although the
antibody response did not prevent disease in the rechallenged mice, a memory
immune response was elicited as the virus was cleared more quickly on the
second infection. The reasons for the lack of protection are not clear, although it
could be due to inappropriate tolerance of the virus or a direct result of the
infection of antigen presenting cells inhibiting their function (Liu et al., 2009).
Recent studies into the effectiveness of vaccines against MNV have revealed
more information about the nature of the adaptive immune response. Chachu et
al. have recently demonstrated that vaccination by oral administration of live
MNV-1 virus produced a long lasting immunity, up to 24 weeks post treatment.
It was demonstrated that for that for vaccination to be effective the presence of
CD4 T cells, CD8 T cells and B cells were necessary, and that the MNV VP1
protein contains epitopes for each cell type. The molecule perforin, a product of
CD8 cytotoxic T cells was found to be important in the clearance of the virus
17
(Chachu et al., 2008). This study was conducted in MNV-1, which is not a
persistent strain; it is unclear whether this vaccine is effective in persistent
strains of MNV. Another recent study by LoBue et al., has shown that
norovirus-like particles with alphavirus adjuvant particles, when administered to
mice, produced cross-reactive and receptor-blocking antibodies, and protection
against infection with heterologous MNVs (LoBue et al., 2009).
The study of the role of the adaptive immune system in human norovirus
infections has provided a picture of the nature of the response. Due to the
historical difficulty in growing noroviruses in cell culture, human norovirus
studies have often relied on clinical material from outbreaks or volunteer
studies. Acute norovirus gastroenteritis in humans is characterised by an
infiltration of mononuclear cells into the jejunum, a transient circulating
lymphopaenia and the presence of serum antibody (Dolin et al., 1975; Dolin et
al., 1976). Prevalence of norovirus antibodies in humans has been shown to be
high in many countries (reviewed by Lopman et al., 2002), e.g. 2,382 of 3,250
English serum samples (72.3 %) were seropositive (Gray et al., 1993).
Rechallenge studies to determine if the antibody response was protective against
future infection produced a picture whereby some people develop a short-term
immunity to rechallenge with the same agent, whereas others are protected for
up to 42 months later (Parrino et al., 1977; Blacklow et al., 1979).
The cytokine responses to norovirus infections have been described in human
norovirus infections. A study of a natural outbreak of human norovirus
demonstrated increased levels of IL-2 and IFN-γ in faecal samples, suggesting a
Th1 immune response (Ko et al., 2006). Similarly, a volunteer study with Snow
Mountain virus, a human norovirus, also stimulated the production IL-2 and
IFN-γ (Lindesmith et al., 2005). These cytokine profiles are consistent with the
observation that the cytotoxic T cell system is important in the clearance of
MNV-1 (Chachu et al., 2008). There is still much to learn about the exact
nature of the adaptive immune response to noroviruses in the way in which
humoral and cell mediated immunity interact, and how some strains of MNV are
able to persist whereas MNV-1 and human noroviruses are not.
18
1.2.11 Diagnosis of noroviruses
Early in the history of norovirus diagnosis the most reliable method was to
administer faecal filtrates to volunteers. Noroviruses were first identified by the
use of electron microscopy and immune electron microscopy (Kapikian et al.,
1972). Other diagnostics test followed in the following years:
radioimmunoassay (Greenberg and Kapikian, 1978), enzyme immunoassay
(Herrmann et al., 1985) and Western blot (Hayashie et al., 1989), which
detected either norovirus antigen or antibody. With the cloning and sequencing
of the Norwalk virus genome (Xi et al., 1990; Matsui et al., 1991) molecular
diagnostic techniques were described. Noroviruses were detected in human
stool samples by PCR (Jian et al., 1992; Moe et al., 1994; Le Guyader et al.,
1996; Atmar et al., 2001; Vinje et al., 2003). Real-time PCR was developed to
detect and quantitate Norwalk virus in stools (Richards et al., 2004; Kageyama
et al., 2003; Pang et al., 2004). The same diagnostic methods have been
extensively used to detect the noroviruses of other species
19
1.3 Viruses and innate immunity
The innate immune system of vertebrates consists of barriers protecting the body
from microbial attack. These barriers may be anatomical e.g. the epidermis of
the skin, or the cilia of the respiratory epithelium or based on secretions e.g.
mucosal immunity associated with various epithelial linings and gastric acid
secretions. The response of the innate immune system against invading
pathogens is on-specific and often leads to the activation of the complement
system and acute inflammation. Cells of the innate immune system include
dendritic cells and tissue macrophages; these cells produce many cytokines,
including interferons (IFN), are able to present antigens to lymphocytes and in
so doing link the innate immune system to the adaptive. In order to respond to
pathogens, the innate immune system is able to recognise pathogens that have
invaded the host. Pathogens are recognised by pathogen associated molecular
patterns (PAMPs) by cellular pattern recognition receptors (PRRs) (Kindt et al.,
2007). PAMPs are molecular patterns present in pathogens but are usually
absent from the host. It is the recognition of dsRNA, the most important PAMP
produced during replication of RNA viruses, which will be discussed in relation
to the relationship between the presence of GORS in viral genomes and the
ability of those viruses to persist. This discussion will focus on the IFN-β
system as the detection of dsRNA leads to the production of IFN-β via PRRs
such as toll-like receptor -3, RIG-I and MDA5 during viral replication, which
leads to the establishment of the anti-viral state. It has been hypothesised that
GORS leads to persistence by enabling the avoidance of recognition of viral
RNA by the PRRs.
1.3.1 Introduction to interferon system
Type I interferons (IFN), also known as IFN-αβ, were discovered by Isaacs and
Lindenmann in 1957. They are produced in response to viral infection. Type II
interferon, IFN-γ is secreted by T cells and natural killer cells (NK cells). Type
III IFNs have been recently described and consist of IFN-λ1, -λ2 and λ3 that are
inducible by viral infection and produce an antiviral state, similar to type I IFN
(Kotenko et al., 2001); they are also known as IL-29, IL-28A and IL-28B
(Sheppard et al., 2003). The production of IFN is stimulated by the recognition
of pathogen associated molecular patterns (PAMPs) by cellular pattern
20
recognition receptors (PRRs); these receptors activate signal transduction
pathways resulting in the production of IFNs. There are many molecules
displayed or produced by pathogenic organisms which are considered to be
PAMPs, and lead to the induction of IFN. The IFN then acts through cellular
receptors, via a signal transduction pathway to induce the transcription of
numerous IFN-stimulated genes (ISG)s which collectively produce the antiviral
state. The ISGs act in a variety of ways to inhibit viral replication and,
ultimately, prevent disease (Reviewed by Randall and Goodbourn, 2008). This
review of the interaction between viruses and IFN-α/β system will pay particular
attention to RNA viruses (although DNA virus examples of certain features will
be used where appropriate), describe the detection of viral PAMPs, in particular
double stranded RNA (dsRNA), the pathways involved in IFN induction and
transcription of the ISGs, the nature of the antiviral state and various strategies
employed by RNA viruses to avoid detection and inhibit those cellular
pathways.
1.3.2 Detection of viral PAMPs
RNA viruses induce an IFN response, largely by their production of dsRNA.
Studies on the induction of IFN by synthetic polynucleotide complexes revealed
polyinosinic polycytidylic acid (poly I:C), a dsRNA homologue, to be a potent
inducer of IFN (Field et al., 1967). It was later demonstrated by work on
defective interfering particles of vesicular stomatitis virus (VSV), in which a
single molecule of dsRNA was presumed to be formed, that the dsRNA induced
IFN, whereas conventional particles containing ssRNA did not (Marcus and
Sekellick, 1977). This work indicated that dsRNA, which is produced by
viruses during their replication, was the most important viral inducer of IFN
(Marcus, 1983).
Viral dsRNA may be detected via endosomal delivery or within the cell
cytoplasm. The toll-like receptors (TLRs) are a family PRRs; TLR3 has been
demonstrated to be a receptor for dsRNA, and that its activation results in the
induction of IFN (Alexopoulou et al., 2001). Before stimulation, TLR3 is
localised to the endoplasmic reticulum, but then moves to the endosome
containing dsRNA. The recognition of dsRNA requires an acidic pH within the
21
endosome (de Bouteiller et al., 2005). TLR3 has also been identified on the cell
surface of a human fibroblast cell line, enabling the extracellular detection of
dsRNA and IFN induction (Matsumoto et al., 2002). As well as IFN induction,
dendritic cells that have phagocytosed other virus infected cells contain TLR3
that is able to detect viral dsRNA; the cells are activated and induce a cytotoxic
T cell response (Schulz et al., 2005). Studies of TLR3 knockout mice have
revealed that it is an essential part of the mouse’s ability to resist infection with
some viruses e.g. murine cytomegalovirus (although a DNA virus, it is assumed
to produce dsRNA as a result of bidirectional transcription) (Tabeta et al., 2004)
whereas it appears not to have the same role in other viral infections e.g.
lymphocytic choriomeningitis (LCMV) virus, VSV and reovirus (Edelmann et
al., 2004). These studies showed that although TLR3 is an important receptor
for viral dsRNA in some viral infections, there must still be other systems
operating in the induction of IFN by other viruses, which will be described later.
TLR3 induces IFN via a signal transduction pathway. After detection of
dsRNA, TLR3 undergoes a tyrosine phosphorylation, accompanied by
dimerization (Sarkar et al., 2004). The phosphorylated TLR3 then recruits toll-
interleukin (IL)-1 domain adaptor inducing IFN-β (TRIF) which results in the
activation of two cascades that result in IFN induction (Hoebe et al., 2003; Jiang
et al., 2004).
The first cascade, the NF-κB branch, begins with the association of TRIF with
tumour necrosis factor receptor-associated factor 6 (TRAF6) the receptor-
interacting protein 1 (RIP1) (Sato et al., 2003; Meylan et al., 2004; Cusson-
Hermance et al., 2005). TRAF6 functions with the ubiquitin conjugating
enzyme Ubc13 to catalyze the synthesis of unique lysine-linked polyubiquitin
chains (Deng et al., 2000) which bind to TAK1-binding proteins 2 and 3 (TAB 2
and 3) and activate transforming growth factor β-activated kinase 1 (TAK1).
Polyubiquitinated RIP1 is able to recruit IKK through the binding between the
polyubiquitin chains and the NF-κB essential modifier (NEMO), which is a
regulatory subunit of the IKK complex (Ea et al., 2006). As a result of the
creation of a TRIF-RIP1-TRAF6-TAB-TAK1 complex, TAK1 phosphorylates
and activates IKK (Wang et al., 2001), leading to the phosphorylation of IκB, its
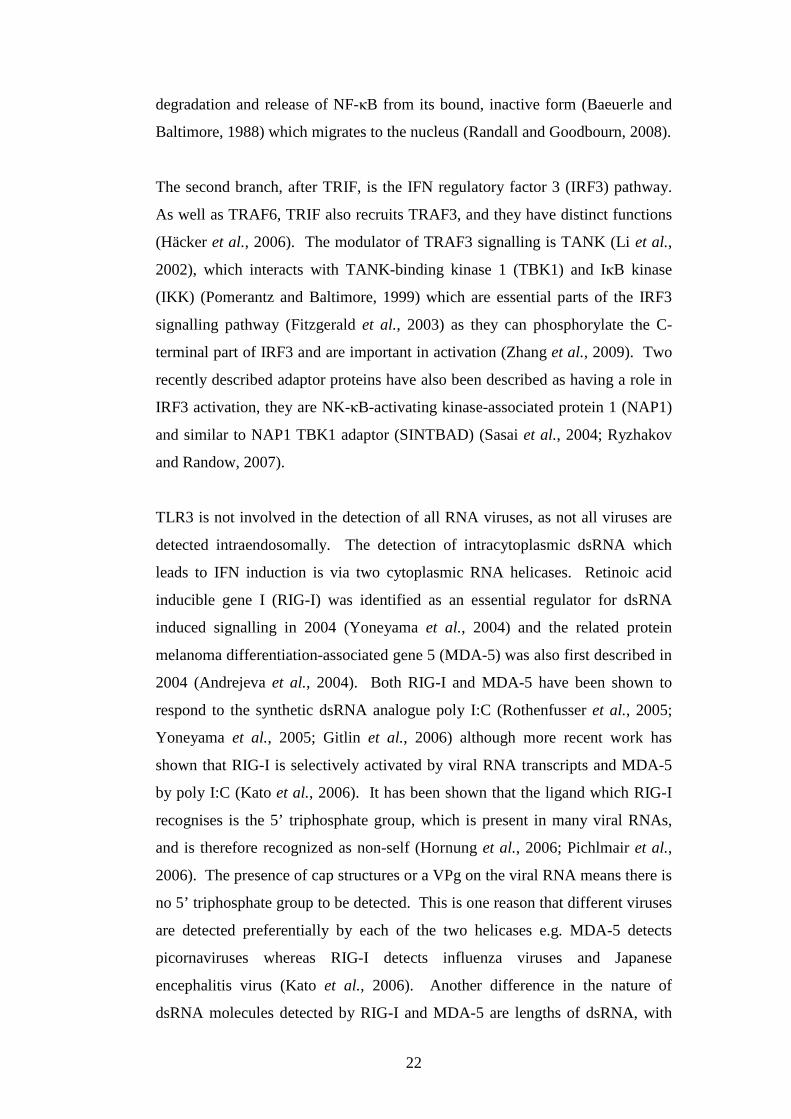
22
degradation and release of NF-κB from its bound, inactive form (Baeuerle and
Baltimore, 1988) which migrates to the nucleus (Randall and Goodbourn, 2008).
The second branch, after TRIF, is the IFN regulatory factor 3 (IRF3) pathway.
As well as TRAF6, TRIF also recruits TRAF3, and they have distinct functions
(Häcker et al., 2006). The modulator of TRAF3 signalling is TANK (Li et al.,
2002), which interacts with TANK-binding kinase 1 (TBK1) and IκB kinase
(IKK) (Pomerantz and Baltimore, 1999) which are essential parts of the IRF3
signalling pathway (Fitzgerald et al., 2003) as they can phosphorylate the C-
terminal part of IRF3 and are important in activation (Zhang et al., 2009). Two
recently described adaptor proteins have also been described as having a role in
IRF3 activation, they are NK-κB-activating kinase-associated protein 1 (NAP1)
and similar to NAP1 TBK1 adaptor (SINTBAD) (Sasai et al., 2004; Ryzhakov
and Randow, 2007).
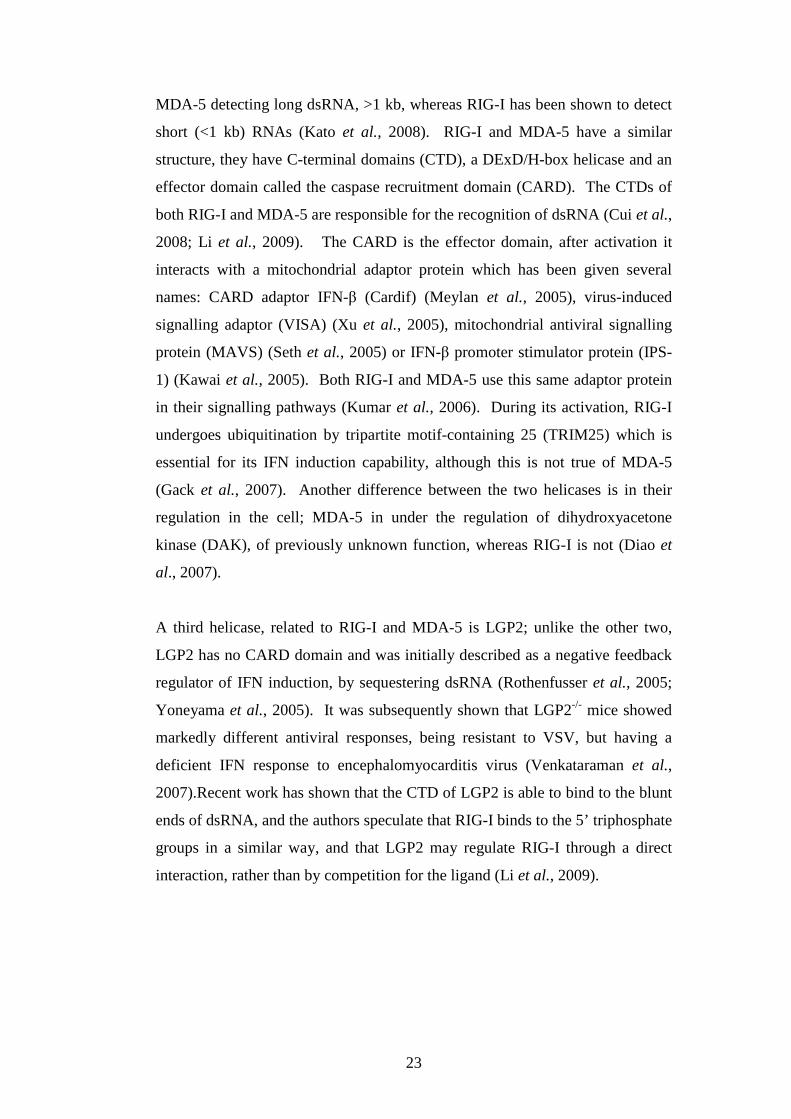
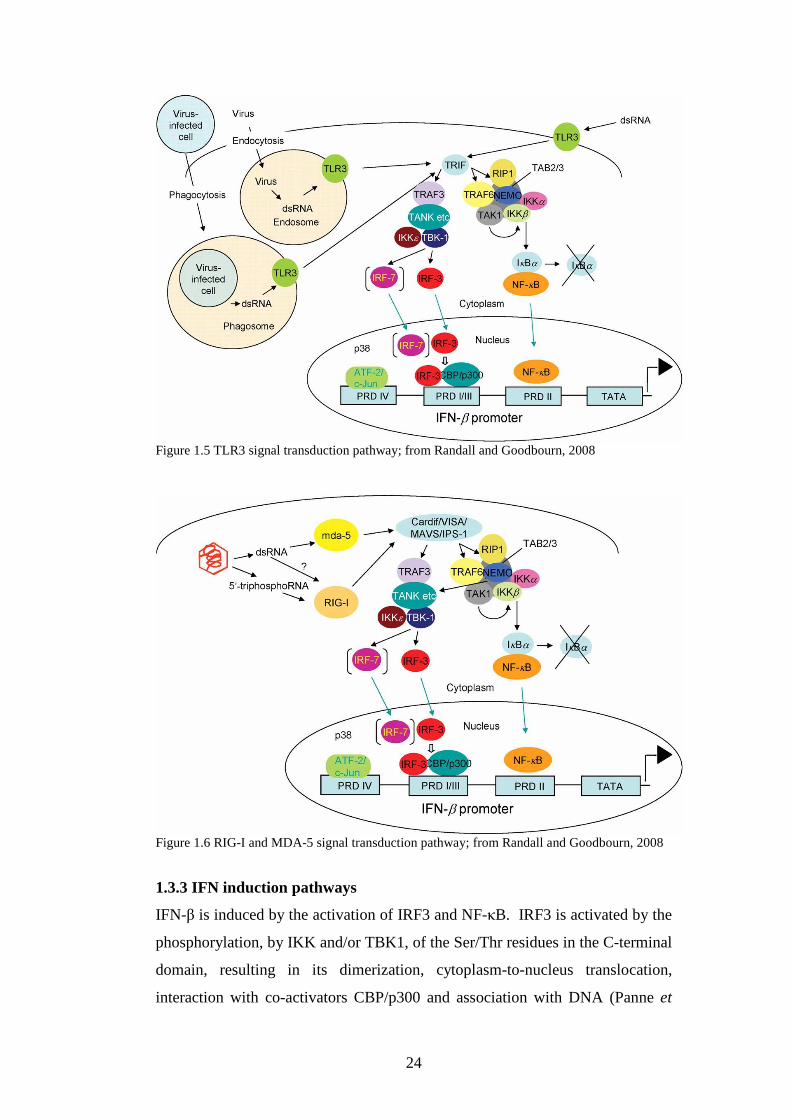
TLR3 is not involved in the detection of all RNA viruses, as not all viruses are
detected intraendosomally. The detection of intracytoplasmic dsRNA which
leads to IFN induction is via two cytoplasmic RNA helicases. Retinoic acid
inducible gene I (RIG-I) was identified as an essential regulator for dsRNA
induced signalling in 2004 (Yoneyama et al., 2004) and the related protein
melanoma differentiation-associated gene 5 (MDA-5) was also first described in
2004 (Andrejeva et al., 2004). Both RIG-I and MDA-5 have been shown to
respond to the synthetic dsRNA analogue poly I:C (Rothenfusser et al., 2005;
Yoneyama et al., 2005; Gitlin et al., 2006) although more recent work has
shown that RIG-I is selectively activated by viral RNA transcripts and MDA-5
by poly I:C (Kato et al., 2006). It has been shown that the ligand which RIG-I
recognises is the 5’ triphosphate group, which is present in many viral RNAs,
and is therefore recognized as non-self (Hornung et al., 2006; Pichlmair et al.,
2006). The presence of cap structures or a VPg on the viral RNA means there is
no 5’ triphosphate group to be detected. This is one reason that different viruses
are detected preferentially by each of the two helicases e.g. MDA-5 detects
picornaviruses whereas RIG-I detects influenza viruses and Japanese
encephalitis virus (Kato et al., 2006). Another difference in the nature of
dsRNA molecules detected by RIG-I and MDA-5 are lengths of dsRNA, with
23
MDA-5 detecting long dsRNA, >1 kb, whereas RIG-I has been shown to detect
short (<1 kb) RNAs (Kato et al., 2008). RIG-I and MDA-5 have a similar
structure, they have C-terminal domains (CTD), a DExD/H-box helicase and an
effector domain called the caspase recruitment domain (CARD). The CTDs of
both RIG-I and MDA-5 are responsible for the recognition of dsRNA (Cui et al.,
2008; Li et al., 2009). The CARD is the effector domain, after activation it
interacts with a mitochondrial adaptor protein which has been given several
names: CARD adaptor IFN-β (Cardif) (Meylan et al., 2005), virus-induced
signalling adaptor (VISA) (Xu et al., 2005), mitochondrial antiviral signalling
protein (MAVS) (Seth et al., 2005) or IFN-β promoter stimulator protein (IPS-
1) (Kawai et al., 2005). Both RIG-I and MDA-5 use this same adaptor protein
in their signalling pathways (Kumar et al., 2006). During its activation, RIG-I
undergoes ubiquitination by tripartite motif-containing 25 (TRIM25) which is
essential for its IFN induction capability, although this is not true of MDA-5
(Gack et al., 2007). Another difference between the two helicases is in their
regulation in the cell; MDA-5 in under the regulation of dihydroxyacetone
kinase (DAK), of previously unknown function, whereas RIG-I is not (Diao et
al., 2007).
A third helicase, related to RIG-I and MDA-5 is LGP2; unlike the other two,
LGP2 has no CARD domain and was initially described as a negative feedback
regulator of IFN induction, by sequestering dsRNA (Rothenfusser et al., 2005;
Yoneyama et al., 2005). It was subsequently shown that LGP2-/- mice showed
markedly different antiviral responses, being resistant to VSV, but having a
deficient IFN response to encephalomyocarditis virus (Venkataraman et al.,
2007).Recent work has shown that the CTD of LGP2 is able to bind to the blunt
ends of dsRNA, and the authors speculate that RIG-I binds to the 5’ triphosphate
groups in a similar way, and that LGP2 may regulate RIG-I through a direct
interaction, rather than by competition for the ligand (Li et al., 2009).
24
Figure 1.5 TLR3 signal transduction pathway; from Randall and Goodbourn, 2008
Figure 1.6 RIG-I and MDA-5 signal transduction pathway; from Randall and Goodbourn, 2008
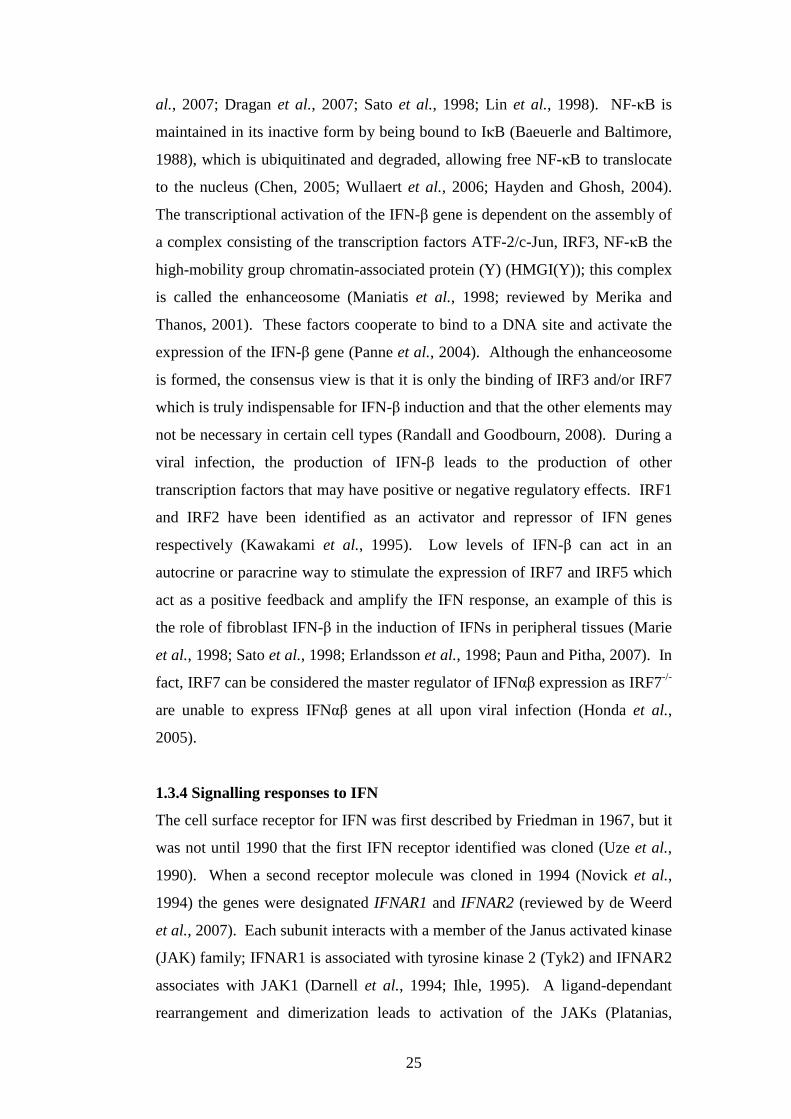
1.3.3 IFN induction pathways
IFN-β is induced by the activation of IRF3 and NF-κB. IRF3 is activated by the
phosphorylation, by IKK and/or TBK1, of the Ser/Thr residues in the C-terminal
domain, resulting in its dimerization, cytoplasm-to-nucleus translocation,
interaction with co-activators CBP/p300 and association with DNA (Panne et
25
al., 2007; Dragan et al., 2007; Sato et al., 1998; Lin et al., 1998). NF-κB is
maintained in its inactive form by being bound to IκB (Baeuerle and Baltimore,
1988), which is ubiquitinated and degraded, allowing free NF-κB to translocate
to the nucleus (Chen, 2005; Wullaert et al., 2006; Hayden and Ghosh, 2004).
The transcriptional activation of the IFN-β gene is dependent on the assembly of
a complex consisting of the transcription factors ATF-2/c-Jun, IRF3, NF-κB the
high-mobility group chromatin-associated protein (Y) (HMGI(Y)); this complex
is called the enhanceosome (Maniatis et al., 1998; reviewed by Merika and
Thanos, 2001). These factors cooperate to bind to a DNA site and activate the
expression of the IFN-β gene (Panne et al., 2004). Although the enhanceosome
is formed, the consensus view is that it is only the binding of IRF3 and/or IRF7
which is truly indispensable for IFN-β induction and that the other elements may
not be necessary in certain cell types (Randall and Goodbourn, 2008). During a
viral infection, the production of IFN-β leads to the production of other
transcription factors that may have positive or negative regulatory effects. IRF1
and IRF2 have been identified as an activator and repressor of IFN genes
respectively (Kawakami et al., 1995). Low levels of IFN-β can act in an
autocrine or paracrine way to stimulate the expression of IRF7 and IRF5 which
act as a positive feedback and amplify the IFN response, an example of this is
the role of fibroblast IFN-β in the induction of IFNs in peripheral tissues (Marie
et al., 1998; Sato et al., 1998; Erlandsson et al., 1998; Paun and Pitha, 2007). In
fact, IRF7 can be considered the master regulator of IFNαβ expression as IRF7-/-
are unable to express IFNαβ genes at all upon viral infection (Honda et al.,
2005).
1.3.4 Signalling responses to IFN
The cell surface receptor for IFN was first described by Friedman in 1967, but it
was not until 1990 that the first IFN receptor identified was cloned (Uze et al.,
1990). When a second receptor molecule was cloned in 1994 (Novick et al.,
1994) the genes were designated IFNAR1 and IFNAR2 (reviewed by de Weerd
et al., 2007). Each subunit interacts with a member of the Janus activated kinase
(JAK) family; IFNAR1 is associated with tyrosine kinase 2 (Tyk2) and IFNAR2
associates with JAK1 (Darnell et al., 1994; Ihle, 1995). A ligand-dependant
rearrangement and dimerization leads to activation of the JAKs (Platanias,
26
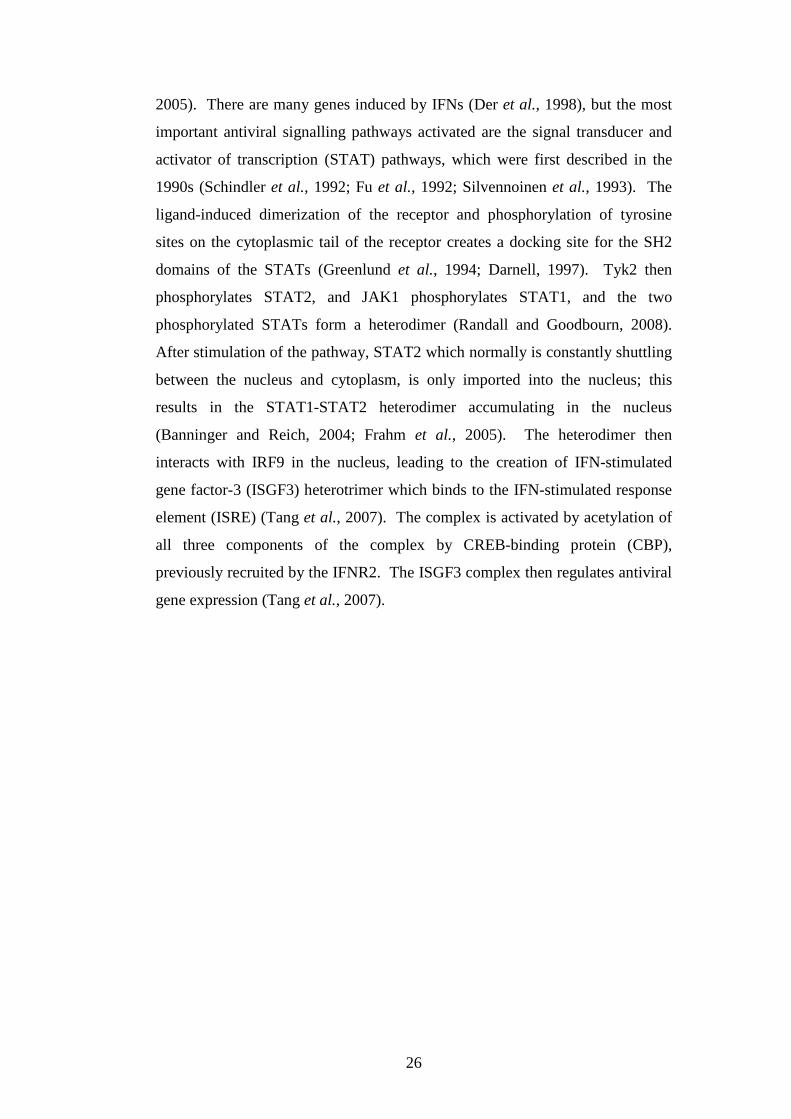
2005). There are many genes induced by IFNs (Der et al., 1998), but the most
important antiviral signalling pathways activated are the signal transducer and
activator of transcription (STAT) pathways, which were first described in the
1990s (Schindler et al., 1992; Fu et al., 1992; Silvennoinen et al., 1993). The
ligand-induced dimerization of the receptor and phosphorylation of tyrosine
sites on the cytoplasmic tail of the receptor creates a docking site for the SH2
domains of the STATs (Greenlund et al., 1994; Darnell, 1997). Tyk2 then
phosphorylates STAT2, and JAK1 phosphorylates STAT1, and the two
phosphorylated STATs form a heterodimer (Randall and Goodbourn, 2008).
After stimulation of the pathway, STAT2 which normally is constantly shuttling
between the nucleus and cytoplasm, is only imported into the nucleus; this
results in the STAT1-STAT2 heterodimer accumulating in the nucleus
(Banninger and Reich, 2004; Frahm et al., 2005). The heterodimer then
interacts with IRF9 in the nucleus, leading to the creation of IFN-stimulated
gene factor-3 (ISGF3) heterotrimer which binds to the IFN-stimulated response
element (ISRE) (Tang et al., 2007). The complex is activated by acetylation of
all three components of the complex by CREB-binding protein (CBP),
previously recruited by the IFNR2. The ISGF3 complex then regulates antiviral
gene expression (Tang et al., 2007).
27
Figure 1.7 IFN effector transduction pathway; from Randall and Goodbourn, 2008
28
1.3.5 IFN effector mechanisms
1.3.5.1 Antiviral state
As a result of the action of IFN the genes that are expressed result in the cell
going into what is known as the antiviral state. Several hundred genes have
been identified, but there are several important genes that have been studied in
depth and their actions elucidated.
1.3.5.2 PKR
dsRNA-dependant protein kinase (PKR) is an IFN induced molecule first
described by Metz and Esteban in 1972. PKR is a protein with dsRNA-
dependant kinase activity but exists in a latent state (Garcia et al., 2006). It is
activated after recognising and binding dsRNA (Clemens, 1997); due to
structural constraints, it is only able to detect dsRNA molecules of greater length
than 30 bp (Manche et al., 1992). After binding dsRNA, PKR undergoes
various conformational changes and homodimerises, becoming active in the
process. The homodimer is further stabilised by autophosphorylation (Dey et
al., 2005). PKR is activated in several other conditions: by TLRs, by growth
factors and cytokines and in response to cell stress (Garcia et al., 2006). PKR is
a member of a family of kinases called the eukaryotic initiation factor 2- (eIF-
2α) specific kinases (de Haro et al., 1996), which inhibit the function of eIF-2α
and therefore inhibit protein synthesis (Rhoads, 1993). The ability of PKR to
detect long viral dsRNAs and inhibit cellular protein synthesis means that it also
inhibits viral protein synthesis. PKR is also able to phosphorylate the NF-κB
inhibitor IκB-α, removing the inhibition and therefore promoting the further
induction of IFN-β. The actions of PKR on both eIF-2α and NF-κB have also
been shown to be mediators in apoptosis (Lee and Esteban, 1994; Gil et al.,
1999).
1.3.5.3 2’5’ OAS
The discovery of the 2’5’-oligoadenylate synthetase (2’5’OAS) system and its
association with the activation of the latent RNase (RNase L) took place in the
late 1970s (Hovanessian et al., 1977; Clemens and Williams, 1978). As one of
the many ISG (3), dsRNA stimulation of OAS leads to the generation of short
(trimer, tetramer, pentamer) 5’phosphorylated, 2’5’-linked oligoadenylates (2-
29
5A) from ATP (Kerr and Brown, 1978; Minks et al., 1979). 2-5A is degraded
very quickly by 2’phosphodiesterase (2’PDE) and 5’phosphatases (Kubota et
al., 2004). The most important function of 2-5A is its activation of RNase L in
response to IFN during viral infection, but also as part of cellular RNA stability
(Zhou et al., 1993). RNase L cleaves on the 3’ side of UN sequences in RNA
molecules, particularly UA, UU and UG sequences, but much less so after CA
or AC (Wreschner et al., 1981; Floyd-Smith et al., 1981). The RNase L enzyme
consists of an ankyrin repeat domain, which constitutes the 2-5A binding site, a
kinase-like domain and the RNase domain (Hassel et al., 1993; Tanaka et al.,
2004). In the absence of 2-5A, RNase L exists as a monomer which has no
ribonuclease activity (Dong and Silverman, 1995) due to the repressing effects
in the last three ankyrin-like repeats (Dong and Silverman, 1997). It is thought
that 2-5A binding causes a conformational change in RNase L, releasing the
inhibitory effects of the ankyrin repeats, forming dimers and unmasking the
ribonuclease domain, leading to the ability to cleave RNA (Dong and Silverman,
1997; Dong et al., 2001). The role of the 2’5’OAS/RNase L system in antiviral
defences is illustrated by the fact that RNase L-/- mice have an increased
susceptibility to infection with the picornaviruses encephalomyocarditis virus
(EMCV) and Coxsackievirus (Zhou et al., 1997; Flodström-Tullberg et al.,
2005) or the flavivirus West Nile virus (Samuel et al., 2006). Some viruses,
however, have evolved mechanism to avoid the antiviral effects of RNase L; for
example in reovirus infection, PKR and RNase L are involved in shutoff of
cellular translation, which are actually beneficial to the growth of some reovirus
strains (Smith et al., 2005). Other aspects of the antiviral effects of the system
are that it is able to induce apoptosis of infected cells via a mitochondrial
pathway (Zhou et al., 1997; Castelli et al., 1998a;1998b) and that it induces the
transcription of other genes that suppress virus replication (Malathi et al., 2005).
1.3.5.4 Mx
Mx was discovered after an inbred strain of mouse was described as being
unusually resistant to influenza A virus (Lindenmann, 1962). It was later found
that the resistance observed was due to a single gene, the Mx1 gene (Reeves et
al., 1988). It was later discovered that many of the commonly used inbred
mouse strains had non-functional Mx (Staeheli et al., 1988). A second Mx gene,
30
Mx2, was identified which also contained mutations in BALB/c and CBA mice
(Staeheli and Sutcliffe, 1988). Mx proteins are GTPases related to dynamins
(Staeheli et al., 1993), they are able to form trimers, self-assemble into rings that
tabulate lipids and localises to the smooth endoplasmic reticulum ( Melen et al.,
1992; Accola et al., 2002). The mechanism(s) by which Mx effects its antiviral
properties are still being investigated. A physical interaction between Mx and
the viral nucleocapsid of Thogoto virus has been demonstrated (Kochs and
Haller, 1999) as well as human Mx being able recognise bunyavirus capsid
protein and interfere in its role in viral genome replication (Haller et al., 2007).
1.3.5.5 ISG15
The ISG15 gene was first cloned in 1986 from IFN treated human Daudi cells
(Blomstrom et al., 1986). It was classified as a ubiquitin homologue and a novel
mechanism for response to IFN in 1992 (Loeb and Haas, 1992). Ubiquitin is a
molecule that tags proteins and labels them for degradation or modifies their
functions (Liu et al, 2005). Ubiquitins require a ubiquitin-activating enzyme
(E1), a conjugating enzyme (E2) and sometimes a ligase (E3) (Reviewed by
Kerscher et al., 2006). It has been shown that ISGylation is similar to
ubiquitination in that is has a specific E1-like activating enzyme, UBE1L (Yuan
and Krug, 2001). Two E2-like conjugating enzymes have also been discovered,
namely UbcH8 (Zhao et al., 2004) and UbcH6 (Takeuchi et al., 2008). These
enzymes activate and conjugate ISG15 to specific protein targets and modulate
their activity, rather than marked them for degradation as in ubiquitination
(Zhao et al., 2004; Harty et al., 2009). Similar to ubiquitin, ISGylation is also
reversible e.g. the enzyme UBP43 cleaves only ISG15 (Catic et al., 2007;
Malakhov et al., 2002). Many targets for ISGylation have already been
identified, including members of the antiviral IFN systems: PKR, MxA, HuP56,
RIG-I and STAT1 (Zhao et al., 2005; Giannakopoulous et al., 2005; Takeuchi
and Yokosawa, 2008). ISG also enhances the innate immune response by
subverting the ubiquitin mediated degradation of IRF3, thereby providing a
positive feedback mechanism (Lu et al., 2006). ISG15 is also able to enhance
the signalling of NF-κB; by conjugating with protein phosphatase 2C beta,
which normally suppresses NF-κB (Takeuchi et al., 2006). In addition to its
31
ubiquitin-like role, ISG15 is also secreted as a cytokine as a response to IFN, but
its exact extracellular functions are unclear (D’Cunha et al., 1996). Its role in
antiviral defence mechanisms has been demonstrated by studies which have
shown increased susceptibility to various virus infections e.g. influenza, Sindbis
and herpes viruses (Lenschow et al., 2007), although the antiviral state induced
by VSV and LCMV was not affected in the absence of ISG15 (Osiak et al.,
2005). Two other related proteins are ISG54 and ISG56. They inhibit
translation by interacting with the eIF3 complex (Guo et al., 2000; Terenzi et
al., 2005).
1.3.5.6 PML nuclear bodies
Promyelocytic leukaemia nuclear bodies (PML NBs) are small nuclear sub-
structures which have been linked to a variety of cellular processes, including:
sensing DNA damage and cellular stress (Dellaire and Bazett-Jones, 2004),
apoptosis (Bernardi and Pandolfi, 2003), senescence (Bischof et al., 2002),
ubiquitination (Anton et al., 1999) and the IFN response to viral infection
(Regad and Chelbi-Alix, 2001). PML NBs have been shown to be induced by
IFN (Chelbi-Alix et al., 1995) and to reduce gene expression in the human
foamy virus (Regad et al., 2001), and inhibits the replication of influenza virus
and VSV (Chelbi-Alix et al., 1998). The absence of PML in mice rendered
them more susceptible to LCMV and VSV (Bonilla et al., 2002). In the case of
poliovirus, infection leads to PML activation of the p53 gene, which leads to
apoptosis (Pampin et al., 2006).
1.3.5.7 Adenosine deaminases (ADARs)
The RNA-specific adenosine deaminase (ADAR) was discovered when an
enzyme, able to unwind dsRNA, was also shown to convert adenosine residues
to inosine residues (Bass and Weintraub, 1988). In human cells there are two
forms of ADAR1 (Patterson and Samuel, 1995), a constitutively expressed 110
kDa protein (ADAR1-S) and an IFN inducible 150 kDa protein (ADAR1-L)
(George and Samuel, 1999; Kawakubo and Samuel, 2000). ADAR1-L was
shown to be >70 fold more active than ADAR1-S in assays with substrates
edited in either the nucleus or cytoplasm, and also with substrate generated
32
during viral replication (Wong et al., 2003) leading to the suggestion that
ADAR was part of the antiviral innate immune system. The A-to-I domination
is a form of genetic recoding and is found in multiple sits in viral RNA. Inosine
is recognised as guanosine by ribosomes and transcribing polymerases, this
leads to A-to-G transitions in the edited strand and therefore to U-to-C
transitions in cRNA; A-to-G hypermutation has been observed in the genome
choriomeningitis virus for example (Zahn et al., 2007). A-to-I hypermutations
have also been observed in measles virus, parainfluenza virus and VSV
(Cattaneo, 1994).
1.3.5.8 Viperin
Viperin (virus inhibitory protein, endoplasmic reticulum-associated, interferon-
inducible) is a cytoplasmic protein, induced by IFN that was first identified in
human cytomegalovirus infection (Chin and Cresswell, 2001). It has since been
shown to have antiviral activity against hepatitis C virus (Helbig et al., 2005),
influenza virus (Wang et al., 2007), HIV (Rivieccio et al., 2006) and
alphaviruses (Zhang et al., 2007). Viperin localises to the cytoplasmic faces of
the endoplasmic reticulum (Hinson and Cresswell, 2009); it has been shown to
inhibit the release of influenza virus from the plasma membrane of cells by
interacting with farnesyl diphosphate synthase (FPPS) leading to altered
membrane fluidity by affecting the formation of lipid rafts, affecting the release
of the virus (Wang et al., 2007).
1.3.5.9 Apoptosis
IFN is also able to induce a cell to undergo apoptosis; if an infected cell is
forced into programmed cell death it can help to remove a source of infection to
the remainder of the animal. There are various pathways by which IFNs may
act to induce apoptosis: activation of the STAT pathway can induce the
expression of caspase 1 (Chin et al., 1997), and it has been shown that IFN-γ
can induce Fas, which acts through Fas ligand to cause apoptosis (Dai and
Krantz, 1999). PKR has been shown to play a role in virus induced apoptosis
e.g. VSV (Gaddy and Lyles, 2007). It is the role of PKR in the phosphorylation
of eIF-2α that mediates apoptosis (Srivastava et al., 1998; Gil et al., 1999;
33
Scheuner et al., 2006). dsRNA generated during viral infections can,
independent of protein synthesis, induce apoptosis by the activation of caspase 8
(Iordanov et al., 2005). The tumour suppressor gene, p53, is also involved in
IFN signalling; IFN induces the transcription of p53 and this response has been
observed in virally infected cells (with VSV) leading to apoptosis (Takaoka et
al., 2003; Munoz-Fontela et al., 2005). The mechanism by which virus
infection and IFN induction leads to upregulation of p53 have been shown to be
a physical association between PKR and p53, resulting in a functional
interaction (Cuddihy et al., 1999). As has been stated previously, the
2’5’OAS/RNase L system also plays a role in the induction of apoptosis
(Castelli et al., 1998).
1.3.5.10 Cell-cycle arrest
IFNs have been shown to arrest cell growth via a STAT mediated induction of
cyclin-dependant kinase inhibitor p21 (Chin et al., 1996). For this reason, IFNs
have been used as anti-cancers agents (reviewed by Ferrantini et al., 2007). A
family of IFN-inducible proteins, the p200 family also affect the cell cycle.
HIN-200 is a nuclear protein that regulates cell differentiation through its
mediation of the cell cycle (Dawson and Trapani, 1996).
1.3.5.11 Immunomodulation
IFNs play a role in the transition from innate immunity to adaptive immunity;
IFN-αβ are able to upregulate of class I major histocompatibility complex
(MHC-I) and elements of the antigen-presenting machinery (reviewed by Le
Bon and Tough, 2002). IFN-αβ produced by virus infected cells also has a role
in the maturation of dendritic cells (Le Bon et al., 2003) and potentiates the
clonal expansion and survival of CD8+ T cells responding to a specific antigen
(Tough et al., 1996). IFN can also induce the production pf IL-15 which is
central to the proliferation and survival of T cells (Boyman et al., 2007) and
maintain NK cell populations (Nguyen et al., 2002)
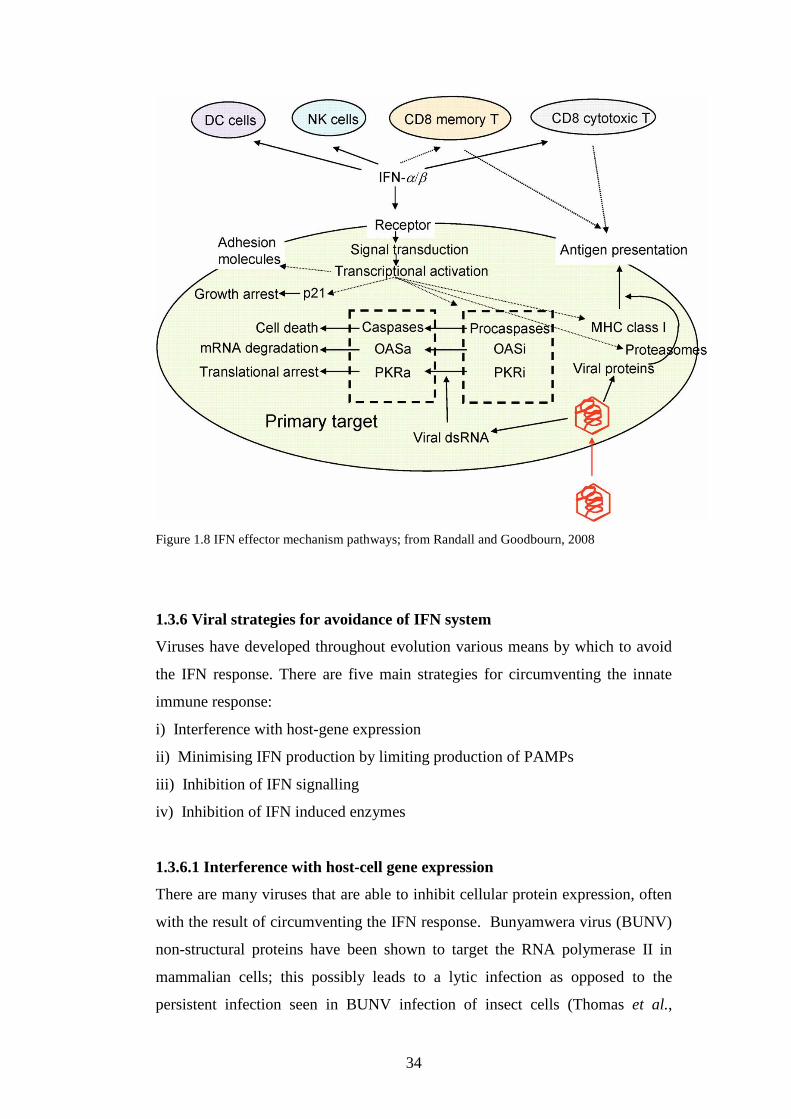
34
Figure 1.8 IFN effector mechanism pathways; from Randall and Goodbourn, 2008
1.3.6 Viral strategies for avoidance of IFN system
Viruses have developed throughout evolution various means by which to avoid
the IFN response. There are five main strategies for circumventing the innate
immune response:
i) Interference with host-gene expression
ii) Minimising IFN production by limiting production of PAMPs
iii) Inhibition of IFN signalling
iv) Inhibition of IFN induced enzymes
1.3.6.1 Interference with host-cell gene expression
There are many viruses that are able to inhibit cellular protein expression, often
with the result of circumventing the IFN response. Bunyamwera virus (BUNV)
non-structural proteins have been shown to target the RNA polymerase II in
mammalian cells; this possibly leads to a lytic infection as opposed to the
persistent infection seen in BUNV infection of insect cells (Thomas et al.,
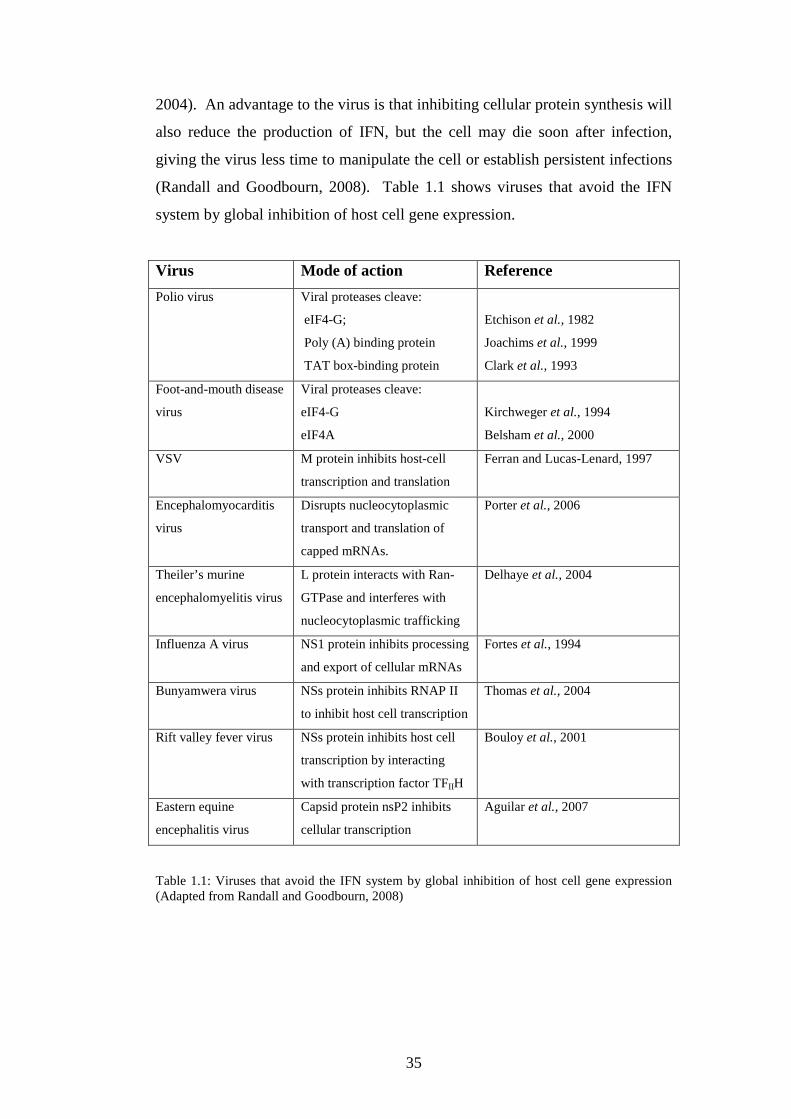
35
2004). An advantage to the virus is that inhibiting cellular protein synthesis will
also reduce the production of IFN, but the cell may die soon after infection,
giving the virus less time to manipulate the cell or establish persistent infections
(Randall and Goodbourn, 2008). Table 1.1 shows viruses that avoid the IFN
system by global inhibition of host cell gene expression.
Virus Mode of action Reference
Polio virus Viral proteases cleave:
eIF4-G;
Poly (A) binding protein
TAT box-binding protein
Etchison et al., 1982
Joachims et al., 1999
Clark et al., 1993
Foot-and-mouth disease
virus
Viral proteases cleave:
eIF4-G
eIF4A
Kirchweger et al., 1994
Belsham et al., 2000
VSV M protein inhibits host-cell
transcription and translation
Ferran and Lucas-Lenard, 1997
Encephalomyocarditis
virus
Disrupts nucleocytoplasmic
transport and translation of
capped mRNAs.
Porter et al., 2006
Theiler’s murine
encephalomyelitis virus
L protein interacts with Ran-
GTPase and interferes with
nucleocytoplasmic trafficking
Delhaye et al., 2004
Influenza A virus NS1 protein inhibits processing
and export of cellular mRNAs
Fortes et al., 1994
Bunyamwera virus NSs protein inhibits RNAP II
to inhibit host cell transcription
Thomas et al., 2004
Rift valley fever virus NSs protein inhibits host cell
transcription by interacting
with transcription factor TFIIH
Bouloy et al., 2001
Eastern equine
encephalitis virus
Capsid protein nsP2 inhibits
cellular transcription
Aguilar et al., 2007
Table 1.1: Viruses that avoid the IFN system by global inhibition of host cell gene expression (Adapted from Randall and Goodbourn, 2008)
36
1.3.6.2 Minimizing IFN production
In order to minimise the production of IFN, viruses have evolved replication
strategies which minimize the production of PAMPs; they have achieved this
by:
i) Controlling virus transcription and translation to minimize the production of
PAMPs.
ii) Encapsidating RNA
iii) Protecting the 5’ triphosphate group from RIG-I
iv) Integrating their genomes into host chromosomes
v) Hiding PAMPs from cellular receptors
(Randall and Goodbourn, 2008)
As dsRNA is one of the most important PAMPs in viral infections, many viruses
have developed means of binding or sequestering it. The reovirus protein σ3 is
able to inhibit the activity of PKR by binding dsRNA (Imani and Jacobs, 1988),
a similar mechanism has been shown for the core protein σA of the avian
reovirus (Martinez-Costas et al., 2000). The porcine group C rotavirus NSP3,
which shares homology with dsRNA-binding proteins, also bind dsRNA and
inhibit PKR (Langland et al., 1994). Other viral genes that encode proteins that
have dsRNA sequestering properties include the E3L gene of vaccinia virus
(Chang et al., 1992), the VP35 of Ebola virus (Cardenas et al., 2006), the SM
protein of Epstein-Barr virus (Poppers et al., 2003), the pTRS1 of human
cytomegalovirus (Hakki and Geballe, 2005), the m142 and m143 proteins of
murine cytomegalovirus form a homodimeric complex that is also able to bind
dsRNA (Child et al., 2006; Valchanova et al., 2006), the Erns glycoprotein of
bovine viral diarrhoea virus (BVDV) has dsRNA-binding activity and RNase
activity (Iqbal et al., 2004). The dsRNA binding ability of influenza A virus
NS1 protein has also been shown to inhibit the 2’5’OAS/RNase L pathway (Min
and Krug,. 2006), prevent the activation of IRF3 (Talon et al., 2000) and is also
able to inhibit the action of PKR by binding directly to it (Li et al., 2006).
Viruses have developed the ability to avoid detection by directly inhibiting the
cytoplasmic PRRs. The V protein of paramyxoviruses inhibits MDA-5 activity
(Andrejeva et al., 2004), although RIG-I is unaffected (Childs et al., 2007). The
paramyxovirus Sendai virus C protein can also block RIG-I (Strahle et al.,
37
2007). Influenza A virus NS1 protein, however, inhibits RIG-I (Guo et al.,
2007) by forming a complex between NS1, RIG-I and Cardif/IPS1 (Mibayashi
et al., 2007).
In addition to preventing the detection of dsRNA by TLR3, RIG-I or MDA-5,
viruses have also evolved various means to inhibit the signalling cascade
emanating from the cellular PRRs. Hepatitis C virus (HCV) NS3/4A is a
protease that cleaves the TLR adaptor protein TRIF (Li et al., 2005). Vaccinia
virus proteins A52R and A46R are able to target multiple adaptors in the IFN
signalling pathway including IRAK2, TRAF6, MyD88 and TRIF leading to a
reduction in IFN production (Stack et al., 2005; Harte et al., 2003).
Plasmacytoid dendritic cells (pDCs) are able to detect viruses without being
directly infected, recognition of ssRNA viruses is through TLR7 after transport
of dsRNA replicatory intermediates through the cytoplasm to the lysosome by
autophagy. Autophagy is a cellular system for the degradation of proteins in
lysosomes, and has been shown also to target intracellular pathogens (Lee et al.,
2007; reviewed by Kirkegaard et al., 2004; Schmid et al., 2006). It is also
required for the production of IFN by pDCs (Lee et al., 2007). Macroautophagy
is induced by phosphorylated eIF2α, a result of the action of PKR and therefore
part of the IFN response (Talloczy et al., 2002). Several RNA viruses have
hijacked the system for their own advantage though e.g. mouse hepatitis virus
(Prentice et al., 2004), poliovirus (Suhy et al., 2000) and equine arteritis virus
(Pedersen et al., 1999) are able to assemble their replication complexes at
double-membraned vesicles which are reminiscent of autophagosomes (Schmid
et al., 2006). The limiting of IFN production is achieved through the Atg5-
Atg121 conjugate, a regulator of autophagy, which directly associates with the
CARD of RIG-I (Jounai et al., 2007).
Other parts of the transduction cascade are also targeted by viruses, including
inactivation of Cardif/VISA/MAVS/IPS-1, inhibition of IRF-3, inhibition of
IKK complexes, inhibition of NF-κB and interference with the IFN-β promoter;
the strategies for minimizing IFN production are summarized in table 1.2. It is
notable that certain viruses e.g. vaccinia virus and HCV, act in more than one
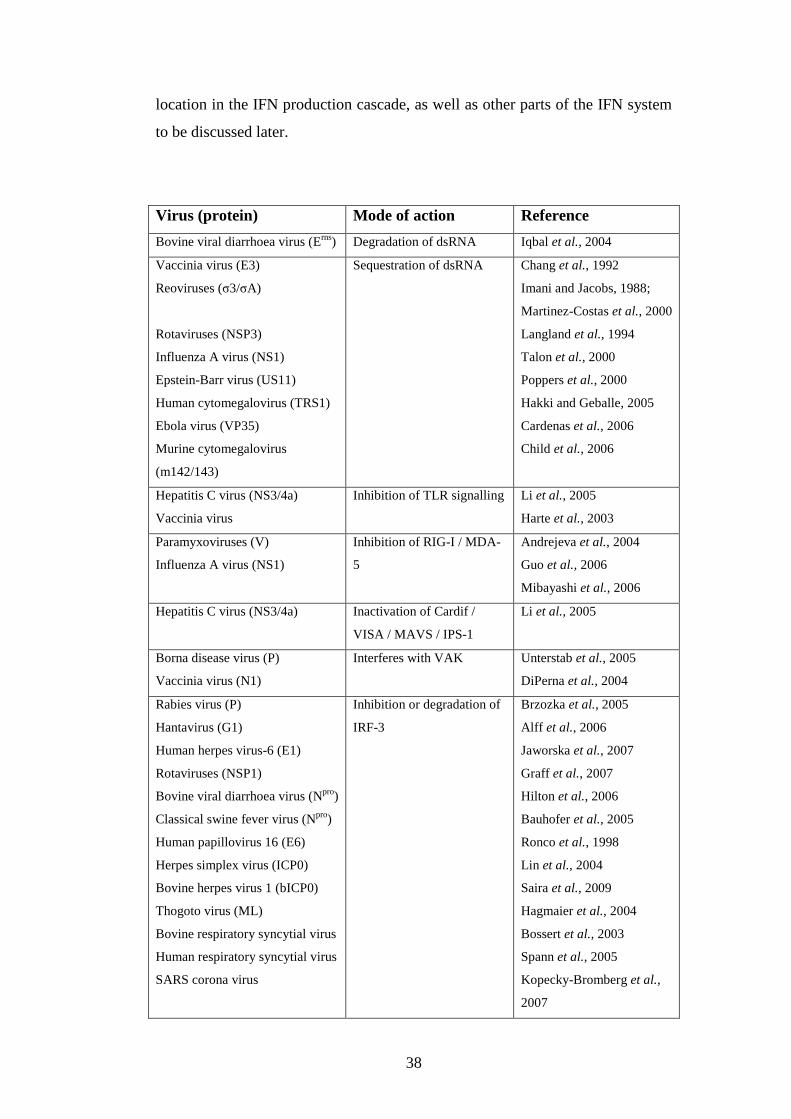
38
location in the IFN production cascade, as well as other parts of the IFN system
to be discussed later.
Virus (protein) Mode of action Reference
Bovine viral diarrhoea virus (Erns) Degradation of dsRNA Iqbal et al., 2004
Vaccinia virus (E3)
Reoviruses (σ3/σA)
Rotaviruses (NSP3)
Influenza A virus (NS1)
Epstein-Barr virus (US11)
Human cytomegalovirus (TRS1)
Ebola virus (VP35)
Murine cytomegalovirus
(m142/143)
Sequestration of dsRNA Chang et al., 1992
Imani and Jacobs, 1988;
Martinez-Costas et al., 2000
Langland et al., 1994
Talon et al., 2000
Poppers et al., 2000
Hakki and Geballe, 2005
Cardenas et al., 2006
Child et al., 2006
Hepatitis C virus (NS3/4a)
Vaccinia virus
Inhibition of TLR signalling Li et al., 2005
Harte et al., 2003
Paramyxoviruses (V)
Influenza A virus (NS1)
Inhibition of RIG-I / MDA-
5
Andrejeva et al., 2004
Guo et al., 2006
Mibayashi et al., 2006
Hepatitis C virus (NS3/4a)
Inactivation of Cardif /
VISA / MAVS / IPS-1
Li et al., 2005
Borna disease virus (P)
Vaccinia virus (N1)
Interferes with VAK Unterstab et al., 2005
DiPerna et al., 2004
Rabies virus (P)
Hantavirus (G1)
Human herpes virus-6 (E1)
Rotaviruses (NSP1)
Bovine viral diarrhoea virus (Npro)
Classical swine fever virus (Npro)
Human papillovirus 16 (E6)
Herpes simplex virus (ICP0)
Bovine herpes virus 1 (bICP0)
Thogoto virus (ML)
Bovine respiratory syncytial virus
Human respiratory syncytial virus
SARS corona virus
Inhibition or degradation of
IRF-3
Brzozka et al., 2005
Alff et al., 2006
Jaworska et al., 2007
Graff et al., 2007
Hilton et al., 2006
Bauhofer et al., 2005
Ronco et al., 1998
Lin et al., 2004
Saira et al., 2009
Hagmaier et al., 2004
Bossert et al., 2003
Spann et al., 2005
Kopecky-Bromberg et al.,
2007
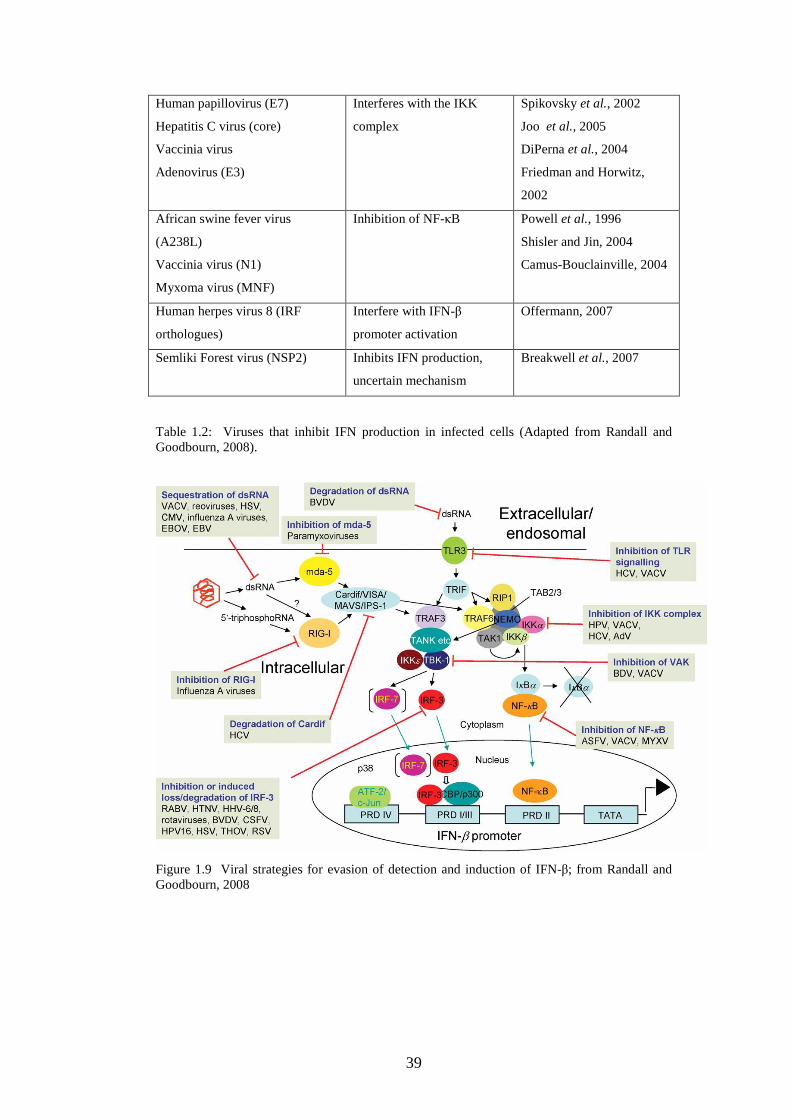
39
Human papillovirus (E7)
Hepatitis C virus (core)
Vaccinia virus
Adenovirus (E3)
Interferes with the IKK
complex
Spikovsky et al., 2002
Joo et al., 2005
DiPerna et al., 2004
Friedman and Horwitz,
2002
African swine fever virus
(A238L)
Vaccinia virus (N1)
Myxoma virus (MNF)
Inhibition of NF-κB Powell et al., 1996
Shisler and Jin, 2004
Camus-Bouclainville, 2004
Human herpes virus 8 (IRF
orthologues)
Interfere with IFN-β
promoter activation
Offermann, 2007
Semliki Forest virus (NSP2) Inhibits IFN production,
uncertain mechanism
Breakwell et al., 2007
Table 1.2: Viruses that inhibit IFN production in infected cells (Adapted from Randall and Goodbourn, 2008).
Figure 1.9 Viral strategies for evasion of detection and induction of IFN-β; from Randall and Goodbourn, 2008
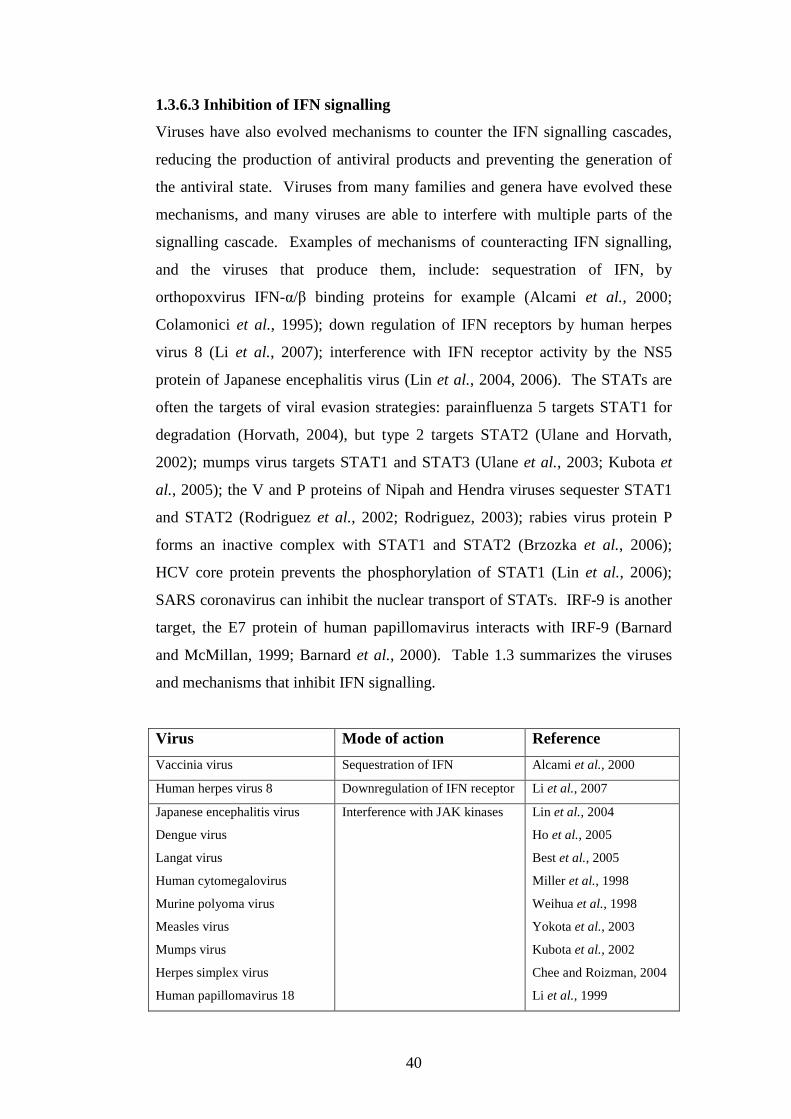
40
1.3.6.3 Inhibition of IFN signalling
Viruses have also evolved mechanisms to counter the IFN signalling cascades,
reducing the production of antiviral products and preventing the generation of
the antiviral state. Viruses from many families and genera have evolved these
mechanisms, and many viruses are able to interfere with multiple parts of the
signalling cascade. Examples of mechanisms of counteracting IFN signalling,
and the viruses that produce them, include: sequestration of IFN, by
orthopoxvirus IFN-α/β binding proteins for example (Alcami et al., 2000;
Colamonici et al., 1995); down regulation of IFN receptors by human herpes
virus 8 (Li et al., 2007); interference with IFN receptor activity by the NS5
protein of Japanese encephalitis virus (Lin et al., 2004, 2006). The STATs are
often the targets of viral evasion strategies: parainfluenza 5 targets STAT1 for
degradation (Horvath, 2004), but type 2 targets STAT2 (Ulane and Horvath,
2002); mumps virus targets STAT1 and STAT3 (Ulane et al., 2003; Kubota et
al., 2005); the V and P proteins of Nipah and Hendra viruses sequester STAT1
and STAT2 (Rodriguez et al., 2002; Rodriguez, 2003); rabies virus protein P
forms an inactive complex with STAT1 and STAT2 (Brzozka et al., 2006);
HCV core protein prevents the phosphorylation of STAT1 (Lin et al., 2006);
SARS coronavirus can inhibit the nuclear transport of STATs. IRF-9 is another
target, the E7 protein of human papillomavirus interacts with IRF-9 (Barnard
and McMillan, 1999; Barnard et al., 2000). Table 1.3 summarizes the viruses
and mechanisms that inhibit IFN signalling.
Virus Mode of action Reference
Vaccinia virus Sequestration of IFN Alcami et al., 2000
Human herpes virus 8 Downregulation of IFN receptor Li et al., 2007
Japanese encephalitis virus
Dengue virus
Langat virus
Human cytomegalovirus
Murine polyoma virus
Measles virus
Mumps virus
Herpes simplex virus
Human papillomavirus 18
Interference with JAK kinases Lin et al., 2004
Ho et al., 2005
Best et al., 2005
Miller et al., 1998
Weihua et al., 1998
Yokota et al., 2003
Kubota et al., 2002
Chee and Roizman, 2004
Li et al., 1999
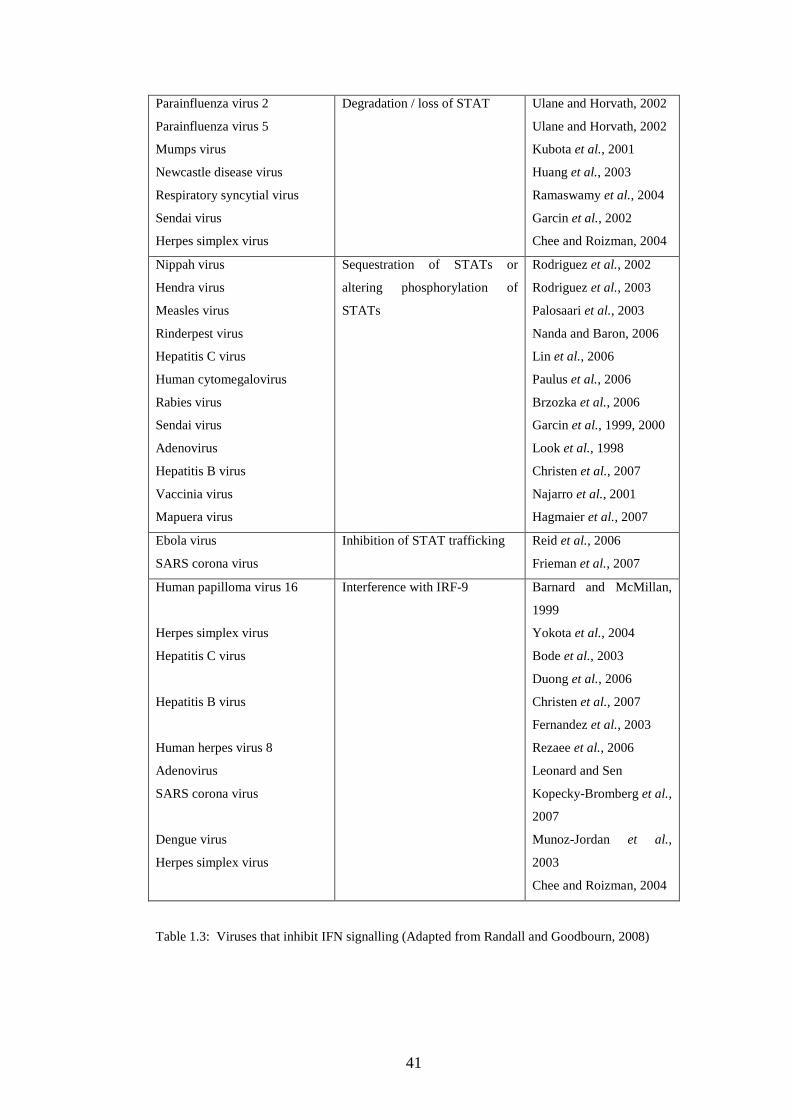
41
Parainfluenza virus 2
Parainfluenza virus 5
Mumps virus
Newcastle disease virus
Respiratory syncytial virus
Sendai virus
Herpes simplex virus
Degradation / loss of STAT Ulane and Horvath, 2002
Ulane and Horvath, 2002
Kubota et al., 2001
Huang et al., 2003
Ramaswamy et al., 2004
Garcin et al., 2002
Chee and Roizman, 2004
Nippah virus
Hendra virus
Measles virus
Rinderpest virus
Hepatitis C virus
Human cytomegalovirus
Rabies virus
Sendai virus
Adenovirus
Hepatitis B virus
Vaccinia virus
Mapuera virus
Sequestration of STATs or
altering phosphorylation of
STATs
Rodriguez et al., 2002
Rodriguez et al., 2003
Palosaari et al., 2003
Nanda and Baron, 2006
Lin et al., 2006
Paulus et al., 2006
Brzozka et al., 2006
Garcin et al., 1999, 2000
Look et al., 1998
Christen et al., 2007
Najarro et al., 2001
Hagmaier et al., 2007
Ebola virus
SARS corona virus
Inhibition of STAT trafficking Reid et al., 2006
Frieman et al., 2007
Human papilloma virus 16
Herpes simplex virus
Hepatitis C virus
Hepatitis B virus
Human herpes virus 8
Adenovirus
SARS corona virus
Dengue virus
Herpes simplex virus
Interference with IRF-9 Barnard and McMillan,
1999
Yokota et al., 2004
Bode et al., 2003
Duong et al., 2006
Christen et al., 2007
Fernandez et al., 2003
Rezaee et al., 2006
Leonard and Sen
Kopecky-Bromberg et al.,
2007
Munoz-Jordan et al.,
2003
Chee and Roizman, 2004
Table 1.3: Viruses that inhibit IFN signalling (Adapted from Randall and Goodbourn, 2008)
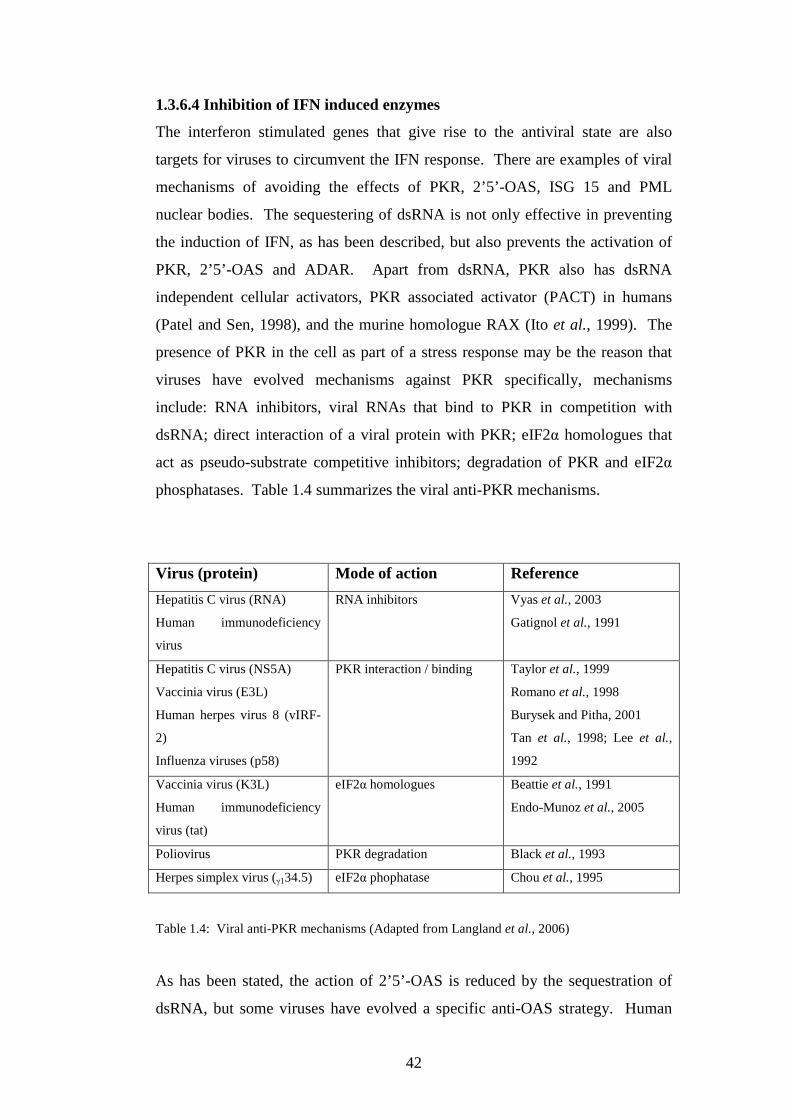
42
1.3.6.4 Inhibition of IFN induced enzymes
The interferon stimulated genes that give rise to the antiviral state are also
targets for viruses to circumvent the IFN response. There are examples of viral
mechanisms of avoiding the effects of PKR, 2’5’-OAS, ISG 15 and PML
nuclear bodies. The sequestering of dsRNA is not only effective in preventing
the induction of IFN, as has been described, but also prevents the activation of
PKR, 2’5’-OAS and ADAR. Apart from dsRNA, PKR also has dsRNA
independent cellular activators, PKR associated activator (PACT) in humans
(Patel and Sen, 1998), and the murine homologue RAX (Ito et al., 1999). The
presence of PKR in the cell as part of a stress response may be the reason that
viruses have evolved mechanisms against PKR specifically, mechanisms
include: RNA inhibitors, viral RNAs that bind to PKR in competition with
dsRNA; direct interaction of a viral protein with PKR; eIF2α homologues that
act as pseudo-substrate competitive inhibitors; degradation of PKR and eIF2α
phosphatases. Table 1.4 summarizes the viral anti-PKR mechanisms.
Virus (protein) Mode of action Reference
Hepatitis C virus (RNA)
Human immunodeficiency
virus
RNA inhibitors Vyas et al., 2003
Gatignol et al., 1991
Hepatitis C virus (NS5A)
Vaccinia virus (E3L)
Human herpes virus 8 (vIRF-
2)
Influenza viruses (p58)
PKR interaction / binding Taylor et al., 1999
Romano et al., 1998
Burysek and Pitha, 2001
Tan et al., 1998; Lee et al.,
1992
Vaccinia virus (K3L)
Human immunodeficiency
virus (tat)
eIF2α homologues Beattie et al., 1991
Endo-Munoz et al., 2005
Poliovirus PKR degradation Black et al., 1993
Herpes simplex virus (γ134.5) eIF2α phophatase Chou et al., 1995
Table 1.4: Viral anti-PKR mechanisms (Adapted from Langland et al., 2006)
As has been stated, the action of 2’5’-OAS is reduced by the sequestration of
dsRNA, but some viruses have evolved a specific anti-OAS strategy. Human
43
immunodeficiency virus 1 (HIV-1) and encephalomyocarditis virus (EMCV)
induce the production of RNase L inhibitor (RLI) (Martinand et al., 1998;
1999). Inhibition of ISG15 has been shown influenza B NS1 protein by
preventing its interaction with the El ligase (Yuan and Krug, 2001). The
adenovirus E4orf3 protein has been shown to interact with PML nuclear bodies
and induce a morphological change (Doucas et al., 1996).
44
1.4 RNA stability
The genomes of positive-sense RNA viruses are equivalent to cellular mRNAs
in that they are released into the cell to be translated by ribosomes. In the cell,
control of mRNA degradation is an important factor in the regulation of gene
expression and many of the enzymes and pathways have been described over
recent years (reviewed by Garneau et al., 2007). Cellular mRNAs have 7-
methylguanosine caps at their 5’ ends, and a poly(A) tail at their 3’ ends. In the
majority of mRNAs, the degradation process begins with shortening of the
poly(A) tail followed by either degradation in a 3’-5’ direction by a 10-12
subunit complex of exonucleases called the exosome; or the 5’ cap is removed
and the RNA degraded by 5’-3’ exoribonucleases, such as Xrn1 (Houseley et
al., 2006; Garneau et al., 2007). The first step, deadenylation, is carried out by
the nucleases PAN2 and CCR4; PAN2 initiates deadenylation followed by
CCR4-mediated shortening of the poly(A) tail (Yamashita et al., 2005).
Structures known as P bodies play a role in mRNA control, they are sites where
the fates of mRNA molecules in determined (Eulalio et al., 2007). These
granular structures contain factors associated with translation initiation
(Ferraiuolo et al., 2005), deadenylation (Cougot et al., 2004), decapping (Sheth
and Parker, 2003), decay by 5’-3’ exonucleases (Bashkirov et al., 1997) and
nonsense-mediated decay (NMD) (Sheth and Parker, 2006). P bodies are
dynamic and represent only active mRNA decay sites; they disappear when not
active (Cougot et al., 2004). Endonucleases cleave RNA molecules to produce
multiple fragments which are then susceptible to exonucleases (Garneau et al.,
2007). It has been shown that the protein Argonaute 2, part of the RNA-induced
silencing complex (RISC), cleaves RNA as part of the short interfering RNA
(siRNA) mechanism (Liu et al., 2004). These mechanisms also make up a
system of mRNA surveillance by detecting aberrant RNAs. Nonsense-mediated
decay detects premature termination codons, non-stop decay degrades mRNAs
lacking a stop codon and no-go decay detects stalled ribosomes on an mRNA
(Garneau et al., 2007). There are various mRNA stability elements that control
mRNA decay. One of the most important is the AU-rich element (ARE), often
found in the 3’ untranslated region of the molecule. The AREs are able to
recruit the mRNA-decay machinery through various ARE-binding proteins such
as AU-rich binding factor-1 (AUF1), tristetraprolin (TTP) and KH splicing
45
regulatory protein (KSRP) that interact with various decay factors (Garneau et
al., 2007).
RNA viruses that deliver their genomes into cells must be able to avoid
degradation by the cellular ribonucleases in order to establish infection in a cell.
This may be achieved by shielding the RNA physically from RNA decay
machinery, or by modulating the decay machinery (Sokoloski et al., 2006).
Many RNA viruses have been shown to form membrane-bound vesicles during
replication flaviviruses and noroviruses, for example (Uchil and Satchianandam,
2003, Hyde et al., 2009). Viruses may also produce ribonucleoproteins (RNPs)
which may regulate the RNA decay mechanisms. The 3’ UTR of hepatitis C
virus (HCV) binds to the cellular HuR protein, conferring protection against
exonucleases (Spangberg et al., 2000). Some viral RNAs have no cap, so would
be vulnerable to degradation by ribonucleases. Poliovirus, which is not capped,
produces the protein 2Apro which is able to cleave parts of the cap-binding
complex and the poly(A)-binding protein (PABP), which plays an important role
in initiation of translation in eukaryotic cells (Joachims et al., 1999). The 2’5’-
OAS/RNAse L system has already been described as an IFN stimulated
mechanism in which RNase L degrades viral and cellular RNAs. This system
may also play a role in regulation of cellular mRNA activity (Bisbal and
Silverman, 2007). There is more to be learned about the interaction of viral
RNAs with cellular degradation mechanisms, but these interactions may play a
role in viral persistence. One of the examples given above, HCV, is one of the
best characterised persistent viruses which has evolved many means of avoiding
various parts of the cells defences; there may be similar strategies in many other
viruses.
46
1.5 Persistent infections
Persistent infections are a feature of many viral diseases. In order for a
persistent infection to be established, viruses have to adopt a replication strategy
that allows them to continuously reside in cells instead of killing them, and to be
able to evade the innate and/or adaptive response so as not to be cleared from
the body (reviewed by Oldstone, 2006; 2009). Whilst many viruses become
persistent through their ability to evade host defences, it must be remembered
that non-persistent viruses have developed mechanisms to evade cellular
defences too over the course of their evolution.
Hepatitis C virus (HCV) is one of the best characterized persistent infections
and will be briefly summarized here. HCV is able to produce a persistent
infection by various immune evasion mechanisms. The NS3/4A protein is able
to disrupt RIG-I signalling which prevents activation of the IRF-3 or NF-κB
arms of the IFN-B induction pathway (Foy et al., 2005). HCV proteins are also
able to inhibit IFN-α/β signal transduction through the JAK-STAT pathway by
blocking the binding of STAT transcription factors to the ISG promoters. This
happens through the action of protein phosphatase 2A which produces
hypomethylated STAT1 which then associated with PIAS1, an inhibitor of
STAT DNA binding (Heim et al., 1999; Blindenbacher et al., 2003; Duong et
al., 2004). HCV core protein has also been shown to induce the expression of
the suppressor of cytokine signalling -3 (SOCS3) (Bode et al., 2003). HCV
protein NS5A also has a role in IFN antagonism; it is able to induce the
expression of interleukin 8 (IL-8) which is associated with reduced 2’5’OAS
activity (Khabar et al., 1997). HCV protein E2 can inhibit the kinase activity of
PKR and block its inhibitory effect on protein synthesis (Taylor et al., 1999).
Ribonuclease L, the effector enzyme of the 2’5’OAS pathway, selectively
cleaves RNA at UA and UU dinucleotides, but HCV has evolved to have a
relative lack of these dinucleotides (Han et al., 2004). Another aspect of HCV
evolution that may enable it to evade immune system and become persistent is
that it exists as a population of closely related yet divergent genomes, known as
quasispecies. This genetic variability may play a role in protecting the virus
from innate or adaptive immunity (Farci and Purcell, 2000).
47
The cells of the innate immune system include dendritic cells and natural killer
(NK) cells. Dendritic cells act as antigen presenting cells in peripheral tissues;
they load antigenic peptides onto major histocompatibility complex (MHC)
class I and II molecules and present them to T lymphocytes, thus initiating the
adaptive immune response (reviewed by Guermonprez et al., 2002). Different
populations of dendritic cells express different receptors, so are able to detect
different microbes (Kadowaki et al., 2001). Plasmacytoid dendritic cells (pDC)
produce large amounts of IFN-αβ on viral stimulation and promote the function
of NK cells, B lymphocytes, T lymphocytes and myeloid dendritic cells
(McKenna et al., 2005). As they play such an important role in the interface
between innate and adaptive immunity, they are often targets for persistent
viruses (Liu et al., 2009). In persistent infection of mice with lymphocytic
choriomeningitis virus (LCMV), the pDCs lose their ability to secrete high
levels of IFN-αβ which in turn, reduces the stimulation of NK cells; as a
consequence, mice are less able to mount a response to subsequent infection
with murine cytomegalovirus (Zuniga et al., 2008). It has also been shown that
measles virus and LCMV both inhibit the development and expansion of DCs
through the generation of IFN that acts through a STAT2 dependant mechanism
which has antiproliferation and antidifferentiation effects on DCs (Hahm et al.,
2005).
Although some viruses are counteracted predominantly by the innate immune
system, complete clearance of the virus from the body often depends on the
action of the adaptive immune system e.g. MNV, see above. Viruses may also
establish persistent infections by evading the adaptive immune system. Studies
on LCMV by Oldstone and colleagues demonstrated that viruses and antibodies
circulate as immune complexes (Oldstone and Dixon, 1968). These immune
complexes are infectious and may contribute to the maintenance of persistent
infections and allow the virus to infect different cell types (Oldstone, 2006).
Viruses can also alter the processing and migration of their peptides in antigen
presenting cells (Oldstone, 2009). Foot-and-mouth-disease virus (FMDV)
infections may be persistent in some of the species it infects. FMDV persists in
the pharynx of cattle (Zhang and Alexandersen, 2004), and can be detected in
the African buffalo for up to 5 years (Hedger, 1972). The precise mechanism is
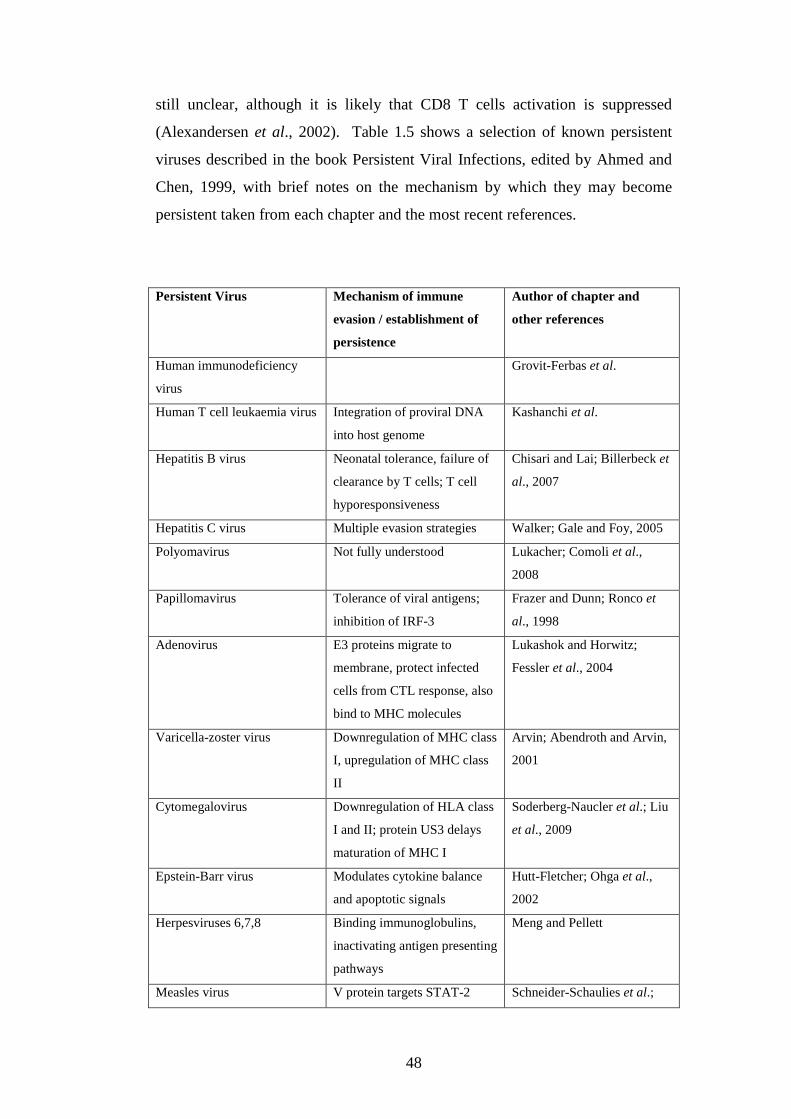
48
still unclear, although it is likely that CD8 T cells activation is suppressed
(Alexandersen et al., 2002). Table 1.5 shows a selection of known persistent
viruses described in the book Persistent Viral Infections, edited by Ahmed and
Chen, 1999, with brief notes on the mechanism by which they may become
persistent taken from each chapter and the most recent references.
Persistent Virus Mechanism of immune
evasion / establishment of
persistence
Author of chapter and
other references
Human immunodeficiency
virus
Grovit-Ferbas et al.
Human T cell leukaemia virus Integration of proviral DNA
into host genome
Kashanchi et al.
Hepatitis B virus Neonatal tolerance, failure of
clearance by T cells; T cell
hyporesponsiveness
Chisari and Lai; Billerbeck et
al., 2007
Hepatitis C virus Multiple evasion strategies Walker; Gale and Foy, 2005
Polyomavirus Not fully understood Lukacher; Comoli et al.,
2008
Papillomavirus Tolerance of viral antigens;
inhibition of IRF-3
Frazer and Dunn; Ronco et
al., 1998
Adenovirus E3 proteins migrate to
membrane, protect infected
cells from CTL response, also
bind to MHC molecules
Lukashok and Horwitz;
Fessler et al., 2004
Varicella-zoster virus Downregulation of MHC class
I, upregulation of MHC class
II
Arvin; Abendroth and Arvin,
2001
Cytomegalovirus Downregulation of HLA class
I and II; protein US3 delays
maturation of MHC I
Soderberg-Naucler et al.; Liu
et al., 2009
Epstein-Barr virus Modulates cytokine balance
and apoptotic signals
Hutt-Fletcher; Ohga et al.,
2002
Herpesviruses 6,7,8 Binding immunoglobulins,
inactivating antigen presenting
pathways
Meng and Pellett
Measles virus V protein targets STAT-2 Schneider-Schaulies et al.;
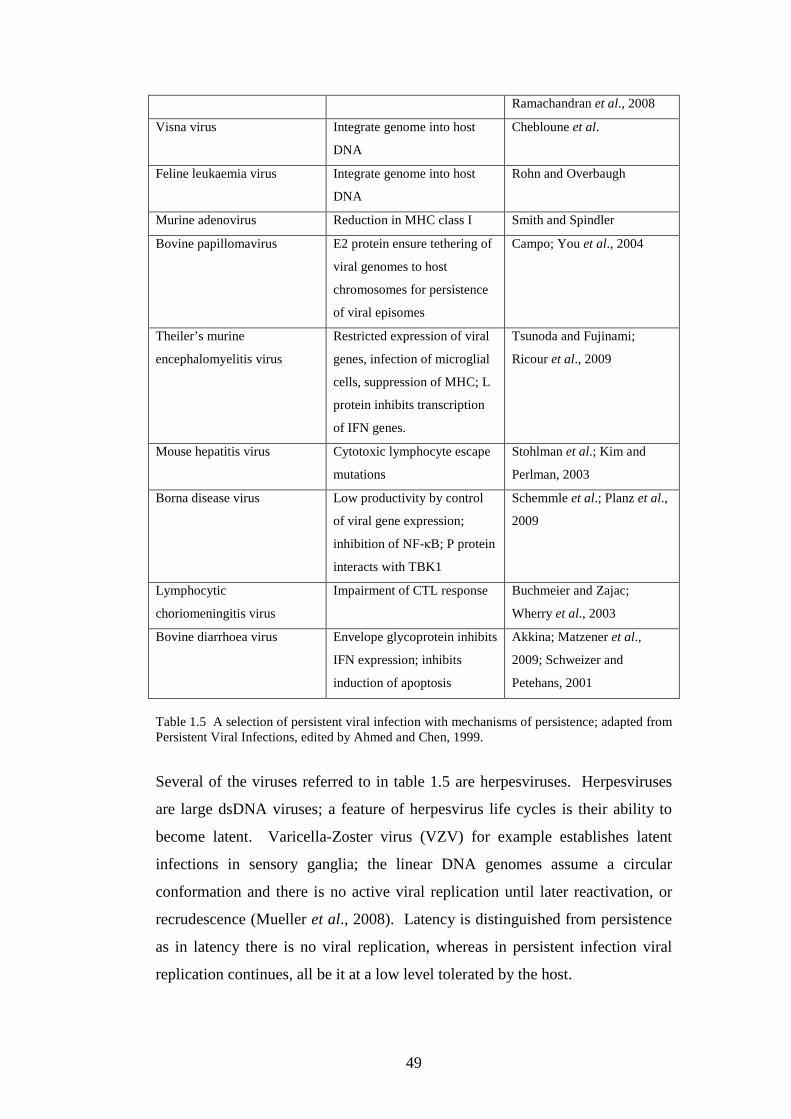
49
Ramachandran et al., 2008
Visna virus Integrate genome into host
DNA
Chebloune et al.
Feline leukaemia virus Integrate genome into host
DNA
Rohn and Overbaugh
Murine adenovirus Reduction in MHC class I Smith and Spindler
Bovine papillomavirus E2 protein ensure tethering of
viral genomes to host
chromosomes for persistence
of viral episomes
Campo; You et al., 2004
Theiler’s murine
encephalomyelitis virus
Restricted expression of viral
genes, infection of microglial
cells, suppression of MHC; L
protein inhibits transcription
of IFN genes.
Tsunoda and Fujinami;
Ricour et al., 2009
Mouse hepatitis virus Cytotoxic lymphocyte escape
mutations
Stohlman et al.; Kim and
Perlman, 2003
Borna disease virus Low productivity by control
of viral gene expression;
inhibition of NF-κB; P protein
interacts with TBK1
Schemmle et al.; Planz et al.,
2009
Lymphocytic
choriomeningitis virus
Impairment of CTL response Buchmeier and Zajac;
Wherry et al., 2003
Bovine diarrhoea virus Envelope glycoprotein inhibits
IFN expression; inhibits
induction of apoptosis
Akkina; Matzener et al.,
2009; Schweizer and
Petehans, 2001
Table 1.5 A selection of persistent viral infection with mechanisms of persistence; adapted from Persistent Viral Infections, edited by Ahmed and Chen, 1999.
Several of the viruses referred to in table 1.5 are herpesviruses. Herpesviruses
are large dsDNA viruses; a feature of herpesvirus life cycles is their ability to
become latent. Varicella-Zoster virus (VZV) for example establishes latent
infections in sensory ganglia; the linear DNA genomes assume a circular
conformation and there is no active viral replication until later reactivation, or
recrudescence (Mueller et al., 2008). Latency is distinguished from persistence
as in latency there is no viral replication, whereas in persistent infection viral
replication continues, all be it at a low level tolerated by the host.
50
1.6 Genome-Scale Ordered RNA Structure (GORS)
1.6.1 RNA secondary structures in viruses
Secondary structure in RNA molecules was first described by Fresco et al., who
described the presence of helical regions of Watson-Crick base-pairing of
adenine-uracil and guanine-cytosine. They described how secondary structure
arises from intramolecular interactions, the lateral mobility that allows RNA
molecules to bend and form local structures such as hairpins (Fresco et al.,
1960). RNA viruses’ replication strategies often involve the use of structured
RNA elements. These elements may be involved in translation and packaging
signals during genome encapsidation.
The internal ribosome entry site (IRES) is found in the 5’ untranslated regions
(UTRs) of picornaviruses such as poliovirus (Pelletier and Soenberg, 1988) and
flaviviruses such as hepatitis C virus (HCV) (Tsukiyama-Kohara et al., 1992) as
well as dicistroviruses and lentiviruses; the structural and functional diversity of
viral IRESes has recently been reviewed by Balvay et al (2009). The IRESes
consist of several domains of internal base-pairing and the formation of stem
loops which interact with host ribosomes during translation of viral genomes.
Some of the best characterised IRES structures are those of picornaviruses,
although there is marked divergence between the IRES’s across the genera,
reviewed by Belsham (2009). There are two major types of picornavirus IRES,
type I and II. Type I IRESes have up to 14 stem-loop domains, labelled A to N
(Jang and Wimmer, 1990), and type two have 6 stem-loops labelled I to VI
(Harber and Wimmer, 1993). Enteroviruses and rhinoviruses have type I
IRESes, whereas aphthoviruses and cardioviruses have type II. All picornavirus
IRESes have a GNRA motif in their central domains and a polypyrimidine tract
20 to 25 nucleotide upstream of an AUG start codon (Balvay et al., 2009). In
aphthovirus, the 3’ end of their type II IRESes interacts with the eukaryotic
initiation factors to drive translation of the viral genome (Kolupaeva et al.,
2003) Another of the best characterised IRES’s is that of HCV; its structure
and function are reviewed by Lukavsky (2009) but a brief summary will be
given here. The HCV IRES contains two major domains, II and III, and a
smaller domain IV (Brown et al., 1992; Kieft et al., 1999). The IRES extends
51
from residue 40 to 372 of the viral genome (Fukushi et al., 1994). The largest
domain, domain III, consists of branching hairpin stem-loops made up of basal,
middle and upper parts, each of which contains further stem-loops (Brown et al.,
1992). The function of the IRES is dependant on its secondary structure as has
been demonstrated by mutagenesis studies (Brown et al., 1992; Fukushi et al.,
1994). Domain III contains the regions that interact directly with eIF3 and the
40S ribosomal subunit leading to a IRES-40S-eIF3 complex and consequent
translation (Kieft et al., 2001).
The presence of structured regions, within the coding region of viruses, that
have a role to play in replication have also been described. In poliovirus there is
a 61 nucleotide stem-loop, from position 4435 to 4495, which is also well
conserved in the Enterovirus genus. As it was required for viability it was
named a cis-acting replication element (CRE) (Goodfellow et al., 2000).
Similar structures have been described in enteroviruses and rhinoviruses (Xiang
et al., 1995), foot-and-mouth disease virus (Mason et al., 2002) and the Brome
mosaic virus (Joost Haasnoot et al.., 2002).
Stem-loops may also be found in the 3’ region of viral genomes. The terminal
46 bases of the HCV genome were described as a stem-loop structure in 1996
(Kolykhalov et al., 1996) which was shown to be essential for HCV infectivity
and replication (Kolykhalov et al., 2000; Yi and Lemon, 2003). HCV has many
stem-loops in its coding region (Tuplin et al., 2002) one of which has been
identified as a CRE (You et al., 2004). A recent study has also shown that there
is a direct interaction between the IRES in the 5’ UTR and structured elements
in the 3’ region of the genome (Romero-Lopez and Berzal-Herranz, 2009).
RNA structures also form packaging signals during encapsidation e.g. HIV
(Huthoff and Berkout, 2002).
1.6.2 Bioinformatic prediction of RNA secondary structure
RNA secondary structures can be predicted by use of energy minimization
algorithms based on dynamic programming (the development of these
techniques is reviewed by Mathews, 2006). The principle of these algorithms is
52
to predict the most energetically favourable structure compared to other
potential structures. The nearest neighbour model for predicting secondary
structure, described by Tinoco et al. 1973, predicts free energy change at 37°C.
An RNA molecule will exist in equilibrium between a structured and
unstructured state. The free energy change for a given structure quantifies its
stability. The structure with the lowest free energy is the most represented at
equilibrium, and therefore the single most likely structure (Mathews and Turner,
2006). The nearest neighbour model is so called as it is dependant on the
identity of the motif and adjacent base pairs (Mathews, 2006). Algorithms were
later developed to include the non-Watson-Crick pairing of guanine-uracil and
to account for loop regions (Mathews et al., 2004). Dynamic programming
algorithms (Nussinov et al., 1980) implicitly check all the possible secondary
structures, although they don’t actually generate them. The first step, known as
the fill step, the lowest free energy is determined for each fragment, starting
with the shortest then moving to the longer fragments. The longer fragments’
folding energies are determined by referring back to the energies of the short
fragments that have been stored (Mathews and Turner, 2006). The second step,
known as traceback, uses the free energies to determine the exact structure that
has the lowest free energy (Mathews, 2006). An algorithm that is also able to
detect pseudoknots has also been devised (Rivas and Eddy, 1999). These
algorithms may not produce reliably the true RNA secondary structure as in
nature RNA molecules may have more than a single conformation and form
suboptimal foldings. The prediction of suboptimal foldings was described by
Zuker in 1989. Another method, developed by McCaskill (1990), called base-
pair partition functions, provides information about the probability of secondary
structures. Dynamic programming algorithms have been used in programs such
as MFOLD (Zuker, 2003), Pfold (Knudsen and Hein, 1999), RNAalifold
(Hofacker et al., 2002) HotKnots (Ren et al., 2005) and RNAz (Gruber et al.,
2007). One of the latest algorithms is UNA fold which is an integrated program
consisting of folding simulation, hybridization and melting pathways which
combines free energy minimization, partition function and stochastic sampling
(Markham and Zuker, 2008).
53
1.6.3 Discovery of GORS
Genome-level ordered RNA structure was first described by Simmonds et al. in
2004. This study consisted of large-scale thermodynamic predictions of RNA
secondary structures across the genomes of viruses from the families
Picornaviridae and Flaviviridae. The program MFOLD (Zuker et al., 1989;
2003) was used to predict the most stable secondary structure of genomic
fragments throughout the length of complete genome sequences of four genera
of Picornaviridae (Enterovirus, Aphthovirus, Teschovirus and Hepatovirus) and
four genera of Flaviviridae (Flavivirus, Hepacivirus, GBV-C-like viruses and
Pestivirus). The minimum free energy (MFE) of the energetically most stable
structure, as predicted by the MFOLD algorithm, of each sequence was
compared with the MFE of 50 randomized control sequences. The results were
expressed of minimum free energy differences (MFEDs) i.e. the percentage
difference between the native sequence and the mean of the 50 randomized
controls. Results were also expressed as a Z score. The Z score is the position
of the MFE within a distribution of the MFEs of the randomized sequences,
expressed as the number of standard deviations from the mean (Workman and
Krogh, 1999). Several randomization strategies were used in order to preserve
certain non-random elements of the sequences such as dinucleotide frequencies.
In viral RNA genomes the dinucleotides CG and UA are underrepresented and
CA and UG are overrepresented (Rima and McFerran, 1997). Randomization
strategies that preserve non-random elements include:
i) Nucleotide order randomization (NOR): randomization of the sequence order.
ii) Codon order randomization (COS): avoids disruption of sequence order
within codons.
iii) Like-codon randomization (CLR): randomization of the order of codons
encoding each amino acid but maintaining amino acid sequence.
iv) Like-codon swap (CLS):pairwise exchange of codons specifying each amino
acid.
v) Dinucleotide randomization (CDR): randomization of codons with identical
first and third bases.
vi) Dinucleotide swap (CDS): pairwise exchange of codons with identical first
and third bases.
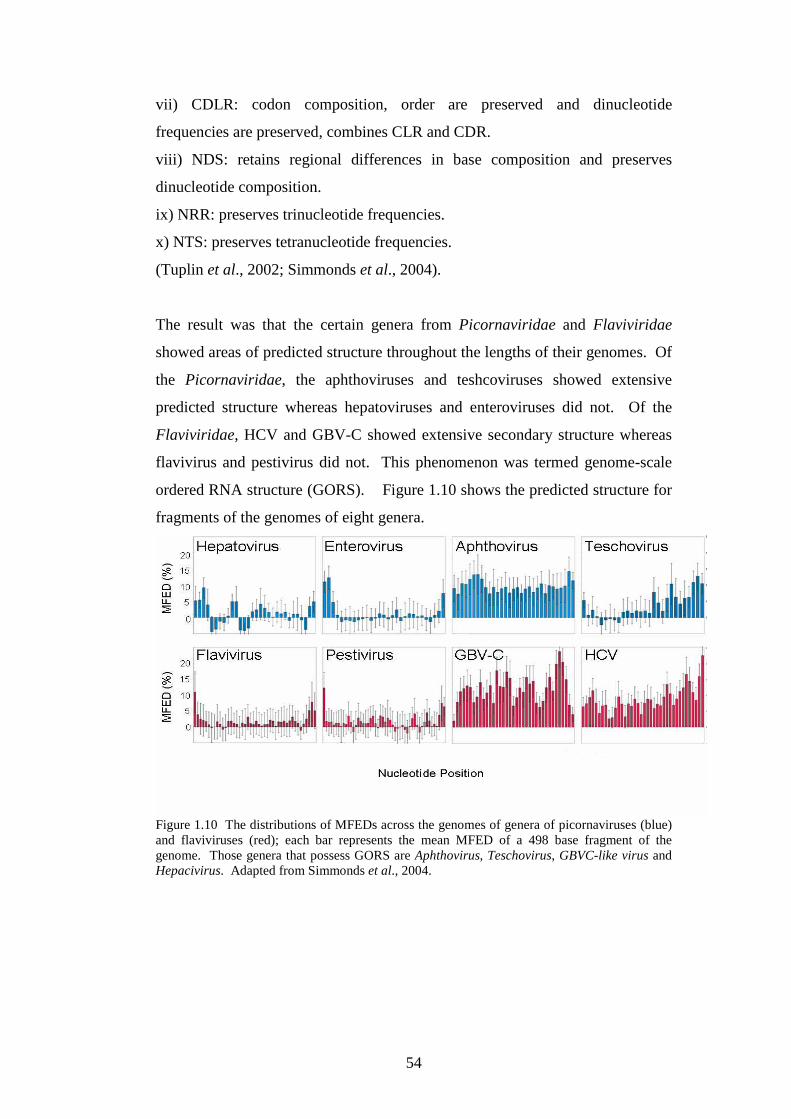
54
vii) CDLR: codon composition, order are preserved and dinucleotide
frequencies are preserved, combines CLR and CDR.
viii) NDS: retains regional differences in base composition and preserves
dinucleotide composition.
ix) NRR: preserves trinucleotide frequencies.
x) NTS: preserves tetranucleotide frequencies.
(Tuplin et al., 2002; Simmonds et al., 2004).
The result was that the certain genera from Picornaviridae and Flaviviridae
showed areas of predicted structure throughout the lengths of their genomes. Of
the Picornaviridae, the aphthoviruses and teshcoviruses showed extensive
predicted structure whereas hepatoviruses and enteroviruses did not. Of the
Flaviviridae, HCV and GBV-C showed extensive secondary structure whereas
flavivirus and pestivirus did not. This phenomenon was termed genome-scale
ordered RNA structure (GORS). Figure 1.10 shows the predicted structure for
fragments of the genomes of eight genera.
Figure 1.10 The distributions of MFEDs across the genomes of genera of picornaviruses (blue) and flaviviruses (red); each bar represents the mean MFED of a 498 base fragment of the genome. Those genera that possess GORS are Aphthovirus, Teschovirus, GBVC-like virus and Hepacivirus. Adapted from Simmonds et al., 2004.
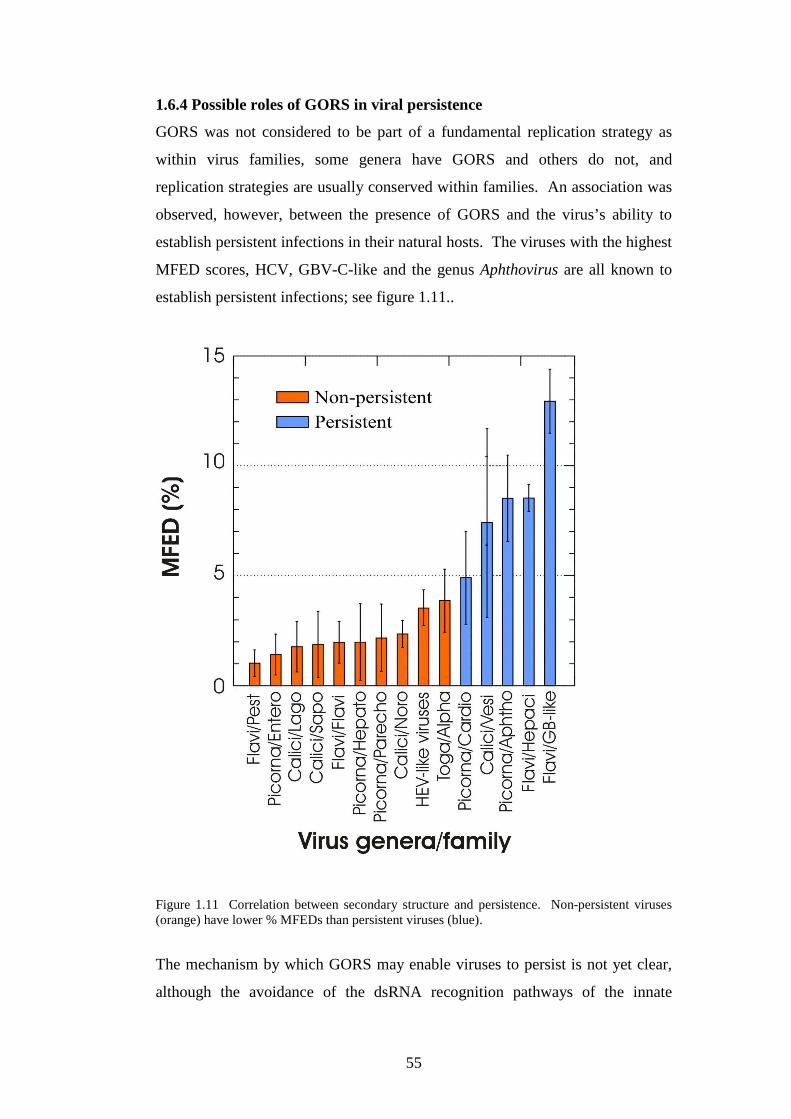
55
1.6.4 Possible roles of GORS in viral persistence
GORS was not considered to be part of a fundamental replication strategy as
within virus families, some genera have GORS and others do not, and
replication strategies are usually conserved within families. An association was
observed, however, between the presence of GORS and the virus’s ability to
establish persistent infections in their natural hosts. The viruses with the highest
MFED scores, HCV, GBV-C-like and the genus Aphthovirus are all known to
establish persistent infections; see figure 1.11..
Figure 1.11 Correlation between secondary structure and persistence. Non-persistent viruses (orange) have lower % MFEDs than persistent viruses (blue).
The mechanism by which GORS may enable viruses to persist is not yet clear,
although the avoidance of the dsRNA recognition pathways of the innate
56
immune system by, in some way, mimicking cellular RNA structures. It seems
also, that GORS is an evolutionarily conserved phenomenon, as experimental
drift of just 2 % sequence change reduced the MFED, and 10 % drift reduced
the MFED of GORS viruses into that of non-GORS viruses, so maintaining a
high degree of secondary structure throughout the genome must be
advantageous for those viruses that contain it (Simmonds et al., 2004).
Recent work has investigated the physical characteristics of GORS, which had
previously been only a bioinformatically predicted phenomenon. Probe
hybridization was carried out on the genomes of predicted GORS viruses: HCV,
GBV-C and MNV; and non-GORS viruses: enterovirus C, tick-borne
encephalitis virus, rubella virus and bunyamwera virus. The GORS genomes
were largely inaccessible to the probes, whereas the non-GORS viruses were
able to hybridize with the probes throughout the majority of the genome.
Atomic force microscopy of viral RNA transcripts of GORS and non-GORS
viruses revealed that GORS RNA (HCV and GBV-C) appeared as tightly
compacted spheroids whereas the non-GORS viruses (poliovirus and rubella
virus) were pleomorphic with extensively single-stranded RNA (Davis et al.,
2008).
57
1.7 Project aims
The aim of this project was conduct the first study into the role of GORS in the
persistence of certain positive-sense RNA viruses. There were two lines of
investigation:
i) Study of GORS viruses - as many of the predicted-GORS viruses are difficult
to work, e.g. hepatitis C virus (HCV) and foot-and-mouth disease virus (FMDV)
require category 3 containment facilities, the viruses chosen for study in this
project were ERAV and MNV. The aim of this study was to:
- determine prevalence of ERAV in horses admitted to the Equine
Hospital, R(D)SVS
- determine prevalence of MNV in cohorts of laboratory and wild mice
- complete genome sequencing of novel viruses identified for
phylogenetic and bioinformatics analysis
- investigate effect of multiple passage in cell culture on the degree of
secondary structure present in viral genomes
ii) Study of the effect of GORS on RNA stability and the interaction of viral
RNA with cellular innate immunity – these studies addressed the observation
that GORS viruses are able to establish persistent infection and tested the
following hypotheses:
- RNA transcripts of GORS virus genomes are more stable in the cell
cytoplasm than RNA transcripts of non-GORS virus genomes.
- RNA transcripts of GORS virus genomes induce IFN-β less strongly
than RNA transcripts of non-GORS virus genomes.
58
Chapter 2 Materials and Methods
2.1 Cell culture 2.2 PCR screening of ERAV and MNV 2.3 Sequencing of ERAV and MNV genomes 2.4 Phylogenetic analysis 2.5 Prediction of free folding energy and RNA structure prediction 2.6 Virus growth and titration 2.7 Creation of RNA transcripts 2.8 RNA stability study 2.9 4 kilobase transcripts 2.10 Interferon induction study
59
Chapter 2 Material and Methods
2.1.1 Cell Culture
Cell lines used: CRE3T3 (murine fibroblast), NIH3T3 (murine fibroblast), RD
(human rhabdomyosarcoma) cells, Vero 136 (African green monkey kidney
epithelial cells) MDCK (Madin-Darby Canine Kidney), RAW 264.7 (murine
leukaemic monocyte macrophage), A549n (human alveolar basal carcinoma)
and A549NPro cells (expressing Bovine Viral Diarrhoea Virus NPro protein).
All cell lines grow as adherent monolayers.
All cell lines were maintained in sterile plastic flasks (80 cm2 surface area
(T80)) (Nunc) at 37°C in a humidified 5 % CO2 atmosphere. All cell lines were
grown in Dulbecco’s modified Eagles Medium (DMEM) (Invitrogen)
supplemented with 10 % (v / v) foetal calf serum (FCS) (Invitrogen, UK), L-
glutamine (200mM Invitrogen), penicillin (100 U / ml, Invitrogen) and
streptomycin (100 µg / ml, Invitrogen).
2.1.2 Cell Counting
Cell lines were maintained by splitting the cell population twice a week, at
intervals of 3 or 4 days. At a confluency of approximately 90 % the cell
monolayers were washed briefly with phosphate buffered saline (PBS). To
remove the monolayers from the flasks the majority of cell lines were incubated
with Tryspin-ethylene diamine tetraacetic acid (EDTA) (0.05 % Trypsin, 0.53
mM EDTA, Invitrogen) in variable conditions for each cell line until the cells
had detached from the surface of the flask:
RAW 264.7 Cells weakly adherent, trypsin not required as cells could
be detached by repeated pipetting in culture medium alone
CRE3T3 /
NIH3T3
Cells incubated with trypsin at room temperature for ~1
minute
RD Cells incubated with trypsin at room temperature for ~2
minutes
Vero 136 Cells incubated with trypsin at room temperature for ~2
minutes
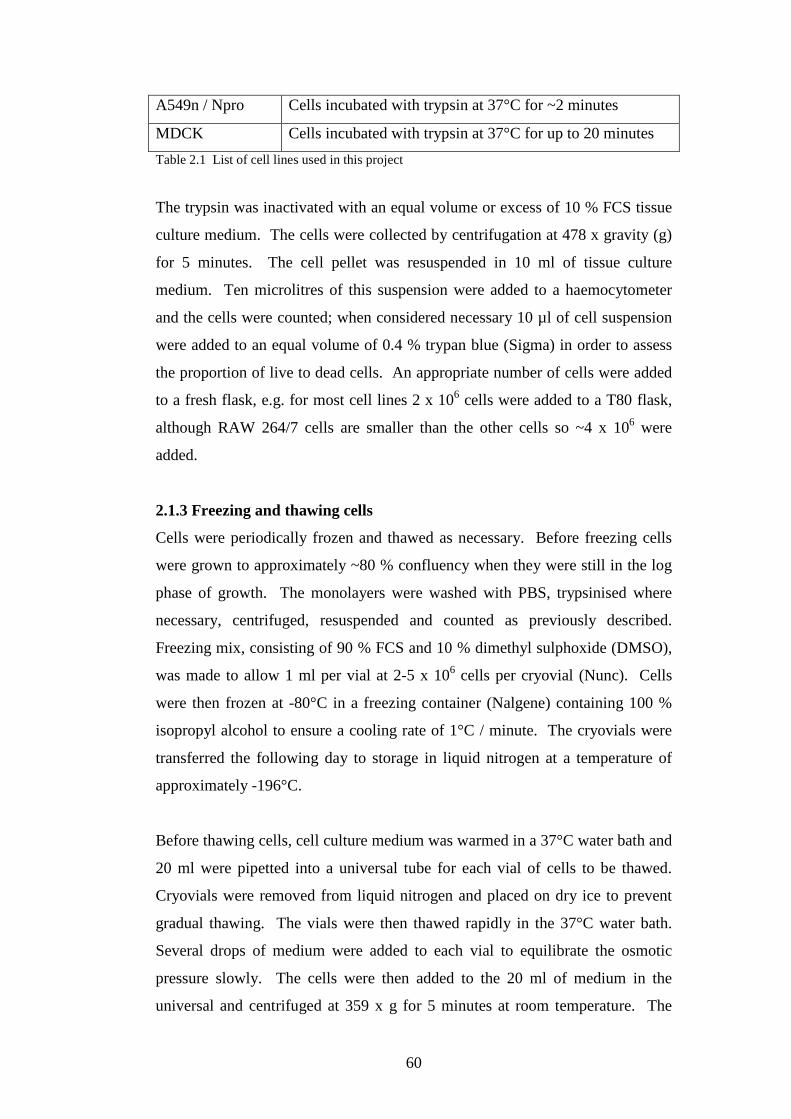
60
A549n / Npro Cells incubated with trypsin at 37°C for ~2 minutes
MDCK Cells incubated with trypsin at 37°C for up to 20 minutes
Table 2.1 List of cell lines used in this project
The trypsin was inactivated with an equal volume or excess of 10 % FCS tissue
culture medium. The cells were collected by centrifugation at 478 x gravity (g)
for 5 minutes. The cell pellet was resuspended in 10 ml of tissue culture
medium. Ten microlitres of this suspension were added to a haemocytometer
and the cells were counted; when considered necessary 10 µl of cell suspension
were added to an equal volume of 0.4 % trypan blue (Sigma) in order to assess
the proportion of live to dead cells. An appropriate number of cells were added
to a fresh flask, e.g. for most cell lines 2 x 10⁶ cells were added to a T80 flask,
although RAW 264/7 cells are smaller than the other cells so ~4 x 10⁶ were
added.
2.1.3 Freezing and thawing cells
Cells were periodically frozen and thawed as necessary. Before freezing cells
were grown to approximately ~80 % confluency when they were still in the log
phase of growth. The monolayers were washed with PBS, trypsinised where
necessary, centrifuged, resuspended and counted as previously described.
Freezing mix, consisting of 90 % FCS and 10 % dimethyl sulphoxide (DMSO),
was made to allow 1 ml per vial at 2-5 x 10⁶ cells per cryovial (Nunc). Cells
were then frozen at -80°C in a freezing container (Nalgene) containing 100 %
isopropyl alcohol to ensure a cooling rate of 1°C / minute. The cryovials were
transferred the following day to storage in liquid nitrogen at a temperature of
approximately -196°C.
Before thawing cells, cell culture medium was warmed in a 37°C water bath and
20 ml were pipetted into a universal tube for each vial of cells to be thawed.
Cryovials were removed from liquid nitrogen and placed on dry ice to prevent
gradual thawing. The vials were then thawed rapidly in the 37°C water bath.
Several drops of medium were added to each vial to equilibrate the osmotic
pressure slowly. The cells were then added to the 20 ml of medium in the
universal and centrifuged at 359 x g for 5 minutes at room temperature. The
61
supernatant was gently poured off, the cells resuspended in 7 ml of medium and
added to a 25 cm2 flask (T25). The following day the medium was changed in
order to ensure that there was no DMSO remaining. The cells were moved up to
the next sized flask as soon as they were growing well and had become
confluent in the T25.
2.2 PCR screening of ERAV and MNV
2.2.1 Collection and processing of equine samples
Samples of ~2 ml of equine blood were taken by veterinary surgeons from
horses at the Large Animal Hospital at Easter Bush Veterinary Centre as a
diagnostic veterinary procedure. The blood was allowed to stand for
approximately 30 minutes before being centrifuged at 3000 rpm for 5 minutes.
The serum was decanted into fresh tubes and stored at -20°C at the clinical
laboratory of the Veterinary Pathology Unit at the Easter Bush Veterinary
Centre.
Equine faecal samples were collected from the horse boxes housing equine in-
patients at the Large Animal Hospital at Easter Bush Veterinary Centre. As the
boxes were cleaned every day the faecal samples would have been less than 1
day old. The faecal samples, weighing 1-3 g, were soaked in PBS at 3 ml PBS
per 1 g faecal material for 6-8 hours with brief vortexing every 30 minutes in
universal tubes. The faecal suspensions were centrifuged at 4000 x g for 20
minutes. One millilitre of the supernatant was centrifuged additionally at 14926
x g for 10 minutes. The supernatant was stored at -20°C for subsequent RNA
extraction.
Isolates of ERAV and ERAV passaged from clinical samples were also kindly
provided by Javier Castillo Olivares of the Animal Health Trust (Newmarket,
UK).
62
2.2.2 Collection and processing of murine faecal samples
Mouse faecal samples were collected from thirty-nine cages in the animal unit at
the University of Edinburgh by Mr Billy Smith. Each tube contained faecal
pellets from a group of in contact animals. Up to 0.1 g of faecal material was
suspended in 1 ml of PBS and allowed to soak for 2-3 hours. The faeces were
then mechanically disrupted with a pipette tip and vortexed for 2 minutes. The
faecal suspensions were clarified by centrifugation at 4000 x g for 20 minutes.
The supernatants were passed through a 0.2 µm filter before being stored at -
20°C. Murine faeces were also collected with kind permission from
Morningside Pets, Edinburgh and processed as described above. Wild house
mice (Mus musculus) were kindly collected in standard house traps by various
people at the University of Edinburgh. The mice were killed under schedule 1
of the Animals (Scientific Procedures) Act by inducing deep anaesthesia by
exposure to gaseous halothane (Concord Pharmaceuticals Ltd) followed by
cervical dislocation. The mice were dissected and the faecal pellets removed
directly from the rectum. Faeces were then processed as described above.
Three species of wild rodent, wood mouse (Apodemus silvaticus), field vole
(Microtus agrestis) and bank vole (Myodes galveolus) had been trapped,
euthanased and stored at -70°C by Anna Meredith, University of Edinburgh,
who kindly allowed access to these animals for the collection of tissue and
faecal samples. Small samples of spleen and mid-jejunum were placed in 0.5 ml
of RNA Later (Qiagen) and stored at -20°C. Faecal samples were processed as
described above.
2.2.3 Extraction of viral RNA
Extraction of viral RNA from faecal suspensions was carried out using the
QIAamp Viral RNA Mini Kit (Qiagen) following the manufacturer’s
recommended protocol. The lyophilised carrier RNA was resuspended in the
buffer AVE to a concentration of 1 µg / µl before adding 5.6 µl carrier RNA
solution to 5.6 ml of the lysis buffer AVL per sample. Carrier RNA is added to
enhance the binding of viral nucleic acids to the Qiamp Mini membrane and to
protect viral RNAs from degradation from any remaining RNases. One hundred
and forty microlitres of faecal suspension was added to 560 µl buffer AVL
containing carrier RNA, mixed by vortexing for 15 seconds (s) and incubated at
63
room temperature for 10 minutes. Five hundred and sixty microlitres of 70 %
ethanol were added to each sample and mixed by vortexing for 15 s. Six
hundred and thirty microlitres of the solution was added to the QIAamp Mini
column and centrifuged at 6000 x g for 1 minute, the filtrate was discarded and
the remainder of the solution added to the column and the spin repeated.
Buffers AW1 and AW2 were diluted with 100 % ethanol as directed. Five
hundred microlitres of AW1 were added to the column and centrifuged at 6000
x g for 1 minute; then 500 µl of AW2 were added to the column and centrifuged
at 20000 x g for 3 minutes. The columns were placed into an RNase free tube,
60 µl of buffer AVE added, incubated at room temperature for 1 minute before
the RNA was eluted by centrifugation at 6000 x g for 1 minute
2.2.4 Reverse transcription
Reverse transcription of viral RNA into cDNA was carried out using the
Reverse Transcription System (Promega). 5 µl of RNA were added to RNase
free tubes and heated to 70°C for 10 minutes and placed on ice. The following
reaction mix was then prepared:
Nuclease-Free Water - 4.8 µl
MgCl2, 25 mM - 4 µl
Reverse Transcription 10x Buffer - 2 µl
dNTP Mixture, 10 mM - 2 µl
Random Primers, 0.5 µg / ml - 1 µl
Recombinant RNasin Ribonuclease inhibitor - 0.5 µl
AMV Reverse Transcriptase, 22 U / µl - 15 U / 0.7 µl
15 microlitres of mix were added to the 5 µl RNA to make a 20 µl reaction
volume. The samples were incubated at room temperature for 10 minutes then
at 42°C for 50 minutes. The AMV reverse transcriptase was deactivated by
heating the samples at 95°C for 5 minutes then incubated on ice for 5 minutes.
The cDNAs were then stored at -20°C.
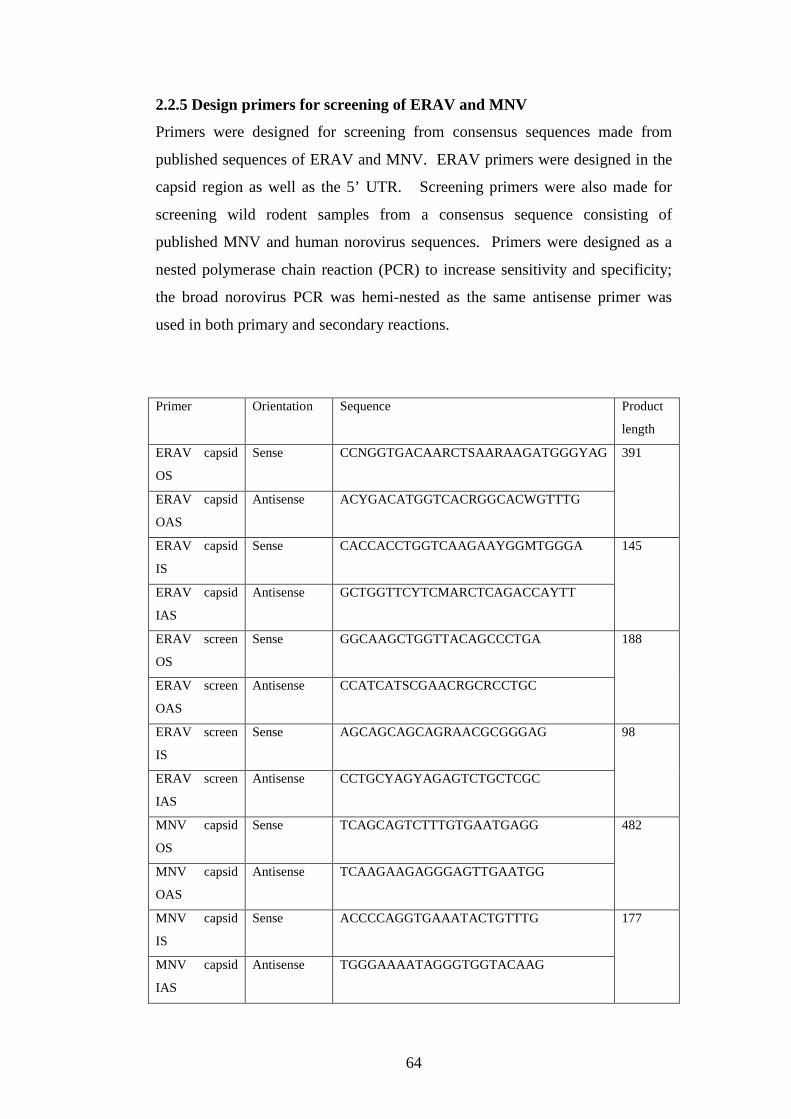
64
2.2.5 Design primers for screening of ERAV and MNV
Primers were designed for screening from consensus sequences made from
published sequences of ERAV and MNV. ERAV primers were designed in the
capsid region as well as the 5’ UTR. Screening primers were also made for
screening wild rodent samples from a consensus sequence consisting of
published MNV and human norovirus sequences. Primers were designed as a
nested polymerase chain reaction (PCR) to increase sensitivity and specificity;
the broad norovirus PCR was hemi-nested as the same antisense primer was
used in both primary and secondary reactions.
Primer Orientation Sequence Product
length
ERAV capsid
OS
Sense CCNGGTGACAARCTSAARAAGATGGGYAG
ERAV capsid
OAS
Antisense ACYGACATGGTCACRGGCACWGTTTG
391
ERAV capsid
IS
Sense CACCACCTGGTCAAGAAYGGMTGGGA
ERAV capsid
IAS
Antisense GCTGGTTCYTCMARCTCAGACCAYTT
145
ERAV screen
OS
Sense GGCAAGCTGGTTACAGCCCTGA
ERAV screen
OAS
Antisense CCATCATSCGAACRGCRCCTGC
188
ERAV screen
IS
Sense AGCAGCAGCAGRAACGCGGGAG
ERAV screen
IAS
Antisense CCTGCYAGYAGAGTCTGCTCGC
98
MNV capsid
OS
Sense TCAGCAGTCTTTGTGAATGAGG
MNV capsid
OAS
Antisense TCAAGAAGAGGGAGTTGAATGG
482
MNV capsid
IS
Sense ACCCCAGGTGAAATACTGTTTG
MNV capsid
IAS
Antisense TGGGAAAATAGGGTGGTACAAG
177
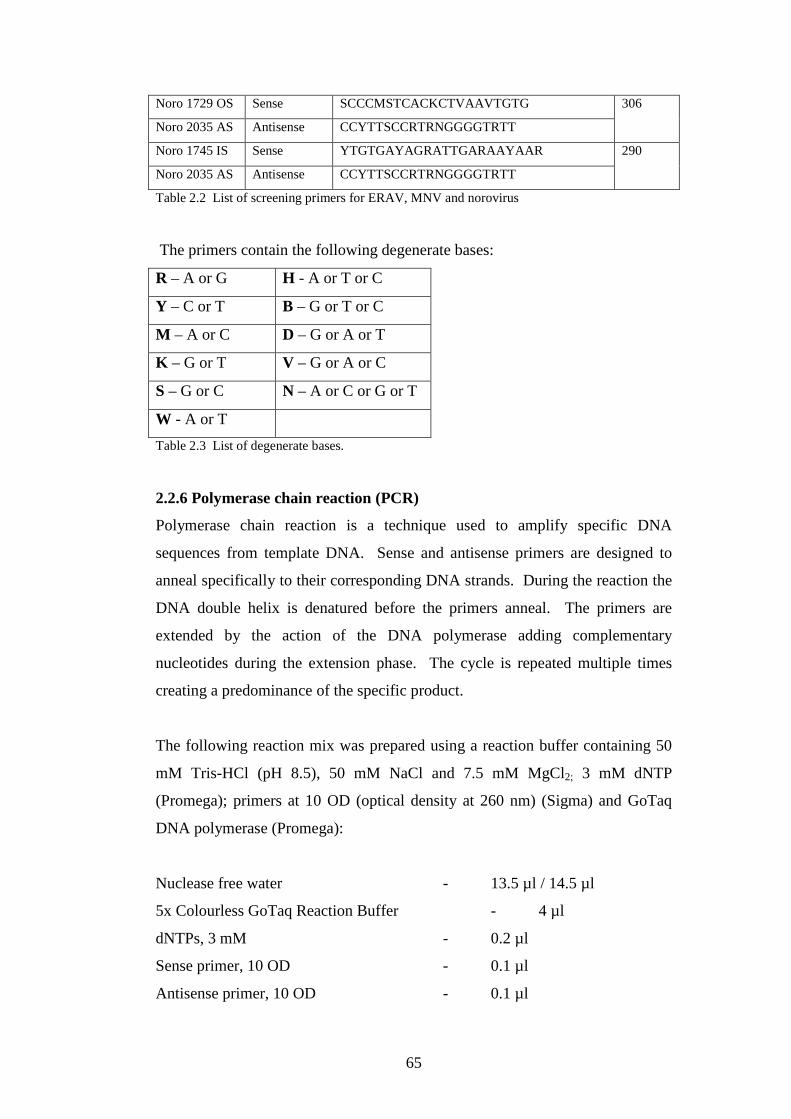
65
Noro 1729 OS Sense SCCCMSTCACKCTVAAVTGTG
Noro 2035 AS Antisense CCYTTSCCRTRNGGGGTRTT
306
Noro 1745 IS Sense YTGTGAYAGRATTGARAAYAAR
Noro 2035 AS Antisense CCYTTSCCRTRNGGGGTRTT
290
Table 2.2 List of screening primers for ERAV, MNV and norovirus
The primers contain the following degenerate bases:
R – A or G H - A or T or C
Y – C or T B – G or T or C
M – A or C D – G or A or T
K – G or T V – G or A or C
S – G or C N – A or C or G or T
W - A or T
Table 2.3 List of degenerate bases.
2.2.6 Polymerase chain reaction (PCR)
Polymerase chain reaction is a technique used to amplify specific DNA
sequences from template DNA. Sense and antisense primers are designed to
anneal specifically to their corresponding DNA strands. During the reaction the
DNA double helix is denatured before the primers anneal. The primers are
extended by the action of the DNA polymerase adding complementary
nucleotides during the extension phase. The cycle is repeated multiple times
creating a predominance of the specific product.
The following reaction mix was prepared using a reaction buffer containing 50
mM Tris-HCl (pH 8.5), 50 mM NaCl and 7.5 mM MgCl2; 3 mM dNTP
(Promega); primers at 10 OD (optical density at 260 nm) (Sigma) and GoTaq
DNA polymerase (Promega):
Nuclease free water - 13.5 µl / 14.5 µl
5x Colourless GoTaq Reaction Buffer - 4 µl
dNTPs, 3 mM - 0.2 µl
Sense primer, 10 OD - 0.1 µl
Antisense primer, 10 OD - 0.1 µl
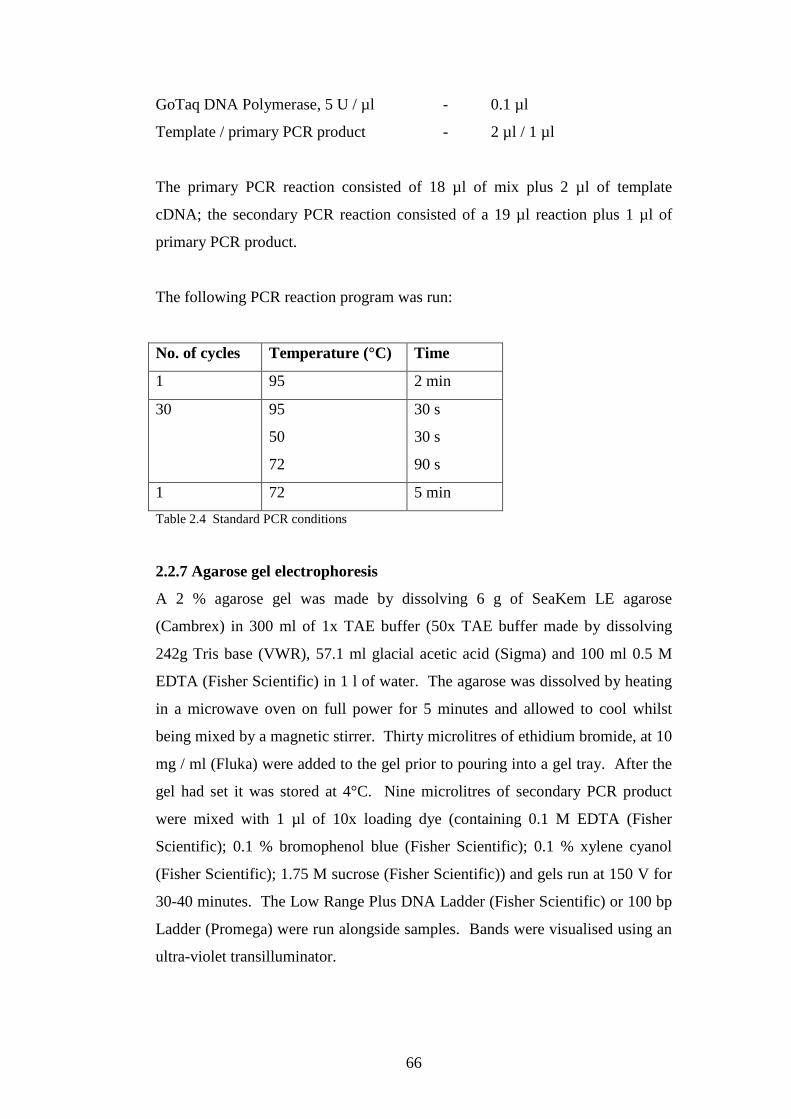
66
GoTaq DNA Polymerase, 5 U / µl - 0.1 µl
Template / primary PCR product - 2 µl / 1 µl
The primary PCR reaction consisted of 18 µl of mix plus 2 µl of template
cDNA; the secondary PCR reaction consisted of a 19 µl reaction plus 1 µl of
primary PCR product.
The following PCR reaction program was run:
No. of cycles Temperature (°C) Time
1 95 2 min
30 95
50
72
30 s
30 s
90 s
1 72 5 min
Table 2.4 Standard PCR conditions
2.2.7 Agarose gel electrophoresis
A 2 % agarose gel was made by dissolving 6 g of SeaKem LE agarose
(Cambrex) in 300 ml of 1x TAE buffer (50x TAE buffer made by dissolving
242g Tris base (VWR), 57.1 ml glacial acetic acid (Sigma) and 100 ml 0.5 M
EDTA (Fisher Scientific) in 1 l of water. The agarose was dissolved by heating
in a microwave oven on full power for 5 minutes and allowed to cool whilst
being mixed by a magnetic stirrer. Thirty microlitres of ethidium bromide, at 10
mg / ml (Fluka) were added to the gel prior to pouring into a gel tray. After the
gel had set it was stored at 4°C. Nine microlitres of secondary PCR product
were mixed with 1 µl of 10x loading dye (containing 0.1 M EDTA (Fisher
Scientific); 0.1 % bromophenol blue (Fisher Scientific); 0.1 % xylene cyanol
(Fisher Scientific); 1.75 M sucrose (Fisher Scientific)) and gels run at 150 V for
30-40 minutes. The Low Range Plus DNA Ladder (Fisher Scientific) or 100 bp
Ladder (Promega) were run alongside samples. Bands were visualised using an
ultra-violet transilluminator.
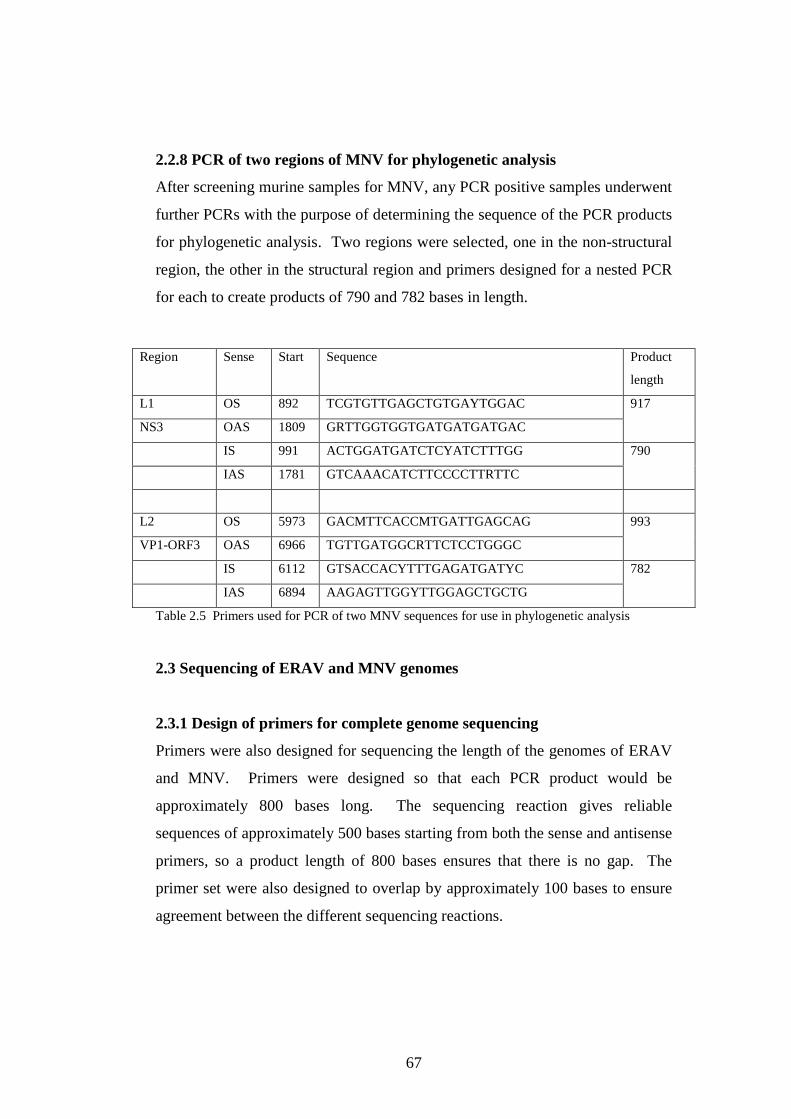
67
2.2.8 PCR of two regions of MNV for phylogenetic analysis
After screening murine samples for MNV, any PCR positive samples underwent
further PCRs with the purpose of determining the sequence of the PCR products
for phylogenetic analysis. Two regions were selected, one in the non-structural
region, the other in the structural region and primers designed for a nested PCR
for each to create products of 790 and 782 bases in length.
Table 2.5 Primers used for PCR of two MNV sequences for use in phylogenetic analysis
2.3 Sequencing of ERAV and MNV genomes
2.3.1 Design of primers for complete genome sequencing
Primers were also designed for sequencing the length of the genomes of ERAV
and MNV. Primers were designed so that each PCR product would be
approximately 800 bases long. The sequencing reaction gives reliable
sequences of approximately 500 bases starting from both the sense and antisense
primers, so a product length of 800 bases ensures that there is no gap. The
primer set were also designed to overlap by approximately 100 bases to ensure
agreement between the different sequencing reactions.
Region Sense Start Sequence Product
length
L1 OS 892 TCGTGTTGAGCTGTGAYTGGAC
NS3 OAS 1809 GRTTGGTGGTGATGATGATGAC
917
IS 991 ACTGGATGATCTCYATCTTTGG
IAS 1781 GTCAAACATCTTCCCCTTRTTC
790
L2 OS 5973 GACMTTCACCMTGATTGAGCAG
VP1-ORF3 OAS 6966 TGTTGATGGCRTTCTCCTGGGC
993
IS 6112 GTSACCACYTTTGAGATGATYC
IAS 6894 AAGAGTTGGYTTGGAGCTGCTG
782
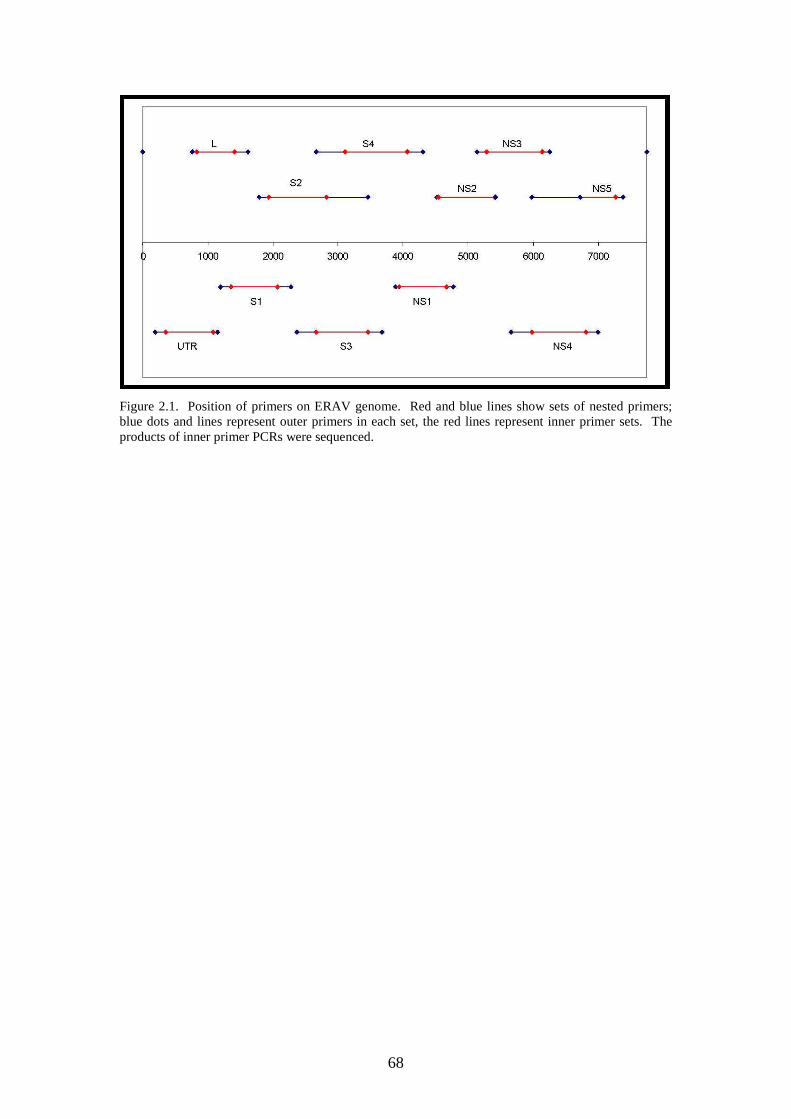
68
Figure 2.1. Position of primers on ERAV genome. Red and blue lines show sets of nested primers; blue dots and lines represent outer primers in each set, the red lines represent inner primer sets. The products of inner primer PCRs were sequenced.
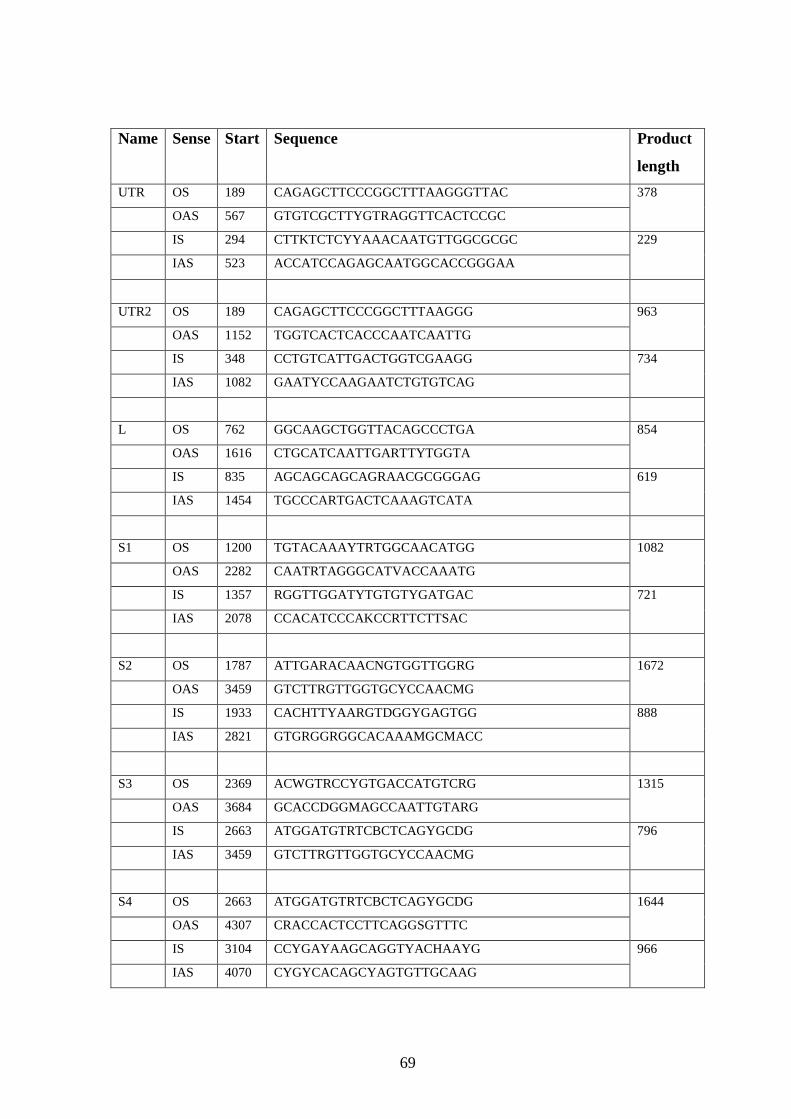
69
Name Sense Start Sequence Product
length
UTR OS 189 CAGAGCTTCCCGGCTTTAAGGGTTAC
OAS 567 GTGTCGCTTYGTRAGGTTCACTCCGC
378
IS 294 CTTKTCTCYYAAACAATGTTGGCGCGC
IAS 523 ACCATCCAGAGCAATGGCACCGGGAA
229
UTR2 OS 189 CAGAGCTTCCCGGCTTTAAGGG
OAS 1152 TGGTCACTCACCCAATCAATTG
963
IS 348 CCTGTCATTGACTGGTCGAAGG
IAS 1082 GAATYCCAAGAATCTGTGTCAG
734
L OS 762 GGCAAGCTGGTTACAGCCCTGA
OAS 1616 CTGCATCAATTGARTTYTGGTA
854
IS 835 AGCAGCAGCAGRAACGCGGGAG
IAS 1454 TGCCCARTGACTCAAAGTCATA
619
S1 OS 1200 TGTACAAAYTRTGGCAACATGG
OAS 2282 CAATRTAGGGCATVACCAAATG
1082
IS 1357 RGGTTGGATYTGTGTYGATGAC
IAS 2078 CCACATCCCAKCCRTTCTTSAC
721
S2 OS 1787 ATTGARACAACNGTGGTTGGRG
OAS 3459 GTCTTRGTTGGTGCYCCAACMG
1672
IS 1933 CACHTTYAARGTDGGYGAGTGG
IAS 2821 GTGRGGRGGCACAAAMGCMACC
888
S3 OS 2369 ACWGTRCCYGTGACCATGTCRG
OAS 3684 GCACCDGGMAGCCAATTGTARG
1315
IS 2663 ATGGATGTRTCBCTCAGYGCDG
IAS 3459 GTCTTRGTTGGTGCYCCAACMG
796
S4 OS 2663 ATGGATGTRTCBCTCAGYGCDG
OAS 4307 CRACCACTCCTTCAGGSGTTTC
1644
IS 3104 CCYGAYAAGCAGGTYACHAAYG
IAS 4070 CYGYCACAGCYAGTGTTGCAAG
966
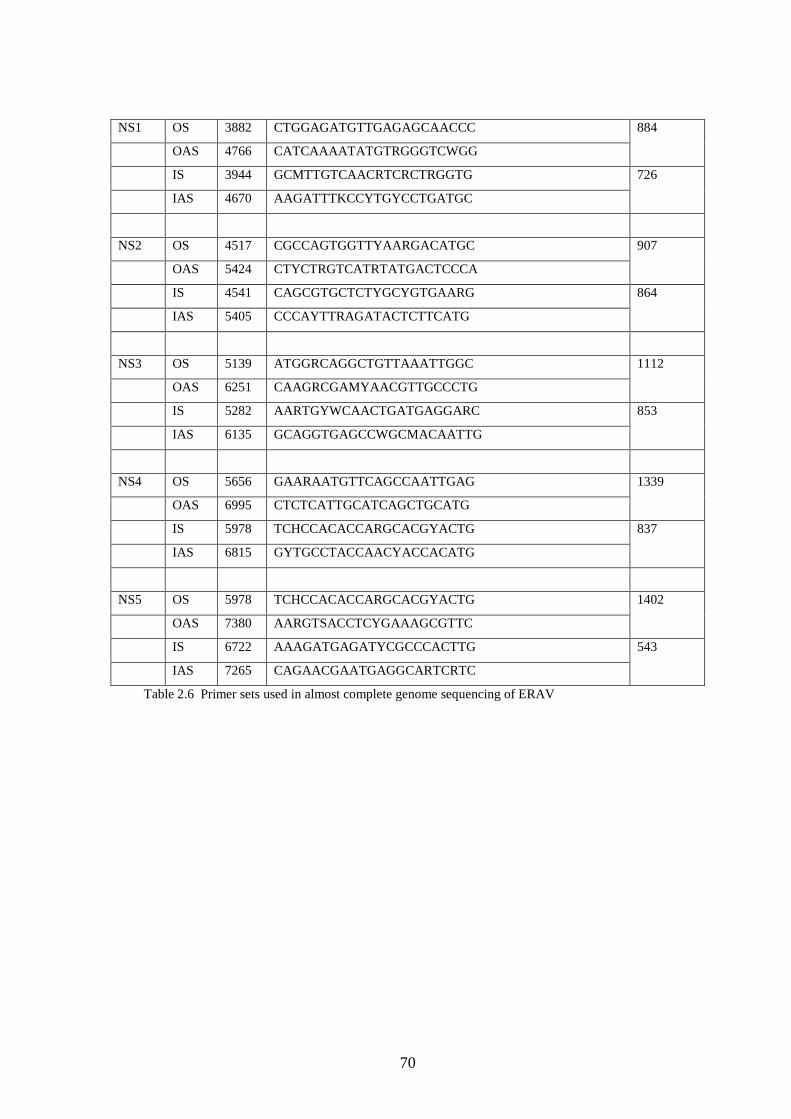
70
Table 2.6 Primer sets used in almost complete genome sequencing of ERAV
NS1 OS 3882 CTGGAGATGTTGAGAGCAACCC
OAS 4766 CATCAAAATATGTRGGGTCWGG
884
IS 3944 GCMTTGTCAACRTCRCTRGGTG
IAS 4670 AAGATTTKCCYTGYCCTGATGC
726
NS2 OS 4517 CGCCAGTGGTTYAARGACATGC
OAS 5424 CTYCTRGTCATRTATGACTCCCA
907
IS 4541 CAGCGTGCTCTYGCYGTGAARG
IAS 5405 CCCAYTTRAGATACTCTTCATG
864
NS3 OS 5139 ATGGRCAGGCTGTTAAATTGGC
OAS 6251 CAAGRCGAMYAACGTTGCCCTG
1112
IS 5282 AARTGYWCAACTGATGAGGARC
IAS 6135 GCAGGTGAGCCWGCMACAATTG
853
NS4 OS 5656 GAARAATGTTCAGCCAATTGAG
OAS 6995 CTCTCATTGCATCAGCTGCATG
1339
IS 5978 TCHCCACACCARGCACGYACTG
IAS 6815 GYTGCCTACCAACYACCACATG
837
NS5 OS 5978 TCHCCACACCARGCACGYACTG
OAS 7380 AARGTSACCTCYGAAAGCGTTC
1402
IS 6722 AAAGATGAGATYCGCCCACTTG
IAS 7265 CAGAACGAATGAGGCARTCRTC
543
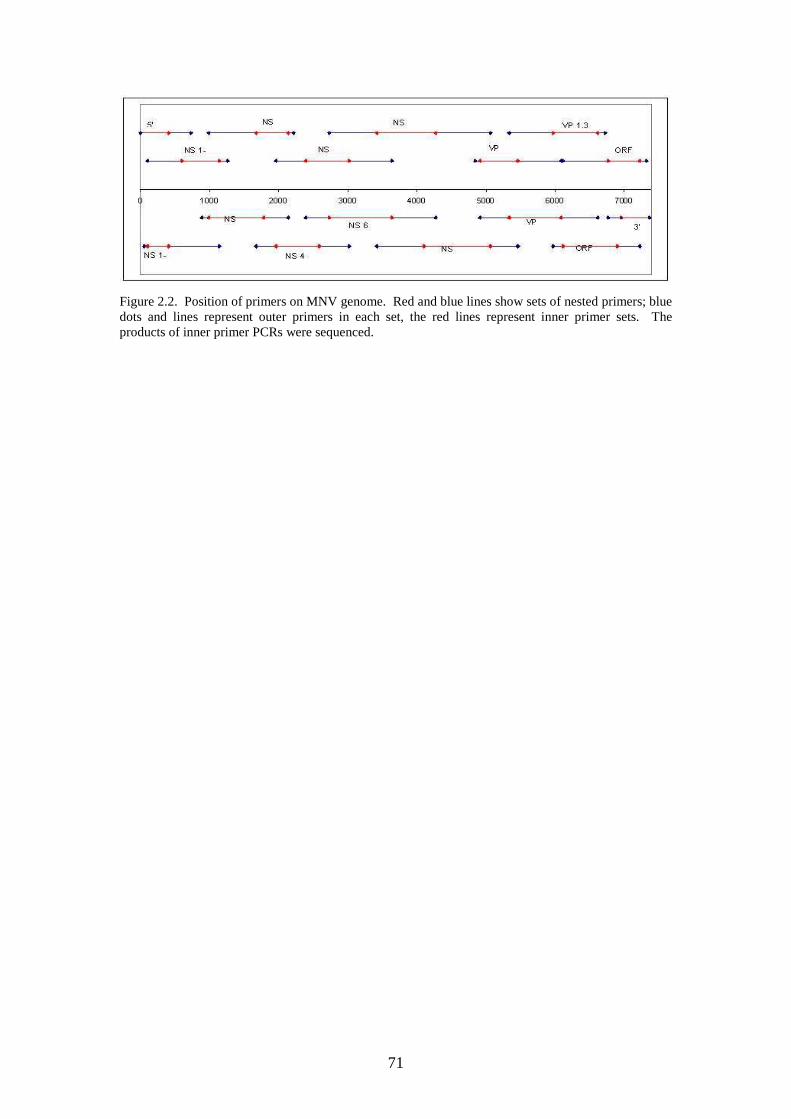
71
Figure 2.2. Position of primers on MNV genome. Red and blue lines show sets of nested primers; blue dots and lines represent outer primers in each set, the red lines represent inner primer sets. The products of inner primer PCRs were sequenced.
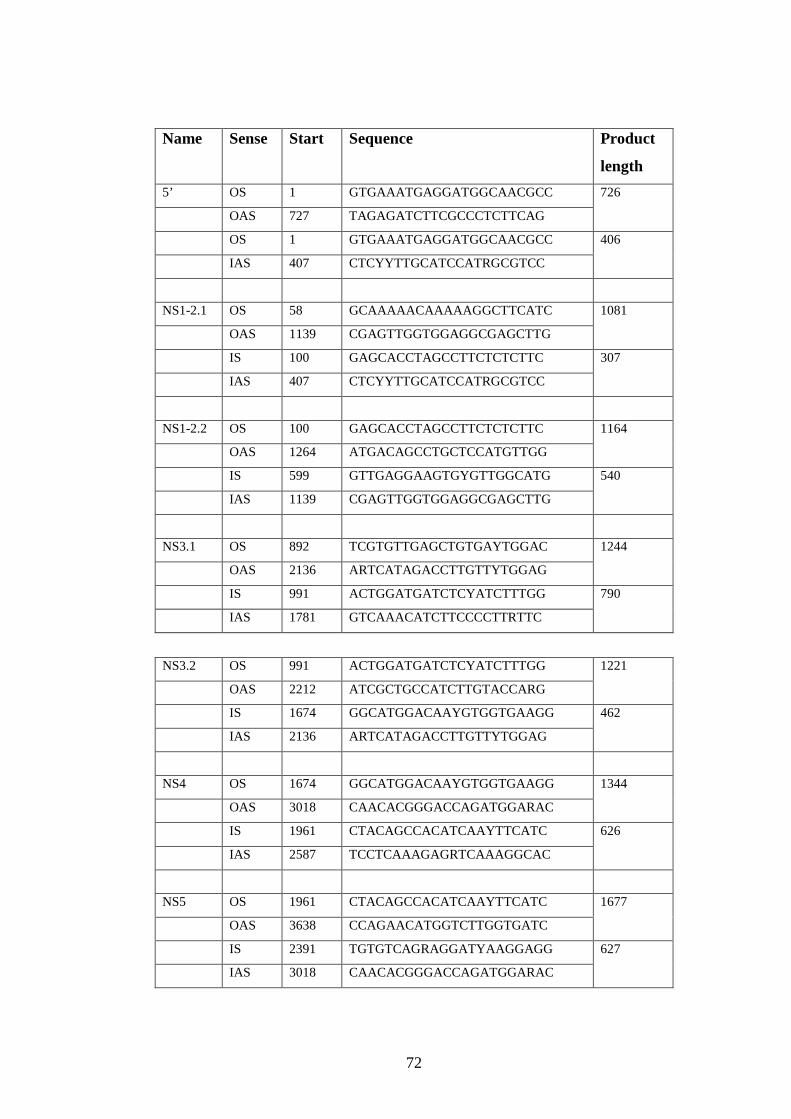
72
Name Sense Start Sequence Product
length
5’ OS 1 GTGAAATGAGGATGGCAACGCC
OAS 727 TAGAGATCTTCGCCCTCTTCAG
726
OS 1 GTGAAATGAGGATGGCAACGCC
IAS 407 CTCYYTTGCATCCATRGCGTCC
406
NS1-2.1 OS 58 GCAAAAACAAAAAGGCTTCATC
OAS 1139 CGAGTTGGTGGAGGCGAGCTTG
1081
IS 100 GAGCACCTAGCCTTCTCTCTTC
IAS 407 CTCYYTTGCATCCATRGCGTCC
307
NS1-2.2 OS 100 GAGCACCTAGCCTTCTCTCTTC
OAS 1264 ATGACAGCCTGCTCCATGTTGG
1164
IS 599 GTTGAGGAAGTGYGTTGGCATG
IAS 1139 CGAGTTGGTGGAGGCGAGCTTG
540
NS3.1 OS 892 TCGTGTTGAGCTGTGAYTGGAC
OAS 2136 ARTCATAGACCTTGTTYTGGAG
1244
IS 991 ACTGGATGATCTCYATCTTTGG
IAS 1781 GTCAAACATCTTCCCCTTRTTC
790
NS3.2 OS 991 ACTGGATGATCTCYATCTTTGG
OAS 2212 ATCGCTGCCATCTTGTACCARG
1221
IS 1674 GGCATGGACAAYGTGGTGAAGG
IAS 2136 ARTCATAGACCTTGTTYTGGAG
462
NS4 OS 1674 GGCATGGACAAYGTGGTGAAGG
OAS 3018 CAACACGGGACCAGATGGARAC
1344
IS 1961 CTACAGCCACATCAAYTTCATC
IAS 2587 TCCTCAAAGAGRTCAAAGGCAC
626
NS5 OS 1961 CTACAGCCACATCAAYTTCATC
OAS 3638 CCAGAACATGGTCTTGGTGATC
1677
IS 2391 TGTGTCAGRAGGATYAAGGAGG
IAS 3018 CAACACGGGACCAGATGGARAC
627
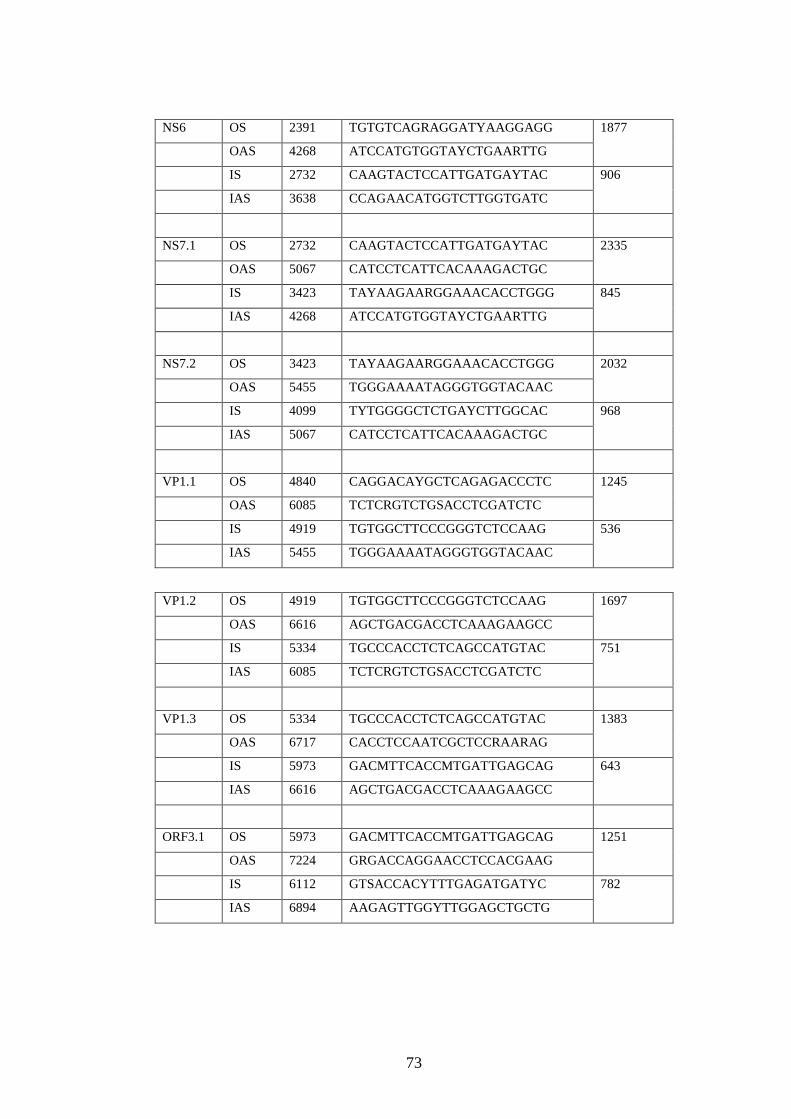
73
NS6 OS 2391 TGTGTCAGRAGGATYAAGGAGG
OAS 4268 ATCCATGTGGTAYCTGAARTTG
1877
IS 2732 CAAGTACTCCATTGATGAYTAC
IAS 3638 CCAGAACATGGTCTTGGTGATC
906
NS7.1 OS 2732 CAAGTACTCCATTGATGAYTAC
OAS 5067 CATCCTCATTCACAAAGACTGC
2335
IS 3423 TAYAAGAARGGAAACACCTGGG
IAS 4268 ATCCATGTGGTAYCTGAARTTG
845
NS7.2 OS 3423 TAYAAGAARGGAAACACCTGGG
OAS 5455 TGGGAAAATAGGGTGGTACAAC
2032
IS 4099 TYTGGGGCTCTGAYCTTGGCAC
IAS 5067 CATCCTCATTCACAAAGACTGC
968
VP1.1 OS 4840 CAGGACAYGCTCAGAGACCCTC
OAS 6085 TCTCRGTCTGSACCTCGATCTC
1245
IS 4919 TGTGGCTTCCCGGGTCTCCAAG
IAS 5455 TGGGAAAATAGGGTGGTACAAC
536
VP1.2 OS 4919 TGTGGCTTCCCGGGTCTCCAAG
OAS 6616 AGCTGACGACCTCAAAGAAGCC
1697
IS 5334 TGCCCACCTCTCAGCCATGTAC
IAS 6085 TCTCRGTCTGSACCTCGATCTC
751
VP1.3 OS 5334 TGCCCACCTCTCAGCCATGTAC
OAS 6717 CACCTCCAATCGCTCCRAARAG
1383
IS 5973 GACMTTCACCMTGATTGAGCAG
IAS 6616 AGCTGACGACCTCAAAGAAGCC
643
ORF3.1 OS 5973 GACMTTCACCMTGATTGAGCAG
OAS 7224 GRGACCAGGAACCTCCACGAAG
1251
IS 6112 GTSACCACYTTTGAGATGATYC
IAS 6894 AAGAGTTGGYTTGGAGCTGCTG
782
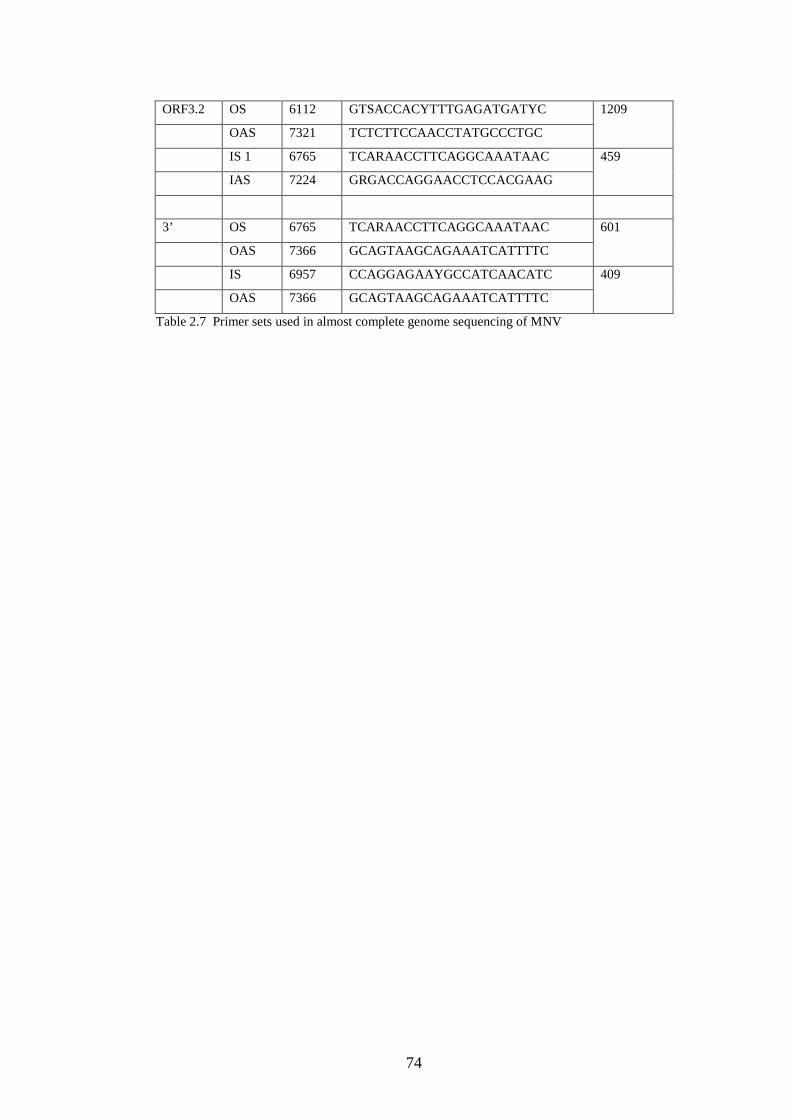
74
Table 2.7 Primer sets used in almost complete genome sequencing of MNV
ORF3.2 OS 6112 GTSACCACYTTTGAGATGATYC
OAS 7321 TCTCTTCCAACCTATGCCCTGC
1209
IS 1 6765 TCARAACCTTCAGGCAAATAAC
IAS 7224 GRGACCAGGAACCTCCACGAAG
459
3’ OS 6765 TCARAACCTTCAGGCAAATAAC
OAS 7366 GCAGTAAGCAGAAATCATTTTC
601
IS 6957 CCAGGAGAAYGCCATCAACATC
OAS 7366 GCAGTAAGCAGAAATCATTTTC
409
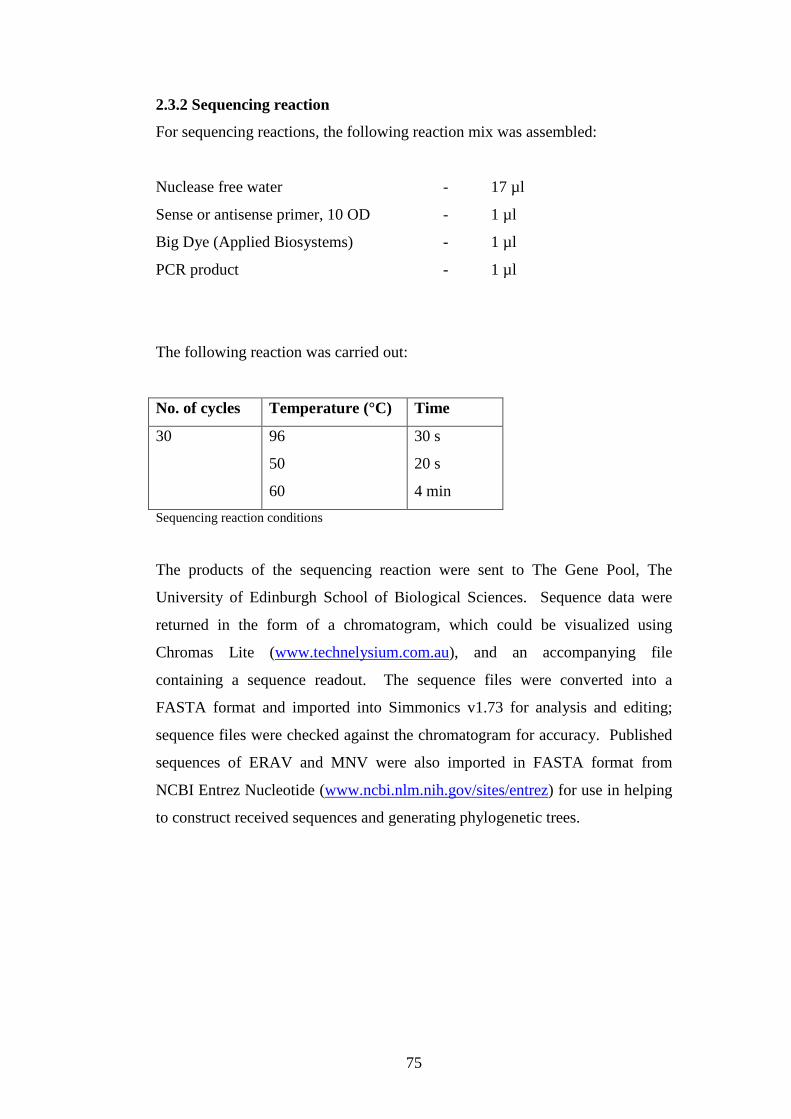
75
2.3.2 Sequencing reaction
For sequencing reactions, the following reaction mix was assembled:
Nuclease free water - 17 µl
Sense or antisense primer, 10 OD - 1 µl
Big Dye (Applied Biosystems) - 1 µl
PCR product - 1 µl
The following reaction was carried out:
No. of cycles Temperature (°C) Time
30 96
50
60
30 s
20 s
4 min
Sequencing reaction conditions
The products of the sequencing reaction were sent to The Gene Pool, The
University of Edinburgh School of Biological Sciences. Sequence data were
returned in the form of a chromatogram, which could be visualized using
Chromas Lite (www.technelysium.com.au), and an accompanying file
containing a sequence readout. The sequence files were converted into a
FASTA format and imported into Simmonics v1.73 for analysis and editing;
sequence files were checked against the chromatogram for accuracy. Published
sequences of ERAV and MNV were also imported in FASTA format from
NCBI Entrez Nucleotide (www.ncbi.nlm.nih.gov/sites/entrez) for use in helping
to construct received sequences and generating phylogenetic trees.
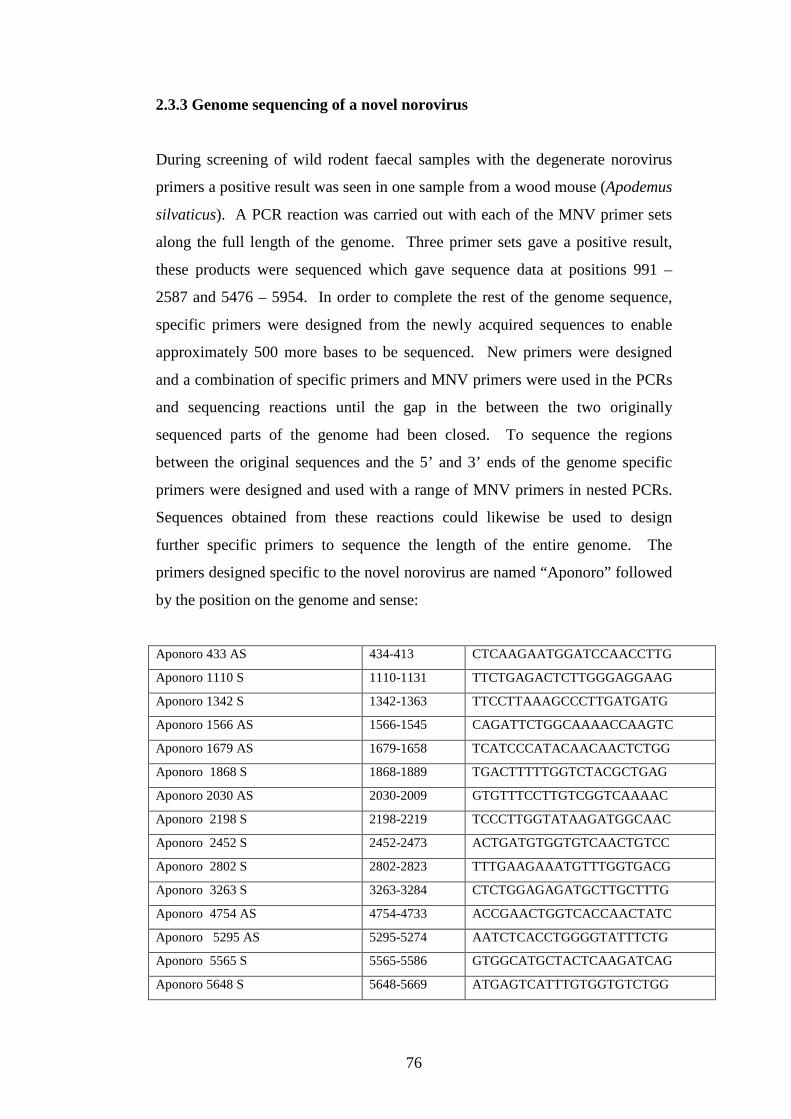
76
2.3.3 Genome sequencing of a novel norovirus
During screening of wild rodent faecal samples with the degenerate norovirus
primers a positive result was seen in one sample from a wood mouse (Apodemus
silvaticus). A PCR reaction was carried out with each of the MNV primer sets
along the full length of the genome. Three primer sets gave a positive result,
these products were sequenced which gave sequence data at positions 991 –
2587 and 5476 – 5954. In order to complete the rest of the genome sequence,
specific primers were designed from the newly acquired sequences to enable
approximately 500 more bases to be sequenced. New primers were designed
and a combination of specific primers and MNV primers were used in the PCRs
and sequencing reactions until the gap in the between the two originally
sequenced parts of the genome had been closed. To sequence the regions
between the original sequences and the 5’ and 3’ ends of the genome specific
primers were designed and used with a range of MNV primers in nested PCRs.
Sequences obtained from these reactions could likewise be used to design
further specific primers to sequence the length of the entire genome. The
primers designed specific to the novel norovirus are named “Aponoro” followed
by the position on the genome and sense:
Aponoro 433 AS 434-413 CTCAAGAATGGATCCAACCTTG
Aponoro 1110 S 1110-1131 TTCTGAGACTCTTGGGAGGAAG
Aponoro 1342 S 1342-1363 TTCCTTAAAGCCCTTGATGATG
Aponoro 1566 AS 1566-1545 CAGATTCTGGCAAAACCAAGTC
Aponoro 1679 AS 1679-1658 TCATCCCATACAACAACTCTGG
Aponoro 1868 S 1868-1889 TGACTTTTTGGTCTACGCTGAG
Aponoro 2030 AS 2030-2009 GTGTTTCCTTGTCGGTCAAAAC
Aponoro 2198 S 2198-2219 TCCCTTGGTATAAGATGGCAAC
Aponoro 2452 S 2452-2473 ACTGATGTGGTGTCAACTGTCC
Aponoro 2802 S 2802-2823 TTTGAAGAAATGTTTGGTGACG
Aponoro 3263 S 3263-3284 CTCTGGAGAGATGCTTGCTTTG
Aponoro 4754 AS 4754-4733 ACCGAACTGGTCACCAACTATC
Aponoro 5295 AS 5295-5274 AATCTCACCTGGGGTATTTCTG
Aponoro 5565 S 5565-5586 GTGGCATGCTACTCAAGATCAG
Aponoro 5648 S 5648-5669 ATGAGTCATTTGTGGTGTCTGG
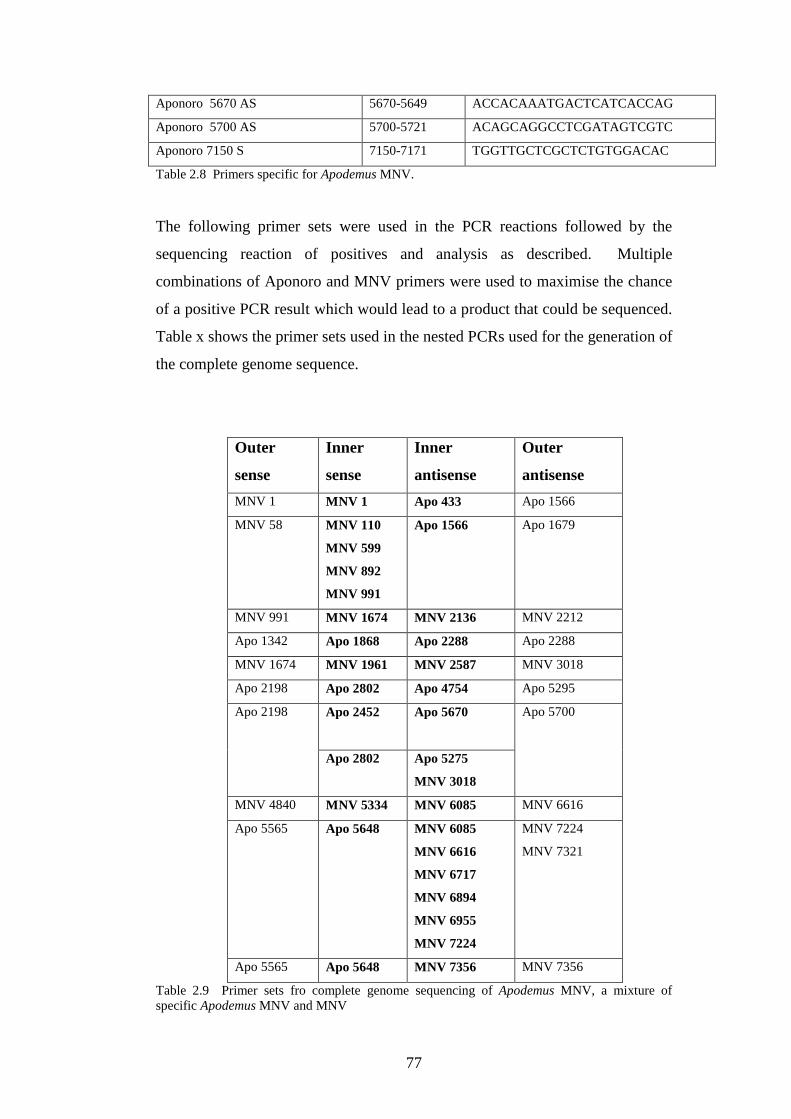
77
Aponoro 5670 AS 5670-5649 ACCACAAATGACTCATCACCAG
Aponoro 5700 AS 5700-5721 ACAGCAGGCCTCGATAGTCGTC
Aponoro 7150 S 7150-7171 TGGTTGCTCGCTCTGTGGACAC
Table 2.8 Primers specific for Apodemus MNV.
The following primer sets were used in the PCR reactions followed by the
sequencing reaction of positives and analysis as described. Multiple
combinations of Aponoro and MNV primers were used to maximise the chance
of a positive PCR result which would lead to a product that could be sequenced.
Table x shows the primer sets used in the nested PCRs used for the generation of
the complete genome sequence.
Outer
sense
Inner
sense
Inner
antisense
Outer
antisense
MNV 1 MNV 1 Apo 433 Apo 1566
MNV 58 MNV 110
MNV 599
MNV 892
MNV 991
Apo 1566 Apo 1679
MNV 991 MNV 1674 MNV 2136 MNV 2212
Apo 1342 Apo 1868 Apo 2288 Apo 2288
MNV 1674 MNV 1961 MNV 2587 MNV 3018
Apo 2198 Apo 2802 Apo 4754 Apo 5295
Apo 2452
Apo 5670
Apo 2198
Apo 2802 Apo 5275
MNV 3018
Apo 5700
MNV 4840 MNV 5334 MNV 6085 MNV 6616
Apo 5565 Apo 5648 MNV 6085
MNV 6616
MNV 6717
MNV 6894
MNV 6955
MNV 7224
MNV 7224
MNV 7321
Apo 5565 Apo 5648 MNV 7356 MNV 7356
Table 2.9 Primer sets fro complete genome sequencing of Apodemus MNV, a mixture of specific Apodemus MNV and MNV
78
2.4 Phylogenetic analysis
Phylogenetic trees are a graphic representation of evolutionary relationships
between genetic sequences within or between species. Phylogenetic trees were
constructed from novel and previously published MNV sequences by neighbour
joining using the Jukes-Cantor model with pair-wise deletion for missing
nucleotides in Mega 4 (Mega 4.0.1, Tamura, Dudley, Nei, and Kumar 2007).
Pairwise distances were also calculated by Mega 4.
2.5 Prediction of folding free energy and RNA structure prediction
RNA secondary structure prediction along the length of the genome was carried
out on 4 complete MNV genomes from laboratory mice, one full length genome
from the pet shop mouse and the full length genome of the wood mouse MNV.
The degree of secondary structure along the genome was also predicted for
MNV1-4 taken from GenBank. Folding free energy calculations were made
using UNAFold (http://dinamelt.bioinfo.rpi.edu/refs.php; Markham, N. R. &
Zuker, M. (2008)). Minimum free energy differences (MFED) were calculated
by comparing the MFE of the native sequence to 50 randomised control
sequences retaining the same nucleotide composition. This determines the
degree of secondary structure dependent on sequence order. The sequence
randomisation algorithm used was NDR which preserves dinucleotide
frequencies. The genome was divided in fragments of 300 bases, starting at
position 58, spaced at intervals of 9 bases. This created 776 overlapping
fragments for which the MFEDs were calculated in both the sense and antisense
directions. Sequence randomisations were carried out using internal functions
of the SIMMONIC editor package v 1.7.
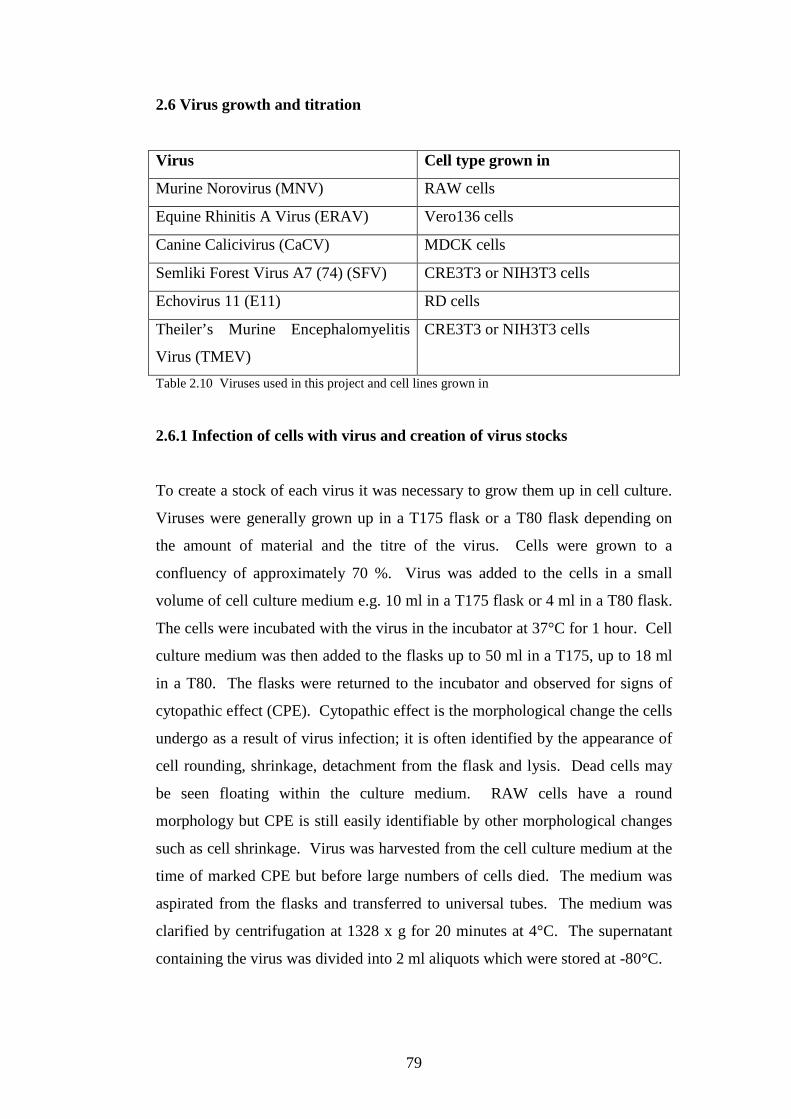
79
2.6 Virus growth and titration
Virus Cell type grown in
Murine Norovirus (MNV) RAW cells
Equine Rhinitis A Virus (ERAV) Vero136 cells
Canine Calicivirus (CaCV) MDCK cells
Semliki Forest Virus A7 (74) (SFV) CRE3T3 or NIH3T3 cells
Echovirus 11 (E11) RD cells
Theiler’s Murine Encephalomyelitis
Virus (TMEV)
CRE3T3 or NIH3T3 cells
Table 2.10 Viruses used in this project and cell lines grown in
2.6.1 Infection of cells with virus and creation of virus stocks
To create a stock of each virus it was necessary to grow them up in cell culture.
Viruses were generally grown up in a T175 flask or a T80 flask depending on
the amount of material and the titre of the virus. Cells were grown to a
confluency of approximately 70 %. Virus was added to the cells in a small
volume of cell culture medium e.g. 10 ml in a T175 flask or 4 ml in a T80 flask.
The cells were incubated with the virus in the incubator at 37°C for 1 hour. Cell
culture medium was then added to the flasks up to 50 ml in a T175, up to 18 ml
in a T80. The flasks were returned to the incubator and observed for signs of
cytopathic effect (CPE). Cytopathic effect is the morphological change the cells
undergo as a result of virus infection; it is often identified by the appearance of
cell rounding, shrinkage, detachment from the flask and lysis. Dead cells may
be seen floating within the culture medium. RAW cells have a round
morphology but CPE is still easily identifiable by other morphological changes
such as cell shrinkage. Virus was harvested from the cell culture medium at the
time of marked CPE but before large numbers of cells died. The medium was
aspirated from the flasks and transferred to universal tubes. The medium was
clarified by centrifugation at 1328 x g for 20 minutes at 4°C. The supernatant
containing the virus was divided into 2 ml aliquots which were stored at -80°C.
80
2.6.2 Titration of viruses
Viruses were titrated by using an endpoint method. A 96-well plate (Nunc) was
prepared with 5 x 10⁵ cells per well in a volume of 200 µl with all cell types
except for RAW cells which were seeded at 1 x 10⁶ cells per well. Plates were
left overnight to allow cells to adhere to the wells. Eight serial 10-fold dilutions
of each virus were made by adding 300 µl of each dilution to 2.7 ml of 2 % FCS
cell culture medium. The medium was aspirated from the plate and 200 µl of
each dilution was added to an entire row of the plate resulting in each of the
eight dilutions being added to twelve wells. Plates were incubated at 37°C for
1-2 days and monitored for CPE and/or cell death. Tissue culture infective dose
50 (TCID50) was calculated using the Reed-Muench method (Reed and Muench,
1932; as described in Fundamental Virology, Ed. D. Knipe and P. Howley;
Chapter 1, A. Levine). The number of infected and uninfected wells were
counted and recorded. A cumulative total of infected wells from the highest
dilution to the lowest was created, as was a cumulative total of uninfected wells
from the lowest dilution to the highest. A ratio was calculated to determine
percentage of infected wells for each dilution. The dilution at which 50 % of
the wells would be infected was then estimated by using the following equation:
ancedistateproportionbelowpositiveabovepositive
abovepositive =−
−%)50(%%)50(%
%50%)50(%
The result of the equation gives the proportionate distance between the two
dilutions that gave a percentage infection either side of 50 %. The distance
between the dilutions is calculated by using the following equation:
(log dilution above 50%) + (proportionate distance x log dilution factor) = log
TCID50
The reciprocal of the TCID50 is used to express the virus titre as TCID50 / unit
volume. TCID50 / 200 µl was then converted into TCID50 / ml.
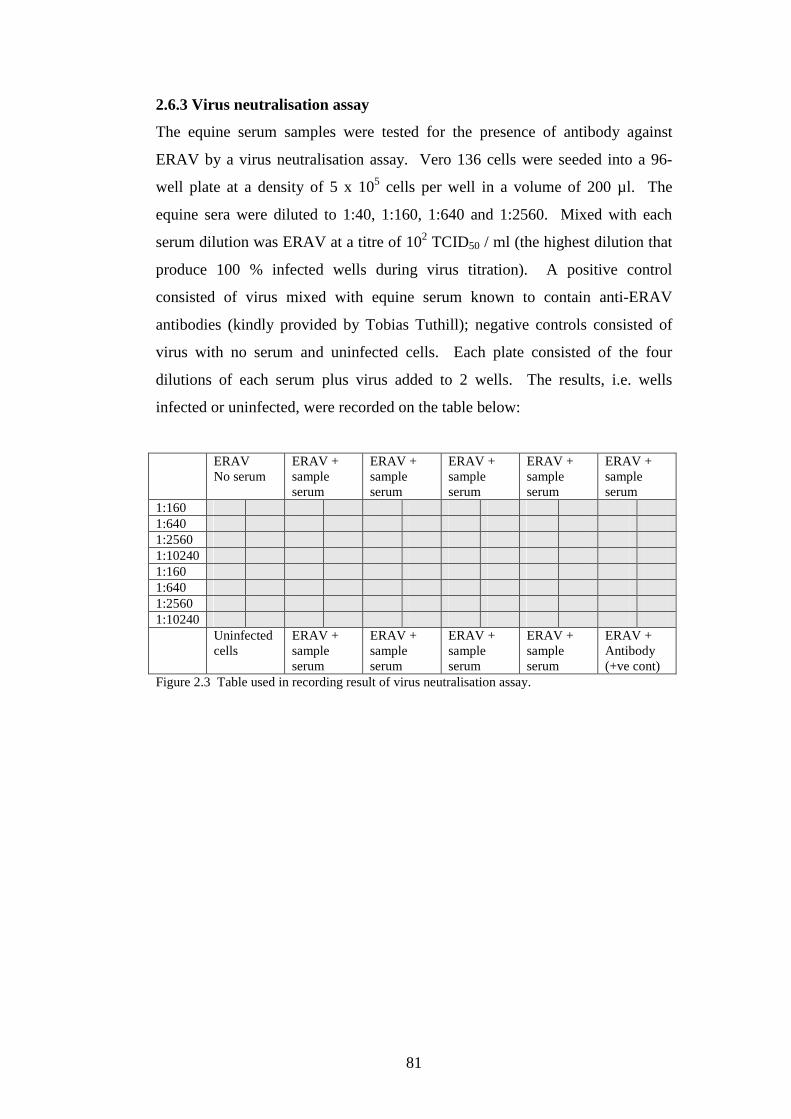
81
2.6.3 Virus neutralisation assay
The equine serum samples were tested for the presence of antibody against
ERAV by a virus neutralisation assay. Vero 136 cells were seeded into a 96-
well plate at a density of 5 x 10⁵ cells per well in a volume of 200 µl. The
equine sera were diluted to 1:40, 1:160, 1:640 and 1:2560. Mixed with each
serum dilution was ERAV at a titre of 102 TCID50 / ml (the highest dilution that
produce 100 % infected wells during virus titration). A positive control
consisted of virus mixed with equine serum known to contain anti-ERAV
antibodies (kindly provided by Tobias Tuthill); negative controls consisted of
virus with no serum and uninfected cells. Each plate consisted of the four
dilutions of each serum plus virus added to 2 wells. The results, i.e. wells
infected or uninfected, were recorded on the table below:
ERAV No serum
ERAV + sample serum
ERAV + sample serum
ERAV + sample serum
ERAV + sample serum
ERAV + sample serum
1:160 1:640 1:2560 1:10240 1:160 1:640 1:2560 1:10240 Uninfected
cells ERAV + sample serum
ERAV + sample serum
ERAV + sample serum
ERAV + sample serum
ERAV + Antibody (+ve cont)
Figure 2.3 Table used in recording result of virus neutralisation assay.
82
2.6.4 MNV passage
In order to assess the effect of multiple passage of MNV3 on its genome a
system was established to serially passage the virus at high and low
multiplicities of infection. RAW cells were seeded in a 12-well plate (Nunc).
Wells for the first passage were seeded at 5 x 10⁵ cells per well for infection the
following day; wells for the second passage were seeded at 3 x 10⁵ cells per well
for infection after 3 days. MNV virus stock was used; at high multiplicity of
infection (moi) 400 µl of virus stock was added to the cells, at low moi 40 µl of
virus were added to 360 µl of medium before being added to the cells, and mock
cells had 400 µl of cell culture medium alone added. The virus was incubated
with the cells for 1 hour then was removed and 1.5 ml of 2 % FCS medium was
added. After 2 days the 400 µl of medium from the high moi infection and 40
µl of medium from the low moi infected cells were taken and the previously
prepared wells infected in the same way. The remainder of the medium from
the each passage was stored at -80°C. MNV3 was passaged thirty-three times.
Passages 10, 20 and 33 were sequenced at the 2 parts of the genome used
previously for phylogenetic analysis. The complete genome of passage 33 was
sequenced.
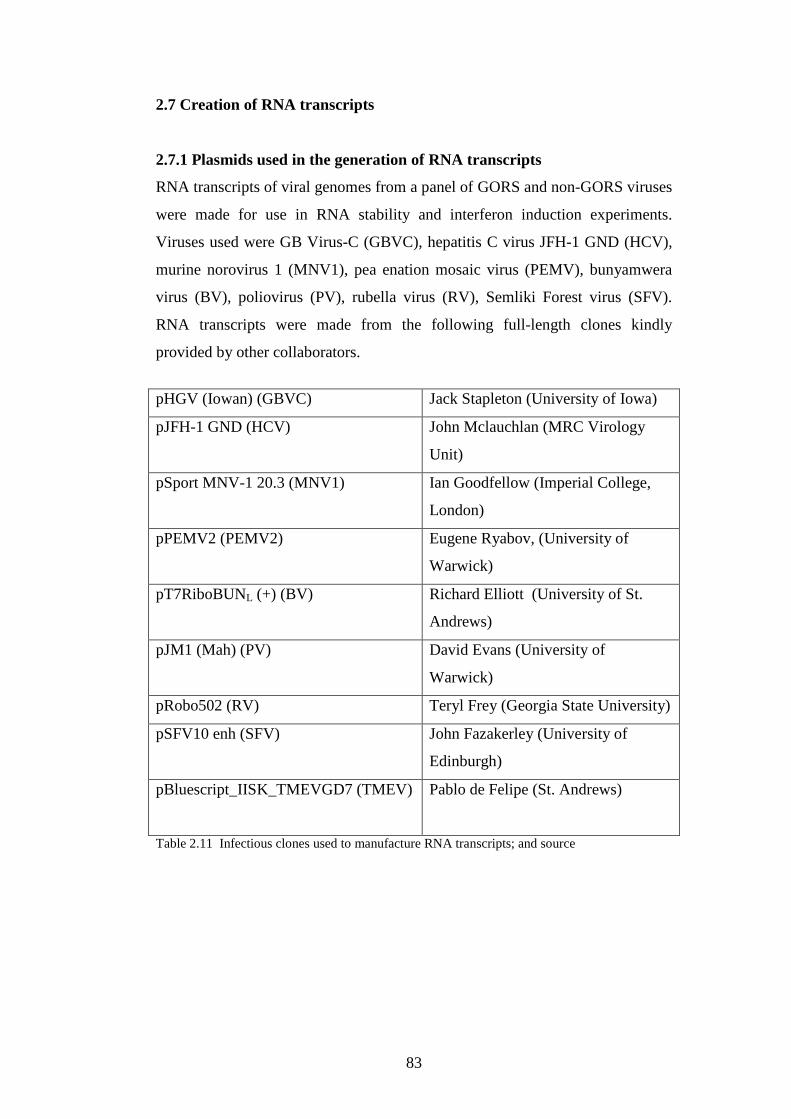
83
2.7 Creation of RNA transcripts
2.7.1 Plasmids used in the generation of RNA transcripts
RNA transcripts of viral genomes from a panel of GORS and non-GORS viruses
were made for use in RNA stability and interferon induction experiments.
Viruses used were GB Virus-C (GBVC), hepatitis C virus JFH-1 GND (HCV),
murine norovirus 1 (MNV1), pea enation mosaic virus (PEMV), bunyamwera
virus (BV), poliovirus (PV), rubella virus (RV), Semliki Forest virus (SFV).
RNA transcripts were made from the following full-length clones kindly
provided by other collaborators.
pHGV (Iowan) (GBVC) Jack Stapleton (University of Iowa)
pJFH-1 GND (HCV) John Mclauchlan (MRC Virology
Unit)
pSport MNV-1 20.3 (MNV1) Ian Goodfellow (Imperial College,
London)
pPEMV2 (PEMV2)
Eugene Ryabov, (University of
Warwick)
pT7RiboBUNL (+) (BV) Richard Elliott (University of St.
Andrews)
pJM1 (Mah) (PV) David Evans (University of
Warwick)
pRobo502 (RV) Teryl Frey (Georgia State University)
pSFV10 enh (SFV) John Fazakerley (University of
Edinburgh)
pBluescript_IISK_TMEVGD7 (TMEV)
Pablo de Felipe (St. Andrews)
Table 2.11 Infectious clones used to manufacture RNA transcripts; and source
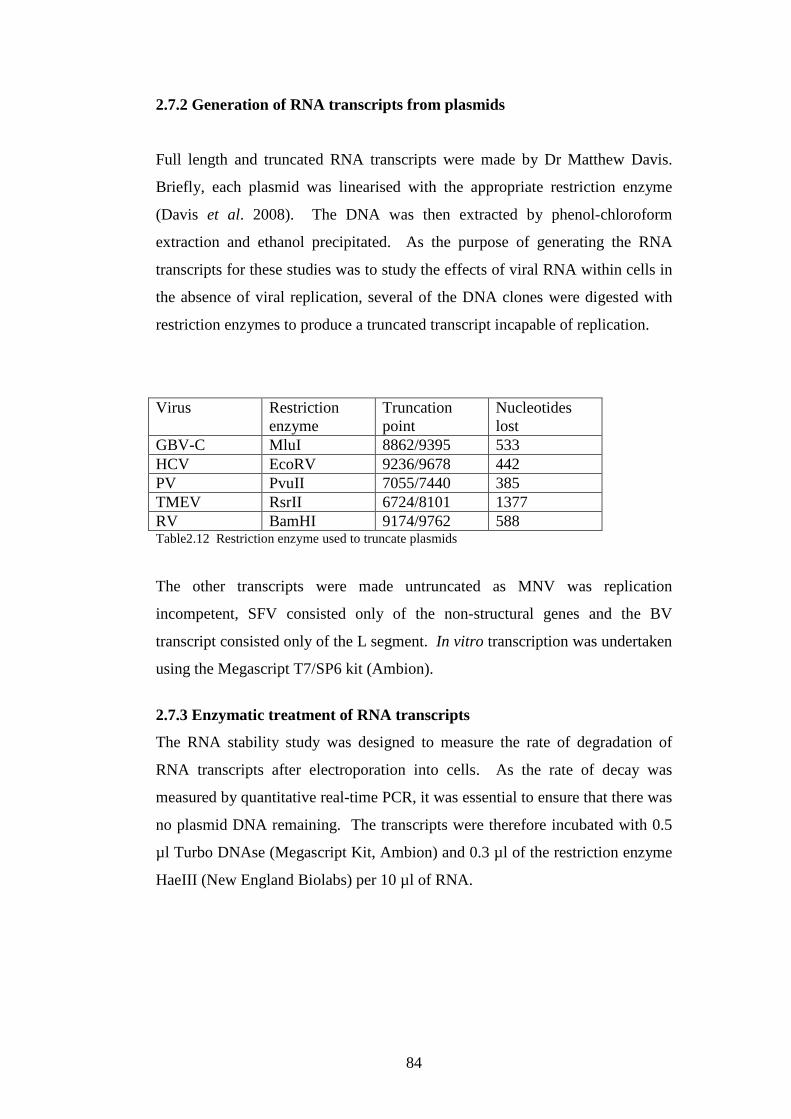
84
2.7.2 Generation of RNA transcripts from plasmids
Full length and truncated RNA transcripts were made by Dr Matthew Davis.
Briefly, each plasmid was linearised with the appropriate restriction enzyme
(Davis et al. 2008). The DNA was then extracted by phenol-chloroform
extraction and ethanol precipitated. As the purpose of generating the RNA
transcripts for these studies was to study the effects of viral RNA within cells in
the absence of viral replication, several of the DNA clones were digested with
restriction enzymes to produce a truncated transcript incapable of replication.
Virus Restriction enzyme
Truncation point
Nucleotides lost
GBV-C MluI 8862/9395 533 HCV EcoRV 9236/9678 442 PV PvuII 7055/7440 385 TMEV RsrII 6724/8101 1377 RV BamHI 9174/9762 588 Table2.12 Restriction enzyme used to truncate plasmids
The other transcripts were made untruncated as MNV was replication
incompetent, SFV consisted only of the non-structural genes and the BV
transcript consisted only of the L segment. In vitro transcription was undertaken
using the Megascript T7/SP6 kit (Ambion).
2.7.3 Enzymatic treatment of RNA transcripts
The RNA stability study was designed to measure the rate of degradation of
RNA transcripts after electroporation into cells. As the rate of decay was
measured by quantitative real-time PCR, it was essential to ensure that there was
no plasmid DNA remaining. The transcripts were therefore incubated with 0.5
µl Turbo DNAse (Megascript Kit, Ambion) and 0.3 µl of the restriction enzyme
HaeIII (New England Biolabs) per 10 µl of RNA.
85
2.8 RNA stability study
2.8.1 Electroporation of cells
Two large flasks (T175) of NIH3T3 cells were grown to near confluence. The
cells were trypsinised and resuspended in 10 ml of cell culture medium; the cells
were then counted. The cells were centrifuged at 544 x g for 5 minutes. The
cell pellet was resuspended in 10 ml chilled PBS. The cells were washed in
diethylpyrocarbonate (DEPC)-treated PBS and spun a further two times. After
the last spin, the cell pellet was resuspended at a concentration of 2 x 10⁷ cells /
ml in 400 µl per electroporation. Then 400 µl cells were transferred to a bijou
tube (Sterilin) and chilled on ice for 5 minutes. Five micrograms of each RNA
transcript GBVC, HCV, MNV, BV, PV and TMEV, were added to each bijou,
mixed, and then transferred to a chilled electroporation cuvette (Bio-Rad). The
cells were electroporated by using the following settings on a Gene Pulser Xcell
(Bio-Rad) eletroporator on the pre-set Mammalian 3 setting: pulse type –
exponential decay; capacitance - 500 µF; PC - ∞ Ω; voltage – 160 V; cuvette –
0.4 cm; cell volume – 100 µl. Cells were then transferred to a 12 well plate at 2
x 105 cell per well. Cells were collected at 4 hours (h), 24 h, 48 h, 72 h and 96
h. The cells were washed with PBS before being trypsinised with 100 µl of
trypsin to remove the cells. The cells were spun at 478 x g for 5 minutes, the
supernatant discarded and the cell pellets frozen at -80°C.
2.8.2 Extraction of total cellular RNA
Total cellular RNA was extracted using the RNEasy Mini Kit (Qiagen). Briefly,
before starting 2-mercaptoethanol (2-ME) (Sigma) was added to Buffer RLT at
a ratio of 10 µl 2-ME in 1 ml RLT to denature cellular RNases. The cell pellets
were defrosted at room temperature then disrupted by the adding of 350 µl of
Buffer RLT and mixing by pipetting. The disrupted cells were transferred into a
QIAShredder (Qiagen) and centrifuged at full speed for 2 minutes. The volume
of the lysate was measured and the same volume of 70 % ethanol (VWR) was
mixed with it. This was transferred to the RNEasy spin column and either the
spin protocol or vacuum protocol followed. In both cases the lysate was passed
through the column, the column was then washed with 700 µl Buffer RW1 and
86
two washes with 500 µl of Buffer RPE. The column membrane was then dried
by centrifugation at 8000 x g for 2 minutes. The RNA was eluted in 40 µl of
RNase free water by centrifugation at 8000 x g for 1 minute. RNAs were stored
at -80°C. Reverse transcription was carried as described previously.
2.8.3 Quantitative real-time PCR
Quantitative real-time PCR is a technique very similar to standard PCR in which
specific regions of DNA are amplified by the annealing of specific primers to
sense and antisense strands of DNA followed by extension by Taq polymerase
so that a specific product is generated. In order to visualise the generation of
product the dye SYBR Green is used which binds to double stranded DNA and
fluoresces brightly at λ = 522 nm. The real-time machine (Corbett Research) is
able to detect the level of fluorescence at each cycle of the PCR reaction which
is recorded by computer software. The software plots a graph of fluorescence
against cycle number. Analysis of data after the run has finished enables the
user to determine the cycle number at which production of specific product has
become exponential by crossing a threshold, giving a Ct value. In order to
quantify DNA concentrations in samples, standard curves are made consisting of
serial dilutions against which sample concentrations can be calculated.
The following reaction mix was assembled including a reaction buffer (Roche)
(containing 500 mM Tris/HCl, 100 mM KCl, 50 mM (NH4)2SO4, 20 mM
MgCl2, pH 8.3), 3 mM dNTP, primers 10 OD, FastStart Taq DNA polymerase
(Roche) and SYBR Green I (Invitrogen) diluted 1:1000 in DMSO (Sigma).
Nuclease free water - 14 µl
Buffer, 10x conc with 20 mM MgCl2 - 2 µl
dNTP, 3 mM - 0.4 µl
Sense primer, 10 OD - 0.2 µl
Antisense primer, 10 OD - 0.2 µl
SYBR Green - 1 µl
FastStart Taq DNA Polymerase - 0.2 µl
Template - 2 µl
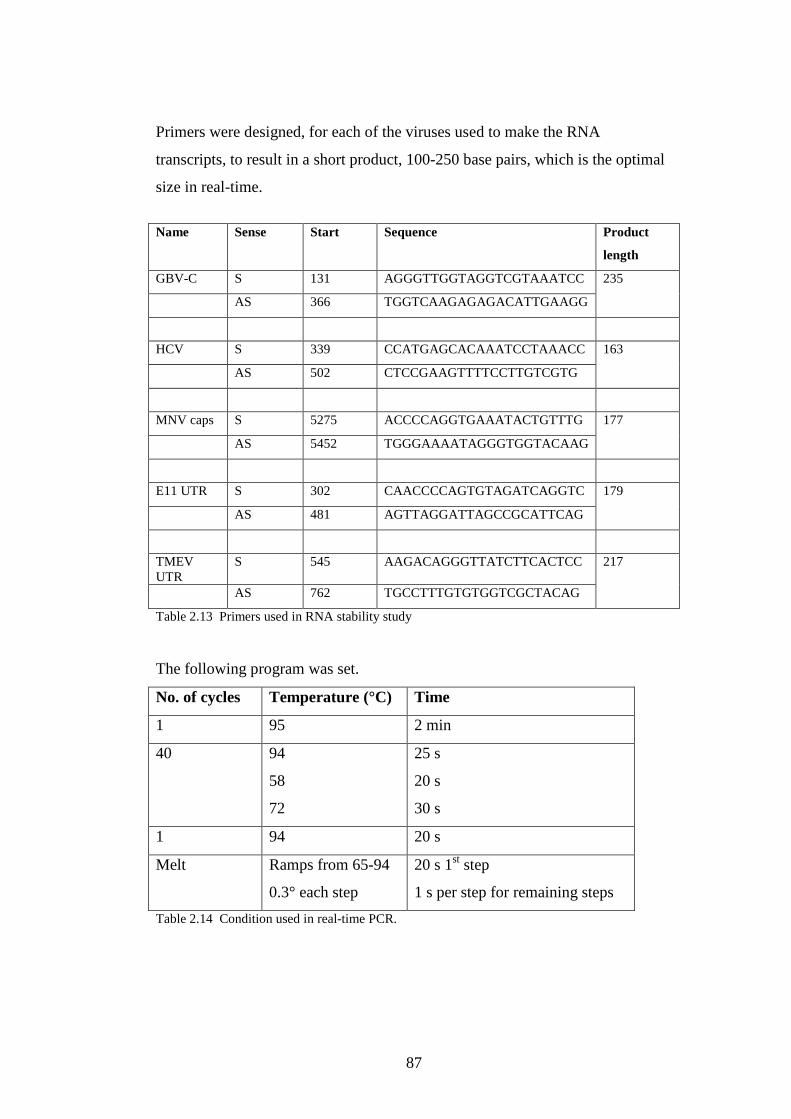
87
Primers were designed, for each of the viruses used to make the RNA
transcripts, to result in a short product, 100-250 base pairs, which is the optimal
size in real-time.
Name Sense Start Sequence Product
length
GBV-C S 131 AGGGTTGGTAGGTCGTAAATCC
AS 366 TGGTCAAGAGAGACATTGAAGG
235
HCV S 339 CCATGAGCACAAATCCTAAACC
AS 502 CTCCGAAGTTTTCCTTGTCGTG
163
MNV caps S 5275 ACCCCAGGTGAAATACTGTTTG
AS 5452 TGGGAAAATAGGGTGGTACAAG
177
E11 UTR S 302 CAACCCCAGTGTAGATCAGGTC
AS 481 AGTTAGGATTAGCCGCATTCAG
179
TMEV UTR
S 545 AAGACAGGGTTATCTTCACTCC
AS 762 TGCCTTTGTGTGGTCGCTACAG
217
Table 2.13 Primers used in RNA stability study
The following program was set.
No. of cycles Temperature (°C) Time
1 95 2 min
40 94
58
72
25 s
20 s
30 s
1 94 20 s
Melt Ramps from 65-94
0.3° each step
20 s 1st step
1 s per step for remaining steps
Table 2.14 Condition used in real-time PCR.
88
2.8.4 Creation of standard curves for stability study
Each of the transcripts used in the study was normalised to 1 µg / µl which was
designated as concentration 100. Serial ten-fold dilutions in 0.25 µg / ml DNA
from herring testes (Sigma) were then made from 10-1 – 10-9. These RNAs then
underwent reverse transcription, 5 µl RNA in 20µl reaction volume under
previously described conditions. Standard curves were created by running each
dilution in duplicate on the real-time PCR machine which also established the
limit of detection. During experiments standards were run alongside sample
cDNAs. As the sample total cellular RNAs had been treated in an identical way
it was possible to determine the concentration of each viral RNA transcript
present at each time-point.
2.9 Four kilobase transcripts
2.9.1 Creation of 4 kb RNA transcripts
The interferon induction study consisted of transfecting RNA transcripts into
cells and measuring induction of interferon beta (IFN-β) by quantitative real-
time PCR indicating the level of IFN-β mRNA present in the cell. These
experiments were carried out using the long (full length or truncated) transcripts
made by Dr Matthew Davis as previously described, and 4 kilobase (kb)
transcripts. These 4 kb transcripts were made to establish that any differing
ability of GORS and non-GORS viruses was due to their tendency to form
secondary structure alone, and not as a consequence of transcript length or of
proteins translated from the RNAs after transfection. The long transcripts were
of differing lengths and some of them contained IRES’s within their 5’ UTRs:
GBVC, HCV, PV, and TMEV. The 4 kb transcripts were made by designing
primers to amplify a region of the genome beyond the 5’ UTR of those viruses
containing one. The viruses not containing a UTR included were MNV, BV,
SFV and PEMV2. The sense primers contained the T7 promoter sequence at the
5’ end to enable transcription of the PCR product into RNA.
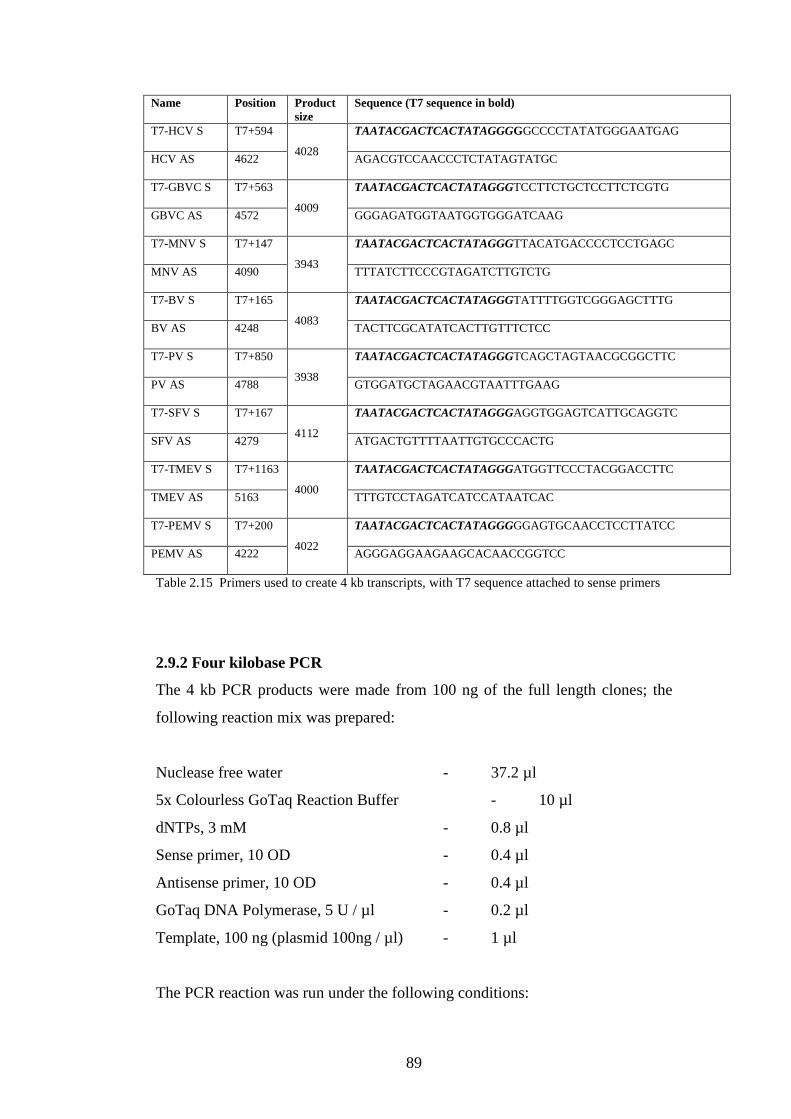
89
Name Position Product size
Sequence (T7 sequence in bold)
T7-HCV S T7+594 TAATACGACTCACTATAGGGGGCCCCTATATGGGAATGAG
HCV AS 4622 4028
AGACGTCCAACCCTCTATAGTATGC
T7-GBVC S T7+563 TAATACGACTCACTATAGGGTCCTTCTGCTCCTTCTCGTG
GBVC AS 4572 4009
GGGAGATGGTAATGGTGGGATCAAG
T7-MNV S T7+147 TAATACGACTCACTATAGGGTTACATGACCCCTCCTGAGC
MNV AS 4090 3943
TTTATCTTCCCGTAGATCTTGTCTG
T7-BV S T7+165 TAATACGACTCACTATAGGGTATTTTGGTCGGGAGCTTTG
BV AS 4248 4083
TACTTCGCATATCACTTGTTTCTCC
T7-PV S T7+850 TAATACGACTCACTATAGGGTCAGCTAGTAACGCGGCTTC
PV AS 4788 3938
GTGGATGCTAGAACGTAATTTGAAG
T7-SFV S T7+167 TAATACGACTCACTATAGGGAGGTGGAGTCATTGCAGGTC
SFV AS 4279 4112
ATGACTGTTTTAATTGTGCCCACTG
T7-TMEV S T7+1163 TAATACGACTCACTATAGGGATGGTTCCCTACGGACCTTC
TMEV AS 5163 4000
TTTGTCCTAGATCATCCATAATCAC
T7-PEMV S T7+200 TAATACGACTCACTATAGGGGGAGTGCAACCTCCTTATCC
PEMV AS 4222 4022
AGGGAGGAAGAAGCACAACCGGTCC
Table 2.15 Primers used to create 4 kb transcripts, with T7 sequence attached to sense primers
2.9.2 Four kilobase PCR
The 4 kb PCR products were made from 100 ng of the full length clones; the
following reaction mix was prepared:
Nuclease free water - 37.2 µl
5x Colourless GoTaq Reaction Buffer - 10 µl
dNTPs, 3 mM - 0.8 µl
Sense primer, 10 OD - 0.4 µl
Antisense primer, 10 OD - 0.4 µl
GoTaq DNA Polymerase, 5 U / µl - 0.2 µl
Template, 100 ng (plasmid 100ng / µl) - 1 µl
The PCR reaction was run under the following conditions:
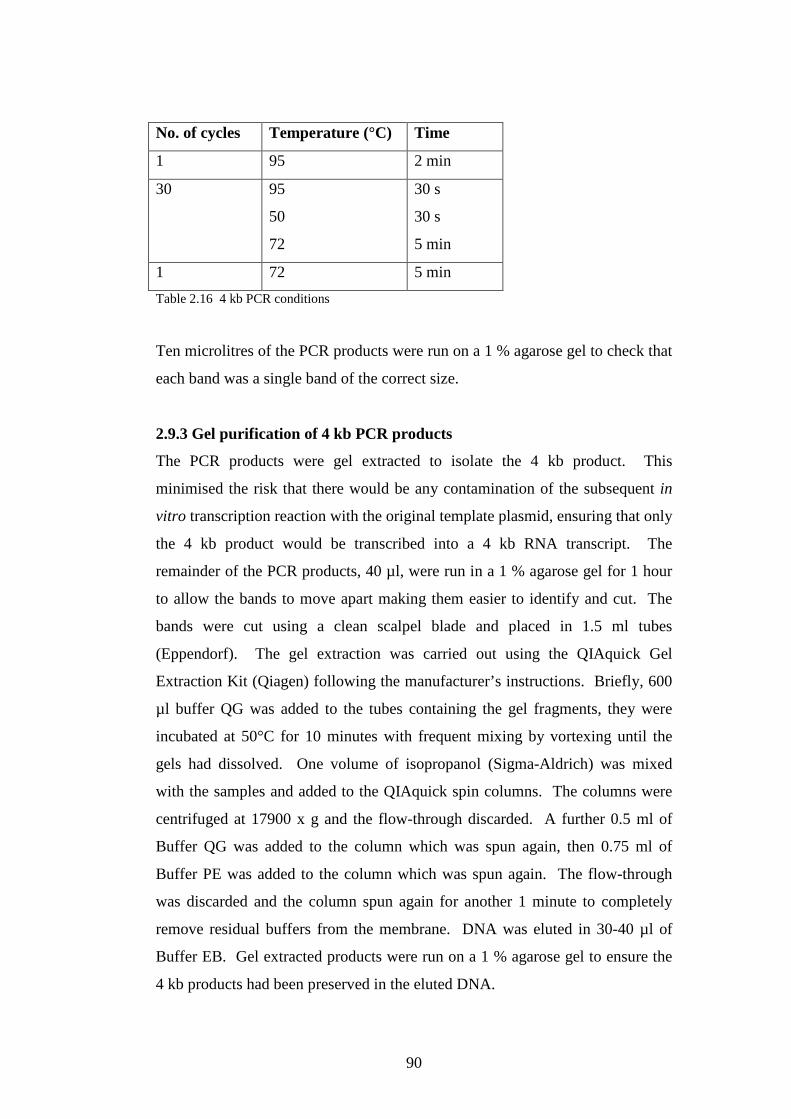
90
No. of cycles Temperature (°C) Time
1 95 2 min
30 95
50
72
30 s
30 s
5 min
1 72 5 min
Table 2.16 4 kb PCR conditions
Ten microlitres of the PCR products were run on a 1 % agarose gel to check that
each band was a single band of the correct size.
2.9.3 Gel purification of 4 kb PCR products
The PCR products were gel extracted to isolate the 4 kb product. This
minimised the risk that there would be any contamination of the subsequent in
vitro transcription reaction with the original template plasmid, ensuring that only
the 4 kb product would be transcribed into a 4 kb RNA transcript. The
remainder of the PCR products, 40 µl, were run in a 1 % agarose gel for 1 hour
to allow the bands to move apart making them easier to identify and cut. The
bands were cut using a clean scalpel blade and placed in 1.5 ml tubes
(Eppendorf). The gel extraction was carried out using the QIAquick Gel
Extraction Kit (Qiagen) following the manufacturer’s instructions. Briefly, 600
µl buffer QG was added to the tubes containing the gel fragments, they were
incubated at 50°C for 10 minutes with frequent mixing by vortexing until the
gels had dissolved. One volume of isopropanol (Sigma-Aldrich) was mixed
with the samples and added to the QIAquick spin columns. The columns were
centrifuged at 17900 x g and the flow-through discarded. A further 0.5 ml of
Buffer QG was added to the column which was spun again, then 0.75 ml of
Buffer PE was added to the column which was spun again. The flow-through
was discarded and the column spun again for another 1 minute to completely
remove residual buffers from the membrane. DNA was eluted in 30-40 µl of
Buffer EB. Gel extracted products were run on a 1 % agarose gel to ensure the
4 kb products had been preserved in the eluted DNA.
91
2.9.4 Second PCR and PCR purification
The gel extracted 4 kb PCR products were then used as the template for a
second round of PCR using the same sets of primers under the same conditions
to increase the yield. The PCR product was run on a 1 % agarose gel. In order
to create a clean product to be used in the in vitro transcription reaction the PCR
product was purified by using the QIAquick PCR Purification Kit (Qiagen)
following the manufacturer’s protocol. Briefly, 5 volumes of Buffer PB were
added to the PCR samples and mixed and transferred to the QIAquick columns.
The columns were centrifuged at 17900 x g for 1 minute and the flow-through
discarded. The column was washed by adding 0.75 ml of Buffer PE and
centrifuged for 1 minute; the column was centrifuged for a further minute to
remove any residual buffers. The DNA was eluted in 30-50 µl of Buffer EB.
The eluted DNA was run on a 1 % agarose gel.
2.9.5 DNA Precipitation
In order to concentrate the DNA further it was precipitated in ethanol. Two
volumes of ethanol, 0.1 x volumes of 5M sodium chloride (NaCl) and 1 µl of 20
mg /ml glycogen (Roche) were added to the DNA. The DNA was precipitated
on ice on 30 minutes then centrifuged at full speed on a bench top centrifuge at
4°C for 30 minutes. The supernatant was removed and 500 µl of 70 % ethanol
added to the tube containing the pellet. The tube was centrifuged at full speed
for 15 minutes at 4°C. The supernatant was removed and the pellet air dried at
room temperature for 5 minutes. The DNA was resuspended in 12 µl nuclease
free water.
2.9.6 Determination of nucleic acid concentration
Concentration of DNA or RNA was determined by using the NanoDrop 1000
Spectrophotometer (Thermo Fisher Scientific). Absorbance measured at 260
nm was used to calculate DNA / RNA concentration expressed in ng / µl.
92
2.9.7 In vitro transcription
In vitro transcription was carried out using the Megascript T7 kit (Ambion)
following the manufacturer’s protocol. Briefly, a 20 µl reaction was assembled
consisting of 2 µl of each of the 4 nucleotides solutions (ATP, CTP, GTP, UTP),
2 µl 10x Reaction Buffer and 2 µl of Enzyme Mix. A mass of 500 – 800 ng of
the purified PCR product containing the T7 promoter sequence was added in a
volume of 8 µl of nuclease free water. The reaction was incubated for 5 hours
or overnight at 37°C. After the incubation 1 µl of TURBO DNAse was added to
the reaction mix and incubated at 37°C for 15 minutes to remove template DNA.
2.9.8 RNA Cleanup
The RNA was cleaned up using the RNEasy Mini Kit (Qiagen) following the
manufacturer’s RNA Cleanup protocol. Briefly, the RNA solution was made up
to 100 µl with nuclease-free water; and 350 µl Buffer RLT added. To the RNA
was added 250 µl 100 % ethanol and mixed, the sample was then transferred to
the RNEasy Mini spin column. The column was centrifuged at 8000 x g for 15
seconds (s) and the flow-through discarded. The column was washed by adding
500 µl Buffer RPE and centrifuging for 15 s followed by a second wash and
centrifugation for 2 min. RNA was eluted in 40 µl nuclease free water. RNA
concentration was determined by spectroscopy.
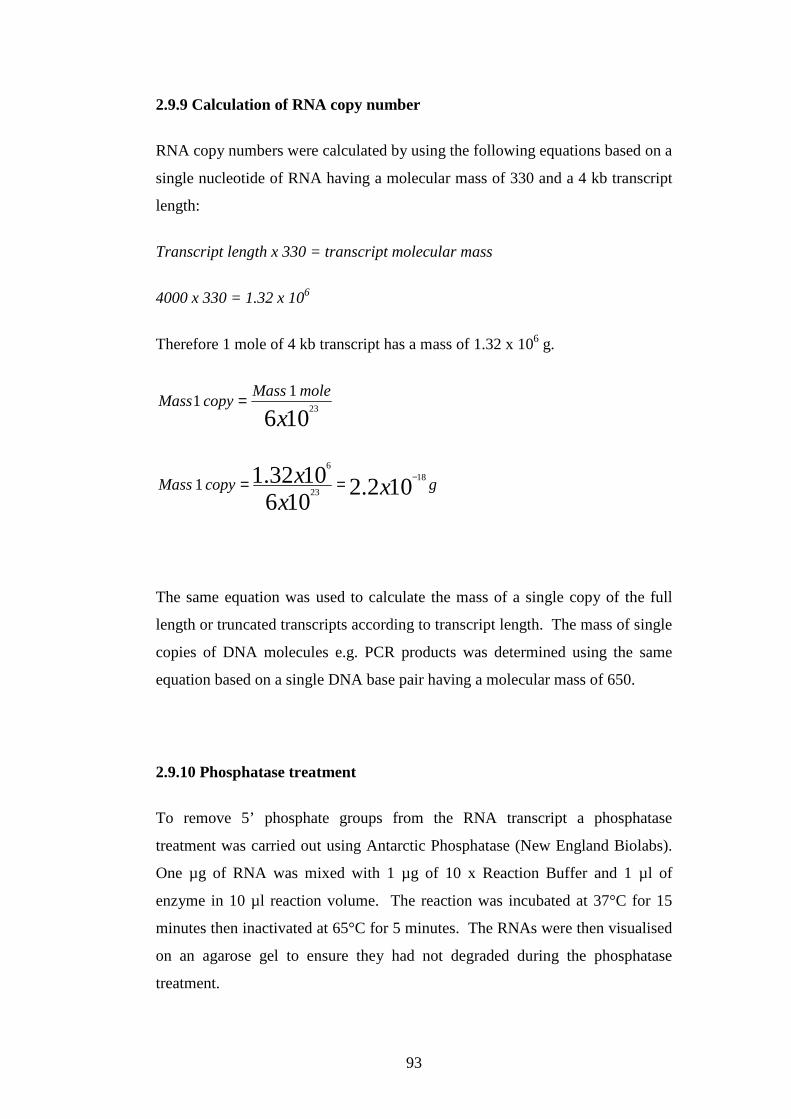
93
2.9.9 Calculation of RNA copy number
RNA copy numbers were calculated by using the following equations based on a
single nucleotide of RNA having a molecular mass of 330 and a 4 kb transcript
length:
Transcript length x 330 = transcript molecular mass
4000 x 330 = 1.32 x 10⁶
Therefore 1 mole of 4 kb transcript has a mass of 1.32 x 10⁶ g.
10623
11
xmoleMass
copyMass =
gcopyMass xx
x 102.2106
1032.1 18
23
6
1−==
The same equation was used to calculate the mass of a single copy of the full
length or truncated transcripts according to transcript length. The mass of single
copies of DNA molecules e.g. PCR products was determined using the same
equation based on a single DNA base pair having a molecular mass of 650.
2.9.10 Phosphatase treatment
To remove 5’ phosphate groups from the RNA transcript a phosphatase
treatment was carried out using Antarctic Phosphatase (New England Biolabs).
One µg of RNA was mixed with 1 µg of 10 x Reaction Buffer and 1 µl of
enzyme in 10 µl reaction volume. The reaction was incubated at 37°C for 15
minutes then inactivated at 65°C for 5 minutes. The RNAs were then visualised
on an agarose gel to ensure they had not degraded during the phosphatase
treatment.
94
2.10 Interferon induction study
2.10.1 Transfection of RNA transcripts
Twelve well plates were prepared with NIH3T3 cells and A549n cells at a
seeding density of 1 x 10⁵ cells per well. The RNA transcripts to be transfected
were diluted to the appropriate concentrations and kept on ice. Lipofectamine
2000 (Invitrogen) was added to GIBCO Opti-MEM (Invitrogen) at a ratio of 1-2
µl Lipofectamine 2000 mixed in 100 µl Opti-MEM per transfection. The RNA
transcripts were also diluted in 100 µl Opti-MEM per transfection and incubated
for 5 minutes. The RNA transcripts were mixed with the diluted Lipofectamine
2000 and incubated at room temperature for 20 minutes. During the incubation
the cell culture medium was removed from the cells and replaced with 0.5 ml of
2 % FCS medium. After the incubation 200 µl of the complexes were added to
the cells and the plates rocked gently by hand. The plates were returned to the
37°C incubator and incubated for 18 hours. At the end of incubation the cells
were removed, trypsinised and pelletted by centrifugation at 478 x g at room
temperature for 5 minutes. The cell pellets were stored at -20°C or -80°C. Total
cellular RNA was extracted using the RNEasy Minikit as previously described.
The RNA concentration was determined by spectrophotometry using the
NanoDrop 1000 as previously described. For each experiment the same mass of
RNA (500 ng – 1 µg) was used as a template for reverse transcription into
cDNA. Reverse transcription reaction conditions were the same as previously
described.
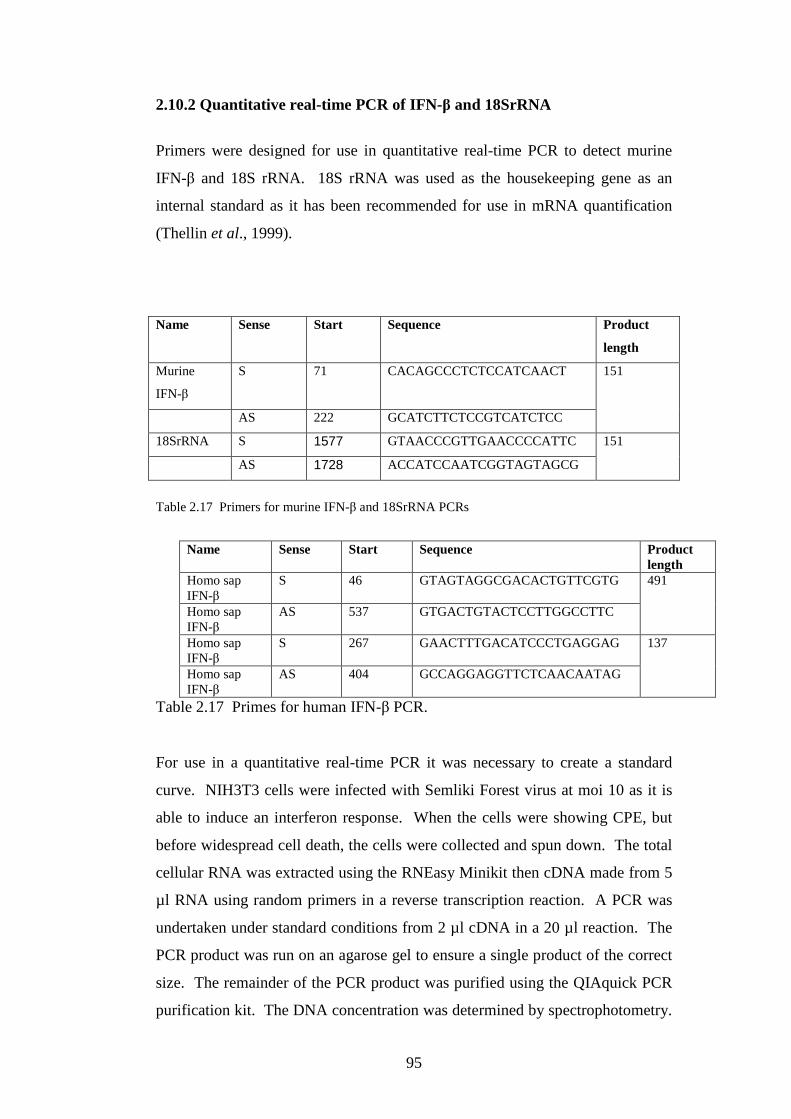
95
2.10.2 Quantitative real-time PCR of IFN-β and 18SrRNA
Primers were designed for use in quantitative real-time PCR to detect murine
IFN-β and 18S rRNA. 18S rRNA was used as the housekeeping gene as an
internal standard as it has been recommended for use in mRNA quantification
(Thellin et al., 1999).
Name Sense Start Sequence Product
length
Murine
IFN-β
S 71 CACAGCCCTCTCCATCAACT
AS 222 GCATCTTCTCCGTCATCTCC
151
18SrRNA S 1577 GTAACCCGTTGAACCCCATTC
AS 1728 ACCATCCAATCGGTAGTAGCG
151
Table 2.17 Primers for murine IFN-β and 18SrRNA PCRs
Name Sense Start Sequence Product length
Homo sap IFN-β
S 46 GTAGTAGGCGACACTGTTCGTG
Homo sap IFN-β
AS 537 GTGACTGTACTCCTTGGCCTTC
491
Homo sap IFN-β
S 267 GAACTTTGACATCCCTGAGGAG
Homo sap IFN-β
AS 404 GCCAGGAGGTTCTCAACAATAG
137
Table 2.17 Primes for human IFN-β PCR.
For use in a quantitative real-time PCR it was necessary to create a standard
curve. NIH3T3 cells were infected with Semliki Forest virus at moi 10 as it is
able to induce an interferon response. When the cells were showing CPE, but
before widespread cell death, the cells were collected and spun down. The total
cellular RNA was extracted using the RNEasy Minikit then cDNA made from 5
µl RNA using random primers in a reverse transcription reaction. A PCR was
undertaken under standard conditions from 2 µl cDNA in a 20 µl reaction. The
PCR product was run on an agarose gel to ensure a single product of the correct
size. The remainder of the PCR product was purified using the QIAquick PCR
purification kit. The DNA concentration was determined by spectrophotometry.
96
The copy number of each PCR product was then determined based on a DNA
base pair having a molecular mass of 650; IFN-β and 18S rRNA PCR product
lengths were both 151 bp.
PCR product length x 650 = molecular mass
151 x 330 = 9.815 x 10⁴
Therefore 1 mole of IFN-β PCR and 18SrRNA product have a mass of 9.815 x
104 g.
10623
11
xmoleMass
copyMass =
gcopyMass xx
x 1064.1106
1082.9 19
23
4
1−==
Therefore, 1 ng PCR product is equivalent to 6.1 x 10⁹ copies; 1 pg PCR product
is equivalent to 6.1 x 10⁶ copies. Samples for standard curves were made by
making serial ten-fold dilutions of these PCR products in 0.25 µg / ml herring
testis DNA. The real-time PCR reaction mix was made up as previously
described. The results were then expressed as IFN-β cDNA copy number per
1000 copies of 18S rRNA cDNA.
2.10.3 Luciferase reporter assay
NIH3T3 or A549 cells were seeded into 24 well plates, as for the IFN induction
experiments as described above, but the level of IFN induction was measured by
the expression using the Dual-Luciferase Reporter Assay System (Promega).
The luciferase plasmid were transfected by Lipofectamine 2000 (Invitrogen) as
described above; p125-Luc (firefly) at 100 ng per well; pRL-CMV (renilla) at 50
ng per well; 24 hours post-transfection of the luciferase plasmids, the RNA
transcripts were transfected as above. 18 hours post-transfection, the cells were
lysed with 100 µl passive lysis buffer per well; the lysates were analysed

97
immediately or the plates were frozen. Seventy microlitres of Luciferase Assay
Reagent II (LARII) predispensed into eppendorf tubes for each sample. Ten
microlitres of each lysate were added to the tubes and placed in the Glomax
20/20 luminometer (Promega), programmed for the dual-luciferase assay, and
the firefly activity measured. A further 70 µl of Stop & Glo Reagent was added
to the tubes and the renilla activity measured.
98
Chapter 3 Equine Rhinitis A Virus – prevalence
in Scottish horses
3.1 Introduction 3.2 Objectives 3.3 Results 3.4 Discussion
99
Chapter 3 Equine Rhinitis A Virus (ERAV)
3.1 Introduction
Equine rhinitis A virus (ERAV), a virus predicted to have a genome with
GORS, was the first virus chosen to study the possible roles of GORS. It is a
member of the Aphthovirus genus of the Picornaviridae family.
3.1.1 Picornaviridae
Picornaviruses are nonenveloped, single-stranded, positive sense RNA viruses.
The family Picornaviridae consists of the following 12 genera:
i) Enterovirus e.g. human enterovirus, human rhinovirus
ii Cardiovirus e.g. Theiler’s murine encephalomyelitis virus
iii) Aphthovirus e.g. foot-and-mouth disease virus, equine rhinitis virus
iv) Hepatovirus e.g. hepatitis A virus
v) Parechovirus e.g. human parechovirus
vi) Erbovirus e.g. equine rhinitis B virus
vii) Kobuvirus e.g. Aichi virus
viii) Teschovirus e.g. porcine teschovirus
ix) Sapelovirus e.g. porcine sapelovirus
x) Senecavirus e.g. Seneca Valley virus
xi) Tremovirus e.g. avian encephalomyelitis virus
xii) Avihepatovirus e.g. duck hepatitis A virus
100
3.1.1.1 Virion structure
Picornavirus particles are spherical, diameter of ~30 nm, consisting of a protein
capsid surrounding a naked RNA genome. Cardioviruses, enteroviruses,
hepatoviruses and parechoviruses are acid stable and retain infectivity at pH
lower than 3, whereas rhinoviruses and aphthoviruses are acid labile at less than
pH 6. Members of the latter two genera are usually found replicating in the
respiratory system so there is no requirement to be able to survive the acidic
conditions present in the stomach (Racaniello; Fundamental Virology, 4th
Edition, Edited by Knipe and Howley, Chapter 18, 529-567). The capsid
consists of four structural proteins: VP1, VP2, VP3 and VP4. These subunits
form an icosohedral structure consisting of 60 subunits (Caspar and Klug, 1962;
Rueckert et al., 1969). The building block of the capsid is the protomer
consisting of one copy each of proteins VP1-3; VP4 is an internal protein. The
surfaces of picornavirus capsid are variable; poliovirus and rhinovirus have
prominent plateaus and canyons, whereas aphthoviruses and cardioviruses are
smooth. These features determine which structures interact with a variety of
host cell receptors. The RNA genome is not thought to completely fill the space
within the capsid. Myristic acid is a residue linked to VP4 on the interior of the
virion and has a role in virus assembly and stability of the capsid (Chow et al.,
1987).
3.1.1.2 Genome structure
The picornavirus genome is a positive-sense, single-stranded RNA molecule so
may be directly translated by the cellular machinery. The 5’ end of the genome
is covalently linked to a protein, the VPg (virion protein, genome linked)
(Flanegan et al., 1977; Lee et al., 1977). The VPg of FMDV is encoded by
three genes, although it is encoded by a single gene in other picornaviruses
(Forss et al., 1982). At the 5’ untranslated regions (UTR) are long (100-170
nucleotides in aphthoviruses) and contain highly structured elements. The
internal ribosome entry site (IRES) allows translation to occur by binding to the
cell’s ribosome. There are four types of IRES, types I, II, III and IV.
Aphthoviruses and cardioviruses have a type II IRES immediately downstream
of a poly (C) tract. The IRES consists of a structured region predicted to contain
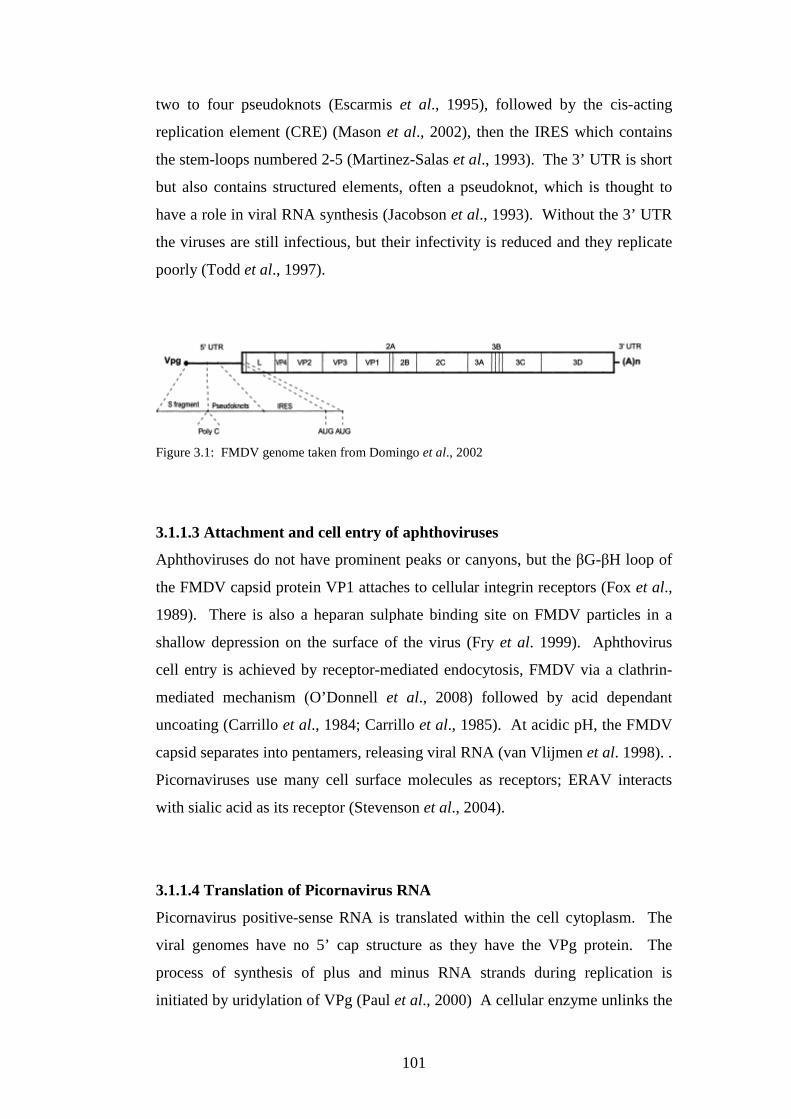
101
two to four pseudoknots (Escarmis et al., 1995), followed by the cis-acting
replication element (CRE) (Mason et al., 2002), then the IRES which contains
the stem-loops numbered 2-5 (Martinez-Salas et al., 1993). The 3’ UTR is short
but also contains structured elements, often a pseudoknot, which is thought to
have a role in viral RNA synthesis (Jacobson et al., 1993). Without the 3’ UTR
the viruses are still infectious, but their infectivity is reduced and they replicate
poorly (Todd et al., 1997).
Figure 3.1: FMDV genome taken from Domingo et al., 2002
3.1.1.3 Attachment and cell entry of aphthoviruses
Aphthoviruses do not have prominent peaks or canyons, but the βG-βH loop of
the FMDV capsid protein VP1 attaches to cellular integrin receptors (Fox et al.,
1989). There is also a heparan sulphate binding site on FMDV particles in a
shallow depression on the surface of the virus (Fry et al. 1999). Aphthovirus
cell entry is achieved by receptor-mediated endocytosis, FMDV via a clathrin-
mediated mechanism (O’Donnell et al., 2008) followed by acid dependant
uncoating (Carrillo et al., 1984; Carrillo et al., 1985). At acidic pH, the FMDV
capsid separates into pentamers, releasing viral RNA (van Vlijmen et al. 1998). .
Picornaviruses use many cell surface molecules as receptors; ERAV interacts
with sialic acid as its receptor (Stevenson et al., 2004).
3.1.1.4 Translation of Picornavirus RNA
Picornavirus positive-sense RNA is translated within the cell cytoplasm. The
viral genomes have no 5’ cap structure as they have the VPg protein. The
process of synthesis of plus and minus RNA strands during replication is
initiated by uridylation of VPg (Paul et al., 2000) A cellular enzyme unlinks the
102
VPg (Ambros et al., 1980). All picornaviruses contain 5’ untranslated regions
containing regions of ordered secondary structure (Rivera et al., 1988; Skinner
et al., 1989) which are the IRESes and replication elements. IRES mediated
translation is stimulated by an interaction between the structured RNA and
elements of the cellular translation machinery. In aphthoviruses, which have a
type II IRES, the 3’ end of the IRES interacts with eIF4G, eIF4B, eIF3 and PTB
(Kolupaeva et al., 2003). Translation of the RNA genome from a single open
reading frame (ORF) produces a single polyprotein. The polyprotein is divided
into three regions: P1, P2 and P3. Aphthoviruses and cardioviruses also code a
leader protein (L) in front of P1. A property of the FMDV Lpro is the ability to
cleave eIF4G which inhibits cellular translation (Devaney et al., 1988). The
single polyprotein is then cleaved by virus encoded proteinases. The cleavage
begins immediately after translation so the polyprotein does not exist in the cell
as a single structure. P1 is cleaved to produce the viral capsid proteins; P2 and
P3 are cleaved to create the non-structural proteins involved in protein
processing and genome replication. In aphthoviruses the VP1/2A cleavage is
carried out by 3Cpro rather than 2A as in other picornaviruses (Palmenberg et al.,
1992). The protein 3Cpro also carries out the cleavage between 2C and 3A.
Aphthovirus protein 2A, although only 18 amino acids long, is still able to
catalyze its autocleavage from 2B (Ryan and Drew, 1994). The proteases
initially cleave at intramolecular sites (in cis), but latterly also act at equivalent
sites on other newly translated molecules (in trans). In many picornaviruses
there have also been identified cis-acting replication elements (CRE). These are
structured regions found within the genome at various locations in different
viruses, some in coding regions and others in non-coding regions; these
elements are necessary for replication (Goodfellow et al., 2000; Mason et al
2002). The cis-acting replication element is necessary for synthesis of the
negative sense strand (Goodfellow et al., 2000) by templating the production of
VPg-pUpU (Pathak et al., 2007) During genome replication, three forms of
viral RNA can exist: i) single stranded RNA; ii) replicative intermediate (RI) –
full length RNA from which 6-8 strands are attached; and iii) replicative form
(RF) – dsRNA, a full length copy of positive and negative strands. RNA
replication has been shown to be associated with smooth membranes called the
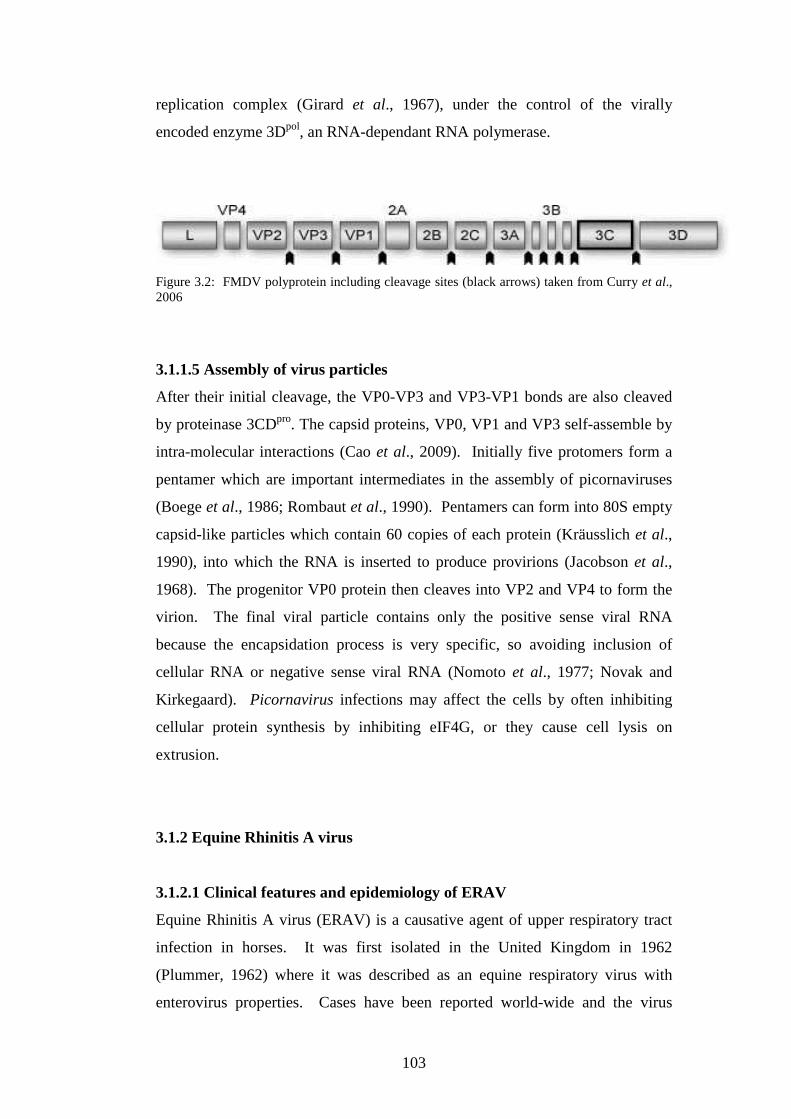
103
replication complex (Girard et al., 1967), under the control of the virally
encoded enzyme 3Dpol, an RNA-dependant RNA polymerase.
Figure 3.2: FMDV polyprotein including cleavage sites (black arrows) taken from Curry et al., 2006
3.1.1.5 Assembly of virus particles
After their initial cleavage, the VP0-VP3 and VP3-VP1 bonds are also cleaved
by proteinase 3CDpro. The capsid proteins, VP0, VP1 and VP3 self-assemble by
intra-molecular interactions (Cao et al., 2009). Initially five protomers form a
pentamer which are important intermediates in the assembly of picornaviruses
(Boege et al., 1986; Rombaut et al., 1990). Pentamers can form into 80S empty
capsid-like particles which contain 60 copies of each protein (Kräusslich et al.,
1990), into which the RNA is inserted to produce provirions (Jacobson et al.,
1968). The progenitor VP0 protein then cleaves into VP2 and VP4 to form the
virion. The final viral particle contains only the positive sense viral RNA
because the encapsidation process is very specific, so avoiding inclusion of
cellular RNA or negative sense viral RNA (Nomoto et al., 1977; Novak and
Kirkegaard). Picornavirus infections may affect the cells by often inhibiting
cellular protein synthesis by inhibiting eIF4G, or they cause cell lysis on
extrusion.
3.1.2 Equine Rhinitis A virus
3.1.2.1 Clinical features and epidemiology of ERAV
Equine Rhinitis A virus (ERAV) is a causative agent of upper respiratory tract
infection in horses. It was first isolated in the United Kingdom in 1962
(Plummer, 1962) where it was described as an equine respiratory virus with
enterovirus properties. Cases have been reported world-wide and the virus
104
isolated in Canada (Ditchfield and MacPherson, 1965), the United States
(Wilson et al., 1965), Italy (Flammini and Allegri, 1970), France (Brion 1966),
Germany (Becker et al, 1974), Switzerland (Hofer et al, 1973) and Australia
(Studdert and Gleeson 1977) . Young animals in contact with older animals are
the most susceptible group (Hofer et al, 1972). The incubation period is 3-8
days (Thein, 1978) and there is a viraemic phase of 4-5 days (Plummer and
Kerry, 1962). Following aerosol exposure, the virus replicates in the nasal
epithelium before establishing viraemia. The virus is cleared from the blood by
an antibody response, but it persists in the pharynx. The virus was originally
detected in equine faeces (Plummer 1963), although it has not been isolated
from intestinal tissue, and it may be detected for up to 4 weeks post-infection. It
may be that some viruses present in the pharynx are swallowed and, despite
being acid labile, sufficient virions survive to be detected in the faeces. Another
possible explanation for faecal detection is that as a consequence of the viraemia
the enterocytes become persistently infected. ERAV has been detected in horse
urine for up to 146 days (McCollum and Timoney, 1992) so the urinary tract
may be another site of persistent infection. Clinical signs include pyrexia (41°C
+/- 0.5°C), nasal discharge (initially serous but becoming mucopurulent),
coughing, anorexia, pharyngitis and lymphadenitis. Uncomplicated cases
usually recover in 7 days, although the horses are susceptible to secondary
bacterial infections e.g. Streptococcus zooepidemicus (Virus Infections of
Equines, Chapter 18, M.J. Studdert). The seroprevalence of antibodies against
ERAV in horses in various countries has been determined e.g. 90 % in Austria
(Kriegshauser et al, 2005), 66 % in the Netherlands (De Boer et al, 1979), 79 %,
57 % in USA (McCollum and Timoney, 1992). Horses appear to acquire the
infection within the first 2 years of life and antibodies against ERAV are
uncommon in animals between 6 and 12 months of age (Studdert and Gleeson,
1978).
105
3.1.2.2 Classification of ERAV as an aphthovirus
ERAV was previously known as Equine rhinovirus 1 (ERhV1), but its
classification was uncertain until Wutz et al (1996) and Li et al (1996)
demonstrated that due to its sequence homology and similar genome
organisation it is most closely related to foot-and-mouth disease virus (FMDV),
formerly the only member of the genus Aphthovirus in the family
Picornaviridae. The ability to cause a viraemia, persistent infections and broad
cell culture host range are also more typical of aphthoviruses than other
picornaviruses. The most similar features between ERAV and FMDV include
the amino acid sequence of the 2A protein which is 87.5 % identical (Li et al,
1996) and a leader (L) protein which is similar in size to the FMDV Lab protein.
ERAV and FMDV both have a type II internal ribosome entry site (IRES).
Translation of the FMDV polyprotein is initiated from 2 different AUG codons,
the first at the 3’ end of the IRES and the other 84 nucleotides downstream
(Beck et al., 1983; Clarke et al., 1985) resulting in the production of 2 forms of
the leader protein, Lab and Lb (Sangar et al., 1987). There are also 2 start
codons in ERAV, although they are separated by 54 nucleotides. During
translation of the ERAV genome however, the first site appears dominant
resulting in an excess of Lab over Lb (Hinton et al., 2000), whereas the relative
amounts of Lab and Lb varies between FMDV strains (Sangar et al., 1987).
106
3.2 Objectives
1. ERAV prevalence study by serological survey.
In this study equine serum samples were collected from the clinical laboratory
of the veterinary pathology unit at the Easter Bush Veterinary Centre, University
of Edinburgh. The serological survey was conducted by use of a virus
neutralisation assay. Based on reports of the persistence of ERAV infections it
was expected that there would have been marked exposure to ERAV in horse in
Scotland.
2. ERAV prevalence study by PCR screening of faecal samples and sera
ERAV causes a relatively mild upper respiratory tract infection, so it is unlikely
that the animals admitted to the equine hospital would have been referred with
respiratory disease due to ERAV as the primary presenting sign. The samples
analysed in this study were from inpatients admitted for other reasons, such as
orthopaedic or gastrointestinal conditions. As ERAV is a persistent virus, we
reasoned that horse may have been exposed to ERAV and recovered clinically
but would continue to shed virus. This study sought to determine the level of
ERAV detectable in faecal and serum samples.
3. Complete genome sequencing of PCR positive samples for phylogenetic
and structural analyses.
Any novel viruses discovered in the clinical samples would then undergo
phylogenetic and bioinformatics analysis. Bioinformatic prediction of the
degree of secondary structure throughout the genome of ERAV revealed that the
5’ half of the genome was predicted to be structured, but the 3’ half unstructured
(data not shown). We hypothesised that this uneven distribution of structure
may have been a cell culture adaptation as sequence data are derived from
laboratory strains, and that novel ERAVs discovered in clinical samples would
contain structure throughout the length of the genome.
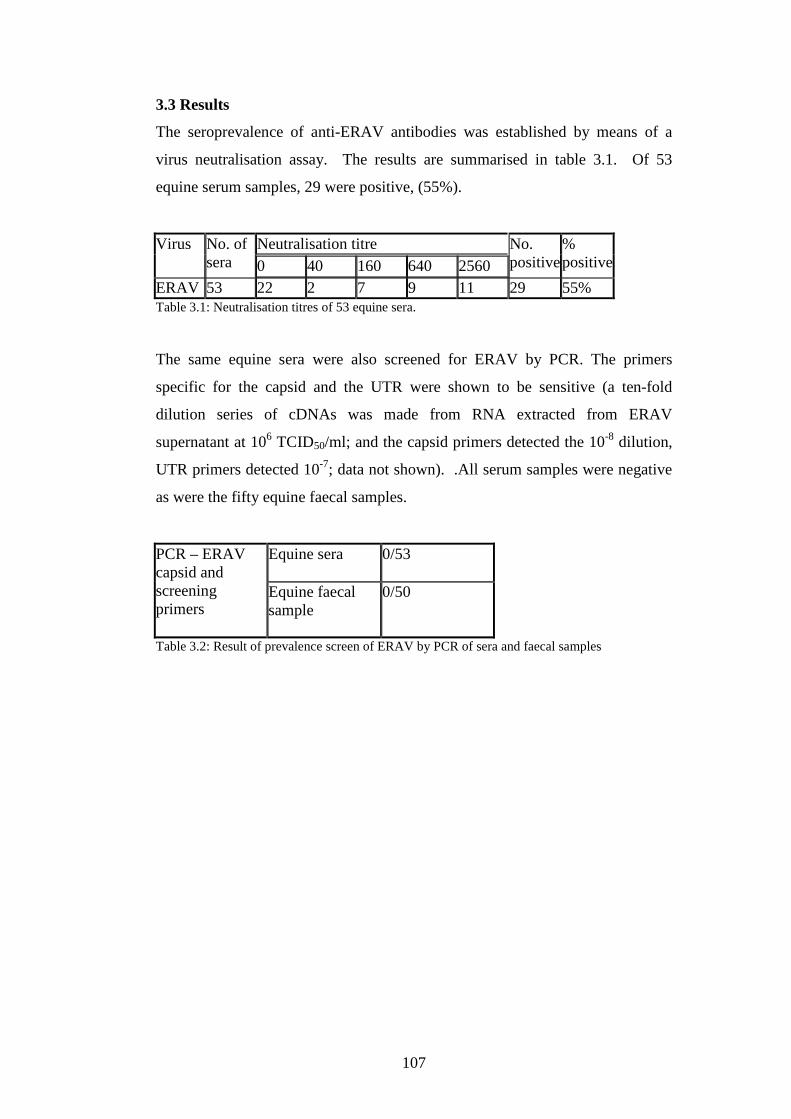
107
3.3 Results
The seroprevalence of anti-ERAV antibodies was established by means of a
virus neutralisation assay. The results are summarised in table 3.1. Of 53
equine serum samples, 29 were positive, (55%).
Neutralisation titre Virus No. of sera 0 40 160 640 2560
No. positive
% positive
ERAV 53 22 2 7 9 11 29 55% Table 3.1: Neutralisation titres of 53 equine sera.
The same equine sera were also screened for ERAV by PCR. The primers
specific for the capsid and the UTR were shown to be sensitive (a ten-fold
dilution series of cDNAs was made from RNA extracted from ERAV
supernatant at 106 TCID50/ml; and the capsid primers detected the 10-8 dilution,
UTR primers detected 10-7; data not shown). .All serum samples were negative
as were the fifty equine faecal samples.
Equine sera
0/53
PCR – ERAV capsid and screening primers
Equine faecal sample
0/50
Table 3.2: Result of prevalence screen of ERAV by PCR of sera and faecal samples
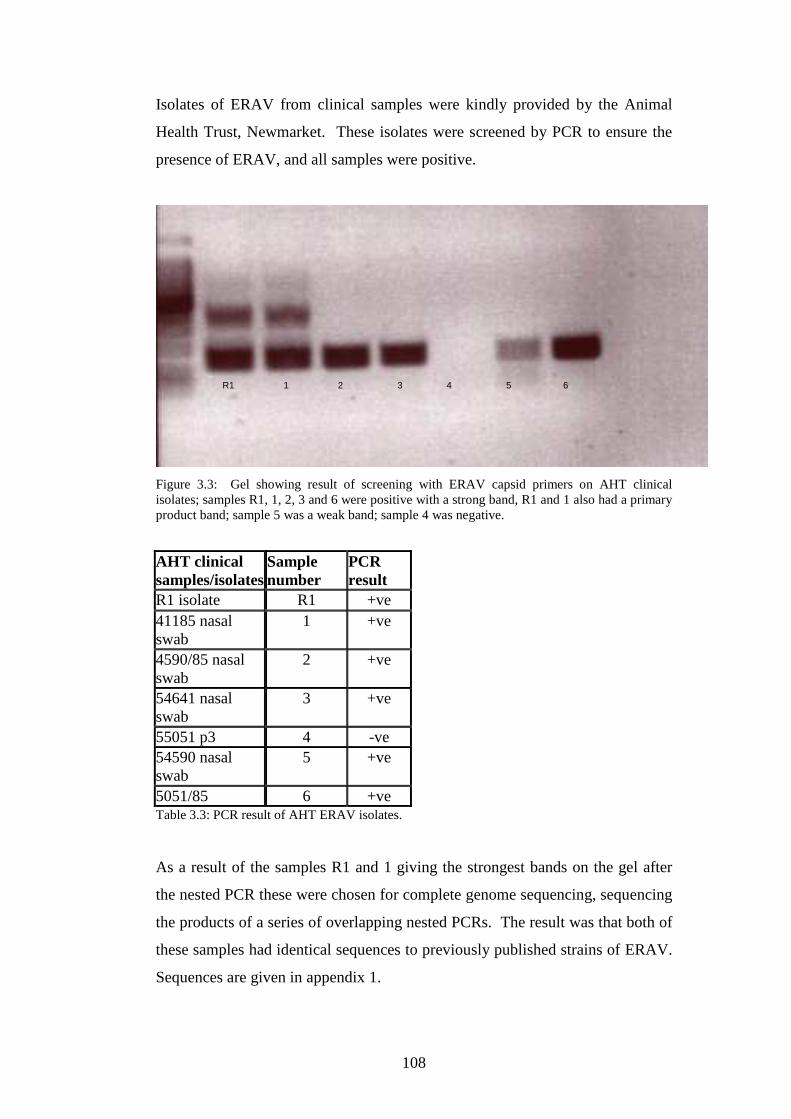
108
Isolates of ERAV from clinical samples were kindly provided by the Animal
Health Trust, Newmarket. These isolates were screened by PCR to ensure the
presence of ERAV, and all samples were positive.
Figure 3.3: Gel showing result of screening with ERAV capsid primers on AHT clinical isolates; samples R1, 1, 2, 3 and 6 were positive with a strong band, R1 and 1 also had a primary product band; sample 5 was a weak band; sample 4 was negative.
AHT clinical samples/isolates
Sample number
PCR result
R1 isolate R1 +ve 41185 nasal swab
1 +ve
4590/85 nasal swab
2 +ve
54641 nasal swab
3 +ve
55051 p3 4 -ve 54590 nasal swab
5 +ve
5051/85 6 +ve Table 3.3: PCR result of AHT ERAV isolates.
As a result of the samples R1 and 1 giving the strongest bands on the gel after
the nested PCR these were chosen for complete genome sequencing, sequencing
the products of a series of overlapping nested PCRs. The result was that both of
these samples had identical sequences to previously published strains of ERAV.
Sequences are given in appendix 1.
R1 1 2 3 4 5 6
109
3.4 Discussion
ERAV, as a virus predicted to have a significant degree of secondary structure
over the first half of the genome was a candidate virus for the study of GORS.
The study was conducted to determine the prevalence of ERAV in horses in
Scotland to test the hypothesis that as viruses predicted to contain GORS are
able to form persistent infections (Simmonds et al., 2004), and that ERAV has
been shown to be shed persistently (McCollum and Timoney 1992), that it
would be a highly prevalent. This study has shown a prevalence of antibodies to
ERAV of 55 %, which is comparable to that of other countries. The sera
submitted were from equine patients at the Equine Hospital, University of
Edinburgh, which would have been treated for a wide variety of conditions. The
clinical history of the horse corresponding to each serum samples was not
available, but as ERAV causes a relatively mild clinical disease it is not likely
that the horses referred to the equine hospital would have been clinical case of
ERAV. The seroprevalence result of 55 % shows that a majority of horses in
Scotland have been exposed to ERAV at some time in their lives. The fact that
in this study, no horses of less than 2 years of age were seropositive is also
consistent with previous observations of age-related exposure (Studdert and
Gleeson, 1978) which showed that 16 % of horses between the ages of 6 and 12
months were seropositive. The screen of each of the positive sera by PCR was
negative however, indicating that it is highly unlikely that any of the
seropositive horses were viraemic with ERAV.
ERAV was first discovered by Plummer in 1962 in the faeces of 13 out of 290
horses (5 %), it was described as an equine respiratory virus with enterovirus
properties. Although it is now known that the virus ERAV is a member of the
Aphthovirus genus of Picornaviridae, and cause an upper respiratory tract
infection, it is still not certain how the virus can be detected faecally. Theories
include the possibility that the virus from the respiratory tract may be swallowed
and so emerge in the faeces, although as an acid-labile aphthovirus it might not
be expected to be able to pass through the acidic environment of the stomach.
An alternative idea is that as the virus causes a viraemia it could potentially
reach any part of the body and therefore be secreted into the intestinal tract. In
this study faecal samples were collected from the horse boxes of 50 in-patients
110
at the Equine Hospital, University of Edinburgh and screened by PCR. None of
the faecal samples were positive. The prevalence in faecal samples determined
by Plummer i.e. 5 % is markedly below that of the seroprevalence found in this
study and others. A faecal prevalence of 5 % in 50 samples would have been
given by just 2-3 positive samples, so it may be that a larger sample size was
required. A more sensitive detection method may also have revealed hidden
positives.
The ERAV isolates provided by the Animal Health Trust, Newmarket, were all
detectable by PCR with the exception of one. The almost complete genome
sequencing was carried out in an effort to identify a new strain of the virus
distinct from the laboratory strains and published sequences. The hypothesis
was that newly identified viruses from an animal would be free of cell culture
adaptations and related sequence changes that are present in laboratory strains.
The hope was that novel virus sequences could be analysed by bioinformatics
structural predictions to compare the degree of secondary structure along the
length of the ERAV genome. The laboratory strain of ERAV shows regions of
predicted secondary structure along the first half (5’) of the genome before
apparently becoming unstructured towards the 3’ end. The plan was then to
serially passage the ERAV isolates and assess the effect of cell culture
adaptation on the degree of secondary structure along the genome.
Unfortunately, none of the clinical samples tested by PCR in this study were
positive so there was no novel ERAV isolates could be obtained and the isolates
provided by the AHT had identical sequences to the published sequences of the
laboratory strains possibly as a consequence of contamination.
This study that the seroprevalence of ERAV in Scotland is comparable to that in
other European countries, USA, Canada, Australia and Japan, but it did not
prove to be useful virus for the study of GORS.
111
Chapter 4 Murine norovirus – prevalence,
genomic RNA structure and the identification of a
novel MNV in the wood mouse (Apodemus
sylvaticus)
4.1 Introduction 4.2 Objectives 4.3 Results 4.4 Discussion
112
Chapter 4 Murine Noroviruses – prevalence, genomic RNA secondary
structure and identification of a novel MNV in the wood mouse (Apodemus
sylvaticus)
4.1 Introduction
The genus Norovirus of the family Caliciviridae consists of viruses that infect
humans and animals. Human norovirus infections cause mild, acute, self-
limiting gastroenteritis characterised by nausea, vomiting, diarrhoea and
abdominal cramps (Kaplan et al., 1982). Outbreaks typically occur in confined
places such as cruise ships, hospitals and schools (Widdowson et al., 2005;
Becker et al., 2000; Gunn et al., 1980). Noroviruses have also been discovered
in pigs (Sugieda et al., 1998), cattle (Woode and Bridger, 1978) and mice (Karst
et al., 2003). Bovine noroviruses are associated with diarrhoea in calves
(Woode and Bridger, 1978) whereas porcine and murine norovirus are
subclinical in immunocompetent hosts (Wang et al., 2007; Karst et al., 2003).
Noroviruses are classified into 5 distinct genogroups: genogroups I, II and IV
contain human noroviruses, genogroup III contains bovine noroviruses and
genogroup V contains murine noroviruses; the genogroups are also divided into
genotypes (Green et al., 1999); see figure 1.1. Murine noroviruses (MNVs)
diverge by up to 13 % at the nucleotide level, and to date are considered to
comprise a single genotype of genogroup V (Thackray et al., 2007).
Noroviruses have a single-stranded, positive sense RNA genome of ~7.5
kilobases. There are 3 well characterised ORFs. ORF 1 encodes a polyprotein
which is cleaved into the non-structural proteins (Sosnovtsev et al., 2006). ORF
2, which is sub-genomic, encodes the major capsid protein VP1 (Jiang et al.,
1990); ORF 3 encodes the small basic protein VP2 which appears to have a role
in virion stability (Glass et al., 2000). A fourth ORF has been postulated, but is
of uncertain function. The 5’ end of the genome is covalently bound to the VPg
protein and the 3’ end is an untranslated region consisting of a stem-loop and a
poly(A) tail (Gutierrez-Escolano et al., 2003).
MNV was discovered in 2003 in RAG/STAT-/- mice; these mice are severely
immunosuppressed and the mice would die with meningoencephalitis, cerebral
113
vasculitis and pneumonia (Karst et al., 2003). The virus was identified as a
norovirus and designated MNV-1. MNV-2, 3 and 4 were subsequently
characterised by Hsu et al in 2006 by screening mesenteric lymph nodes and
faecal samples from laboratories across the United States. These three new
strains were shown to establish sub-clinical, persistent infections with prolonged
faecal shedding, in contrast to MNV-1 (Hsu et al., 2006). A further 21 MNVs
were sequenced in 2007 which comprised 15 distinct strains with up to 13 %
divergence at the nucleotide level (Thackray et al., 2007). To date, August
2009, there are 41 MNV complete genomes available on the NCBI Entrez
Nucleotide database (http://www.ncbi.nlm.nih.gov/sites/entrez).
MNV has also become the favoured virus to study norovirus biology as it is the
only norovirus that is cultivatable in cell culture. It was discovered to grow in
the murine macrophage cell line RAW 264.7, producing CPE and forming
plaques (Wobus et al., 2004). This has led to the development of reverse
genetics systems by which the virus’s replication strategies will certainly be
further elucidated in the future (Ward et al., 2007; Chaudhry et al., 2007).
MNV has also been identified as a GORS virus i.e. prediction of secondary
structure along the length of the RNA genome by bioinformatic analysis; the
average MFED of MNV-1 being 6.3 %. MNV is an ideal virus for the study of
GORS as mice are numerous in research institutions and studies have identified
the presence of MNV in laboratory mice in institutions around the world (Hsu et
al., 2006; Muller et al., 2007). The observation that MNV-2, 3 and 4 caused
persistent infection in immunocompetent hosts in 2006 agreed with the
observation that the presence of GORS is associated with this property
(Simmonds et al., 2004). The cell culture system and recently developed
reverse genetics techniques also allow passage and manipulation of the virus.
MNV is a virus that allows us to test hypotheses concerning the nature of GORS
and its relationship to persistence in immunocompetent mice.
114
4.2 Objectives
1. Prevalence study of MNV in laboratory mice and wild mouse
populations.
In this study faecal samples were collected from laboratory mice (Mus
musculus), wild house mice (Mus musculus) the following wild rodent species:
wood mouse (Apodemus sylvaticus), field vole (Microtus agrestis) and bank
vole (Myodes glareolus). The samples were screened by PCR for MNV using
specific primers, or degenerate norovirus primers in the wild samples. Based on
previous reports, it was expected to identify MNV in laboratory samples; in wild
rodents the prevalence of MNV is unknown, but it was hypothesised that a
norovirus present in a wild population would likely to be GORS, and as GORS
confers an evolutionary advantage in enabling the virus to persist there would be
a similar prevalence as in mice bred in captivity.
2. Phylogenetic analysis of novel MNVs
Previous studies have shown that MNV is the only member of norovirus
genogroup V, and consists of a single genotype. The aim of our study was to
classify MNVs identified in laboratory mice and wild mice. To this end, regions
of the genome were sequenced from PCR positive samples, and the complete or
almost complete genomes sequenced from several of them.
3. RNA structural predictions
Using the complete or almost complete sequences of MNVs identified as well as
selected previously published sequences, the degree of secondary structure was
predicted along the length of the genome. It was hypothesised that any newly
identified MNVs from laboratory mice or wild animals would all be GORS
viruses.
115
4. MNV passage study
We formed a hypothesis that during infection of an animal, the immune system
exerts an evolutionary pressure and that GORS, in some way perhaps related to
immune evasion, confers an advantage, so the degree of secondary structure is
maintained by the virus. We considered that in cell culture viruses are known to
undergo adaptations, and that after serial passage the degree of secondary
structure may decline as the virus becomes cell culture adapted. It has been
shown that the presence of GORS is sensitive to changes in sequence, 2 %
sequence drift reducing the MFED, and 10 % drift undoing the presence of
GORS completely. MNV-3 was therefore passaged 33 times in RAW cells at
high and low moi; the complete genome of passage zero and 33 were sequenced.
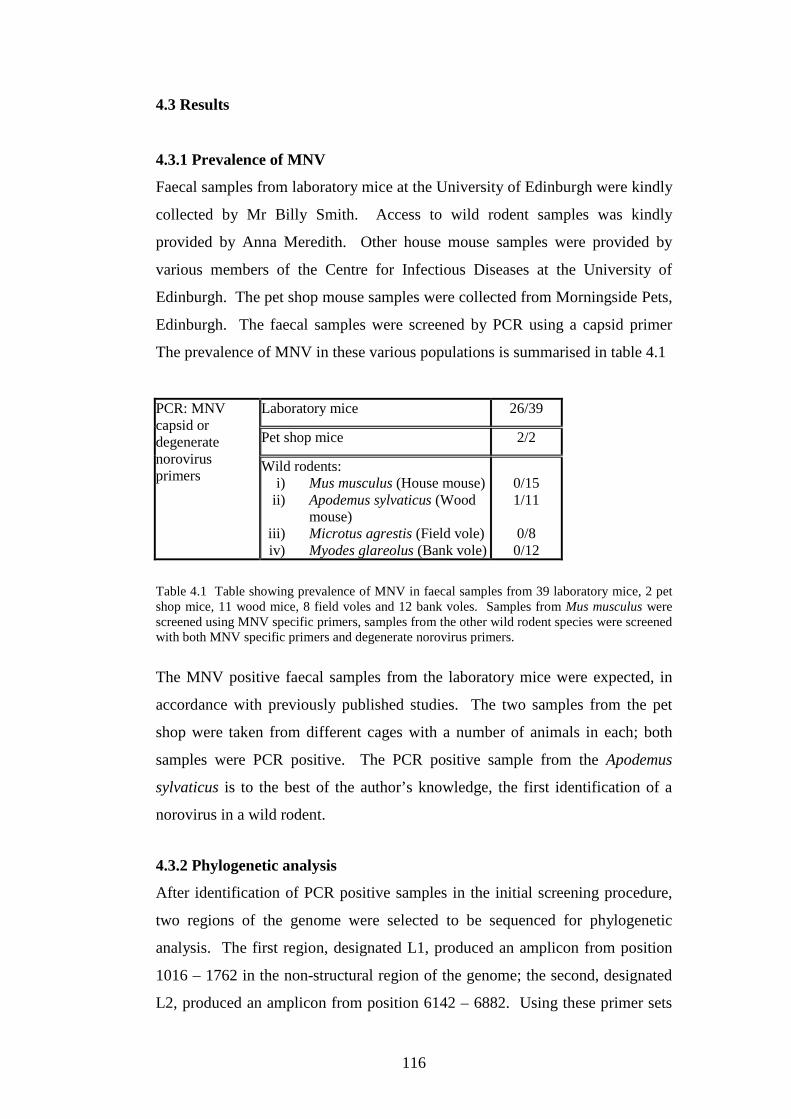
116
4.3 Results
4.3.1 Prevalence of MNV
Faecal samples from laboratory mice at the University of Edinburgh were kindly
collected by Mr Billy Smith. Access to wild rodent samples was kindly
provided by Anna Meredith. Other house mouse samples were provided by
various members of the Centre for Infectious Diseases at the University of
Edinburgh. The pet shop mouse samples were collected from Morningside Pets,
Edinburgh. The faecal samples were screened by PCR using a capsid primer
The prevalence of MNV in these various populations is summarised in table 4.1
Laboratory mice 26/39
Pet shop mice 2/2
PCR: MNV capsid or degenerate norovirus primers
Wild rodents: i) Mus musculus (House mouse) ii) Apodemus sylvaticus (Wood
mouse) iii) Microtus agrestis (Field vole) iv) Myodes glareolus (Bank vole)
0/15 1/11
0/8 0/12
Table 4.1 Table showing prevalence of MNV in faecal samples from 39 laboratory mice, 2 pet shop mice, 11 wood mice, 8 field voles and 12 bank voles. Samples from Mus musculus were screened using MNV specific primers, samples from the other wild rodent species were screened with both MNV specific primers and degenerate norovirus primers.
The MNV positive faecal samples from the laboratory mice were expected, in
accordance with previously published studies. The two samples from the pet
shop were taken from different cages with a number of animals in each; both
samples were PCR positive. The PCR positive sample from the Apodemus
sylvaticus is to the best of the author’s knowledge, the first identification of a
norovirus in a wild rodent.
4.3.2 Phylogenetic analysis
After identification of PCR positive samples in the initial screening procedure,
two regions of the genome were selected to be sequenced for phylogenetic
analysis. The first region, designated L1, produced an amplicon from position
1016 – 1762 in the non-structural region of the genome; the second, designated
L2, produced an amplicon from position 6142 – 6882. Using these primer sets
117
in a PCR on the 26 PCR positive laboratory samples, 17 were positive for L1
and 15 for L2. The complete or almost complete genomes of six novel MNVs
were sequenced: 4 laboratory MNVs designated Lab 12, Lab 17, Lab 18, Lab
22; and the pet shop mouse MNV (PSM1), (the MNVs identified from the two
pet shop cages had identical sequences); and the Apodemus MNV (WR960).
The complete sequence data can be found in Appendix 1. Phylogenetic analysis
was carried out using Mega 4 (Mega 4.0.1, Tamura, Dudley, Nei and Kumar,
2007). Figure 4.1 shows a tree made from the almost complete nucleotide
sequence of the 6 novel MNVs and all other previously published sequences.
Figure 4.2 is a tree made from the almost complete amino acid sequences of the
6 novel MNVs and published sequences. What is notable is that the nucleotide
and amino acid trees are very similar and that whereas the laboratory MNVs and
pet shop MNV cluster closely together, the Apodemus MNV does not, and
appears to be a significant genetic distance from the others. Phylogenetic trees
made from the nucleotide sequences of L1 and L2, figures 4.3 and 4.4, confirm
that the majority of laboratory MNVs cluster closely with other published MNV
sequences. Figure 4.5 shows a phylogenetic tree made from the amino acid
sequence of the VP1 region of selected examples of every genotype of each
norovirus genogroup. The position of WR960 clearly shows that it is a member
of the MNV genogroup i.e. genogroup V, and therefore not a contaminant from
a human, bovine or porcine norovirus.
118
WU20
WU24
WU23
WU25
WU11
WU12
WU26
PSM1
MNV-4
MNV4
MNV-3
Berlin06
MNV3
Lab12
CR7
MNV-2
CR6
CR18
Berlin04
Berlin05
CR3
S7-PPS
CR10
CR11
CR13
CR4
MNV-1
CR1
CR15
CR17
Lab17
Lab18
Lab22
WR960comp
100
100
100
100
100
100
100
100
100
91
100
100
100
100
100
82
100
100
100
97
93
75
77
0.14
0.04
0.04
0.04
0.03
0.03
0.05
0.04
0.03
0.04
0.05
0.03
0.04
0.05
0.03
0.03
0.04
0.05
0.04
0.05
0.04
0.04
0.04
0.03
0.02
0.07
0.02 Figure 4.1 Phylogenetic analysis of nucleotide sequence by neighbour joining using the Jukes-Cantor model with pairwise deletion, of almost complete sequences of 6 newly sequenced MNVs and all published sequences from GenBank. Laboratory mouse MNVs are labelled with red dots; pet shop mouse, green; wood mouse, blue.
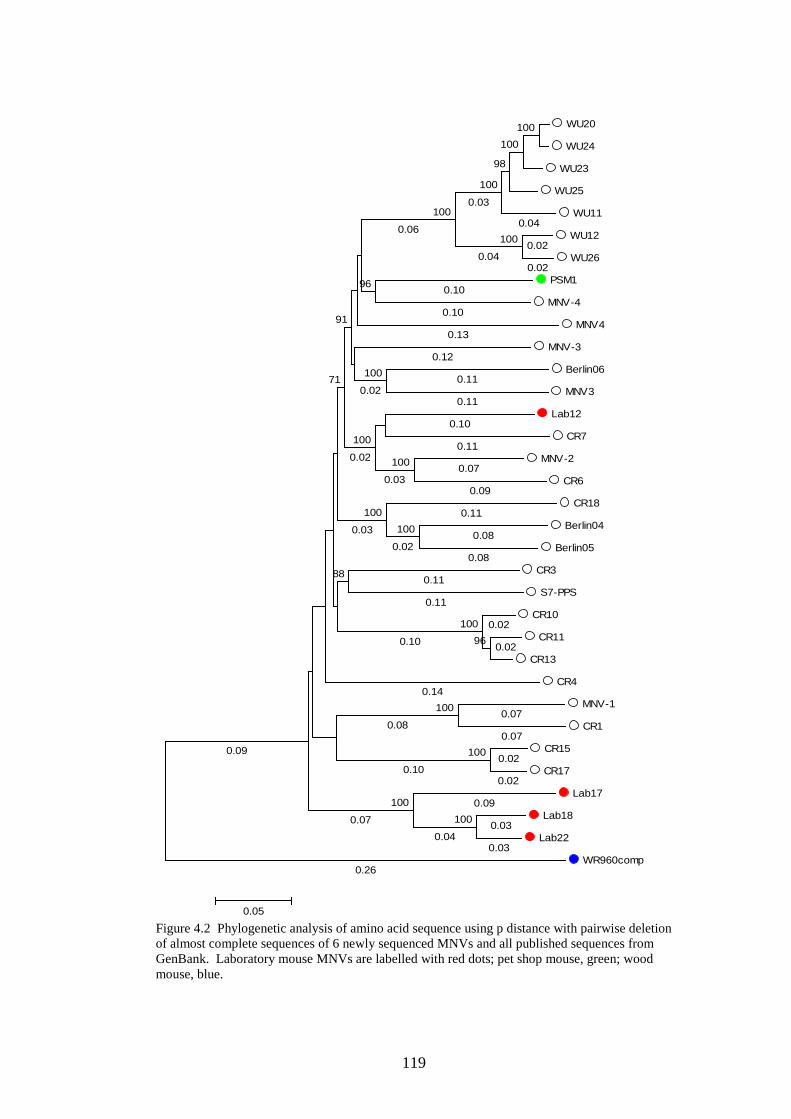
119
WU20
WU24
WU23
WU25
WU11
WU12
WU26
PSM1
MNV-4
MNV4
MNV-3
Berlin06
MNV3
Lab12
CR7
MNV-2
CR6
CR18
Berlin04
Berlin05
CR3
S7-PPS
CR10
CR11
CR13
CR4
MNV-1
CR1
CR15
CR17
Lab17
Lab18
Lab22
WR960comp
100
100
100
96
100
100
100
100
100
98
100
100
100
100
100
100
100
96
88
71
91
0.26
0.10
0.09
0.03
0.03
0.10
0.07
0.07
0.12
0.10
0.04
0.02
0.02
0.07
0.11
0.14
0.09
0.11
0.02
0.02
0.02
0.02
0.11
0.08
0.08
0.11
0.11
0.11
0.13
0.10
0.04
0.08
0.10
0.07
0.04
0.03
0.06
0.02
0.03
0.03
0.02
0.02
0.09
0.05 Figure 4.2 Phylogenetic analysis of amino acid sequence using p distance with pairwise deletion of almost complete sequences of 6 newly sequenced MNVs and all published sequences from GenBank. Laboratory mouse MNVs are labelled with red dots; pet shop mouse, green; wood mouse, blue.
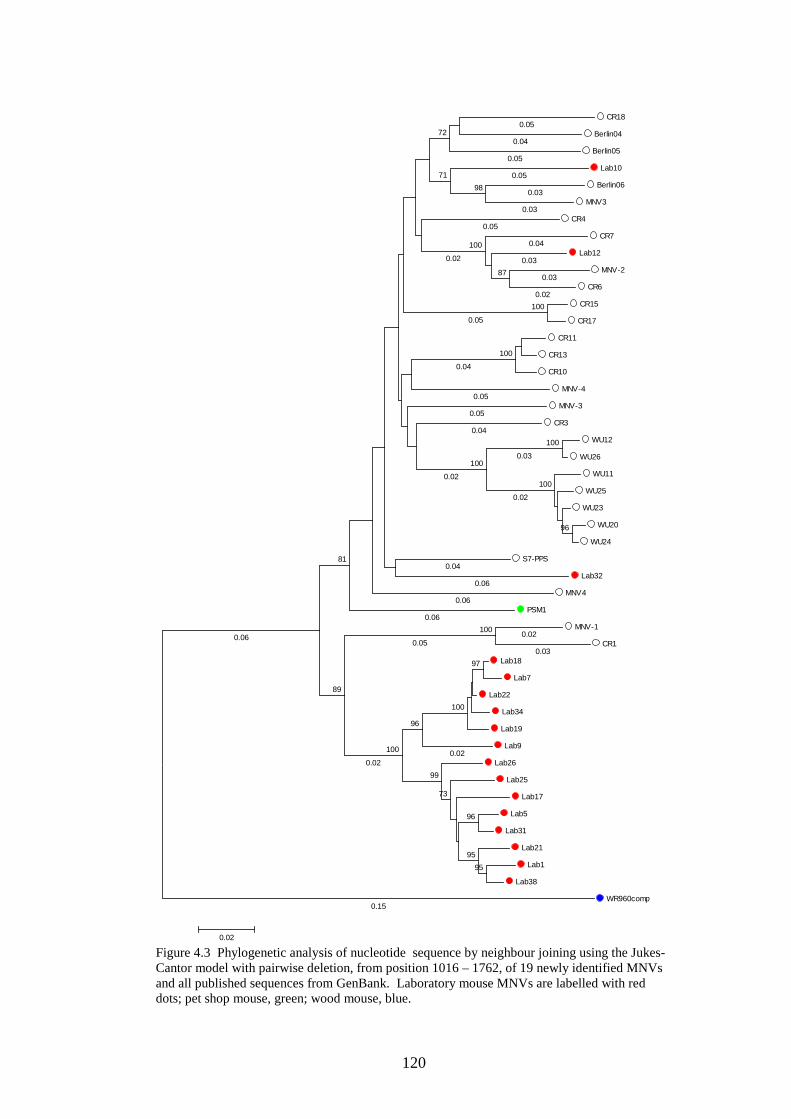
120
CR18
Berlin04
Berlin05
Lab10
Berlin06
MNV3
CR4
CR7
Lab12
MNV-2
CR6
CR15
CR17
CR11
CR13
CR10
MNV-4
MNV-3
CR3
WU12
WU26
WU11
WU25
WU23
WU20
WU24
S7-PPS
Lab32
MNV4
PSM1
MNV-1
CR1
Lab18
Lab7
Lab22
Lab34
Lab19
Lab9
Lab26
Lab25
Lab17
Lab5
Lab31
Lab21
Lab1
Lab38
WR960comp
100
100
96
100
100
100
97
95
96
95
100
73
99
96
100
100
89
87
100
98
81
71
72
0.15
0.03
0.06
0.02
0.03
0.05
0.05
0.03
0.04
0.05
0.02
0.04
0.05
0.04
0.05
0.03
0.04
0.03
0.06
0.02
0.05
0.06
0.05
0.05
0.03
0.02
0.04
0.02
0.02
0.02
0.06
0.02 Figure 4.3 Phylogenetic analysis of nucleotide sequence by neighbour joining using the Jukes-Cantor model with pairwise deletion, from position 1016 – 1762, of 19 newly identified MNVs and all published sequences from GenBank. Laboratory mouse MNVs are labelled with red dots; pet shop mouse, green; wood mouse, blue.
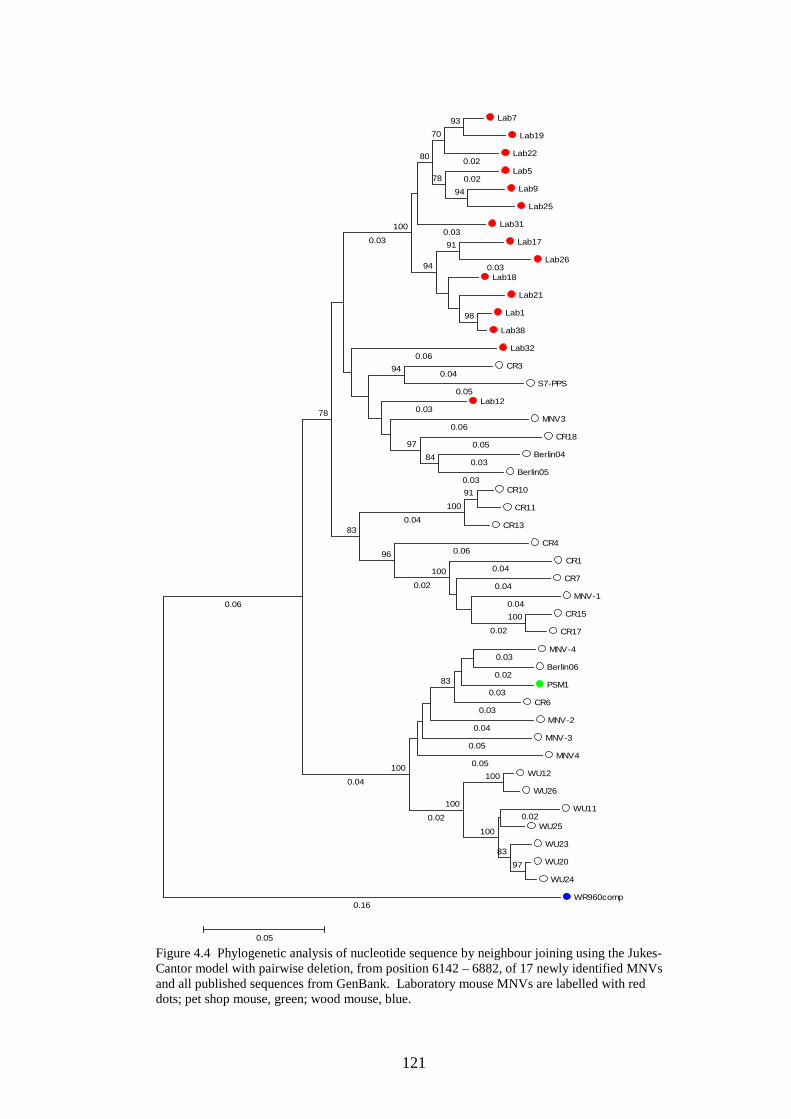
121
Lab7
Lab19
Lab22
Lab5
Lab9
Lab25
Lab31
Lab17
Lab26
Lab18
Lab21
Lab1
Lab38
Lab32
CR3
S7-PPS
Lab12
MNV3
CR18
Berlin04
Berlin05
CR10
CR11
CR13
CR4
CR1
CR7
MNV-1
CR15
CR17
MNV-4
Berlin06
PSM1
CR6
MNV-2
MNV-3
MNV4
WU12
WU26
WU11
WU25
WU23
WU20
WU24
WR960comp
100
97
83
100
100
100
83
100
91
100
100
84
96
97
94
98
83
78
94
93
91
94
78
70
80
100
0.16
0.03
0.02
0.03
0.04
0.04
0.05
0.03
0.02
0.04
0.04
0.06
0.03
0.04
0.05
0.03
0.03
0.02
0.05
0.06
0.05
0.02
0.03
0.03
0.06
0.02
0.02
0.04
0.04
0.02
0.06
0.03
0.05 Figure 4.4 Phylogenetic analysis of nucleotide sequence by neighbour joining using the Jukes-Cantor model with pairwise deletion, from position 6142 – 6882, of 17 newly identified MNVs and all published sequences from GenBank. Laboratory mouse MNVs are labelled with red dots; pet shop mouse, green; wood mouse, blue.
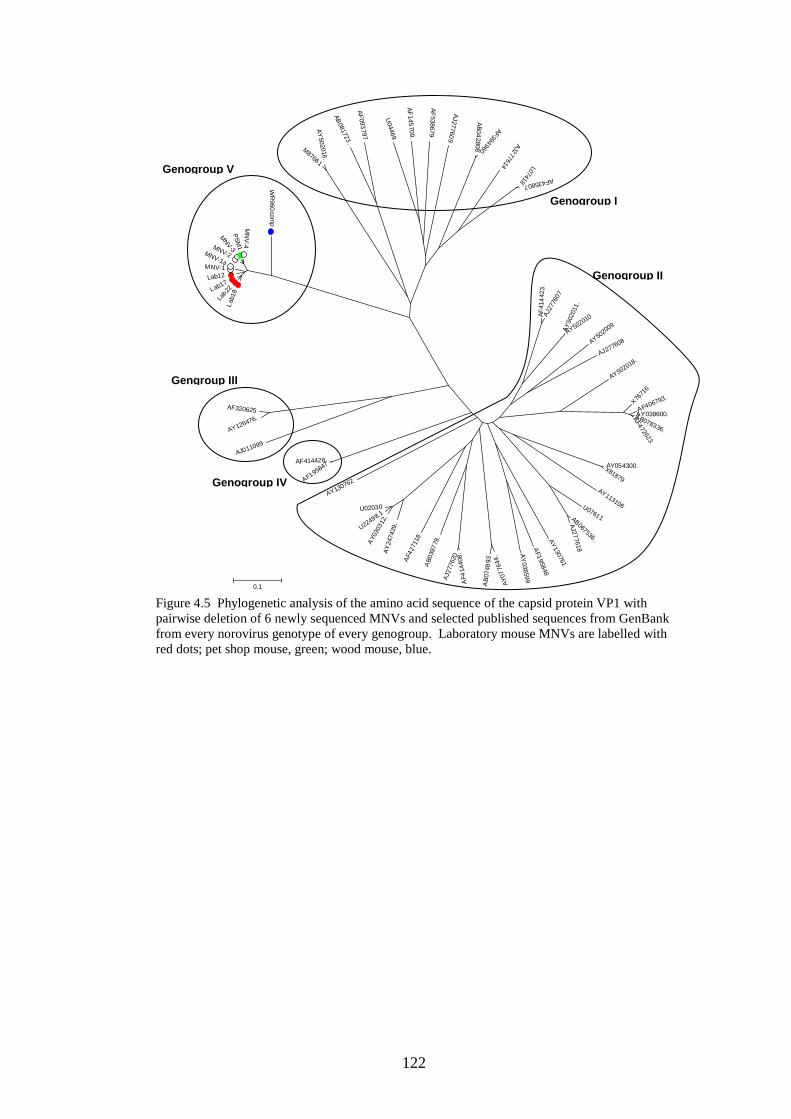
122
Figure 4.5 Phylogenetic analysis of the amino acid sequence of the capsid protein VP1 with pairwise deletion of 6 newly sequenced MNVs and selected published sequences from GenBank from every norovirus genotype of every genogroup. Laboratory mouse MNVs are labelled with red dots; pet shop mouse, green; wood mouse, blue.
AF
414
423.
AJ27
7607
AY50
2011
.
AY502010
AY502009
AJ277608
AY502018.
X7671
6
AF406793.
AY038600.AB078336.
AF472623.
AY054300.X81879
AY113106U07611AB067536.
AJ2
77618
AY130761
AF1
95848
AY
038599
AY
0776
44.
AB
0748
93
AF4
1440
8.
AJ2
7762
0
AB
0397
78.
AF4
2711
8
AY
2474
39.
AY0
3031
2.
U22498.1U02030
AY130762AF195847AF414426.AJ011099
AY126476.
AF320625
Lab
18
Lab22Lab17
Lab12MNV-1
MNV-1a
MNV-2
MNV-3
PS
M1
MN
V-4
WR
960com
p
M87661
AY
502016.
AB081723 .
AF
093797
U04469
AF
145709.
AF
538679
AJ27760
9
AB
042808
AF394960.
AJ277614 L07418 AF435807.
0.1
Genogroup II
Genogroup I
Genogroup V
Gengroup III
Genogroup IV
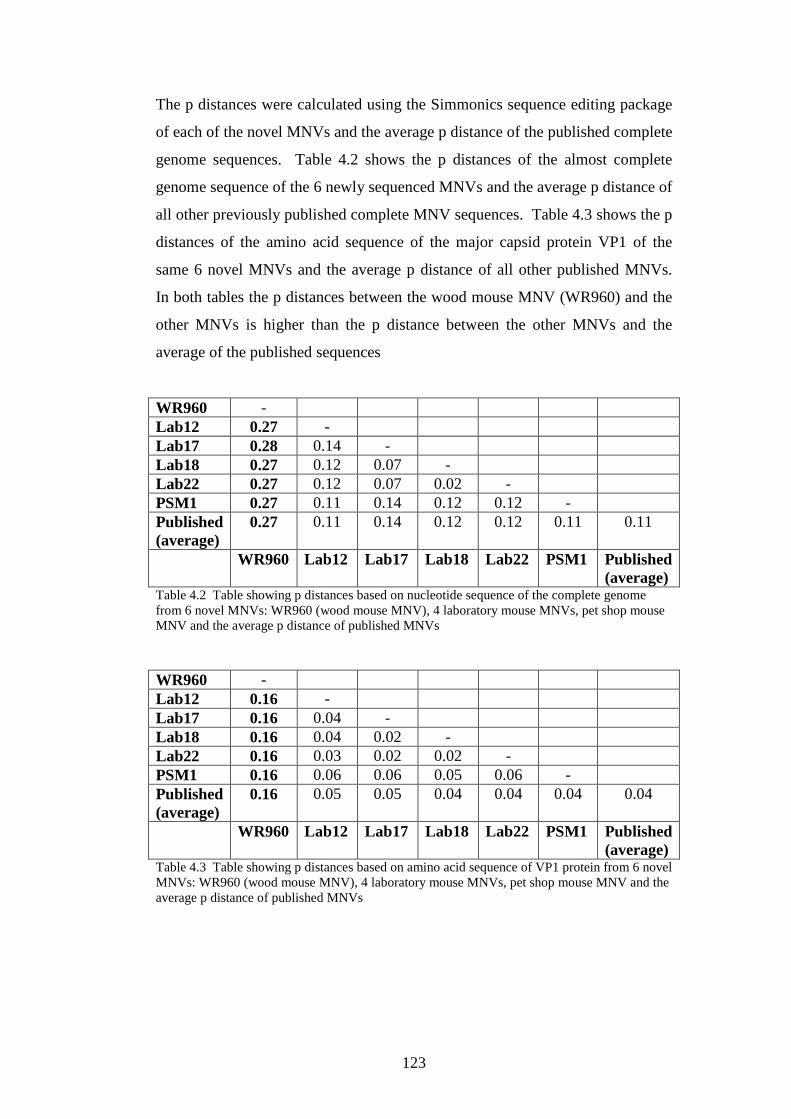
123
The p distances were calculated using the Simmonics sequence editing package
of each of the novel MNVs and the average p distance of the published complete
genome sequences. Table 4.2 shows the p distances of the almost complete
genome sequence of the 6 newly sequenced MNVs and the average p distance of
all other previously published complete MNV sequences. Table 4.3 shows the p
distances of the amino acid sequence of the major capsid protein VP1 of the
same 6 novel MNVs and the average p distance of all other published MNVs.
In both tables the p distances between the wood mouse MNV (WR960) and the
other MNVs is higher than the p distance between the other MNVs and the
average of the published sequences
WR960 - Lab12 0.27 - Lab17 0.28 0.14 - Lab18 0.27 0.12 0.07 - Lab22 0.27 0.12 0.07 0.02 - PSM1 0.27 0.11 0.14 0.12 0.12 - Published (average)
0.27 0.11 0.14 0.12 0.12 0.11 0.11
WR960 Lab12 Lab17 Lab18 Lab22 PSM1 Published (average)
Table 4.2 Table showing p distances based on nucleotide sequence of the complete genome from 6 novel MNVs: WR960 (wood mouse MNV), 4 laboratory mouse MNVs, pet shop mouse MNV and the average p distance of published MNVs WR960 - Lab12 0.16 - Lab17 0.16 0.04 - Lab18 0.16 0.04 0.02 - Lab22 0.16 0.03 0.02 0.02 - PSM1 0.16 0.06 0.06 0.05 0.06 - Published (average)
0.16 0.05 0.05 0.04 0.04 0.04 0.04
WR960 Lab12 Lab17 Lab18 Lab22 PSM1 Published (average)
Table 4.3 Table showing p distances based on amino acid sequence of VP1 protein from 6 novel MNVs: WR960 (wood mouse MNV), 4 laboratory mouse MNVs, pet shop mouse MNV and the average p distance of published MNVs
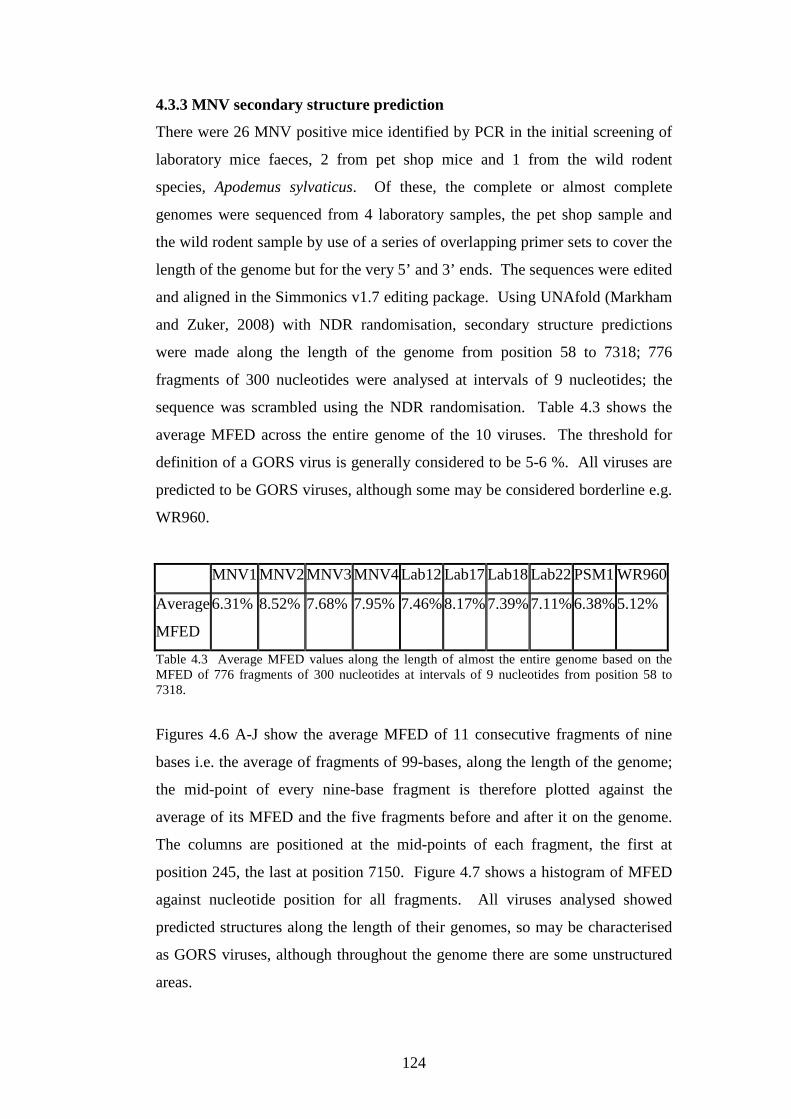
124
4.3.3 MNV secondary structure prediction
There were 26 MNV positive mice identified by PCR in the initial screening of
laboratory mice faeces, 2 from pet shop mice and 1 from the wild rodent
species, Apodemus sylvaticus. Of these, the complete or almost complete
genomes were sequenced from 4 laboratory samples, the pet shop sample and
the wild rodent sample by use of a series of overlapping primer sets to cover the
length of the genome but for the very 5’ and 3’ ends. The sequences were edited
and aligned in the Simmonics v1.7 editing package. Using UNAfold (Markham
and Zuker, 2008) with NDR randomisation, secondary structure predictions
were made along the length of the genome from position 58 to 7318; 776
fragments of 300 nucleotides were analysed at intervals of 9 nucleotides; the
sequence was scrambled using the NDR randomisation. Table 4.3 shows the
average MFED across the entire genome of the 10 viruses. The threshold for
definition of a GORS virus is generally considered to be 5-6 %. All viruses are
predicted to be GORS viruses, although some may be considered borderline e.g.
WR960.
MNV1 MNV2 MNV3 MNV4 Lab12 Lab17 Lab18 Lab22 PSM1 WR960
Average
MFED
6.31% 8.52% 7.68% 7.95% 7.46% 8.17% 7.39% 7.11% 6.38% 5.12%
Table 4.3 Average MFED values along the length of almost the entire genome based on the MFED of 776 fragments of 300 nucleotides at intervals of 9 nucleotides from position 58 to 7318.
Figures 4.6 A-J show the average MFED of 11 consecutive fragments of nine
bases i.e. the average of fragments of 99-bases, along the length of the genome;
the mid-point of every nine-base fragment is therefore plotted against the
average of its MFED and the five fragments before and after it on the genome.
The columns are positioned at the mid-points of each fragment, the first at
position 245, the last at position 7150. Figure 4.7 shows a histogram of MFED
against nucleotide position for all fragments. All viruses analysed showed
predicted structures along the length of their genomes, so may be characterised
as GORS viruses, although throughout the genome there are some unstructured
areas.
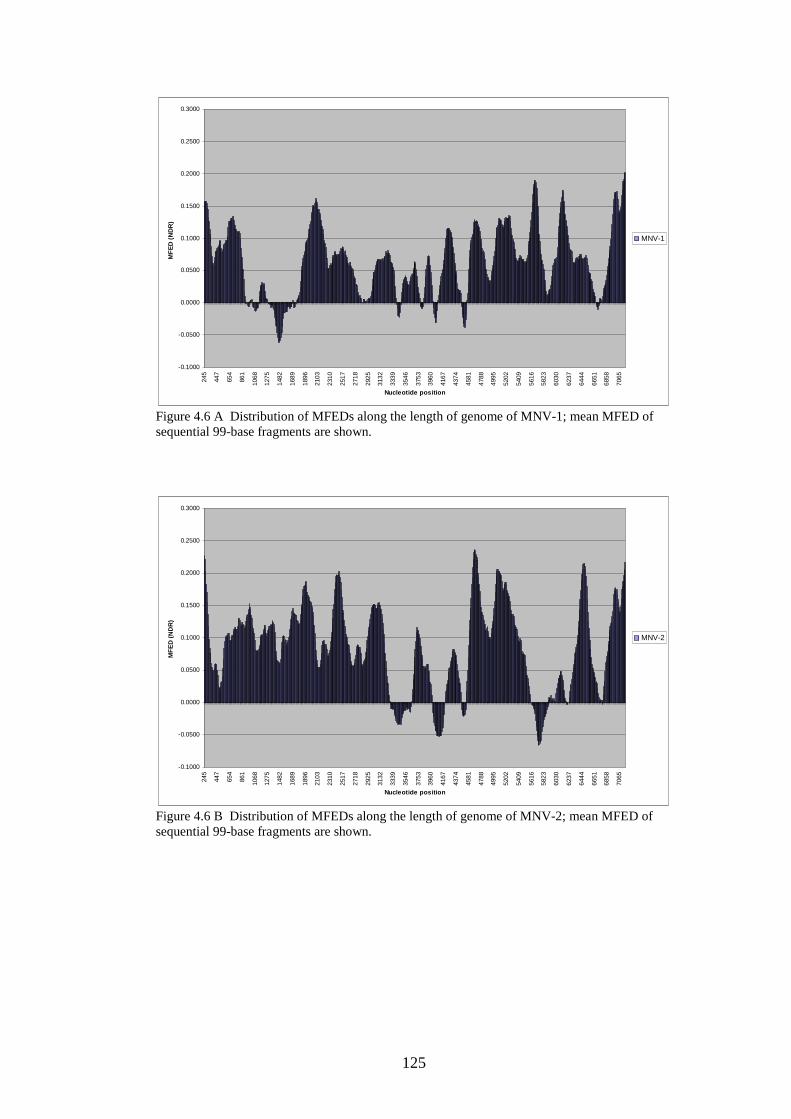
125
-0.1000
-0.0500
0.0000
0.0500
0.1000
0.1500
0.2000
0.2500
0.3000
245
447
654
861
1068
1275
1482
1689
1896
2103
2310
2517
2718
2925
3132
3339
3546
3753
3960
4167
4374
4581
4788
4995
5202
5409
5616
5823
6030
6237
6444
6651
6858
7065
Nucleotide position
MF
ED
(N
DR
) .
MNV-1
Figure 4.6 A Distribution of MFEDs along the length of genome of MNV-1; mean MFED of sequential 99-base fragments are shown.
-0.1000
-0.0500
0.0000
0.0500
0.1000
0.1500
0.2000
0.2500
0.3000
245
447
654
861
1068
1275
1482
1689
1896
2103
2310
2517
2718
2925
3132
3339
3546
3753
3960
4167
4374
4581
4788
4995
5202
5409
5616
5823
6030
6237
6444
6651
6858
7065
Nucleotide position
MF
ED
(N
DR
) .
MNV-2
Figure 4.6 B Distribution of MFEDs along the length of genome of MNV-2; mean MFED of sequential 99-base fragments are shown.
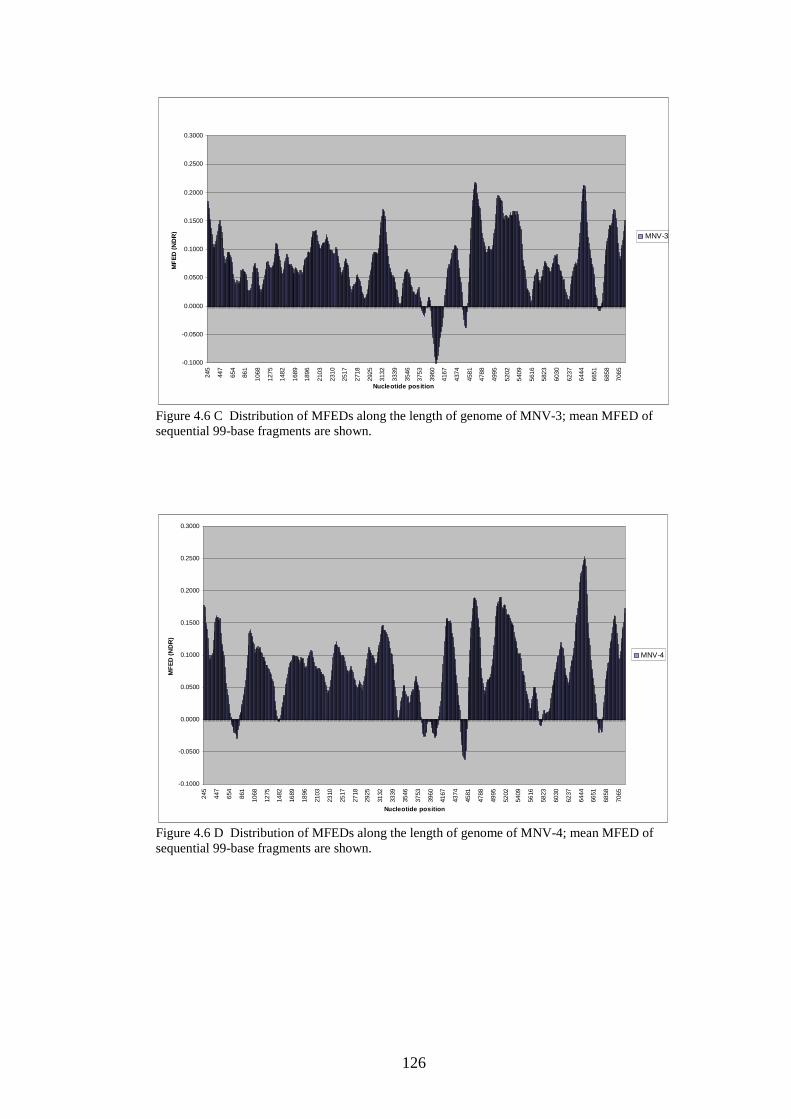
126
-0.1000
-0.0500
0.0000
0.0500
0.1000
0.1500
0.2000
0.2500
0.3000
245
447
654
861
1068
1275
1482
1689
1896
2103
2310
2517
2718
2925
3132
3339
3546
3753
3960
4167
4374
4581
4788
4995
5202
5409
5616
5823
6030
6237
6444
6651
6858
7065
Nucleotide position
MF
ED
(N
DR
) .
MNV-3
Figure 4.6 C Distribution of MFEDs along the length of genome of MNV-3; mean MFED of sequential 99-base fragments are shown.
-0.1000
-0.0500
0.0000
0.0500
0.1000
0.1500
0.2000
0.2500
0.3000
245
447
654
861
1068
1275
1482
1689
1896
2103
2310
2517
2718
2925
3132
3339
3546
3753
3960
4167
4374
4581
4788
4995
5202
5409
5616
5823
6030
6237
6444
6651
6858
7065
Nucleotide position
MF
ED
(N
DR
) .
MNV-4
Figure 4.6 D Distribution of MFEDs along the length of genome of MNV-4; mean MFED of sequential 99-base fragments are shown.
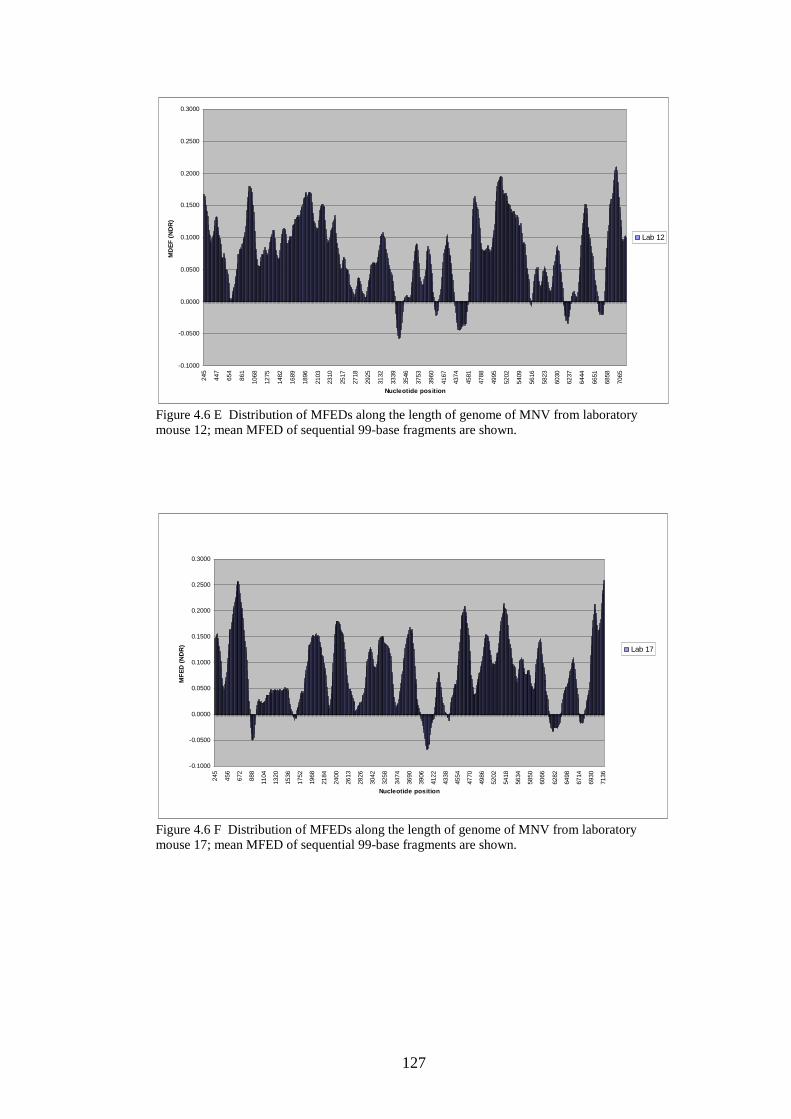
127
-0.1000
-0.0500
0.0000
0.0500
0.1000
0.1500
0.2000
0.2500
0.3000
245
447
654
861
1068
1275
1482
1689
1896
2103
2310
2517
2718
2925
3132
3339
3546
3753
3960
4167
4374
4581
4788
4995
5202
5409
5616
5823
6030
6237
6444
6651
6858
7065
Nucleotide position
MD
EF
(N
DR
) .
Lab 12
Figure 4.6 E Distribution of MFEDs along the length of genome of MNV from laboratory mouse 12; mean MFED of sequential 99-base fragments are shown.
-0.1000
-0.0500
0.0000
0.0500
0.1000
0.1500
0.2000
0.2500
0.3000
245
456
672
888
1104
1320
1536
1752
1968
2184
2400
2613
2826
3042
3258
3474
3690
3906
4122
4338
4554
4770
4986
5202
5418
5634
5850
6066
6282
6498
6714
6930
7136
Nucleotide position
MF
ED
(N
DR
) .
Lab 17
Figure 4.6 F Distribution of MFEDs along the length of genome of MNV from laboratory mouse 17; mean MFED of sequential 99-base fragments are shown.
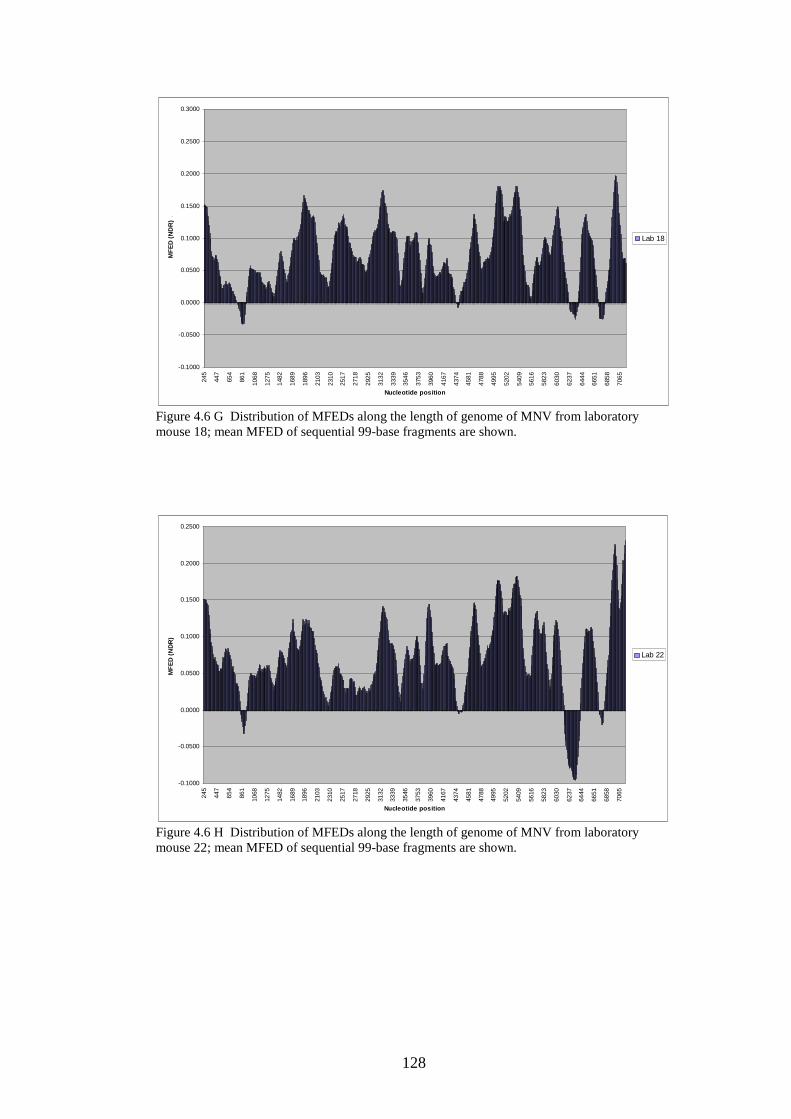
128
-0.1000
-0.0500
0.0000
0.0500
0.1000
0.1500
0.2000
0.2500
0.3000
245
447
654
861
1068
1275
1482
1689
1896
2103
2310
2517
2718
2925
3132
3339
3546
3753
3960
4167
4374
4581
4788
4995
5202
5409
5616
5823
6030
6237
6444
6651
6858
7065
Nucleotide position
MF
ED
(N
DR
) .
Lab 18
Figure 4.6 G Distribution of MFEDs along the length of genome of MNV from laboratory mouse 18; mean MFED of sequential 99-base fragments are shown.
-0.1000
-0.0500
0.0000
0.0500
0.1000
0.1500
0.2000
0.2500
245
447
654
861
1068
1275
1482
1689
1896
2103
2310
2517
2718
2925
3132
3339
3546
3753
3960
4167
4374
4581
4788
4995
5202
5409
5616
5823
6030
6237
6444
6651
6858
7065
Nucleotide position
MF
ED
(N
DR
) .
Lab 22
Figure 4.6 H Distribution of MFEDs along the length of genome of MNV from laboratory mouse 22; mean MFED of sequential 99-base fragments are shown.
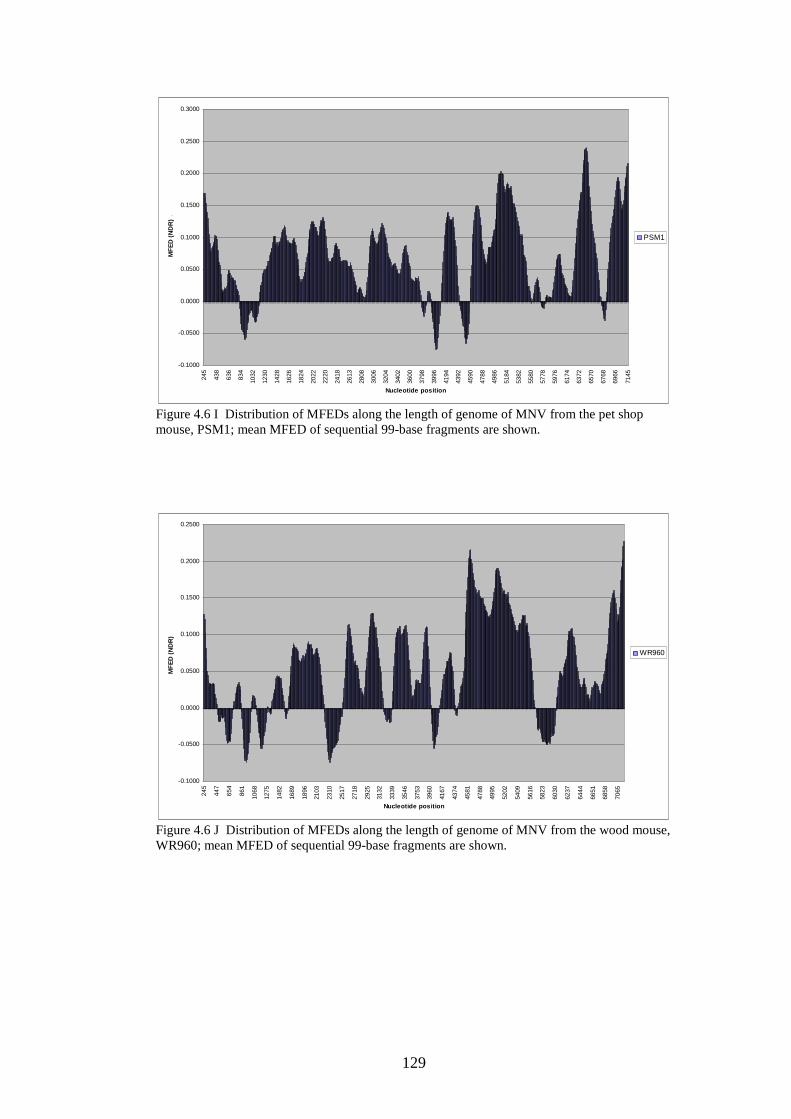
129
-0.1000
-0.0500
0.0000
0.0500
0.1000
0.1500
0.2000
0.2500
0.3000
245
438
636
834
1032
1230
1428
1626
1824
2022
2220
2418
2613
2808
3006
3204
3402
3600
3798
3996
4194
4392
4590
4788
4986
5184
5382
5580
5778
5976
6174
6372
6570
6768
6966
7145
Nucleotide position
MF
ED
(N
DR
) .
PSM1
Figure 4.6 I Distribution of MFEDs along the length of genome of MNV from the pet shop mouse, PSM1; mean MFED of sequential 99-base fragments are shown.
-0.1000
-0.0500
0.0000
0.0500
0.1000
0.1500
0.2000
0.2500
245
447
654
861
1068
1275
1482
1689
1896
2103
2310
2517
2718
2925
3132
3339
3546
3753
3960
4167
4374
4581
4788
4995
5202
5409
5616
5823
6030
6237
6444
6651
6858
7065
Nucleotide position
MF
ED
(N
DR
) .
WR960
Figure 4.6 J Distribution of MFEDs along the length of genome of MNV from the wood mouse, WR960; mean MFED of sequential 99-base fragments are shown.
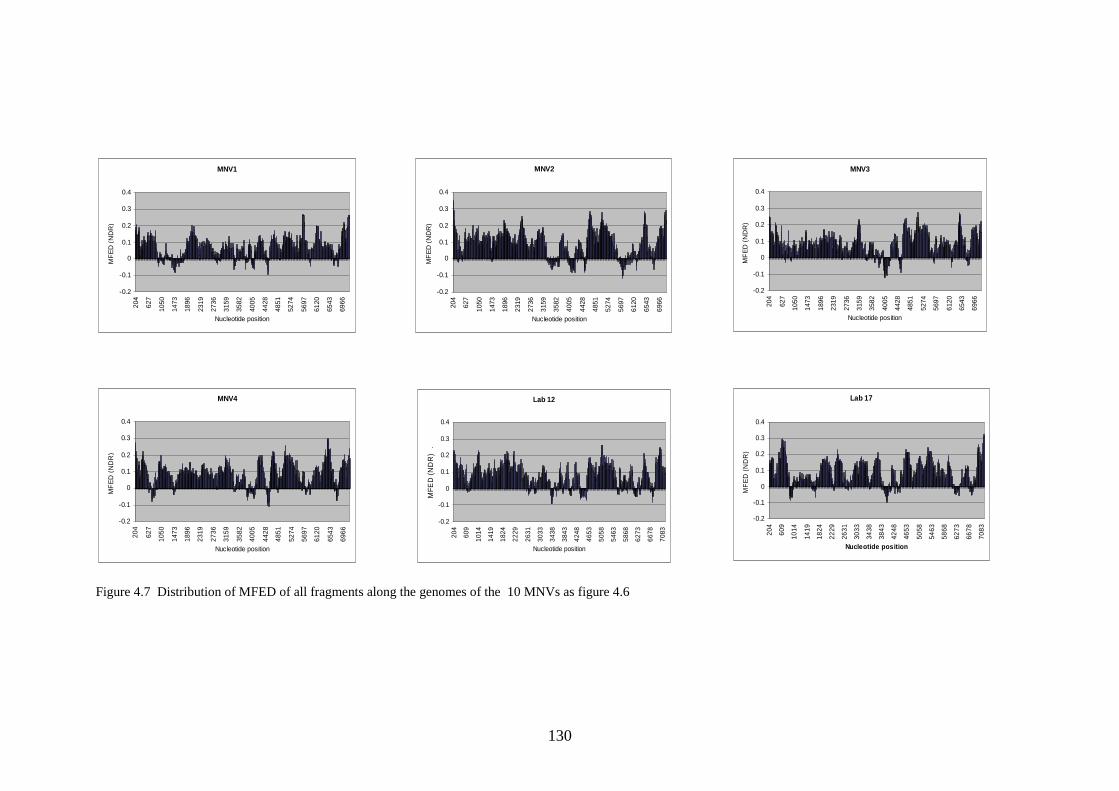
130
Figure 4.7 Distribution of MFED of all fragments along the genomes of the 10 MNVs as figure 4.6
MNV1
-0.2
-0.1
0
0.1
0.2
0.3
0.4
204
627
1050
1473
1896
2319
2736
3159
3582
4005
4428
4851
5274
5697
6120
6543
6966
Nucleotide position
MF
ED
(N
DR
)
.
MNV2
-0.2
-0.1
0
0.1
0.2
0.3
0.4
204
627
1050
1473
1896
2319
2736
3159
3582
4005
4428
4851
5274
5697
6120
6543
6966
Nucleotide position
MF
ED
(N
DR
) .
MNV3
-0.2
-0.1
0
0.1
0.2
0.3
0.4
204
627
1050
1473
1896
2319
2736
3159
3582
4005
4428
4851
5274
5697
6120
6543
6966
Nucleotide position
MF
ED
(N
DR
) .
MNV4
-0.2
-0.1
0
0.1
0.2
0.3
0.4
204
627
1050
1473
1896
2319
2736
3159
3582
4005
4428
4851
5274
5697
6120
6543
6966
Nucleotide position
MF
ED
(N
DR
) .
Lab 12
-0.2
-0.1
0
0.1
0.2
0.3
0.4
204
609
1014
1419
1824
2229
2631
3033
3438
3843
4248
4653
5058
5463
5868
6273
6678
7083
Nucleotide position
MFE
D (N
DR
) .
Lab 17
-0.2
-0.1
0
0.1
0.2
0.3
0.4
204
609
1014
1419
1824
2229
2631
3033
3438
3843
4248
4653
5058
5463
5868
6273
6678
7083
Nucleotide position
MF
ED
(N
DR
) .
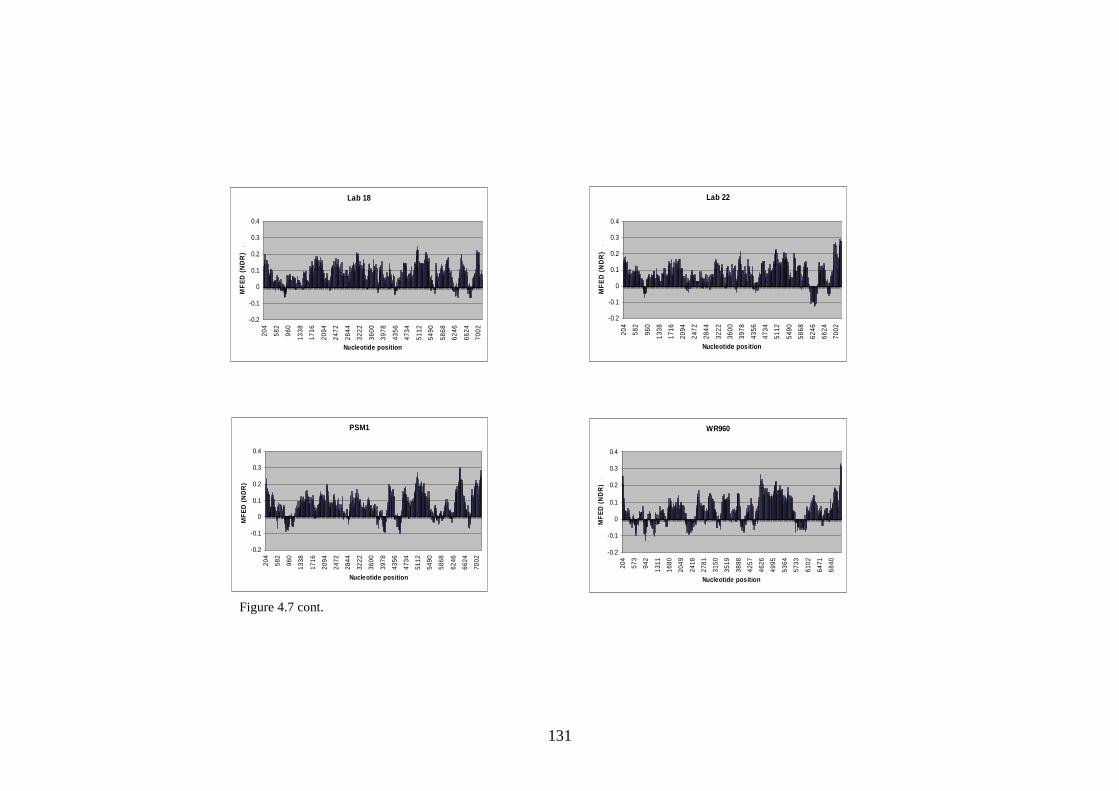
131
Figure 4.7 cont.
Lab 18
-0.2
-0.1
0
0.1
0.2
0.3
0.4
204
582
960
1338
1716
2094
2472
2844
3222
3600
3978
4356
4734
5112
5490
5868
6246
6624
7002
Nucleotide position
MF
ED
(N
DR
) .
Lab 22
-0.2
-0.1
0
0.1
0.2
0.3
0.4
204
582
960
1338
1716
2094
2472
2844
3222
3600
3978
4356
4734
5112
5490
5868
6246
6624
7002
Nucleotide position
MF
ED
(N
DR
) .
PSM1
-0.2
-0.1
0
0.1
0.2
0.3
0.4
204
582
960
1338
1716
2094
2472
2844
3222
3600
3978
4356
4734
5112
5490
5868
6246
6624
7002
Nucleotide position
MF
ED
(N
DR
) .
WR960
-0.2
-0.1
0
0.1
0.2
0.3
0.4
204
573
942
1311
1680
2049
2418
2781
3150
3519
3888
4257
4626
4995
5364
5733
6102
6471
6840
Nucleotide position
MF
ED
(N
DR
) .
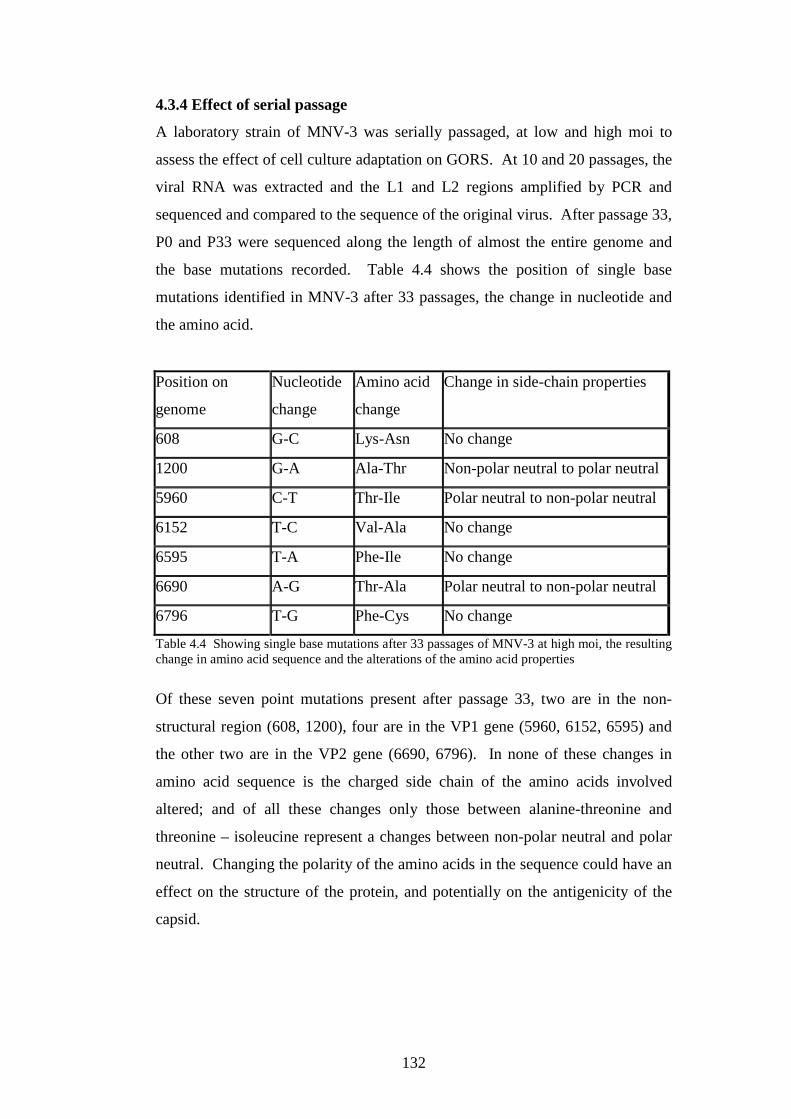
132
4.3.4 Effect of serial passage
A laboratory strain of MNV-3 was serially passaged, at low and high moi to
assess the effect of cell culture adaptation on GORS. At 10 and 20 passages, the
viral RNA was extracted and the L1 and L2 regions amplified by PCR and
sequenced and compared to the sequence of the original virus. After passage 33,
P0 and P33 were sequenced along the length of almost the entire genome and
the base mutations recorded. Table 4.4 shows the position of single base
mutations identified in MNV-3 after 33 passages, the change in nucleotide and
the amino acid.
Position on
genome
Nucleotide
change
Amino acid
change
Change in side-chain properties
608 G-C Lys-Asn No change
1200 G-A Ala-Thr Non-polar neutral to polar neutral
5960 C-T Thr-Ile Polar neutral to non-polar neutral
6152 T-C Val-Ala No change
6595 T-A Phe-Ile No change
6690 A-G Thr-Ala Polar neutral to non-polar neutral
6796 T-G Phe-Cys No change
Table 4.4 Showing single base mutations after 33 passages of MNV-3 at high moi, the resulting change in amino acid sequence and the alterations of the amino acid properties
Of these seven point mutations present after passage 33, two are in the non-
structural region (608, 1200), four are in the VP1 gene (5960, 6152, 6595) and
the other two are in the VP2 gene (6690, 6796). In none of these changes in
amino acid sequence is the charged side chain of the amino acids involved
altered; and of all these changes only those between alanine-threonine and
threonine – isoleucine represent a changes between non-polar neutral and polar
neutral. Changing the polarity of the amino acids in the sequence could have an
effect on the structure of the protein, and potentially on the antigenicity of the
capsid.
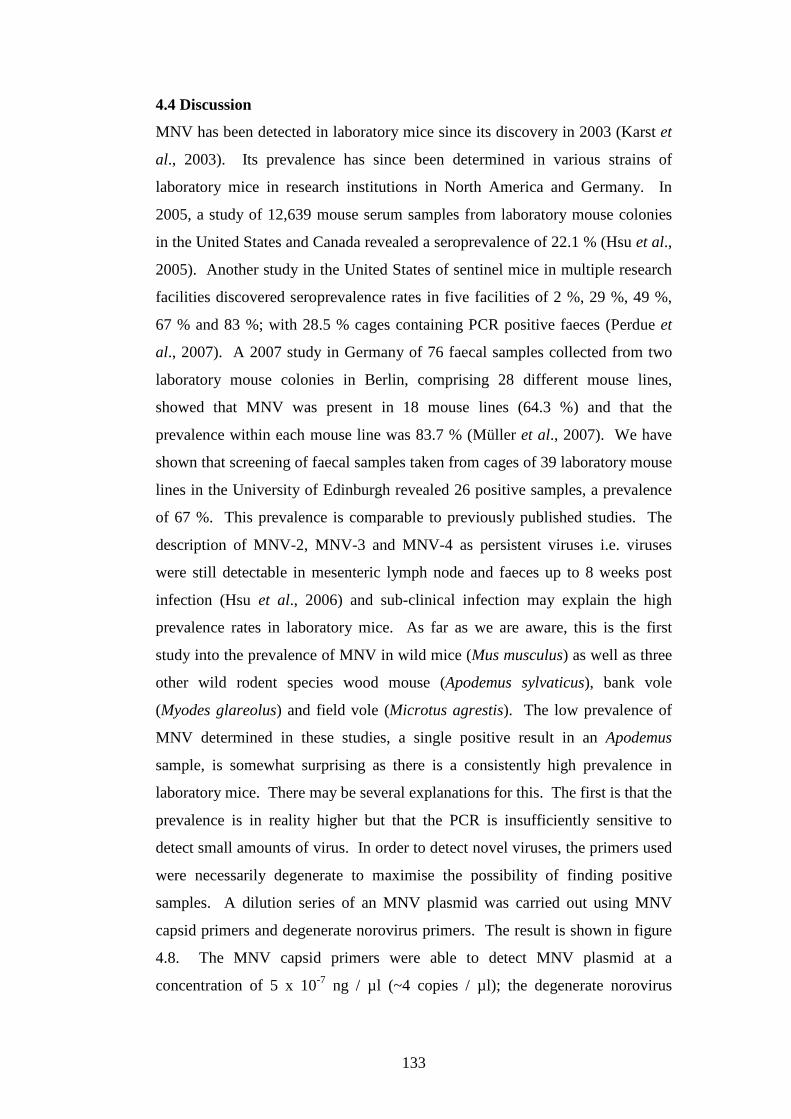
133
4.4 Discussion
MNV has been detected in laboratory mice since its discovery in 2003 (Karst et
al., 2003). Its prevalence has since been determined in various strains of
laboratory mice in research institutions in North America and Germany. In
2005, a study of 12,639 mouse serum samples from laboratory mouse colonies
in the United States and Canada revealed a seroprevalence of 22.1 % (Hsu et al.,
2005). Another study in the United States of sentinel mice in multiple research
facilities discovered seroprevalence rates in five facilities of 2 %, 29 %, 49 %,
67 % and 83 %; with 28.5 % cages containing PCR positive faeces (Perdue et
al., 2007). A 2007 study in Germany of 76 faecal samples collected from two
laboratory mouse colonies in Berlin, comprising 28 different mouse lines,
showed that MNV was present in 18 mouse lines (64.3 %) and that the
prevalence within each mouse line was 83.7 % (Müller et al., 2007). We have
shown that screening of faecal samples taken from cages of 39 laboratory mouse
lines in the University of Edinburgh revealed 26 positive samples, a prevalence
of 67 %. This prevalence is comparable to previously published studies. The
description of MNV-2, MNV-3 and MNV-4 as persistent viruses i.e. viruses
were still detectable in mesenteric lymph node and faeces up to 8 weeks post
infection (Hsu et al., 2006) and sub-clinical infection may explain the high
prevalence rates in laboratory mice. As far as we are aware, this is the first
study into the prevalence of MNV in wild mice (Mus musculus) as well as three
other wild rodent species wood mouse (Apodemus sylvaticus), bank vole
(Myodes glareolus) and field vole (Microtus agrestis). The low prevalence of
MNV determined in these studies, a single positive result in an Apodemus
sample, is somewhat surprising as there is a consistently high prevalence in
laboratory mice. There may be several explanations for this. The first is that the
prevalence is in reality higher but that the PCR is insufficiently sensitive to
detect small amounts of virus. In order to detect novel viruses, the primers used
were necessarily degenerate to maximise the possibility of finding positive
samples. A dilution series of an MNV plasmid was carried out using MNV
capsid primers and degenerate norovirus primers. The result is shown in figure
4.8. The MNV capsid primers were able to detect MNV plasmid at a
concentration of 5 x 10⁻⁷ ng / µl (~4 copies / µl); the degenerate norovirus
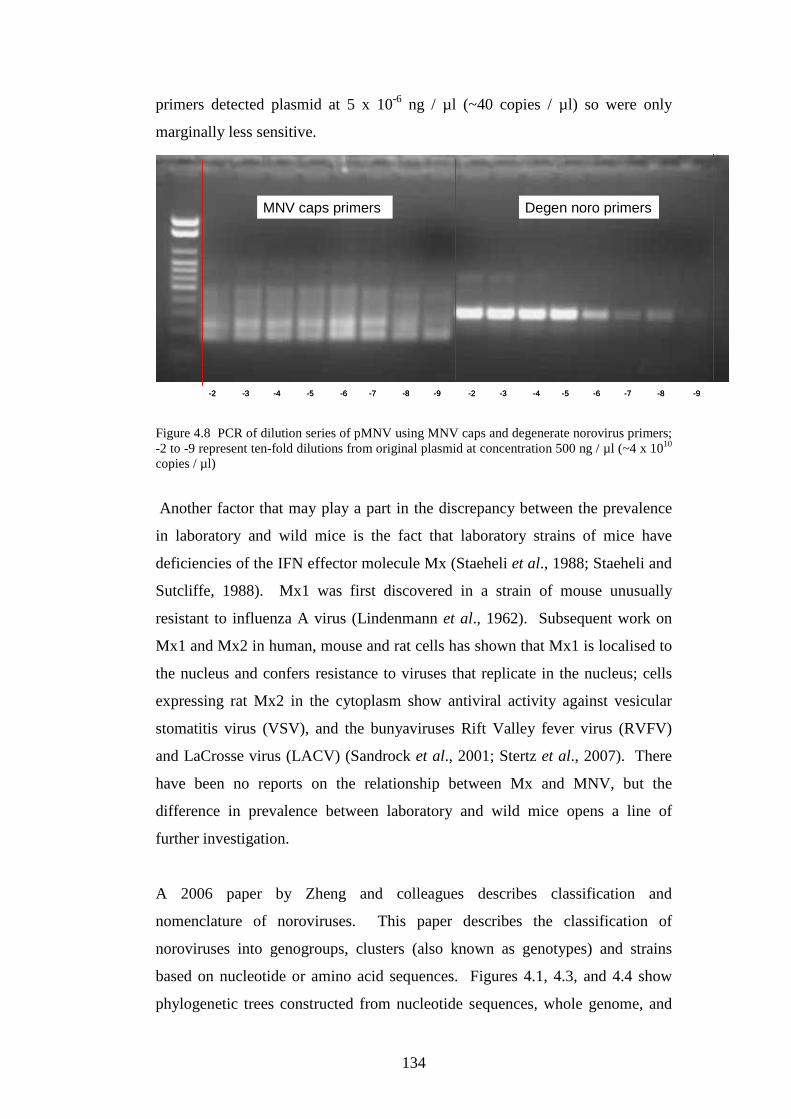
134
primers detected plasmid at 5 x 10⁻⁶ ng / µl (~40 copies / µl) so were only
marginally less sensitive.
Figure 4.8 PCR of dilution series of pMNV using MNV caps and degenerate norovirus primers; -2 to -9 represent ten-fold dilutions from original plasmid at concentration 500 ng / µl (~4 x 10¹⁰ copies / µl)
Another factor that may play a part in the discrepancy between the prevalence
in laboratory and wild mice is the fact that laboratory strains of mice have
deficiencies of the IFN effector molecule Mx (Staeheli et al., 1988; Staeheli and
Sutcliffe, 1988). Mx1 was first discovered in a strain of mouse unusually
resistant to influenza A virus (Lindenmann et al., 1962). Subsequent work on
Mx1 and Mx2 in human, mouse and rat cells has shown that Mx1 is localised to
the nucleus and confers resistance to viruses that replicate in the nucleus; cells
expressing rat Mx2 in the cytoplasm show antiviral activity against vesicular
stomatitis virus (VSV), and the bunyaviruses Rift Valley fever virus (RVFV)
and LaCrosse virus (LACV) (Sandrock et al., 2001; Stertz et al., 2007). There
have been no reports on the relationship between Mx and MNV, but the
difference in prevalence between laboratory and wild mice opens a line of
further investigation.
A 2006 paper by Zheng and colleagues describes classification and
nomenclature of noroviruses. This paper describes the classification of
noroviruses into genogroups, clusters (also known as genotypes) and strains
based on nucleotide or amino acid sequences. Figures 4.1, 4.3, and 4.4 show
phylogenetic trees constructed from nucleotide sequences, whole genome, and
-2 -3 -4 -5 -6 -7 -8 -9 -2 -3 -4 -5 -6 -7 -8 -9
MNV caps primers Degen noro primers
-2 -3 -4 -5 -6 -7 -8 -9 -2 -3 -4 -5 -6 -7 -8 -9
MNV caps primers Degen noro primers
135
~750 base fragments of the non-structural and structural regions respectively.
They show that the MNVs detected in the laboratory faecal samples and the pet
shop mice cluster together with the previously published MNV sequences. The
sample from the wood mouse though is clearly not as closely associated with the
other sequences. These relationships are repeated in trees made from amino
acid sequences. Figure 4.2, a tree made from the almost complete amino acid
sequence of four novel MNVs discovered in laboratory mice, the pet shop mice
and the wild mouse, has an almost identical pattern to the tree made from
nucleotides sequences. Figure 4.5 is a phylogenetic tree constructed from the
amino acid sequence of the VP1 protein of every genetic cluster/genotype of
norovirus throughout the 5 genogroups, including the novel MNVs sequenced in
this study. The wood mouse MNV appears to be separate from the other MNVs
on the tree, but perhaps just as significantly it does fall within the MNV
genogroup, genogroup V, demonstrating that this PCR positive sample from the
wood mouse faeces was not a contaminant from a human, porcine or bovine
norovirus that the wood mouse had consumed. It is likely, therefore, that this
novel MNV was infecting the wood mouse. The classification scheme
described in Zheng et al., 2006 is based on the amino acid sequence of the major
capsid protein VP1, encoded by the sub-genomic ORF2. The most divergent
region of the norovirus genome, and consequently the amino acid sequence, is
found in the fourth segment of the of P2 domain (Zheng et al., 2006). This is to
be expected as this is the antigenic region of the capsid and therefore will be
under the greatest evolutionary pressure from the interaction of virus and host
immunity. The classification scheme described is based on the uncorrected
distance method of the complete capsid amino acid sequence as is as follows:
Strain - 0 – 14.1 %
Cluster - 14.3 – 43.8 %
Genogroup- 45.0 – 61.4 %
Table 4.1 shows the p distances all the 6 novel MNVs to have been almost
entirely sequenced along all other complete MNV sequences published on
GenBank. The status of the MNV from the wood mouse is of most interest as
its position on the phylogenetic trees, separate from the other MNVs, raises the
possibility that it may be a new member of a new genetic cluster within
norovirus genogroup V. In table 4.1, the left-hand most column, in bold,
136
contains the p distance values of the wood mouse MNV as compared to every
other MNV. The values range from 22-23 %, whereas the p distance between
all the other MNVs range from 0 – 13 %. Table 4.2 shows the p distances based
on the amino acid sequence of the capsid VP1 protein of the 6 novel MNVs
identified in this study, along with 12 other previously published MNVs. The
wood mouse MNV is again represented in the left-hand column in bold. The p
distances between the wood mouse MNV and the others range from 14 -16 %,
whereas the values between all the other MNV range from 0 – 7%. According
to the classification scheme proposed by Zheng et al., this MNV identified in the
wood mouse faecal sample may well represent the first member of the new
genetic cluster of the MNV genogroup of noroviruses, genogroup V. A much
wider study of wild rodents and additional positive samples that could be
sequenced and analysed phylogenetically would be necessary to determine if
there is indeed a second cluster of MNV present in wild rodents. This discovery
certainly makes that likely.
Prediction of secondary structure by an energy minimisation algorithm was
carried out on four published MNV sequences, MNV-1, MNV-2, MNV-3 and
MNV-4, as well as four newly sequenced MNVs identified by us in laboratory
mouse faecal samples, the pet shop mouse faecal sample and wood mouse faecal
sample. Figures 4.6 A-J and 4.7 demonstrated the presence of predicted
structure throughout the length of the genomes of all the MNV sequences
analysed, the defining feature of GORS. The average MFED of all the viruses
analysed was above 6 %, a threshold above which viruses may be considered to
be a GORS virus, except for the wood mouse MNV, which was just below that
value at 5.12 %. The definition of viruses as GORS or non-GORS by average
MFED is somewhat arbitrary and the presence of predicted structured regions
throughout the length of the genome is probably of greater significance. As
structural prediction programs continue to advance it may be possible to more
accurately detect specific RNA structures such as stem-loops and pseudoknots
more accurately. It is interesting that throughout the genomes are certain areas
where there is no predicted structure, but these unstructured regions are not
necessarily at the same location of the genome across all the MNVs analysed
137
Recent work by Davis et al., (Davis et al., 2008) characterises the physical
nature of GORS and supports the thermodynamic predictions. In this study
biotin-labelled oligonucleotide probes, designed to hybridise to viral genomic
RNA transcripts along the length of the genomes, were used in an accessibility
study. This study demonstrated that GORS virus genomes are less accessible to
probes, and that non-GORS transcripts are significantly more accessible to the
probes. One of the viral RNA transcripts used in that study was MNV; the
pattern of probe binding was that the majority of the genome was inaccessible
but for occasional areas of accessibility. The secondary structure predictions in
this study are consistent with that finding. Davis and colleagues also
demonstrated, by inserting the L segment of bunyamwera virus (BV), a non-
GORS virus, into HCV, a GORS virus, that the BV segment was still accessible
to probes, whereas the flanking HCV genome was still inaccessible to its probes.
The interpretation was that GORS consists of a sequence of discrete secondary
structures along the length of the genome and is less likely to be a global RNA
structure dependant on tertiary structure. The predicted structured regions along
the MNV genomes in this study are therefore probably similar in nature, and are
likely to be a series of discrete secondary structure motifs such as stem-loops.
The presence of extensive secondary structure in the wood mouse MNV is also
consistent the observed distribution of GORS. GORS appears from all studies
so far to be conserved within genera or virus groups, although virus families
may contain GORS and non-GORS genera. Within the family Caliciviridae, the
genus Norovirus contains five distinct genogroups. Human noroviruses are
predicted to be non-GORS viruses and infection causes an acute and quickly
resolved illness. MNV is a GORS virus which is persistent in its natural host.
The classification of the wood mouse norovirus as an MNV, meant that its
classification also as a GORS virus was expected.
The association of GORS with persistence led to the hypothesis that it confers
an evolutionary advantage to those viruses that are GORS by, in some way,
protecting the virus from being cleared by the host’s immune response. As
viruses undergo adaptations in cell culture the passage study was designed to
assess the impact of multiple passage on the presence of GORS in MNV. The
result was that after 33 passages at high moi there were only seven base
138
mutations, a mutation rate of 0.1 %. This was not considered significant enough
to warrant bioinformatics analysis as it was considered unlikely that this degree
of sequence drift would alter the secondary structure predictions. The
hypothesis was that in cell culture, with no pressure from a fully intact immune
system in an animal, that the advantage that viruses gain from maintaining
extensive secondary structure in their RNA genomes would be lost, and that a
GORS virus would lose its widespread structure. One interpretation of the result
of this study is that the RAW 264.7 cells, in which MNV is propagated, do not
constitute an environment in which the pressure to maintain GORS has been
lost. The base mutations that were observed lead to non-synonymous changes in
the amino acid sequence, and three of those changes three were changes that
included an alteration in polarity if the side chain. RNA viruses replicate their
genomes using RNA dependant RNA polymerases which have no proof-reading
capacity, so throughout the course of multiple passage it is likely that many
mutations occur that are detrimental to the virus, so are never passed on. The
changes observed have been selected by the conditions present in the cell culture
system. The nature of the evolutionary pressure operating on viruses in cell
culture is different from those found in animals. In order to investigate this
further it would be necessary to repeat this study in cell lines in which various
parts of the innate immune system had been knocked-out or knocked-down or
otherwise inhibited. The relationship between GORS and innate immunity will
be discussed later, but a recent study has shown that MNV-1 is detected in
dendritic cells by MDA-5 (McCartney et al., 2008). It is not known if the same
is true of MNV infection of macrophages, the primary cell type that MNV
replicates in, although dendritic cells are related to macrophages. A study in
which the various parts of the MDA-5 cascade in IFN-β induction were knocked
out of RAW 264.7 cells, a murine macrophage cell line, and the effect on
mutation rate and degree of secondary structure in MNV may help to shed light
on the biological relationship between the presence of GORS in viral genomes
and the ability of GORS viruses to persist in their natural hosts.
139
Chapter 5 A Study of the Interactions of GORS
and non-GORS RNA Transcripts With Cellular
RNA Stability Mechanisms and Innate Cellular
Immunity
5.1 Introduction 5.2 Objectives 5.3 Results 5.4 Discussion 5.5 Future work
140
Chapter 5 A Study of the Interactions of GORS and non-GORS RNA
Transcripts With Cellular RNA Stability Mechanisms and Innate Cellular
Immunity
5.1 Introduction
The observation that viruses that have GORS are able to establish persistent
infections led to speculation about possible mechanisms by which the presence
of extensive secondary structure throughout the RNA genome might lead to
persistence. In the original study describing the discovery of GORS (Simmonds
et al, 2004) potential mechanisms are discussed in relation to the interactions
between RNA and the cellular innate immune machinery. Eukaryotic cells and
viruses have been co-evolving throughout the history of life on earth and there
are many mechanisms that cells have evolved to counter viruses, and viruses
have evolved as many means of avoiding those mechanisms.
Plants and many invertebrates use RNA interference (RNAi) as an innate
antiviral mechanism. Infection by RNA viruses results in the production of long
dsRNAs, e.g. the replicatory intermediate. The RNAi mechanism first described
by Napoli et al. in 1990(reviewed by Umbach and Cullen, 2009) consist of these
long dsRNAs being cleaved by Dicer resulting in a pool of small, ~22 base pair,
dsRNAs. One strand of these RNAs, called siRNA duplexes, is loaded onto the
RNA-induced silencing complex (RISC). RISC then binds via the RNA to
complementary mRNA, viral and/or cellular, resulting in degradation. Plant and
invertebrate viruses have evolved mechanisms to counter the RNAi system e.g.
tomato bushy stunt virus p19 protein binds 21 base pair dsRNA to prevent its
being associated with RISC (Scholthof, 2006).
The most important innate immune system in mammalian cells is the IFN
response and whether RNAi is used as an antiviral mechanism is unclear.
dsRNA produced by viruses during infection is the most important pathogen
associated molecular pattern (PAMP) to induce IFN (Marcus, 1983). The
pattern recognition receptors (PRRs) responsible for detecting dsRNA are
TLR3, which detects intraendosomal dsRNA (Alexopoulou et al., 2001); and the
cytoplasmic receptors RIG-I and MDA-5 (Yoneyama et al., 2004; Andrejeva et
141
al., 2004). These receptors feed into two transductions cascades that act through
NF-κB and IRF-3 which act on the IFN-β promoter resulting in the expression
of IFN-β (as discussed earlier and reviewed by Randall and Goodbourn, 2008).
Of the IFN induced antiviral effectors, PKR and 2’5’-OAS are also stimulated
by dsRNA. Stimulation of 2’5’-OAS leads to the activation of the
endoribonuclease RNase L (Zhou et al., 1993). RNase L has a role in antiviral
immunity by cleaving viral and cellular RNAs, creating short RNAs. It has been
reported that these short RNAs, especially of cellular origin, are then detected
by RIG-I or MDA-5 leading to further IFN induction (Malathi et al., 2007).
The mechanisms by which the GORS leads to persistence have been speculated
to be to shield the viral RNA in some way from the cell’s PPRs. Many viruses
are able to establish persistent infections by evasion of innate and/or adaptive
immunity by producing proteins that inhibit various parts of the IFN response;
from inhibition of IFN induction to inhibition of IFN stimulated enzymes.
Evasion of immunity does not necessarily lead to persistence though, as many
non-persistent viruses have evolved strategies to avoid the effects of the various
antiviral cellular mechanisms. dsRNA can be degraded or sequestered during
several viral infections (see table 1.2), reducing the degree of IFN induction.
We speculated that the evolution of GORS in those virus genera that have it,
gives those viruses an advantage as this feature of their RNA genomes would
enable them to evade detection, perhaps by mimicking cellular RNAs that also
have structured elements. We hypothesised that upon viral infection of a cell
and uncoating of the genome, genomic RNA from GORS viruses would induce
a weaker IFN response than genomic the RNA from non-GORS viruses. The
main challenge in testing this hypothesis is that GORS is a phenomenon that
exists in some genera of positive sense RNA virus families, but not others,
across several families. In order to investigate a biological role of GORS we
needed to select a panel of RNA viruses that were predicted to be GORS and
non-GORS. Studying active infections by viruses from different families, which
may have different replication strategies and grow in different cell lines, makes
a direct comparison between a GORS group and non-GORS group difficult. In
order to study the effect of GORS alone, RNA transcripts were made of the
genomes of a panel of predicted GORS and non-GORS viruses. These
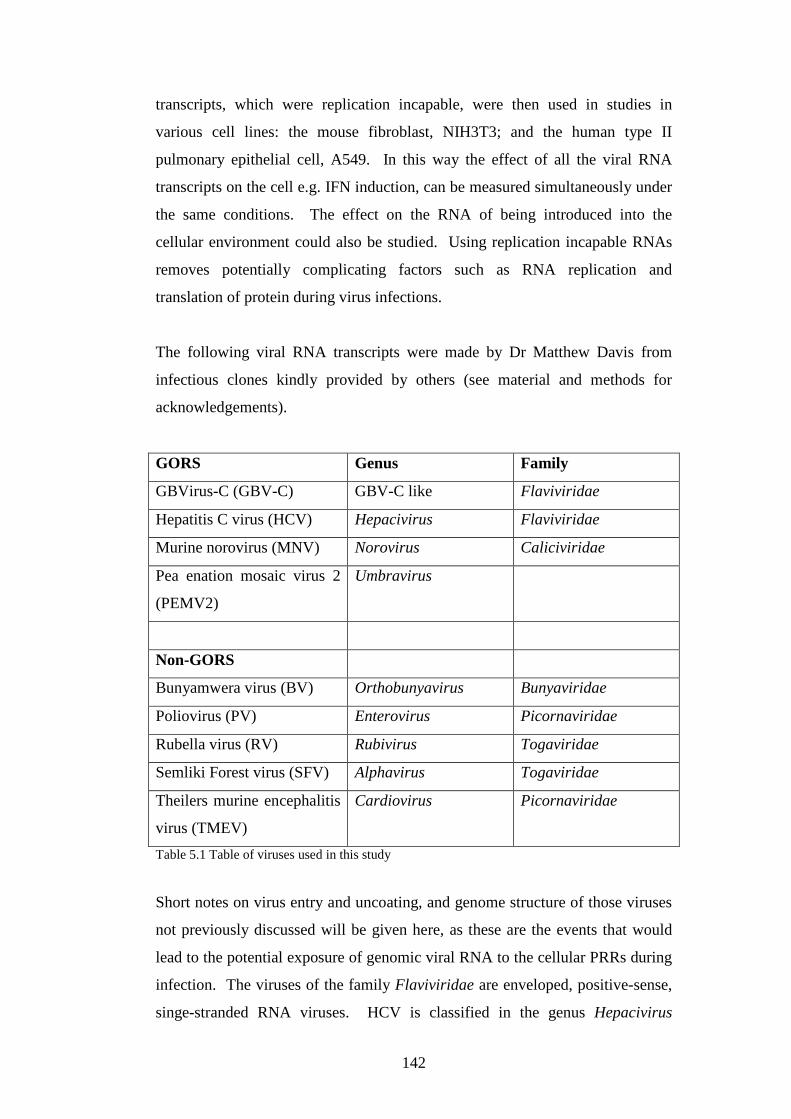
142
transcripts, which were replication incapable, were then used in studies in
various cell lines: the mouse fibroblast, NIH3T3; and the human type II
pulmonary epithelial cell, A549. In this way the effect of all the viral RNA
transcripts on the cell e.g. IFN induction, can be measured simultaneously under
the same conditions. The effect on the RNA of being introduced into the
cellular environment could also be studied. Using replication incapable RNAs
removes potentially complicating factors such as RNA replication and
translation of protein during virus infections.
The following viral RNA transcripts were made by Dr Matthew Davis from
infectious clones kindly provided by others (see material and methods for
acknowledgements).
GORS Genus Family
GBVirus-C (GBV-C) GBV-C like Flaviviridae
Hepatitis C virus (HCV) Hepacivirus Flaviviridae
Murine norovirus (MNV) Norovirus Caliciviridae
Pea enation mosaic virus 2
(PEMV2)
Umbravirus
Non-GORS
Bunyamwera virus (BV) Orthobunyavirus Bunyaviridae
Poliovirus (PV) Enterovirus Picornaviridae
Rubella virus (RV) Rubivirus Togaviridae
Semliki Forest virus (SFV) Alphavirus Togaviridae
Theilers murine encephalitis
virus (TMEV)
Cardiovirus Picornaviridae
Table 5.1 Table of viruses used in this study
Short notes on virus entry and uncoating, and genome structure of those viruses
not previously discussed will be given here, as these are the events that would
lead to the potential exposure of genomic viral RNA to the cellular PRRs during
infection. The viruses of the family Flaviviridae are enveloped, positive-sense,
singe-stranded RNA viruses. HCV is classified in the genus Hepacivirus
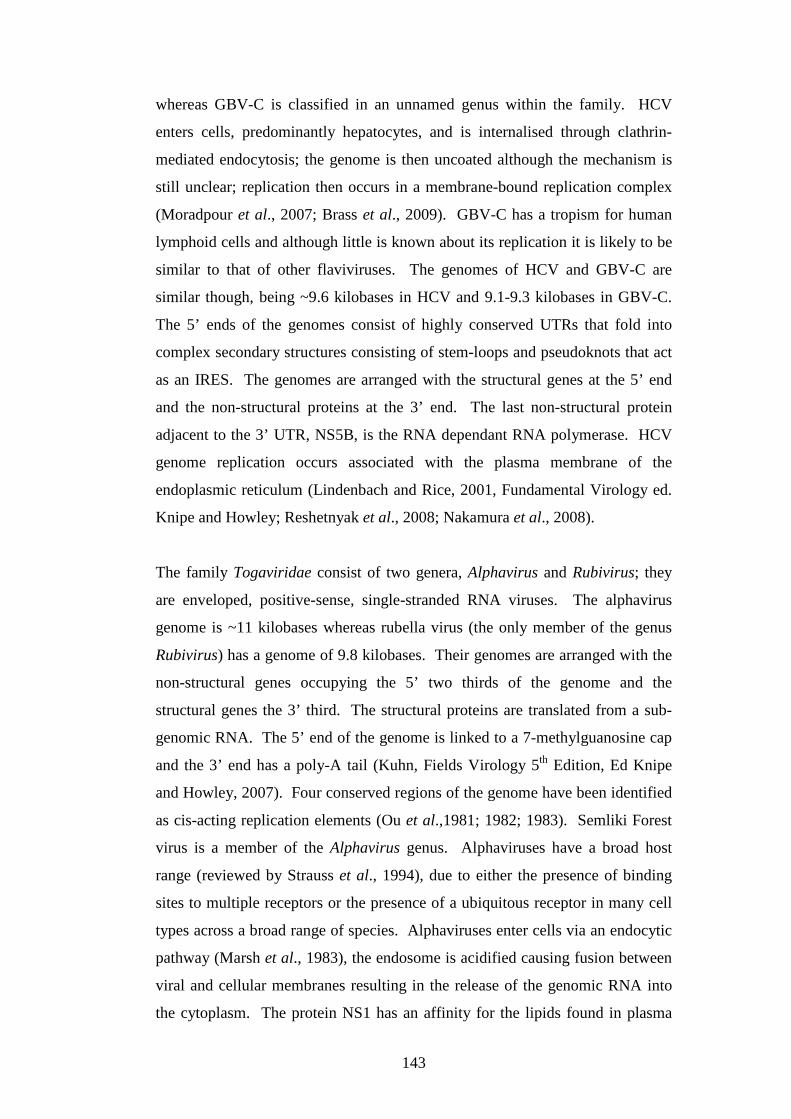
143
whereas GBV-C is classified in an unnamed genus within the family. HCV
enters cells, predominantly hepatocytes, and is internalised through clathrin-
mediated endocytosis; the genome is then uncoated although the mechanism is
still unclear; replication then occurs in a membrane-bound replication complex
(Moradpour et al., 2007; Brass et al., 2009). GBV-C has a tropism for human
lymphoid cells and although little is known about its replication it is likely to be
similar to that of other flaviviruses. The genomes of HCV and GBV-C are
similar though, being ~9.6 kilobases in HCV and 9.1-9.3 kilobases in GBV-C.
The 5’ ends of the genomes consist of highly conserved UTRs that fold into
complex secondary structures consisting of stem-loops and pseudoknots that act
as an IRES. The genomes are arranged with the structural genes at the 5’ end
and the non-structural proteins at the 3’ end. The last non-structural protein
adjacent to the 3’ UTR, NS5B, is the RNA dependant RNA polymerase. HCV
genome replication occurs associated with the plasma membrane of the
endoplasmic reticulum (Lindenbach and Rice, 2001, Fundamental Virology ed.
Knipe and Howley; Reshetnyak et al., 2008; Nakamura et al., 2008).
The family Togaviridae consist of two genera, Alphavirus and Rubivirus; they
are enveloped, positive-sense, single-stranded RNA viruses. The alphavirus
genome is ~11 kilobases whereas rubella virus (the only member of the genus
Rubivirus) has a genome of 9.8 kilobases. Their genomes are arranged with the
non-structural genes occupying the 5’ two thirds of the genome and the
structural genes the 3’ third. The structural proteins are translated from a sub-
genomic RNA. The 5’ end of the genome is linked to a 7-methylguanosine cap
and the 3’ end has a poly-A tail (Kuhn, Fields Virology 5th Edition, Ed Knipe
and Howley, 2007). Four conserved regions of the genome have been identified
as cis-acting replication elements (Ou et al.,1981; 1982; 1983). Semliki Forest
virus is a member of the Alphavirus genus. Alphaviruses have a broad host
range (reviewed by Strauss et al., 1994), due to either the presence of binding
sites to multiple receptors or the presence of a ubiquitous receptor in many cell
types across a broad range of species. Alphaviruses enter cells via an endocytic
pathway (Marsh et al., 1983), the endosome is acidified causing fusion between
viral and cellular membranes resulting in the release of the genomic RNA into
the cytoplasm. The protein NS1 has an affinity for the lipids found in plasma
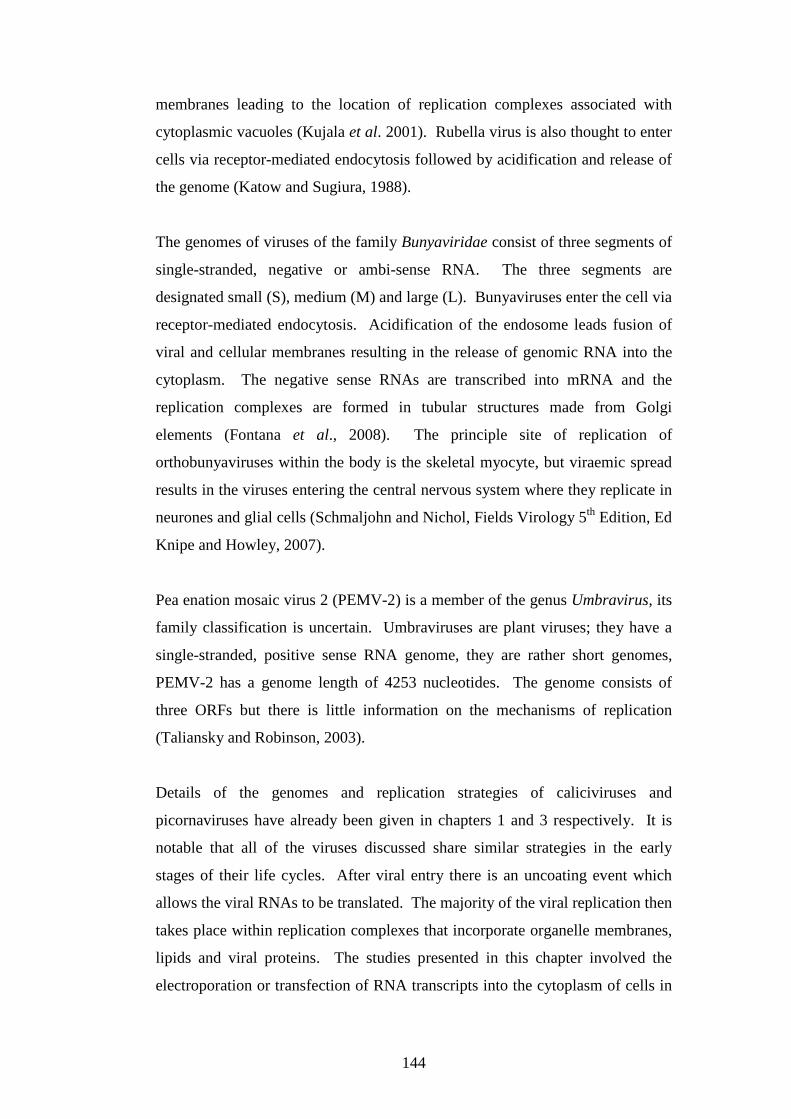
144
membranes leading to the location of replication complexes associated with
cytoplasmic vacuoles (Kujala et al. 2001). Rubella virus is also thought to enter
cells via receptor-mediated endocytosis followed by acidification and release of
the genome (Katow and Sugiura, 1988).
The genomes of viruses of the family Bunyaviridae consist of three segments of
single-stranded, negative or ambi-sense RNA. The three segments are
designated small (S), medium (M) and large (L). Bunyaviruses enter the cell via
receptor-mediated endocytosis. Acidification of the endosome leads fusion of
viral and cellular membranes resulting in the release of genomic RNA into the
cytoplasm. The negative sense RNAs are transcribed into mRNA and the
replication complexes are formed in tubular structures made from Golgi
elements (Fontana et al., 2008). The principle site of replication of
orthobunyaviruses within the body is the skeletal myocyte, but viraemic spread
results in the viruses entering the central nervous system where they replicate in
neurones and glial cells (Schmaljohn and Nichol, Fields Virology 5th Edition, Ed
Knipe and Howley, 2007).
Pea enation mosaic virus 2 (PEMV-2) is a member of the genus Umbravirus, its
family classification is uncertain. Umbraviruses are plant viruses; they have a
single-stranded, positive sense RNA genome, they are rather short genomes,
PEMV-2 has a genome length of 4253 nucleotides. The genome consists of
three ORFs but there is little information on the mechanisms of replication
(Taliansky and Robinson, 2003).
Details of the genomes and replication strategies of caliciviruses and
picornaviruses have already been given in chapters 1 and 3 respectively. It is
notable that all of the viruses discussed share similar strategies in the early
stages of their life cycles. After viral entry there is an uncoating event which
allows the viral RNAs to be translated. The majority of the viral replication then
takes place within replication complexes that incorporate organelle membranes,
lipids and viral proteins. The studies presented in this chapter involved the
electroporation or transfection of RNA transcripts into the cytoplasm of cells in
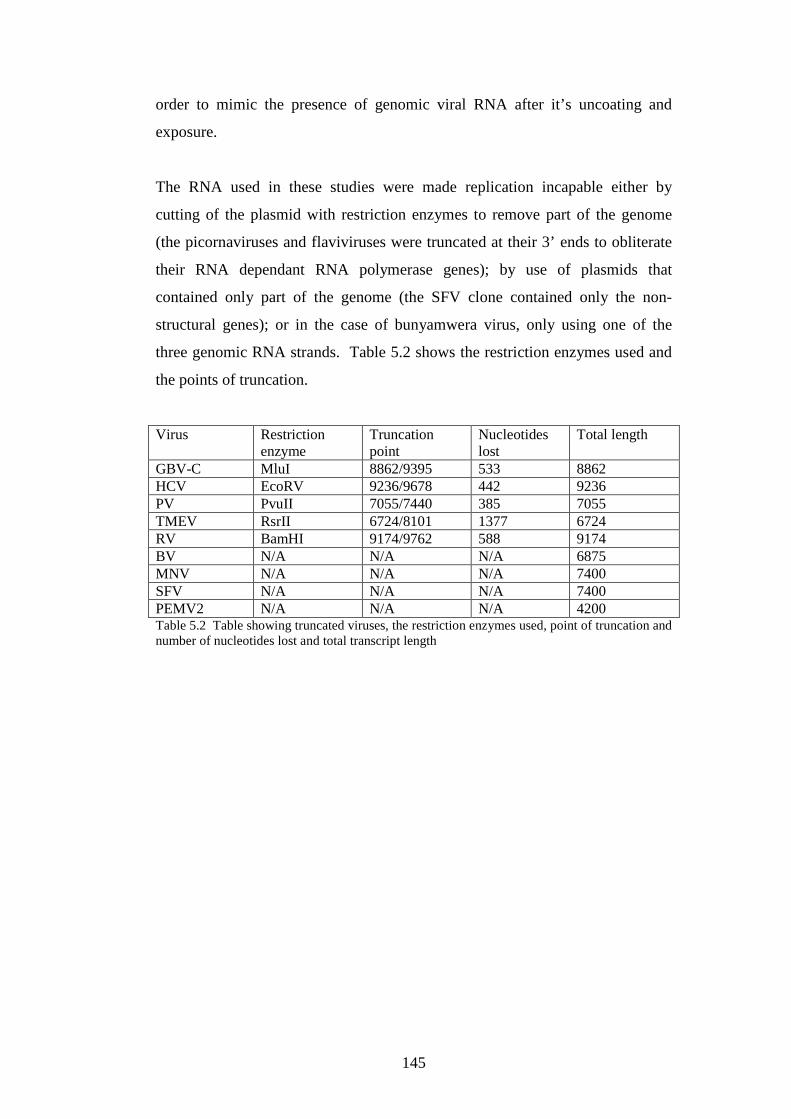
145
order to mimic the presence of genomic viral RNA after it’s uncoating and
exposure.
The RNA used in these studies were made replication incapable either by
cutting of the plasmid with restriction enzymes to remove part of the genome
(the picornaviruses and flaviviruses were truncated at their 3’ ends to obliterate
their RNA dependant RNA polymerase genes); by use of plasmids that
contained only part of the genome (the SFV clone contained only the non-
structural genes); or in the case of bunyamwera virus, only using one of the
three genomic RNA strands. Table 5.2 shows the restriction enzymes used and
the points of truncation.
Virus Restriction enzyme
Truncation point
Nucleotides lost
Total length
GBV-C MluI 8862/9395 533 8862 HCV EcoRV 9236/9678 442 9236 PV PvuII 7055/7440 385 7055 TMEV RsrII 6724/8101 1377 6724 RV BamHI 9174/9762 588 9174 BV N/A N/A N/A 6875 MNV N/A N/A N/A 7400 SFV N/A N/A N/A 7400 PEMV2 N/A N/A N/A 4200 Table 5.2 Table showing truncated viruses, the restriction enzymes used, point of truncation and number of nucleotides lost and total transcript length
146
5.2 Objectives
1. Study of RNA stability in GORS and non-GORS viruses
The rate of RNA creation and degradation is one of the most important means of
regulation of gene expression in the cell (reviewed by Garneau et al., 2007).
Cellular mRNAs have 5’ 7-methylguanosine caps and 3’ poly(A) tails, and their
degradation is normally carried out by exonucleases from either end. We
hypothesised that GORS viruses would be less susceptible to ribonuclease
degradation, allowing the genomes to exist for longer in the cytoplasm so that
replication could be continuous in a persistent infection. In this study, 500 ng of
the full length or truncated transcripts of 3 GORS viruses and 3 non-GORS
viruses were electroporated into NIH3T3 cells and their degradation measured
over 72 hours by quantitative PCR.
2. Study of IFN-β induction in GORS and non-GORS viruses
The hypothesis is that GORS viral RNA transcripts induce IFN-β less strongly
than non-GORS viral RNA transcripts. To test this hypothesis the full
length/truncated transcripts were transfected into cells and the level of IFN-β
induction measured 18 hours post-transfection by two methods: quantitative
real-time PCR and by a luciferase reporter assay. All studies using the
luciferase reporter system were conducted in collaboration with Dr Selena
Sagan.
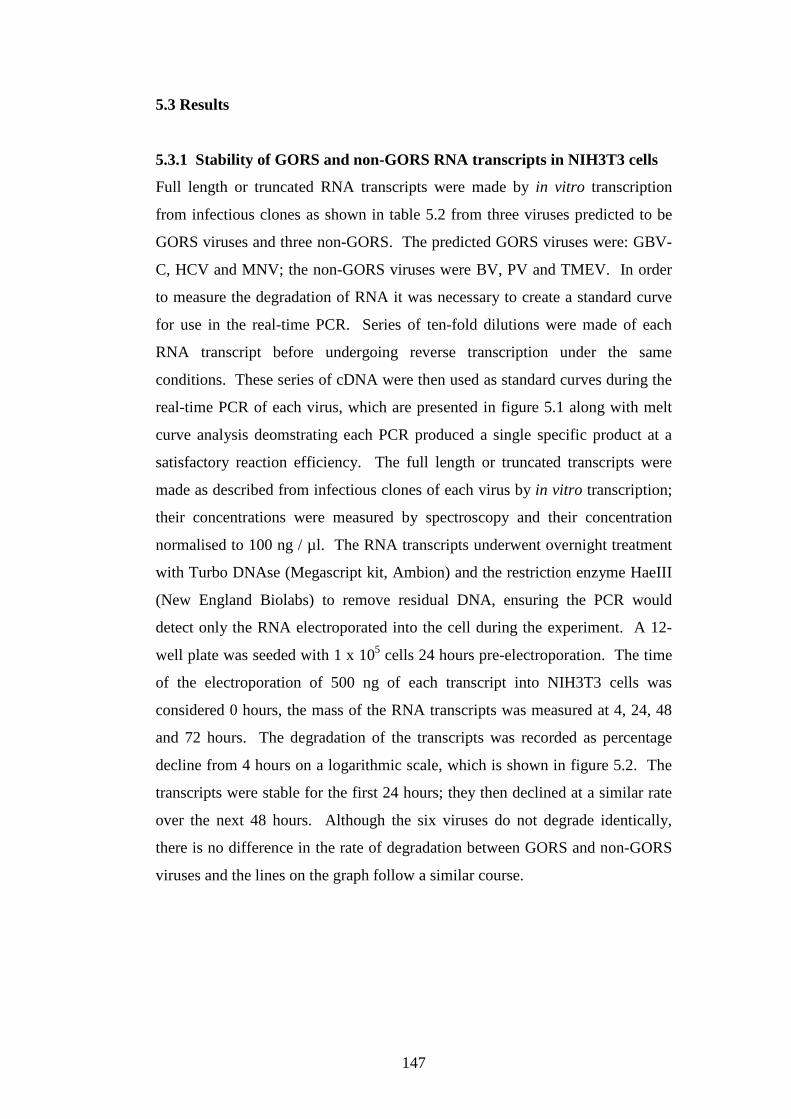
147
5.3 Results
5.3.1 Stability of GORS and non-GORS RNA transcripts in NIH3T3 cells
Full length or truncated RNA transcripts were made by in vitro transcription
from infectious clones as shown in table 5.2 from three viruses predicted to be
GORS viruses and three non-GORS. The predicted GORS viruses were: GBV-
C, HCV and MNV; the non-GORS viruses were BV, PV and TMEV. In order
to measure the degradation of RNA it was necessary to create a standard curve
for use in the real-time PCR. Series of ten-fold dilutions were made of each
RNA transcript before undergoing reverse transcription under the same
conditions. These series of cDNA were then used as standard curves during the
real-time PCR of each virus, which are presented in figure 5.1 along with melt
curve analysis deomstrating each PCR produced a single specific product at a
satisfactory reaction efficiency. The full length or truncated transcripts were
made as described from infectious clones of each virus by in vitro transcription;
their concentrations were measured by spectroscopy and their concentration
normalised to 100 ng / µl. The RNA transcripts underwent overnight treatment
with Turbo DNAse (Megascript kit, Ambion) and the restriction enzyme HaeIII
(New England Biolabs) to remove residual DNA, ensuring the PCR would
detect only the RNA electroporated into the cell during the experiment. A 12-
well plate was seeded with 1 x 10⁵ cells 24 hours pre-electroporation. The time
of the electroporation of 500 ng of each transcript into NIH3T3 cells was
considered 0 hours, the mass of the RNA transcripts was measured at 4, 24, 48
and 72 hours. The degradation of the transcripts was recorded as percentage
decline from 4 hours on a logarithmic scale, which is shown in figure 5.2. The
transcripts were stable for the first 24 hours; they then declined at a similar rate
over the next 48 hours. Although the six viruses do not degrade identically,
there is no difference in the rate of degradation between GORS and non-GORS
viruses and the lines on the graph follow a similar course.
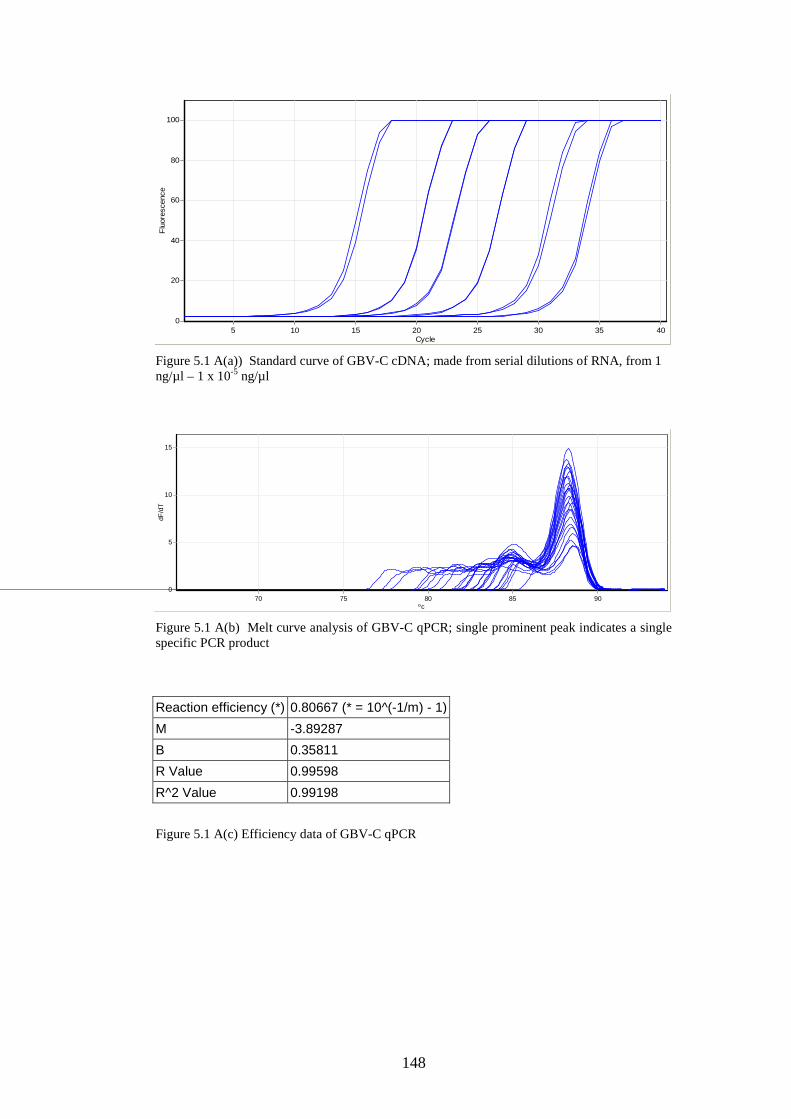
148
Cycle5 10 15 20 25 30 35 40
Flu
ores
cenc
e
100
80
60
40
20
0
Figure 5.1 A(a)) Standard curve of GBV-C cDNA; made from serial dilutions of RNA, from 1 ng/µl – 1 x 10⁻⁵ ng/µl
ºc70 75 80 85 90
dF/d
T
15
10
5
0
Figure 5.1 A(b) Melt curve analysis of GBV-C qPCR; single prominent peak indicates a single specific PCR product
Reaction efficiency (*) 0.80667 (* = 10^(-1/m) - 1)
M -3.89287
B 0.35811
R Value 0.99598
R^2 Value 0.99198
Figure 5.1 A(c) Efficiency data of GBV-C qPCR
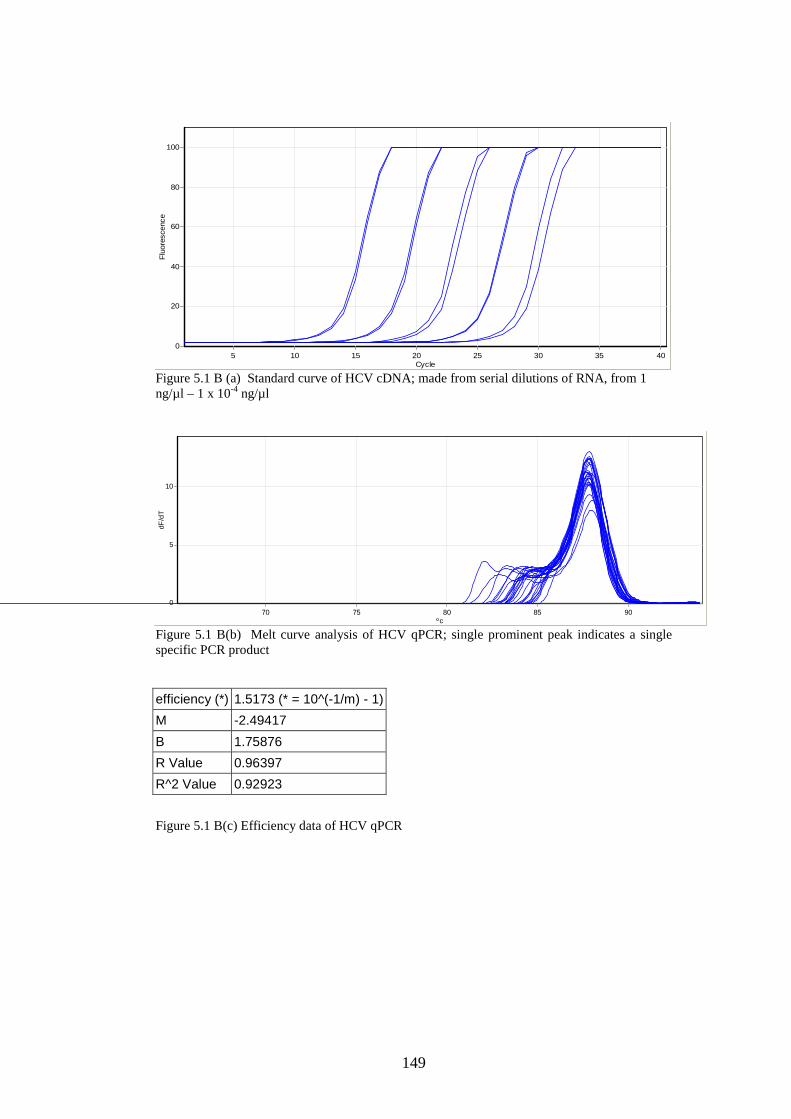
149
Cycle5 10 15 20 25 30 35 40
Flu
ores
cenc
e
100
80
60
40
20
0
Figure 5.1 B (a) Standard curve of HCV cDNA; made from serial dilutions of RNA, from 1 ng/µl – 1 x 10⁻⁴ ng/µl
ºc70 75 80 85 90
dF/d
T
10
5
0
Figure 5.1 B(b) Melt curve analysis of HCV qPCR; single prominent peak indicates a single specific PCR product
efficiency (*) 1.5173 (* = 10^(-1/m) - 1)
M -2.49417
B 1.75876
R Value 0.96397
R^2 Value 0.92923
Figure 5.1 B(c) Efficiency data of HCV qPCR
150
Cycle5 10 15 20 25 30 35 40
Flu
ores
cenc
e
100
80
60
40
20
0
Figure 5.1C (a) Standard curve of MNV cDNA; made from serial dilutions of RNA, from 1 ng/µl – 1 x 10⁻⁶ ng/µl
ºc70 75 80 85 90
dF/d
T
20
15
10
5
0
Figure 5.1 C(b) Melt curve analysis of MNV qPCR; single prominent peak indicates a single specific PCR product
Reaction efficiency (*) 1.02593 (* = 10^(-1/m) - 1)
M -3.26132
B -2.4031
R Value 0.99928
R^2 Value 0.99857 Figure 5.1 C(c) Efficiency data of MNV qPCR
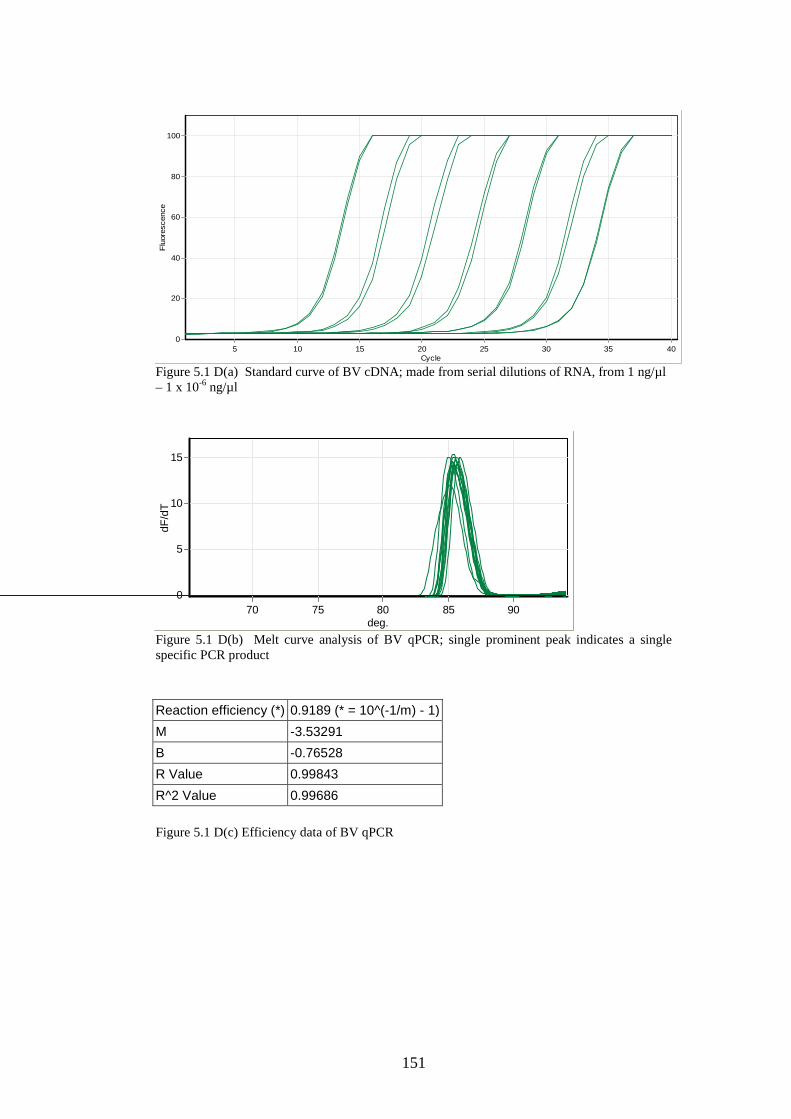
151
Cycle5 10 15 20 25 30 35 40
Flu
ores
cenc
e
100
80
60
40
20
0
Figure 5.1 D(a) Standard curve of BV cDNA; made from serial dilutions of RNA, from 1 ng/µl – 1 x 10⁻⁶ ng/µl
deg.70 75 80 85 90
dF/d
T
15
10
5
0
Figure 5.1 D(b) Melt curve analysis of BV qPCR; single prominent peak indicates a single specific PCR product Reaction efficiency (*) 0.9189 (* = 10^(-1/m) - 1)
M -3.53291
B -0.76528
R Value 0.99843
R^2 Value 0.99686
Figure 5.1 D(c) Efficiency data of BV qPCR
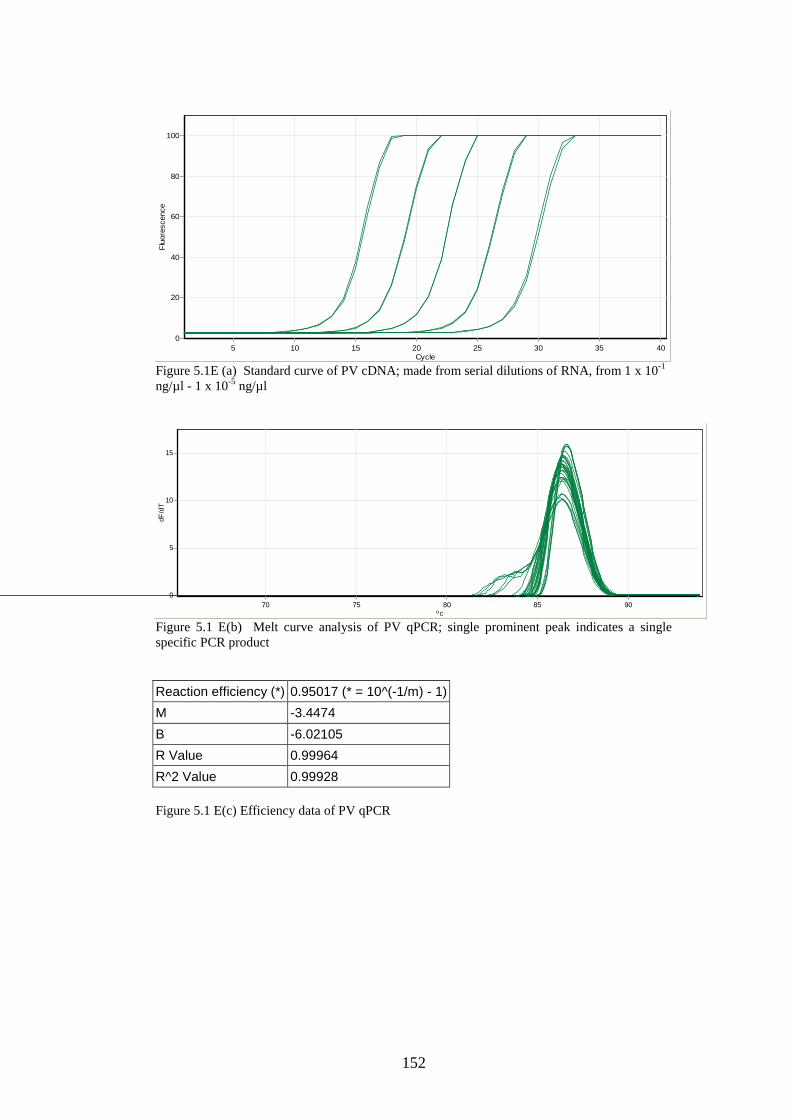
152
Cycle5 10 15 20 25 30 35 40
Flu
ores
cenc
e
100
80
60
40
20
0
Figure 5.1E (a) Standard curve of PV cDNA; made from serial dilutions of RNA, from 1 x 10⁻¹ ng/µl - 1 x 10⁻⁵ ng/µl
ºc70 75 80 85 90
dF/d
T
15
10
5
0
Figure 5.1 E(b) Melt curve analysis of PV qPCR; single prominent peak indicates a single specific PCR product
Reaction efficiency (*) 0.95017 (* = 10^(-1/m) - 1)
M -3.4474
B -6.02105
R Value 0.99964
R^2 Value 0.99928 Figure 5.1 E(c) Efficiency data of PV qPCR
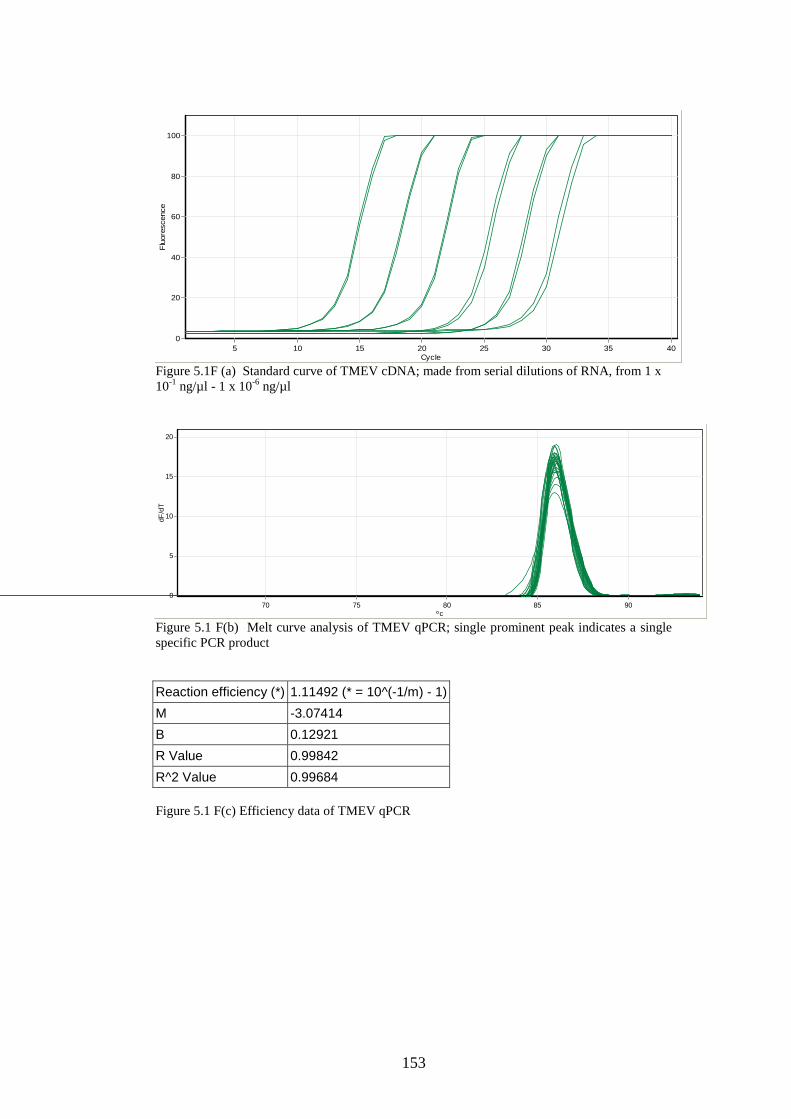
153
Cycle5 10 15 20 25 30 35 40
Flu
ores
cenc
e
100
80
60
40
20
0
Figure 5.1F (a) Standard curve of TMEV cDNA; made from serial dilutions of RNA, from 1 x 10⁻¹ ng/µl - 1 x 10⁻⁶ ng/µl
ºc70 75 80 85 90
dF/d
T
20
15
10
5
0
Figure 5.1 F(b) Melt curve analysis of TMEV qPCR; single prominent peak indicates a single specific PCR product
Reaction efficiency (*) 1.11492 (* = 10^(-1/m) - 1)
M -3.07414
B 0.12921
R Value 0.99842
R^2 Value 0.99684 Figure 5.1 F(c) Efficiency data of TMEV qPCR
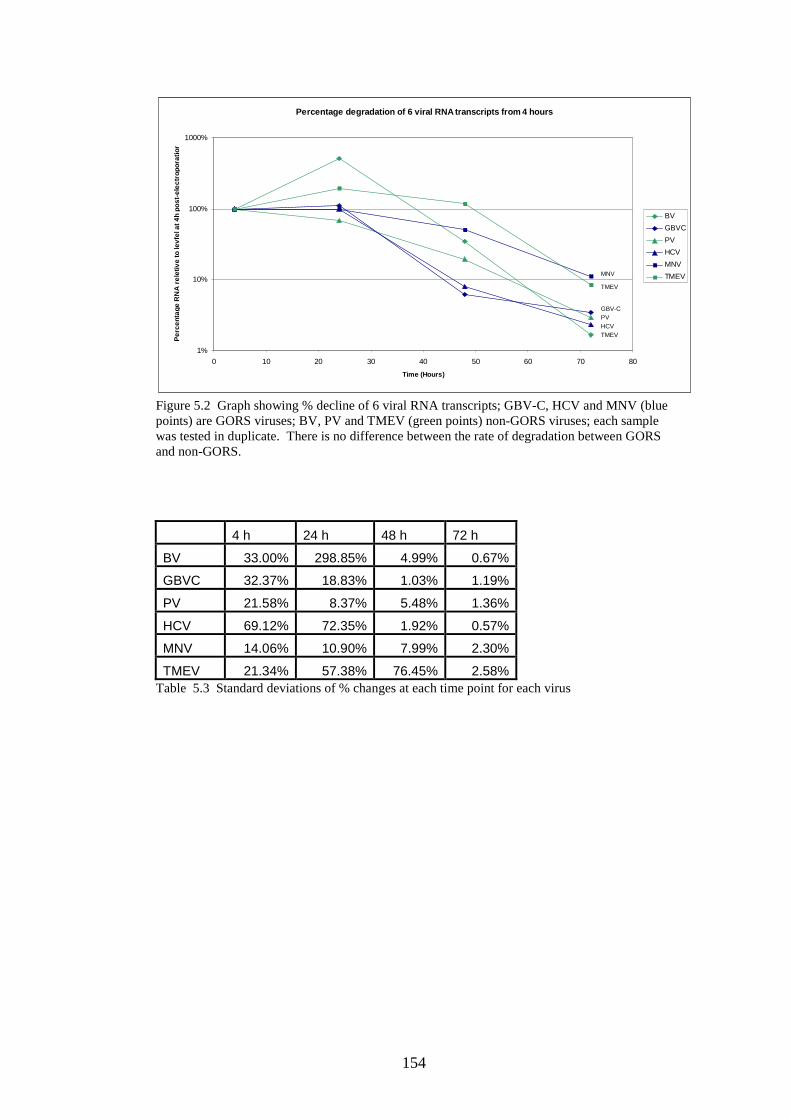
154
Figure 5.2 Graph showing % decline of 6 viral RNA transcripts; GBV-C, HCV and MNV (blue points) are GORS viruses; BV, PV and TMEV (green points) non-GORS viruses; each sample was tested in duplicate. There is no difference between the rate of degradation between GORS and non-GORS.
4 h 24 h 48 h 72 h
BV 33.00% 298.85% 4.99% 0.67%
GBVC 32.37% 18.83% 1.03% 1.19%
PV 21.58% 8.37% 5.48% 1.36%
HCV 69.12% 72.35% 1.92% 0.57%
MNV 14.06% 10.90% 7.99% 2.30%
TMEV 21.34% 57.38% 76.45% 2.58% Table 5.3 Standard deviations of % changes at each time point for each virus
Percentage degradation of 6 viral RNA transcripts f rom 4 hours
1%
10%
100%
1000%
0 10 20 30 40 50 60 70 80
Time (Hours)
Pe
rce
nta
ge R
NA
re
letiv
e to
levf
el a
t 4h
post
-ele
ctr
opor
atio
n
BV
GBVC
PV
HCV
MNV
TMEVMNV
TMEV
GBV-CPVHCVTMEV
Percentage degradation of 6 viral RNA transcripts f rom 4 hours
1%
10%
100%
1000%
0 10 20 30 40 50 60 70 80
Time (Hours)
Pe
rce
nta
ge R
NA
re
letiv
e to
levf
el a
t 4h
post
-ele
ctr
opor
atio
n
BV
GBVC
PV
HCV
MNV
TMEVMNV
TMEV
GBV-CPVHCVTMEV
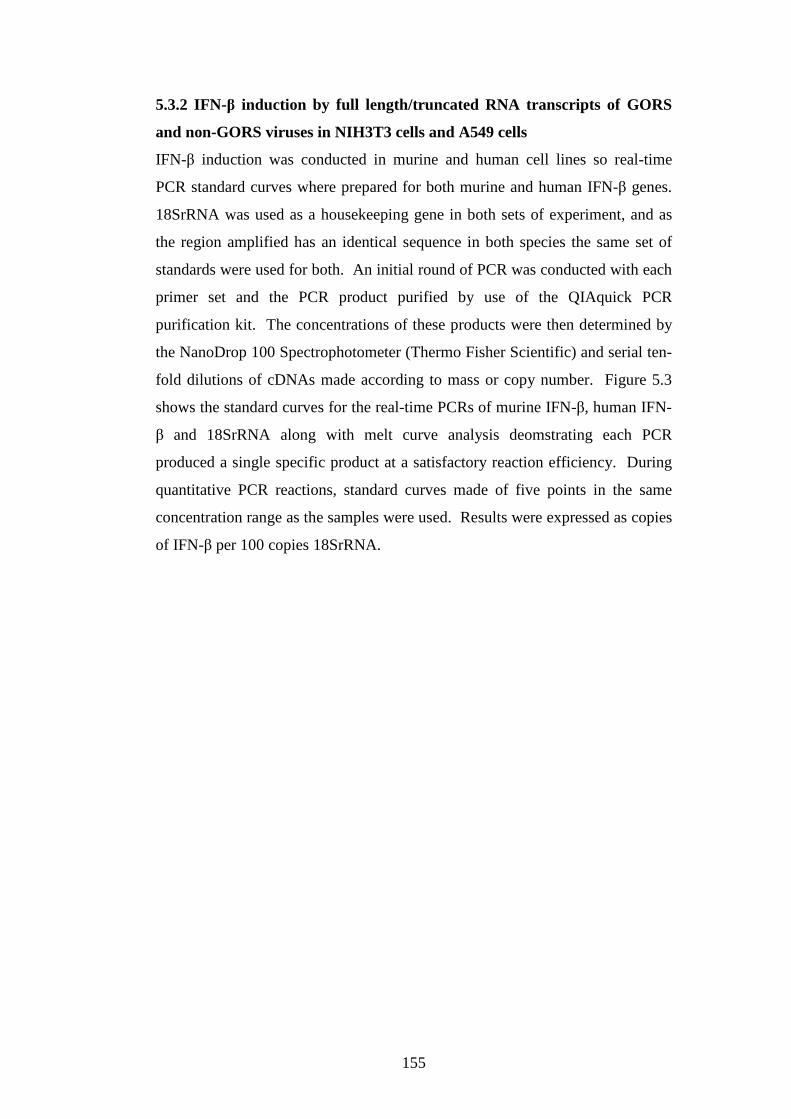
155
5.3.2 IFN-β induction by full length/truncated RNA transcripts of GORS
and non-GORS viruses in NIH3T3 cells and A549 cells
IFN-β induction was conducted in murine and human cell lines so real-time
PCR standard curves where prepared for both murine and human IFN-β genes.
18SrRNA was used as a housekeeping gene in both sets of experiment, and as
the region amplified has an identical sequence in both species the same set of
standards were used for both. An initial round of PCR was conducted with each
primer set and the PCR product purified by use of the QIAquick PCR
purification kit. The concentrations of these products were then determined by
the NanoDrop 100 Spectrophotometer (Thermo Fisher Scientific) and serial ten-
fold dilutions of cDNAs made according to mass or copy number. Figure 5.3
shows the standard curves for the real-time PCRs of murine IFN-β, human IFN-
β and 18SrRNA along with melt curve analysis deomstrating each PCR
produced a single specific product at a satisfactory reaction efficiency. During
quantitative PCR reactions, standard curves made of five points in the same
concentration range as the samples were used. Results were expressed as copies
of IFN-β per 100 copies 18SrRNA.
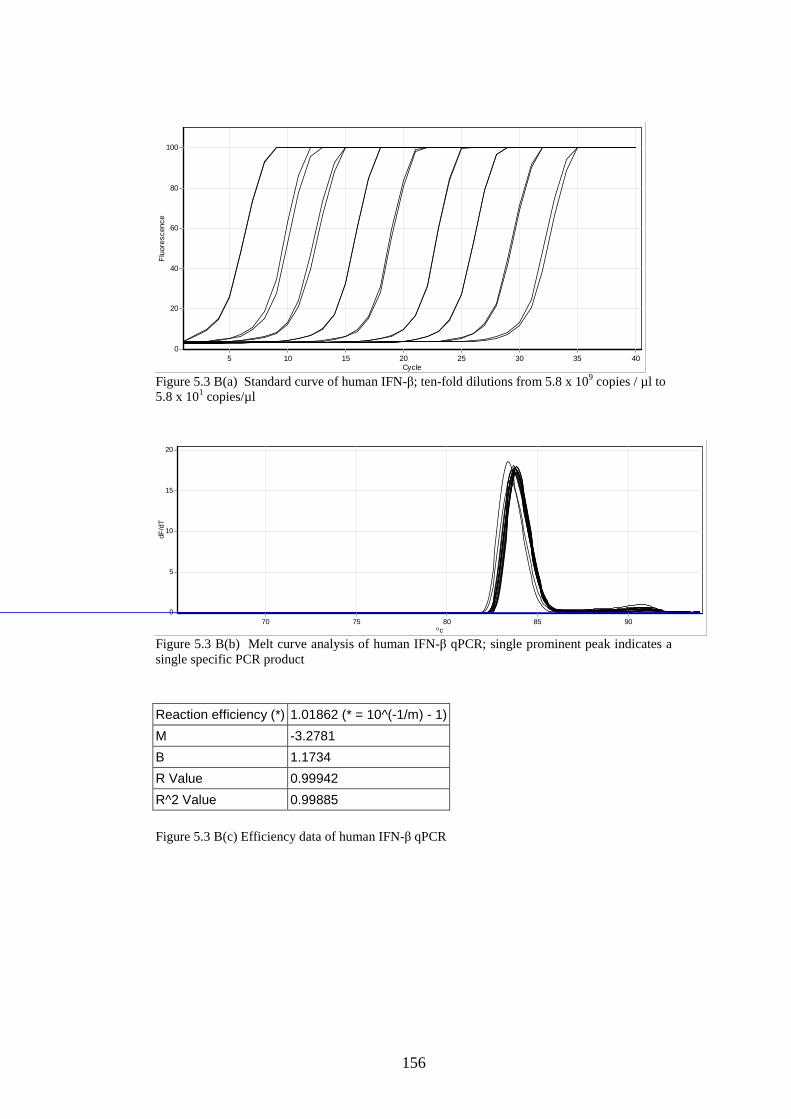
156
Cycle5 10 15 20 25 30 35 40
Flu
ores
cenc
e
100
80
60
40
20
0
Figure 5.3 B(a) Standard curve of human IFN-β; ten-fold dilutions from 5.8 x 10⁹ copies / µl to 5.8 x 101 copies/µl
ºc70 75 80 85 90
dF/d
T
20
15
10
5
0
Figure 5.3 B(b) Melt curve analysis of human IFN-β qPCR; single prominent peak indicates a single specific PCR product Reaction efficiency (*) 1.01862 (* = 10^(-1/m) - 1)
M -3.2781
B 1.1734
R Value 0.99942
R^2 Value 0.99885
Figure 5.3 B(c) Efficiency data of human IFN-β qPCR
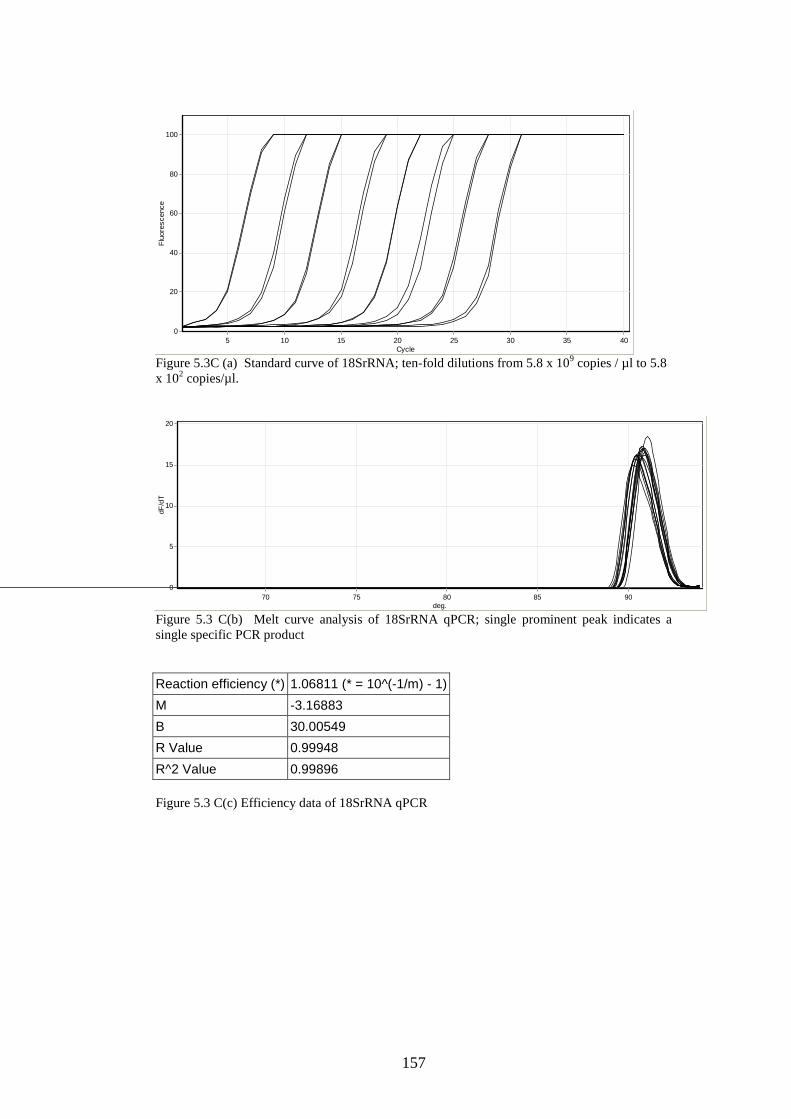
157
Cycle5 10 15 20 25 30 35 40
Flu
ores
cenc
e
100
80
60
40
20
0
Figure 5.3C (a) Standard curve of 18SrRNA; ten-fold dilutions from 5.8 x 10⁹ copies / µl to 5.8 x 10² copies/µl.
deg.70 75 80 85 90
dF/d
T
20
15
10
5
0
Figure 5.3 C(b) Melt curve analysis of 18SrRNA qPCR; single prominent peak indicates a single specific PCR product
Reaction efficiency (*) 1.06811 (* = 10^(-1/m) - 1)
M -3.16883
B 30.00549
R Value 0.99948
R^2 Value 0.99896 Figure 5.3 C(c) Efficiency data of 18SrRNA qPCR
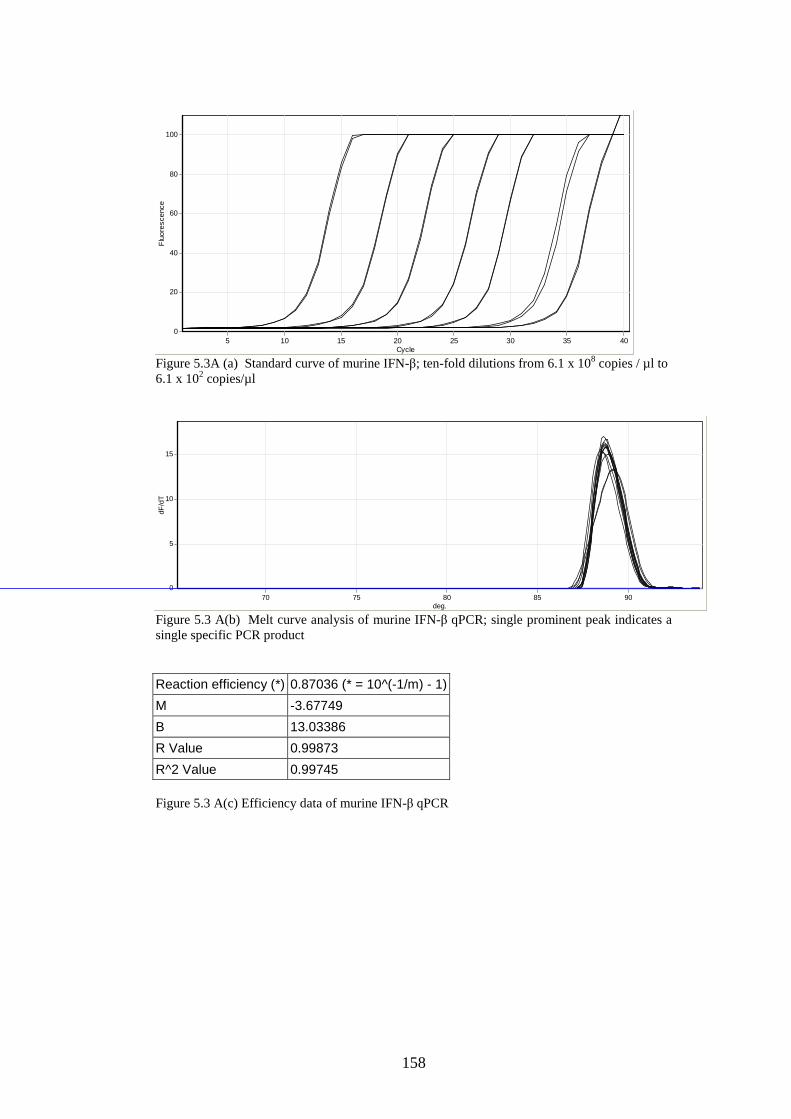
158
Cycle5 10 15 20 25 30 35 40
Flu
ores
cenc
e
100
80
60
40
20
0
Figure 5.3A (a) Standard curve of murine IFN-β; ten-fold dilutions from 6.1 x 10⁸ copies / µl to 6.1 x 10² copies/µl
deg.70 75 80 85 90
dF/d
T
15
10
5
0
Figure 5.3 A(b) Melt curve analysis of murine IFN-β qPCR; single prominent peak indicates a single specific PCR product
Reaction efficiency (*) 0.87036 (* = 10^(-1/m) - 1)
M -3.67749
B 13.03386
R Value 0.99873
R^2 Value 0.99745 Figure 5.3 A(c) Efficiency data of murine IFN-β qPCR
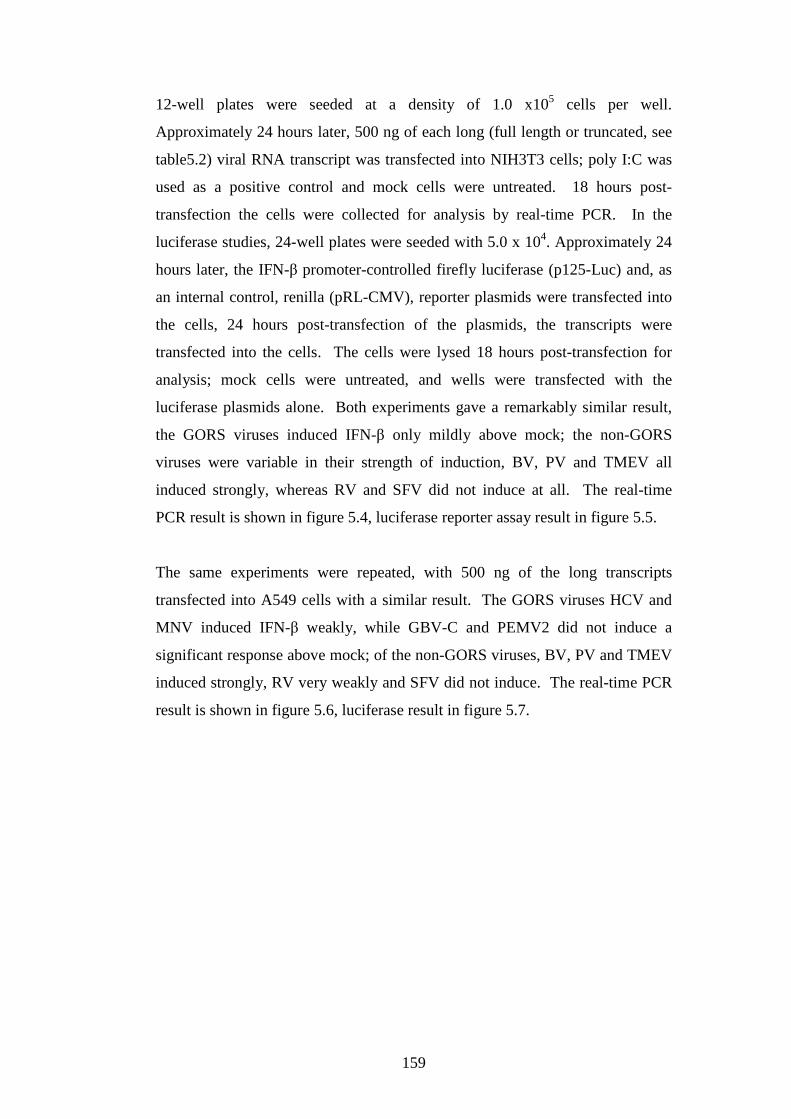
159
12-well plates were seeded at a density of 1.0 x10⁵ cells per well.
Approximately 24 hours later, 500 ng of each long (full length or truncated, see
table5.2) viral RNA transcript was transfected into NIH3T3 cells; poly I:C was
used as a positive control and mock cells were untreated. 18 hours post-
transfection the cells were collected for analysis by real-time PCR. In the
luciferase studies, 24-well plates were seeded with 5.0 x 10⁴. Approximately 24
hours later, the IFN-β promoter-controlled firefly luciferase (p125-Luc) and, as
an internal control, renilla (pRL-CMV), reporter plasmids were transfected into
the cells, 24 hours post-transfection of the plasmids, the transcripts were
transfected into the cells. The cells were lysed 18 hours post-transfection for
analysis; mock cells were untreated, and wells were transfected with the
luciferase plasmids alone. Both experiments gave a remarkably similar result,
the GORS viruses induced IFN-β only mildly above mock; the non-GORS
viruses were variable in their strength of induction, BV, PV and TMEV all
induced strongly, whereas RV and SFV did not induce at all. The real-time
PCR result is shown in figure 5.4, luciferase reporter assay result in figure 5.5.
The same experiments were repeated, with 500 ng of the long transcripts
transfected into A549 cells with a similar result. The GORS viruses HCV and
MNV induced IFN-β weakly, while GBV-C and PEMV2 did not induce a
significant response above mock; of the non-GORS viruses, BV, PV and TMEV
induced strongly, RV very weakly and SFV did not induce. The real-time PCR
result is shown in figure 5.6, luciferase result in figure 5.7.
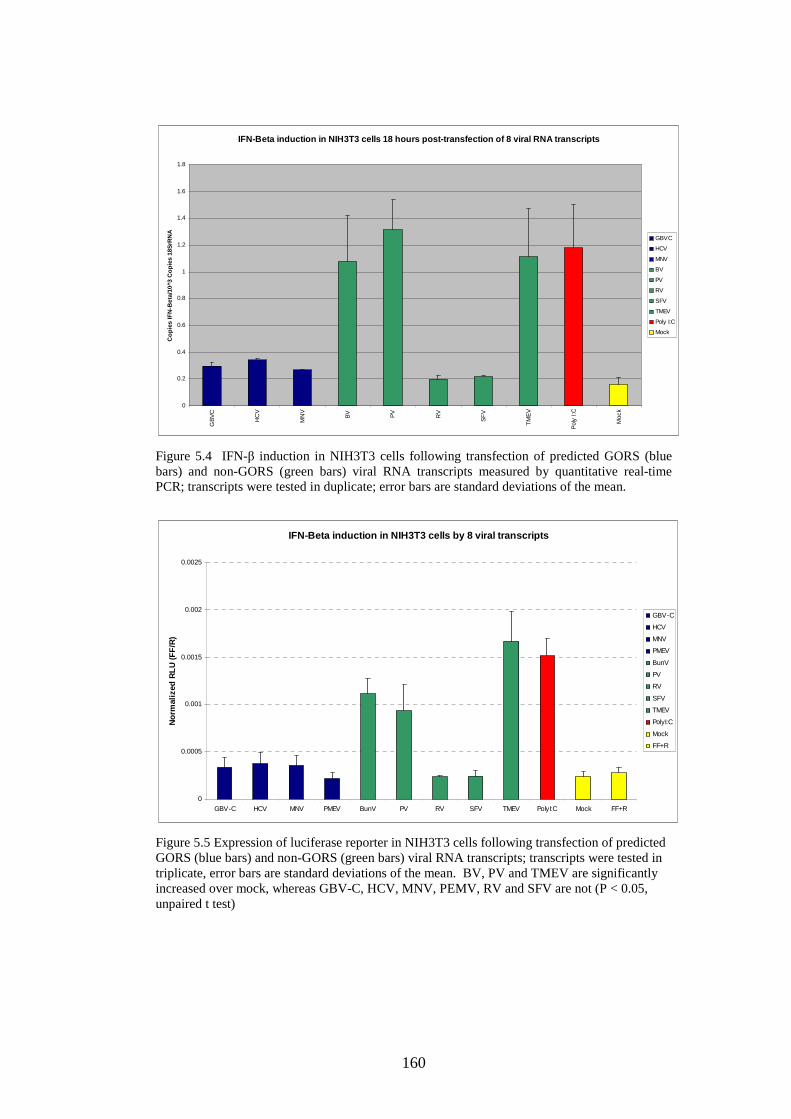
160
IFN-Beta induction in NIH3T3 cells 18 hours post-tr ansfection of 8 viral RNA transcripts
0
0.2
0.4
0.6
0.8
1
1.2
1.4
1.6
1.8
GB
VC
HC
V
MN
V
BV PV
RV
SF
V
TM
EV
Pol
y I:C
Moc
k
Cop
ies
IFN
-Bet
a/10
^3 C
opie
s 18
SrR
NA GBVC
HCV
MNV
BV
PV
RV
SFV
TMEV
Poly I:C
Mock
Figure 5.4 IFN-β induction in NIH3T3 cells following transfection of predicted GORS (blue bars) and non-GORS (green bars) viral RNA transcripts measured by quantitative real-time PCR; transcripts were tested in duplicate; error bars are standard deviations of the mean.
IFN-Beta induction in NIH3T3 cells by 8 viral trans cripts
0
0.0005
0.001
0.0015
0.002
0.0025
GBV-C HCV MNV PMEV BunV PV RV SFV TMEV PolyI:C Mock FF+R
Nor
mal
ized
RLU
(F
F/R
)
GBV-C
HCV
MNV
PMEV
BunV
PV
RV
SFV
TMEV
PolyI:C
Mock
FF+R
Figure 5.5 Expression of luciferase reporter in NIH3T3 cells following transfection of predicted GORS (blue bars) and non-GORS (green bars) viral RNA transcripts; transcripts were tested in triplicate, error bars are standard deviations of the mean. BV, PV and TMEV are significantly increased over mock, whereas GBV-C, HCV, MNV, PEMV, RV and SFV are not (P < 0.05, unpaired t test)
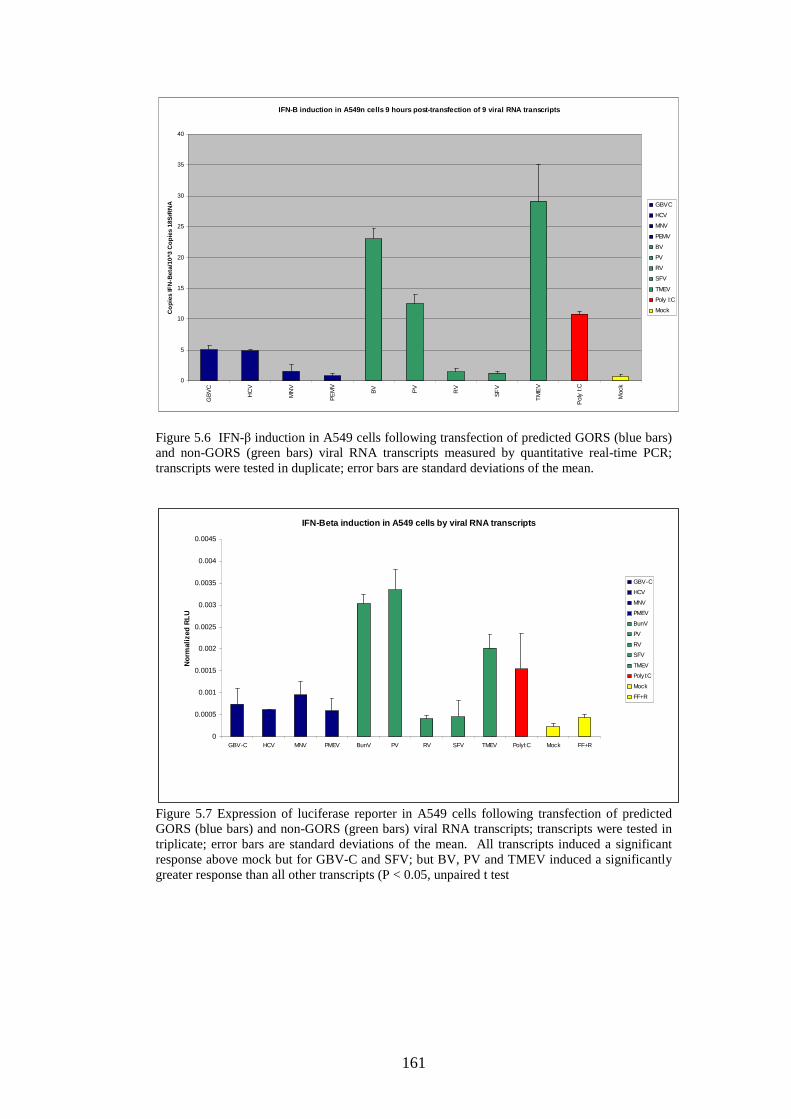
161
IFN-B induction in A549n cells 9 hours post-transfe ction of 9 viral RNA transcripts
0
5
10
15
20
25
30
35
40
GB
VC
HC
V
MN
V
PE
MV
BV PV
RV
SF
V
TM
EV
Pol
y I:C
Moc
k
Co
pies
IFN
-Bet
a/10
^3 C
opie
s 18
SrR
NA GBVC
HCV
MNV
PEMV
BV
PV
RV
SFV
TMEV
Poly I:C
Mock
Figure 5.6 IFN-β induction in A549 cells following transfection of predicted GORS (blue bars) and non-GORS (green bars) viral RNA transcripts measured by quantitative real-time PCR; transcripts were tested in duplicate; error bars are standard deviations of the mean.
IFN-Beta induction in A549 cells by viral RNA trans cripts
0
0.0005
0.001
0.0015
0.002
0.0025
0.003
0.0035
0.004
0.0045
GBV-C HCV MNV PMEV BunV PV RV SFV TMEV PolyI:C Mock FF+R
Nor
mal
ized
RLU
GBV-C
HCV
MNV
PMEV
BunV
PV
RV
SFV
TMEV
PolyI:C
Mock
FF+R
Figure 5.7 Expression of luciferase reporter in A549 cells following transfection of predicted GORS (blue bars) and non-GORS (green bars) viral RNA transcripts; transcripts were tested in triplicate; error bars are standard deviations of the mean. All transcripts induced a significant response above mock but for GBV-C and SFV; but BV, PV and TMEV induced a significantly greater response than all other transcripts (P < 0.05, unpaired t test
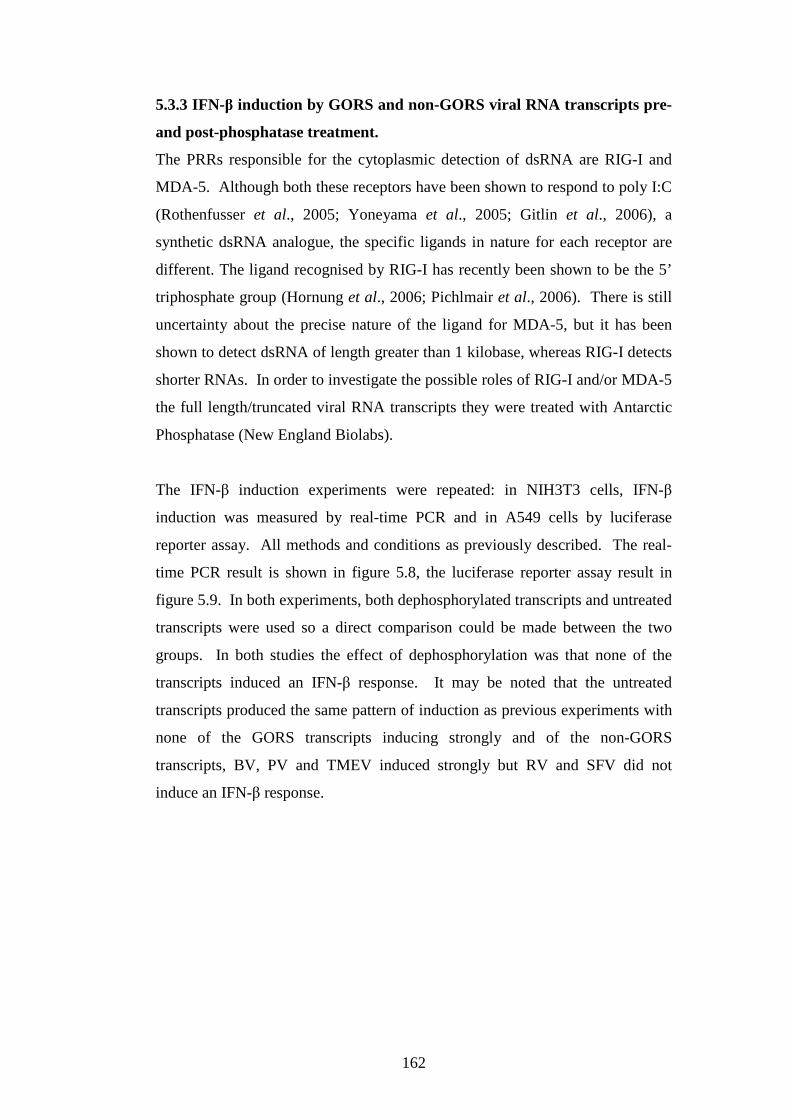
162
5.3.3 IFN-β induction by GORS and non-GORS viral RNA transcripts pre-
and post-phosphatase treatment.
The PRRs responsible for the cytoplasmic detection of dsRNA are RIG-I and
MDA-5. Although both these receptors have been shown to respond to poly I:C
(Rothenfusser et al., 2005; Yoneyama et al., 2005; Gitlin et al., 2006), a
synthetic dsRNA analogue, the specific ligands in nature for each receptor are
different. The ligand recognised by RIG-I has recently been shown to be the 5’
triphosphate group (Hornung et al., 2006; Pichlmair et al., 2006). There is still
uncertainty about the precise nature of the ligand for MDA-5, but it has been
shown to detect dsRNA of length greater than 1 kilobase, whereas RIG-I detects
shorter RNAs. In order to investigate the possible roles of RIG-I and/or MDA-5
the full length/truncated viral RNA transcripts they were treated with Antarctic
Phosphatase (New England Biolabs).
The IFN-β induction experiments were repeated: in NIH3T3 cells, IFN-β
induction was measured by real-time PCR and in A549 cells by luciferase
reporter assay. All methods and conditions as previously described. The real-
time PCR result is shown in figure 5.8, the luciferase reporter assay result in
figure 5.9. In both experiments, both dephosphorylated transcripts and untreated
transcripts were used so a direct comparison could be made between the two
groups. In both studies the effect of dephosphorylation was that none of the
transcripts induced an IFN-β response. It may be noted that the untreated
transcripts produced the same pattern of induction as previous experiments with
none of the GORS transcripts inducing strongly and of the non-GORS
transcripts, BV, PV and TMEV induced strongly but RV and SFV did not
induce an IFN-β response.
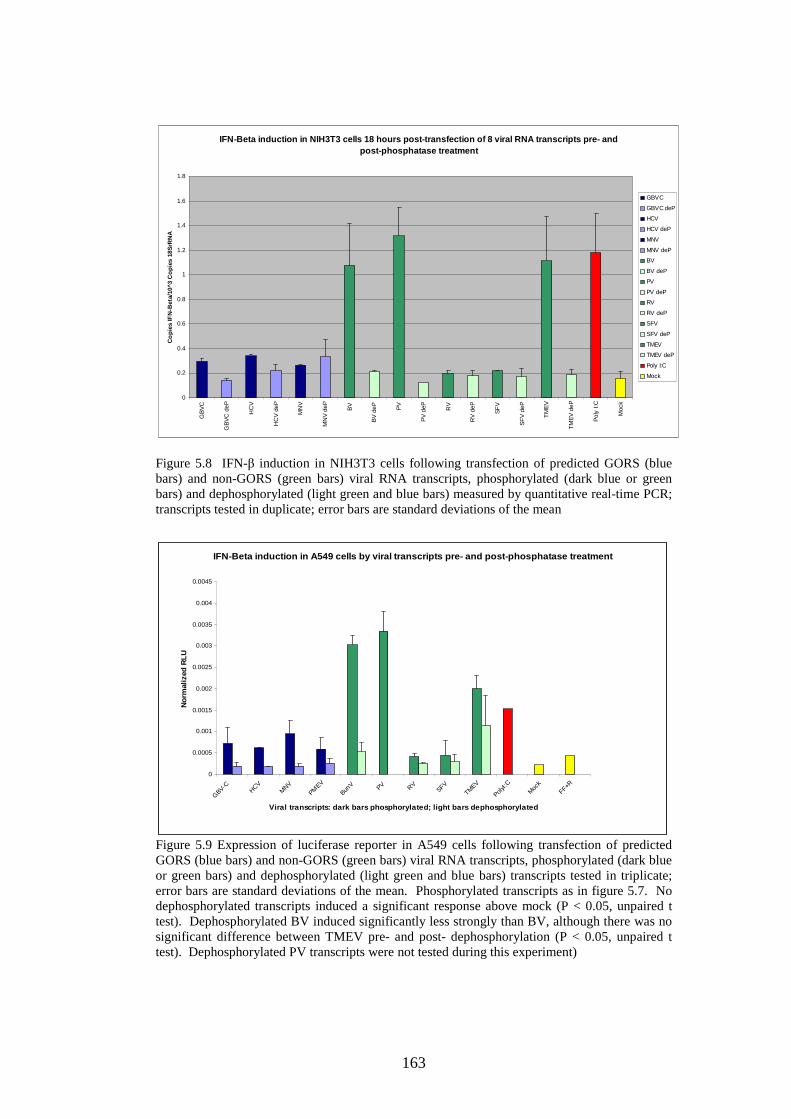
163
IFN-Beta induction in NIH3T3 cells 18 hours post-tr ansfection of 8 viral RNA transcripts pre- and post-phosphatase treatment
0
0.2
0.4
0.6
0.8
1
1.2
1.4
1.6
1.8
GB
VC
GB
VC
deP
HC
V
HC
V d
eP
MN
V
MN
V d
eP BV
BV
deP PV
PV
deP RV
RV
deP
SF
V
SF
V d
eP
TM
EV
TM
EV
deP
Pol
y I:C
Moc
k
Co
pies
IFN
-Bet
a/10
^3 C
opie
s 18
SrR
NA
GBVC
GBVC deP
HCV
HCV deP
MNV
MNV deP
BV
BV deP
PV
PV deP
RV
RV deP
SFV
SFV deP
TMEV
TMEV deP
Poly I:C
Mock
Figure 5.8 IFN-β induction in NIH3T3 cells following transfection of predicted GORS (blue bars) and non-GORS (green bars) viral RNA transcripts, phosphorylated (dark blue or green bars) and dephosphorylated (light green and blue bars) measured by quantitative real-time PCR; transcripts tested in duplicate; error bars are standard deviations of the mean
IFN-Beta induction in A549 cells by viral transcrip ts pre- and post-phosphatase treatment
0
0.0005
0.001
0.0015
0.002
0.0025
0.003
0.0035
0.004
0.0045
GBV-C
HCVM
NVPM
EV
BunV PV RV
SFVTM
EV
PolyI:
CM
ock
FF+R
Viral transcripts: dark bars phosphorylated; light bars dephosphorylated
Nor
mal
ized
RLU
Figure 5.9 Expression of luciferase reporter in A549 cells following transfection of predicted GORS (blue bars) and non-GORS (green bars) viral RNA transcripts, phosphorylated (dark blue or green bars) and dephosphorylated (light green and blue bars) transcripts tested in triplicate; error bars are standard deviations of the mean. Phosphorylated transcripts as in figure 5.7. No dephosphorylated transcripts induced a significant response above mock (P < 0.05, unpaired t test). Dephosphorylated BV induced significantly less strongly than BV, although there was no significant difference between TMEV pre- and post- dephosphorylation (P < 0.05, unpaired t test). Dephosphorylated PV transcripts were not tested during this experiment)
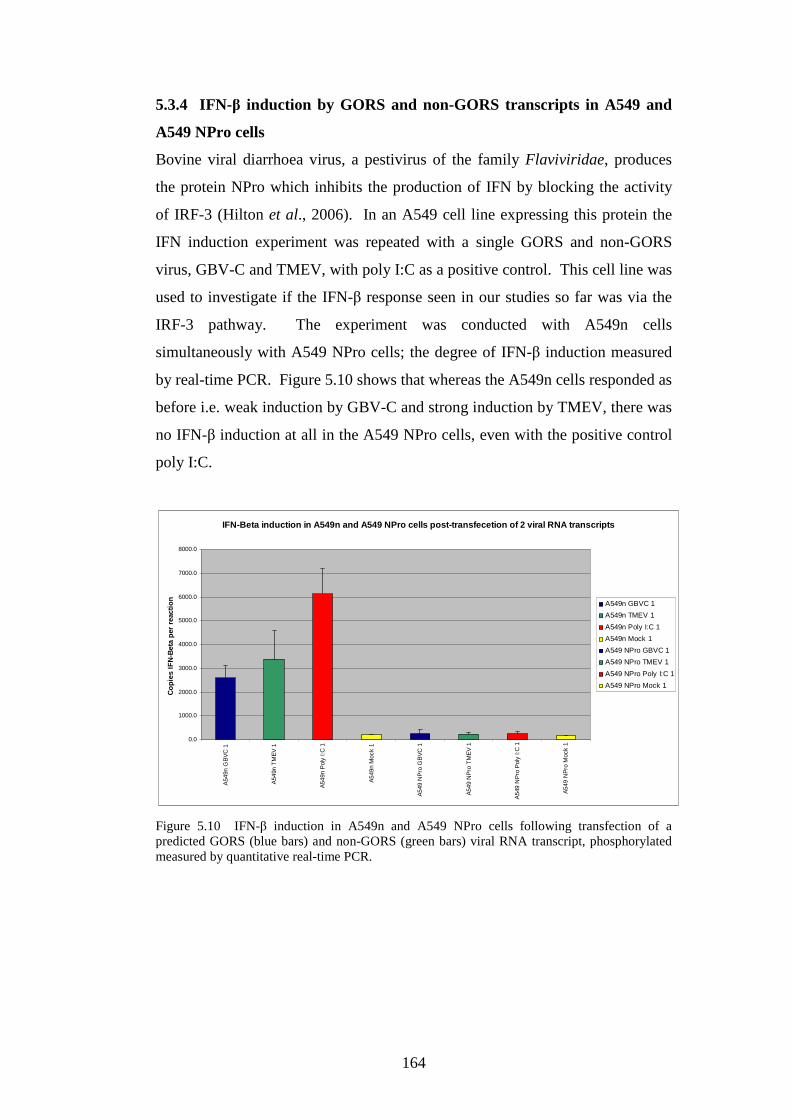
164
5.3.4 IFN-β induction by GORS and non-GORS transcripts in A549 and
A549 NPro cells
Bovine viral diarrhoea virus, a pestivirus of the family Flaviviridae, produces
the protein NPro which inhibits the production of IFN by blocking the activity
of IRF-3 (Hilton et al., 2006). In an A549 cell line expressing this protein the
IFN induction experiment was repeated with a single GORS and non-GORS
virus, GBV-C and TMEV, with poly I:C as a positive control. This cell line was
used to investigate if the IFN-β response seen in our studies so far was via the
IRF-3 pathway. The experiment was conducted with A549n cells
simultaneously with A549 NPro cells; the degree of IFN-β induction measured
by real-time PCR. Figure 5.10 shows that whereas the A549n cells responded as
before i.e. weak induction by GBV-C and strong induction by TMEV, there was
no IFN-β induction at all in the A549 NPro cells, even with the positive control
poly I:C.
IFN-Beta induction in A549n and A549 NPro cells pos t-transfecetion of 2 viral RNA transcripts
0.0
1000.0
2000.0
3000.0
4000.0
5000.0
6000.0
7000.0
8000.0
A54
9n G
BV
C 1
A54
9n T
ME
V 1
A54
9n P
oly
I:C 1
A54
9n M
ock
1
A54
9 N
Pro
GB
VC
1
A54
9 N
Pro
TM
EV
1
A54
9 N
Pro
Pol
y I:C
1
A54
9 N
Pro
Moc
k 1
Cop
ies
IFN
-Bet
a pe
r re
actio
n A549n GBVC 1
A549n TMEV 1
A549n Poly I:C 1
A549n Mock 1
A549 NPro GBVC 1
A549 NPro TMEV 1
A549 NPro Poly I:C 1
A549 NPro Mock 1
Figure 5.10 IFN-β induction in A549n and A549 NPro cells following transfection of a predicted GORS (blue bars) and non-GORS (green bars) viral RNA transcript, phosphorylated measured by quantitative real-time PCR.
165
5.3.5 IFN-β induction by 4 kb GORS and non-GORS transcripts
The longer transcripts used in these studies up to this point had given a
consistent result in two cell lines and by two different methods conducted
independently. The differing strengths of IFN-β induction across the panel of
viruses was an interesting finding, although the failure of RV and SFV to induce
a strong response meant that there was not a simple correlation between strength
of induction and the presence of GORS (to be discussed in more detail later).
One potential factor that may have caused the long transcripts to behave
differently was transcript length, the transcripts are of different lengths from
4200 – 9236, so that the same mass of RNA that was transfected in each
experiment i.e. 500 ng, would contain different copy numbers of RNA
molecules. The exact nature of the form that GORS RNA takes as opposed to
non-GORS RNA remains somewhat uncertain, although atomic force
microscopy studies suggest that GORS RNA transcripts adopt tightly bound
globular structures whereas non-GORS transcripts appear extended (Davis et al.,
2008). With these factors in mind, it was not certain that these other variables
were not having an effect on the strength of IFN-β induction. Another potential
factor was the possibility of translation. None of the transcripts was replication
competent as those that were truncated were missing the 3’ end of their
genomes. Some of the viruses, the flaviviruses (GBV-C, HCV) and
picornaviruses (PV, TMEV), have a 5’ UTR that contains an IRES so could,
possibly, undergo translation and produce viral proteins, which could have an
effect on IFN-β induction e.g. HCV NS3 inactivates Cardif/VISA/MAVS.IPS-1
(Li et al., 2005). For these reasons transcripts were made of 4 kilobases (kb) in
length from regions of the genome that did not include the 5’ UTRs of the
flaviviruses or picornaviruses. 1 x 10¹¹ copies, or ~ 220 ng, of each 4 kb
transcripts was transfected into NIH3T3 cells. Figure 5.11 shows a preliminary
experiment involving transfection of the long transcripts and 4 kb transcripts of
GBV-C and TMEV in NIH3T3 cells, measured by real-time PCR. The long
GBV-C and TMEV transcripts behave similarly to experiments already
described i.e. little/no induction with GBV-C and strong induction with TMEV.
The result with the 4 kb transcripts is similar in that GBV-C still does not induce
and TMEV does, but the response appears weaker, although not statistically
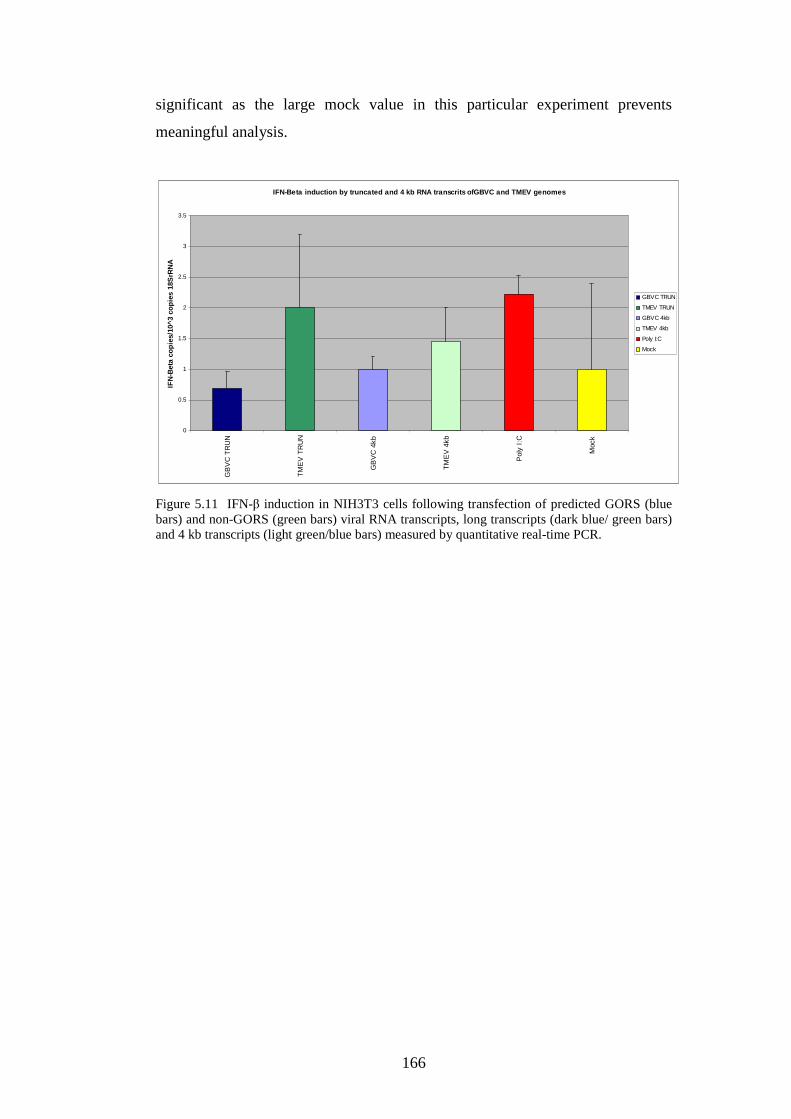
166
significant as the large mock value in this particular experiment prevents
meaningful analysis.
IFN-Beta induction by truncated and 4 kb RNA transc rits ofGBVC and TMEV genomes
0
0.5
1
1.5
2
2.5
3
3.5
GB
VC
TR
UN
TM
EV
TR
UN
GB
VC
4kb
TM
EV
4kb
Pol
y I:
C
Moc
k
IFN
-Bet
a co
pies
/10^
3 co
pies
18S
rRN
A
GBVC TRUN
TMEV TRUN
GBVC 4kb
TMEV 4kb
Poly I:C
Mock
Figure 5.11 IFN-β induction in NIH3T3 cells following transfection of predicted GORS (blue bars) and non-GORS (green bars) viral RNA transcripts, long transcripts (dark blue/ green bars) and 4 kb transcripts (light green/blue bars) measured by quantitative real-time PCR.
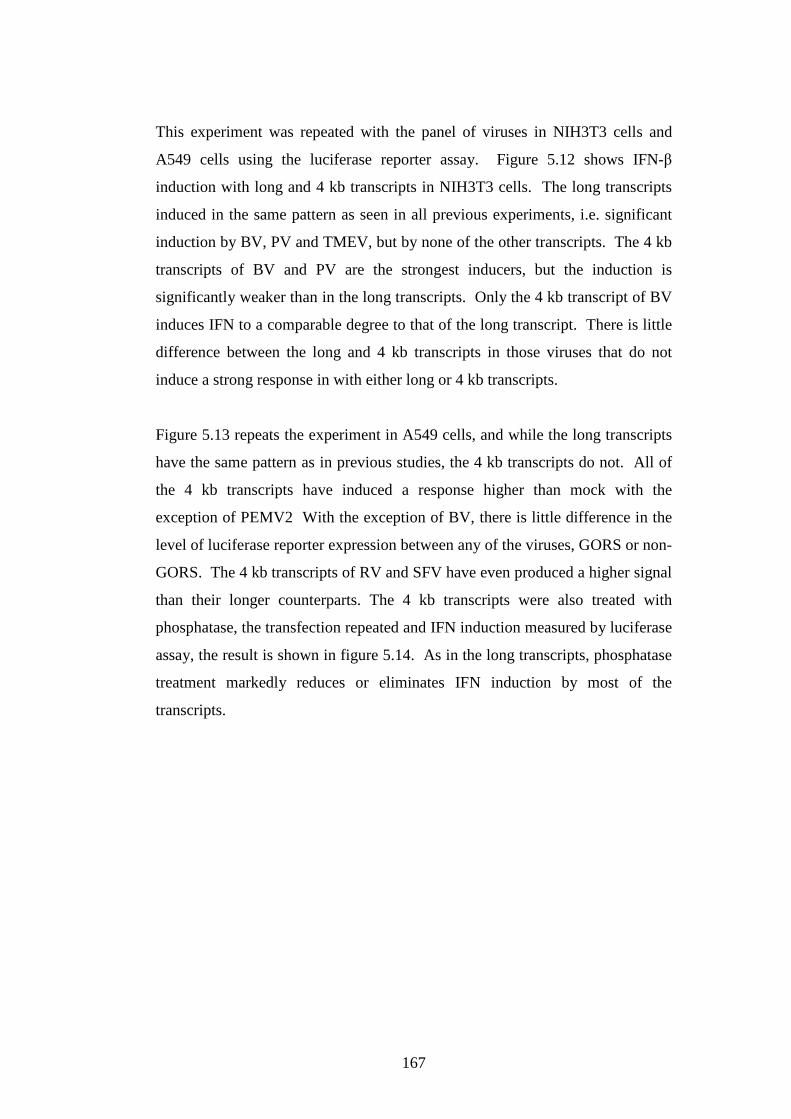
167
This experiment was repeated with the panel of viruses in NIH3T3 cells and
A549 cells using the luciferase reporter assay. Figure 5.12 shows IFN-β
induction with long and 4 kb transcripts in NIH3T3 cells. The long transcripts
induced in the same pattern as seen in all previous experiments, i.e. significant
induction by BV, PV and TMEV, but by none of the other transcripts. The 4 kb
transcripts of BV and PV are the strongest inducers, but the induction is
significantly weaker than in the long transcripts. Only the 4 kb transcript of BV
induces IFN to a comparable degree to that of the long transcript. There is little
difference between the long and 4 kb transcripts in those viruses that do not
induce a strong response in with either long or 4 kb transcripts.
Figure 5.13 repeats the experiment in A549 cells, and while the long transcripts
have the same pattern as in previous studies, the 4 kb transcripts do not. All of
the 4 kb transcripts have induced a response higher than mock with the
exception of PEMV2 With the exception of BV, there is little difference in the
level of luciferase reporter expression between any of the viruses, GORS or non-
GORS. The 4 kb transcripts of RV and SFV have even produced a higher signal
than their longer counterparts. The 4 kb transcripts were also treated with
phosphatase, the transfection repeated and IFN induction measured by luciferase
assay, the result is shown in figure 5.14. As in the long transcripts, phosphatase
treatment markedly reduces or eliminates IFN induction by most of the
transcripts.
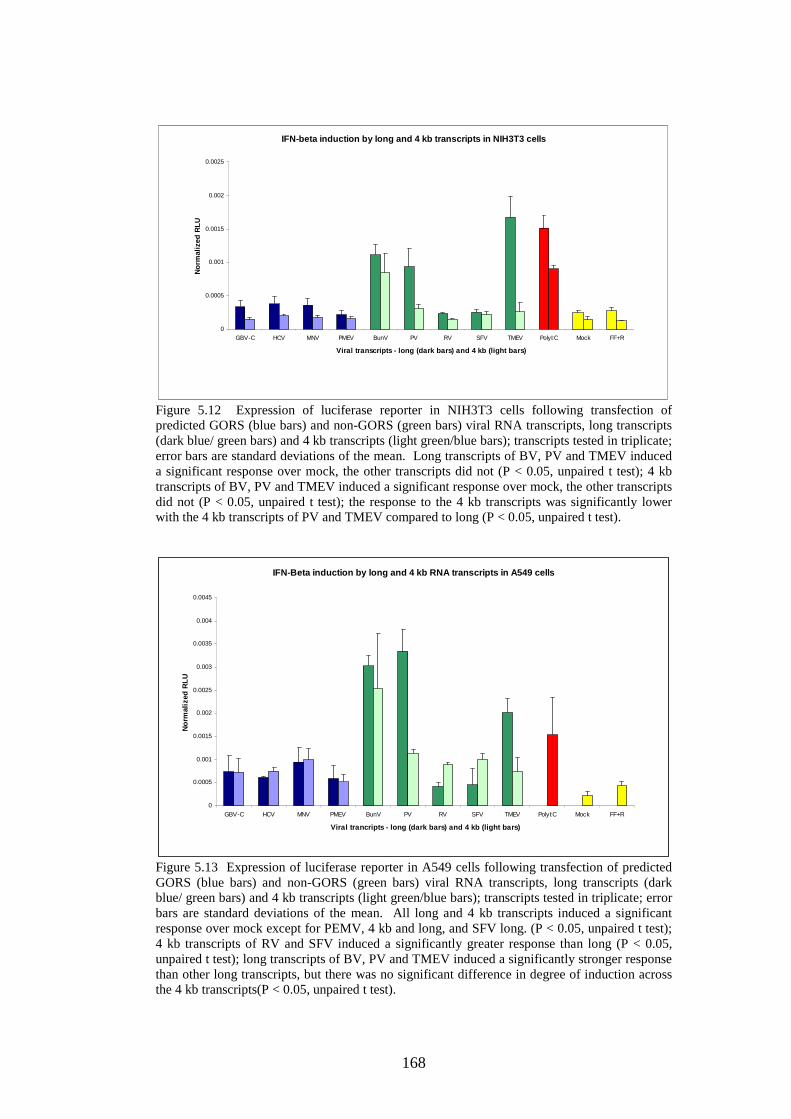
168
IFN-beta induction by long and 4 kb transcripts in NIH3T3 cells
0
0.0005
0.001
0.0015
0.002
0.0025
GBV-C HCV MNV PMEV BunV PV RV SFV TMEV PolyI:C Mock FF+R
Viral transcripts - long (dark bars) and 4 kb (ligh t bars)
Nor
mal
ized
RLU
Figure 5.12 Expression of luciferase reporter in NIH3T3 cells following transfection of predicted GORS (blue bars) and non-GORS (green bars) viral RNA transcripts, long transcripts (dark blue/ green bars) and 4 kb transcripts (light green/blue bars); transcripts tested in triplicate; error bars are standard deviations of the mean. Long transcripts of BV, PV and TMEV induced a significant response over mock, the other transcripts did not (P < 0.05, unpaired t test); 4 kb transcripts of BV, PV and TMEV induced a significant response over mock, the other transcripts did not (P < 0.05, unpaired t test); the response to the 4 kb transcripts was significantly lower with the 4 kb transcripts of PV and TMEV compared to long (P < 0.05, unpaired t test).
IFN-Beta induction by long and 4 kb RNA transcripts in A549 cells
0
0.0005
0.001
0.0015
0.002
0.0025
0.003
0.0035
0.004
0.0045
GBV-C HCV MNV PMEV BunV PV RV SFV TMEV PolyI:C Mock FF+R
Viral trancripts - long (dark bars) and 4 kb (light bars)
Nor
mal
ized
RLU
Figure 5.13 Expression of luciferase reporter in A549 cells following transfection of predicted GORS (blue bars) and non-GORS (green bars) viral RNA transcripts, long transcripts (dark blue/ green bars) and 4 kb transcripts (light green/blue bars); transcripts tested in triplicate; error bars are standard deviations of the mean. All long and 4 kb transcripts induced a significant response over mock except for PEMV, 4 kb and long, and SFV long. (P < 0.05, unpaired t test); 4 kb transcripts of RV and SFV induced a significantly greater response than long (P < 0.05, unpaired t test); long transcripts of BV, PV and TMEV induced a significantly stronger response than other long transcripts, but there was no significant difference in degree of induction across the 4 kb transcripts(P < 0.05, unpaired t test).
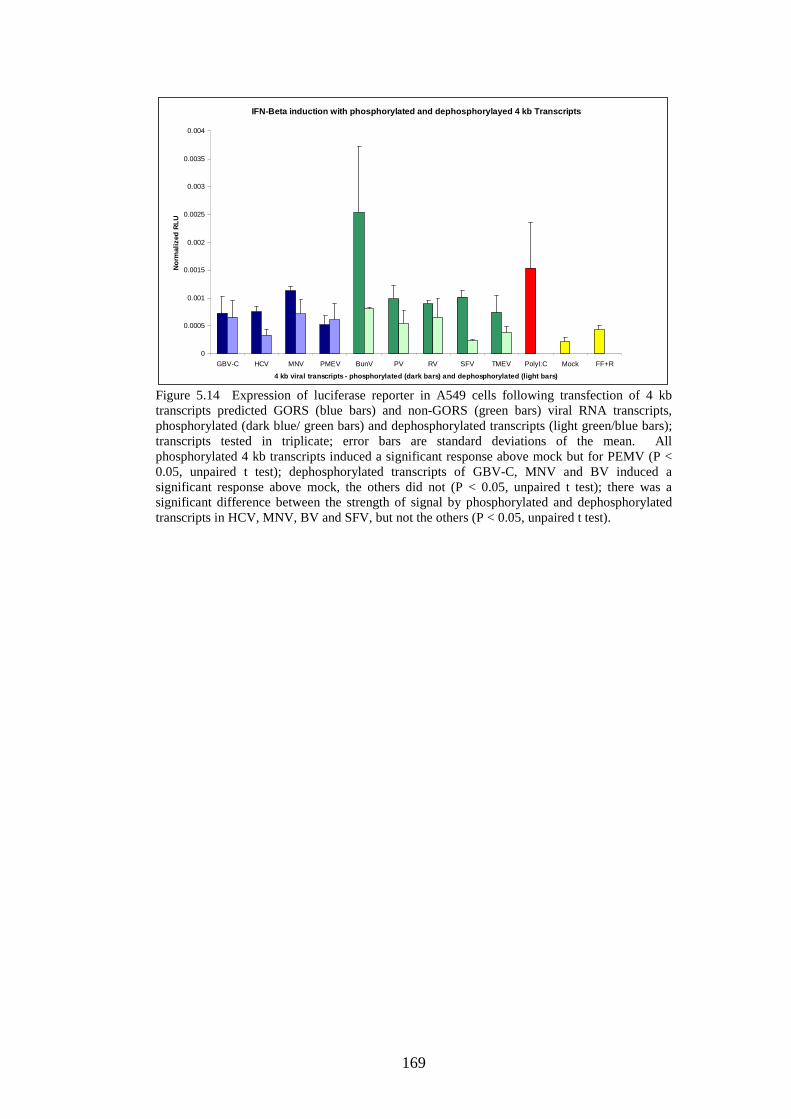
169
IFN-Beta induction with phosphorylated and dephosph orylayed 4 kb Transcripts
0
0.0005
0.001
0.0015
0.002
0.0025
0.003
0.0035
0.004
GBV-C HCV MNV PMEV BunV PV RV SFV TMEV PolyI:C Mock FF+R
4 kb viral transcripts - phosphorylated (dark bars) and dephosphorylated (light bars)
Nor
mal
ized
RLU
Figure 5.14 Expression of luciferase reporter in A549 cells following transfection of 4 kb transcripts predicted GORS (blue bars) and non-GORS (green bars) viral RNA transcripts, phosphorylated (dark blue/ green bars) and dephosphorylated transcripts (light green/blue bars); transcripts tested in triplicate; error bars are standard deviations of the mean. All phosphorylated 4 kb transcripts induced a significant response above mock but for PEMV (P < 0.05, unpaired t test); dephosphorylated transcripts of GBV-C, MNV and BV induced a significant response above mock, the others did not (P < 0.05, unpaired t test); there was a significant difference between the strength of signal by phosphorylated and dephosphorylated transcripts in HCV, MNV, BV and SFV, but not the others (P < 0.05, unpaired t test).
170
5.3.6 IFN-β induction: dose response to long and 4 kb RNA transcripts
With the pattern of IFN-β induction consistent throughout the panel of GORS
and non-GORS viral RNA transcripts used in this study, the next step in this
study was to perform a dose response experiment of both the long and 4 kb
transcripts. For this experiment, the amount of long transcripts transfected into
the cells was based on copy number rather than mass. The previous experiments
had used 500 ng of each transcript transfected per well, which was equivalent to
1 x 10¹¹ copies of the GBV-C transcript. Taking 1 x 10¹¹ copies as a starting
point, the following copy numbers of each transcript were transfected into
NIH3T3 cells: 2.2 x 10¹¹, 1 x 10¹¹, 4.4 x 10¹⁰, 2 x 10¹⁰ and 8.8 x 10⁹ copies.
Figure 5.15 shows that the BV transcript copy numbers that induce the most
strongly are ,1 x 1011 and 4.4 x 10¹⁰, higher and lower copy numbers induces
less strongly; copy number has little effect on the degree of IFN induction by
GBV-C i.e. there is little or no induction. Figure 5.16 shows the first three copy
numbers inducing strongly, but the strength of the signal declines thereafter. A
similar dose response study was conducted with the 4 kb transcripts. Figure
5.17 shows a dose response from 1 x 10¹¹, 4.4 x 10¹⁰ and 2 x 10¹⁰ copies of
GBV-C, MNV and BV measured by real-time PCR; figure 5.18 shows a dose
response from 5 x 10¹⁰, 3.8 x 10¹⁰, 2.5 x 10¹⁰, and 1 x 10¹⁰ copies measured by
luciferase assay. The results are similar to those seen in the longer transcripts in
that as the copy number is reduced, so is the level IFN-β induction from by the
transcript previously shown to be an inducer. There is no effect by altering the
copy number on the ability to induce an IFN response in those transcripts that
have never previously shown that capability.
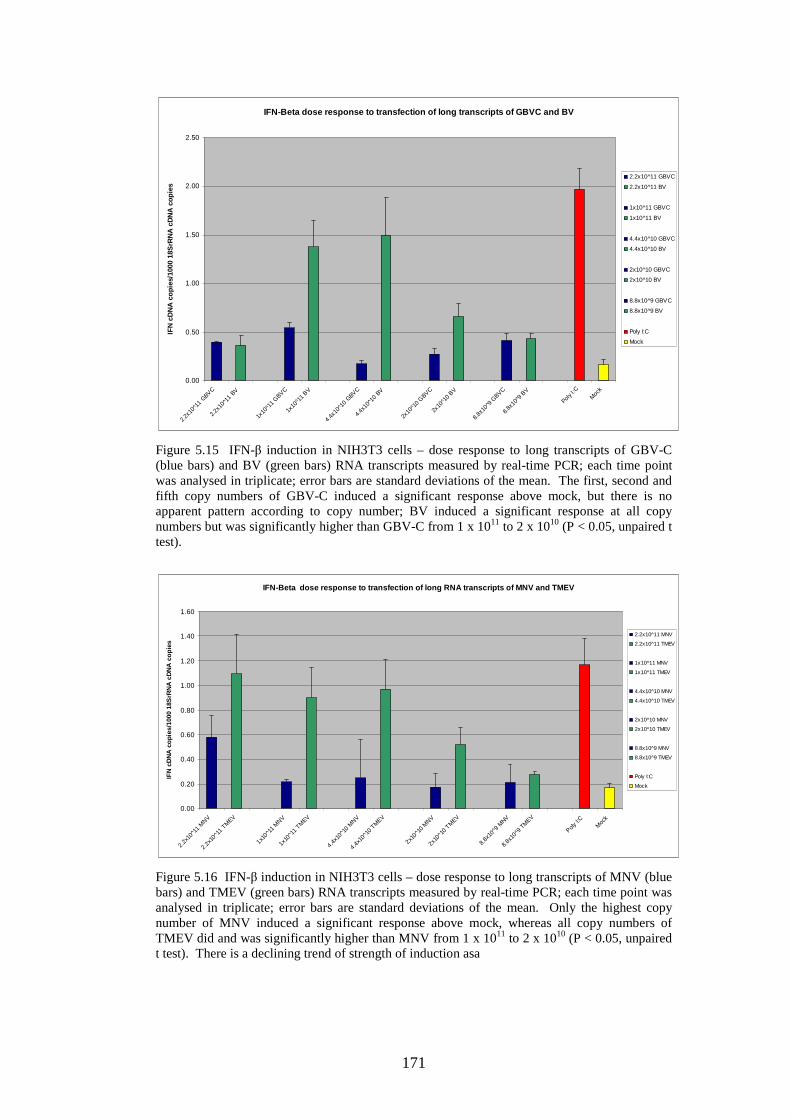
171
IFN-Beta dose response to transfection of long tran scripts of GBVC and BV
0.00
0.50
1.00
1.50
2.00
2.50
2.2x1
0^11
GBVC
2.2x1
0^11
BV
1x10
^11
GBVC
1x10
^11
BV
4.4x1
0^10
GBVC
4.4x1
0^10
BV
2x10
^10
GBVC
2x10
^10
BV
8.8x
10^9
GBVC
8.8x
10^9
BV
Poly I
:CM
ock
IFN
cD
NA
cop
ies/
1000
18S
rRN
A c
DN
A c
opie
s2.2x10^11 GBVC
2.2x10^11 BV
1x10^11 GBVC
1x10^11 BV
4.4x10^10 GBVC
4.4x10^10 BV
2x10^10 GBVC
2x10^10 BV
8.8x10^9 GBVC
8.8x10^9 BV
Poly I:C
Mock
Figure 5.15 IFN-β induction in NIH3T3 cells – dose response to long transcripts of GBV-C (blue bars) and BV (green bars) RNA transcripts measured by real-time PCR; each time point was analysed in triplicate; error bars are standard deviations of the mean. The first, second and fifth copy numbers of GBV-C induced a significant response above mock, but there is no apparent pattern according to copy number; BV induced a significant response at all copy numbers but was significantly higher than GBV-C from 1 x 10¹¹ to 2 x 10¹⁰ (P < 0.05, unpaired t test).
IFN-Beta dose response to transfection of long RNA transcripts of MNV and TMEV
0.00
0.20
0.40
0.60
0.80
1.00
1.20
1.40
1.60
2.2x
10^1
1 M
NV
2.2x1
0^11 T
MEV
1x10^1
1 MNV
1x10
^11
TMEV
4.4x
10^1
0 M
NV
4.4x
10^1
0 TM
EV
2x10^1
0 MNV
2x10
^10
TMEV
8.8x
10^9
MNV
8.8x1
0^9 T
MEV
Poly I:
CM
ock
IFN
cD
NA
cop
ies/
1000
18S
rRN
A c
DN
A c
opie
s
2.2x10^11 MNV
2.2x10^11 TMEV
1x10^11 MNV
1x10^11 TMEV
4.4x10^10 MNV
4.4x10^10 TMEV
2x10^10 MNV
2x10^10 TMEV
8.8x10^9 MNV
8.8x10^9 TMEV
Poly I:C
Mock
Figure 5.16 IFN-β induction in NIH3T3 cells – dose response to long transcripts of MNV (blue bars) and TMEV (green bars) RNA transcripts measured by real-time PCR; each time point was analysed in triplicate; error bars are standard deviations of the mean. Only the highest copy number of MNV induced a significant response above mock, whereas all copy numbers of TMEV did and was significantly higher than MNV from 1 x 10¹¹ to 2 x 10¹⁰ (P < 0.05, unpaired t test). There is a declining trend of strength of induction asa
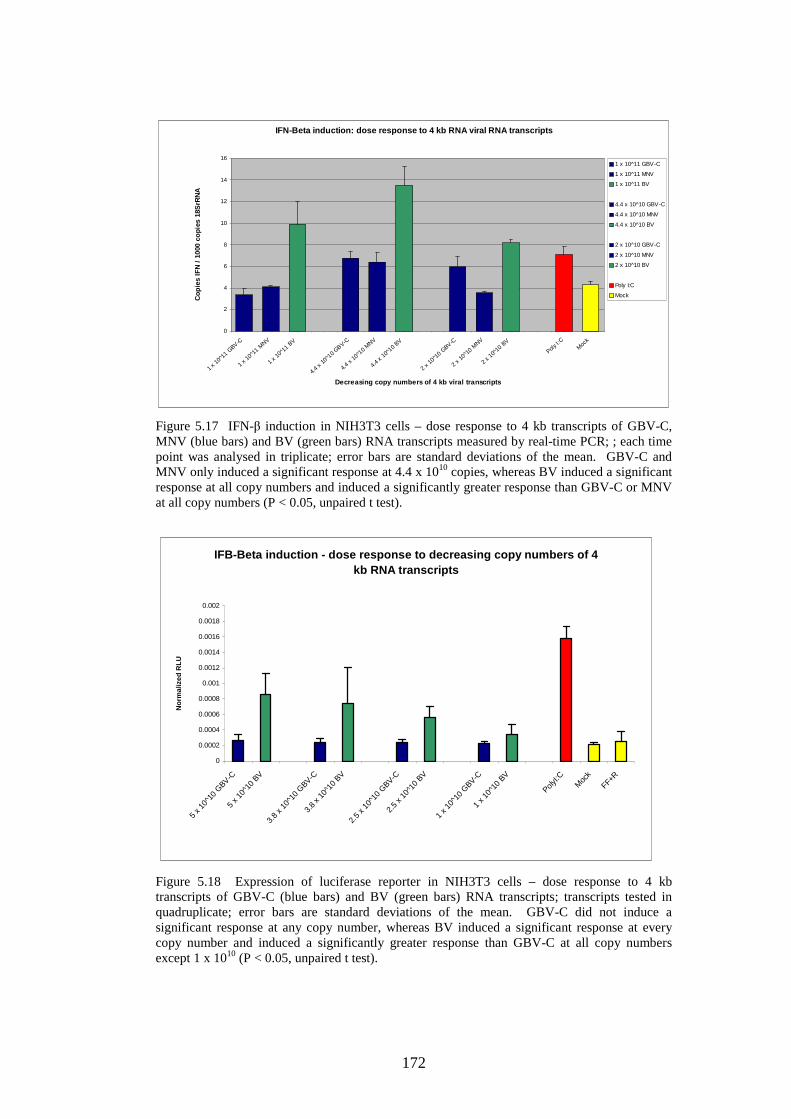
172
Figure 5.17 IFN-β induction in NIH3T3 cells – dose response to 4 kb transcripts of GBV-C, MNV (blue bars) and BV (green bars) RNA transcripts measured by real-time PCR; ; each time point was analysed in triplicate; error bars are standard deviations of the mean. GBV-C and MNV only induced a significant response at 4.4 x 10¹⁰ copies, whereas BV induced a significant response at all copy numbers and induced a significantly greater response than GBV-C or MNV at all copy numbers (P < 0.05, unpaired t test).
IFB-Beta induction - dose response to decreasing co py numbers of 4 kb RNA transcripts
0
0.0002
0.0004
0.0006
0.0008
0.001
0.0012
0.0014
0.0016
0.0018
0.002
5 x 1
0^10
GBV-C
5 x 1
0^10
BV
3.8
x 10^
10 G
BV-C3.
8 x 1
0^10
BV
2.5
x 10^
10 G
BV-C2.
5 x 1
0^10
BV
1 x 1
0^10
GBV-C
1 x 1
0^10
BV
PolyI:C
Moc
k
FF+R
Nor
mal
ized
RLU
Figure 5.18 Expression of luciferase reporter in NIH3T3 cells – dose response to 4 kb transcripts of GBV-C (blue bars) and BV (green bars) RNA transcripts; transcripts tested in quadruplicate; error bars are standard deviations of the mean. GBV-C did not induce a significant response at any copy number, whereas BV induced a significant response at every copy number and induced a significantly greater response than GBV-C at all copy numbers except 1 x 10¹⁰ (P < 0.05, unpaired t test).
IFN-Beta induction: dose response to 4 kb RNA viral RNA transcripts
0
2
4
6
8
10
12
14
16
1 x 10
^11
GBV-C
1 x 10
^11
MNV
1 x 10
^11
BV
4.4 x
10^1
0 GBV-C
4.4 x
10^1
0 MNV
4.4 x
10^1
0 BV
2 x 10
^10
GBV-C
2 x 10
^10
MNV
2 x 10
^10
BV
Poly I:
CMoc
k
Decreasing copy numbers of 4 kb viral transcripts
Cop
ies
IFN
/ 1
000
copi
es 1
8SrR
NA
1 x 10^11 GBV-C
1 x 10^11 MNV
1 x 10^11 BV
4.4 x 10^10 GBV-C
4.4 x 10^10 MNV
4.4 x 10^10 BV
2 x 10^10 GBV-C
2 x 10^10 MNV
2 x 10^10 BV
Poly I:C
Mock
173
5.4 Discussion
RNA plays a vital role in biology; eukaryotic cells contain their genetic
information in dsDNA, but RNAs are essential in the transcription and
translation of those genes into proteins. It has also been shown in recent years
that the regulation of RNA production and degradation is an important factor in
the regulation of gene expression (reviewed by Garneau et al., 2007). RNA also
makes up the genetic makeup of many viruses that parasitize cells. The RNA
genomes, if they are positive sense, can be translated directly by host ribosomes;
negative sense genomes have to undergo a round of transcription to create a
positive sense RNA molecule. Cellular mRNAs have 5’ caps by which they
interact with ribosome, and while some RNA viruses also have 5’ caps, others
interact with ribosomes through conserved secondary structures such as the
IRES and CRE. These structures generally consist of stem-loops of 200 -500
nucleotides of extensive internal base-pairing (Belsham and Sonenberg, 1996)
During their replication, RNA viruses also generally go through stages where
dsRNA is generated in forms such as replicatory intermediates. dsRNA is
foreign to cells and is the most important of the PAMPs that viruses generate
(Marcus, 1983).
The discovery of GORS (Simmonds et al., 2004) revealed the presence of
extensive secondary structure throughout the genomes of some genera of
positive sense RNA viruses, and an observation was made that this phenomenon
was associated with viruses able to establish persistent infection in their natural
hosts. The studies presented here are an investigation into the possible
mechanisms by which GORS leads to persistence. We focused on the
interaction of RNA transcripts of GORS and non-GORS viruses with the
mechanisms of cellular RNA stability and the induction of IFN-β. We
hypothesised that the presence of GORS would lead to greater RNA stability in
transcripts than those transcripts without GORS; and that GORS viral genomes
would induce IFN-β less strongly than non-GORS viruses. IFN-β induction
studies were carried out independently by two methods, by real-time
quantitative PCR and by a luciferase reporter assay; the findings of these studies
are summarised below:
174
Summary of findings
• There is no significant difference in the intra-cellular stability of GORS
and non-GORS viral RNA transcripts
• Of the panel of long transcripts of GORS and non-GORS viruses used in
IFN-β induction studies, none of the GORS viruses (GBV-C, HCV,
MNV, PEMV2) induced IFN-β strongly; but there was variable
induction from the non-GORS viruses, BV, PV and TMEV inducing
strongly but SFV and RV inducing very weakly or not inducing at all.
• Dephosphorylation of the RNA transcripts greatly reduced or eliminated
the IFN response
• Transfection of transcripts into A549 NPro cells resulted in no IFN-β
induction
• Transfection of translation incapable, 4 kb RNA transcripts into NIH3T3
cells revealed the same pattern of induction across the same panel of
viral transcripts, although there was a reduced degree of IFN-β induction
compared to the longer transcripts.
• Transfection of translation incapable, 4 kb RNA transcripts into A549
cells revealed that only BV induced significantly more strongly than the
other viruses, and that there was little difference in the strength of
induction between the other viruses.
• There was a dose response in IFN-β expression according to copy
number of RNA transcripts transfected
175
Viral RNAs may encounter degradation by the RNase L system, an IFN
stimulated response in which viral and cellular RNAs are degraded. They may
also encounter the cellular exonucleases that have a role in cellular RNA
stability and regulation of gene expression. These cellular exonucleases are
likely to be the more significant enzymes that target viral genomic RNAs
immediately after uncoating, before the IFN response produces large amounts of
RNase L. The avoidance of RNA decay machinery by viral RNAs can be split
into two strategies: modulation of the host decay mechanisms and physical
avoidance of the decay mechanisms (Sokolski et al., 2006). During replication,
RNA viruses often incorporate cellular elements and viral ribonucleoprotein
(RNP) into replication complexes. These complexes may be sufficient to shield
replicating viruses from cellular exonucleases. Just as significantly, they may
shield viruses from intracytoplasmic detectors of dsRNA which induce an IFN
response; and the IFN-stimulated 2’5’OAS activates RNase L which degrades
cellular and viral RNAs. Before establishing replication complexes, virus must
uncoat their genomes, thus exposing their genomic RNAs to the intracellular
environment. The study presented here seeks to determine whether structured
RNAs are more stable than unstructured RNA after electroporation into NIH3T3
cells. The result is that there is no difference in the rate of decay of the three
GORS viral transcripts (GBV-C, HCV, MNV) and the three non-GORS
transcripts (BV, PV, TMEV). These six viruses belong to different virus
families and naturally infect different cell type in different hosts, but what this
study shows is that in the same cell type, under the same conditions, the degree
of secondary structure alone confers no protection against cellular RNA decay
mechanisms. The cellular exonucleases would seem to be unaffected by the
presence of stem-loops or the more globular structure of the GORS transcripts
as observed by atomic force microscopy (Davis et al., 2008). During natural
infections by the viruses tested in this study other factors come into play
concerning the capacity to avoid RNA degeneration. The 3’ UTR of HCV binds
to the cellular protein HuR, resulting in protection against exonucleases
(Spanberg et al., 2000). Based on this study, it seems unlikely that secondary
structure has a large role to play in RNA stability.
176
The observation that GORS viruses establish persistent infections in their
natural hosts is one of the most intriguing aspects of the in original description
of GORS. GORS itself appeared to be a conserved feature of genomes across
virus families, and the association with persistence was likewise maintained
across virus families. Initial speculation as to the mechanism behind this ability
to persist focused on the innate cellular immune system i.e. type I IFNs. dsRNA
has been known to be the most important viral inducer of IFN for many years
(Marcus, 1983) so it was hypothesised that the presence of GORS would in
some way limit the exposure of viral RNA to reduce the level of IFN induction.
The induction of IFN-β by viral RNA transcripts in these studies produced a
consistent result in repeated experiments using two different experimental
methods to measure IFN-β induction. The transcripts were made to be
replication incapable so that the effect was limited to the RNA molecules
transfected. None of the long GORS viral transcripts (GBV-C, HCV, MNV,
PEMV2) induced IFN-β strongly; whereas of the non-GORS transcripts, BV,
PV and TMEV consistently induced a strong IFN-β response, but RV and SFV
did not. This result is interesting as, although is does not confirm the
hypothesis, it raises more interesting questions. Firstly, it is still possible that
the presence of GORS does have a protective effect but that the RV and SFV
transcripts have other properties that prevent them from inducing a strong IFN
response. The inclusion of PEMV2, a GORS virus that did not induce IFN, is
that it is a plant virus, its natural host with which it has co-evolved is a plant,
and it is able to parasitize plant cells. The main mechanism of innate immunity
in plants is RNAi, so there is no reason to suppose that a plant virus would have
evolved any mechanism at all to evade the IFN system of mammalian cells; but
there was still no apparent recognition of its RNA as it did not induce IFN. An
interesting addition to this study would have been a non-GORS plant virus to
see if the NIH3T3 or A549 cells would have detected its RNA as foreign.
The lack of a strong response, or no response at all, with the long RV and SFV
transcripts in either NIH3T3 cells or A549 cells, when the other non-GORS
transcripts did induce a strong response was unexpected. It shows that although
the panel of transcripts did induce IFN-β to different degrees, there was not a
simple division between GORS and non-GORS. It is notable that both RV and
177
SFV are members of the virus family Togaviridae, and it would be interesting to
repeat this experiment with other members of that family e.g. sindbis virus,
eastern equine encephalitis virus, western equine encephalitis virus, Venezuelan
equine encephalitis virus, chikungunya virus. This result is all the more
surprising as SVF is known to induce an IFN response which acts to limits its
spread (Fragkoudis et al., 2007; reviewed by Fazakerley, 2002). During SFV
infection it has also been shown that PKR acts to enhance the IFN response
(Barry et al., 2008). Alphaviruses, a genus of Togaviridae, are known to infect
many cell types in many species; and NIH3T3 cells do produce an IFN response
on infection with SFV (data not shown). Rubella virus has also been shown to
induce an IFN response on infection of both adult and foetal human cells
(Adamo et al., 2007). In this study, neither the SFV nor RV transcripts were of
full length, as it was important to avoid RNA translation or viral replication.
These truncated RNA transcripts may not have behaved as the genome does in
actual infections, although the SFV and RV transcripts were of comparable
length to the other transcripts in the panel, although in A549 cells the 4 kb
transcripts of these two viruses appeared to lead to a greater IFN response. This
failure of SFV and RV transcripts to induce an IFN response remains
unexplained and requires further study, for example by use of SFV virus-like
particles that contain defective genomes so cannot replicate.
The effect of dephosphorylating the transcripts was to markedly reduce or
eliminate the IFN response. As RIG-I is the receptor that detects the 5’
triphosphate group present on viral RNAs this result suggests that RIG-I is the
main pattern recognition receptor detecting the transcripts in this study. In viral
infections, those viruses that contain groups other than triphosphate on the 5’
end of the genome e.g. the picornavirus or calicivirus VPg; the togavirus 7-
methylguanosine cap, will not be detected by RIG-I at all, but by MDA-5. By
necessity, to maintain the same experimental conditions the different transcripts
had to be treated equally and each experiment conducted in a single cell type.
Whilst the result of each experiment enables the comparison of the effect of the
different transcripts in each cell type, NIH3T3 or A549, they do not allow a
direct inference to be made to say that the same effect will be occurring during
natural infection. In this study, the PV transcripts consistently induced a strong
178
IFN response, both the long truncated transcripts and the 4 kb transcripts, in
NIH3T3 and A549 cells. With the dephosphorylated transcripts the effect was
reduced or eliminated, suggesting a role for RIG-I, but during infection PV as a
picornavirus is detected by MDA-5.
The experiments with 4 kb transcripts were conducted to control for differences
in transcript length and the possibility of translation and production of proteins.
The fact that in general the 4 kb GORS transcripts induced little or no IFN
response in the NIH3T3 cells indicates that that lack of induction by the longer
GORS transcripts in this cell line had not been a protein effect, and that the
difference in IFN induction between the transcripts was almost certainly an
RNA effect. In NIH3T3 cells, the viruses whose longer transcripts had induced
the most strongly still produced the strongest signals with the 4 kb transcripts,
although the level of IFN expression was generally lower. The difference in the
response to longer and 4 kb transcripts may be a result of different level of
access to the binding site of RIG-I. The RIG-I binding site has been recently
described by Cui and colleagues. The C-terminal domain of RIG-I contains a
regulatory domain (RD) which contains a zinc-binding domain which is the
ligand binding site. The other RLRs have a similar structure, but in RIG-I there
is a lysine residue at the centre of the binding site which is required for
triphosphate binding, in MDA-5 in this position there is a threonine or
isoleucine residue. The binding site of RIG-I is unable to detect
dephosphorylated RNAs. RD is a flat domain, it has a concave and convex side,
it has dimensions of 45 Ǻ (4.5 nm) x 35 Ǻ (3.5 nm) x 30 Ǻ (3.0 nm) (Cui et al.,
2008) Atomic forces microscopy has revealed that the transcripts of predicted
GORS viruses GBV-C and HCV have a prolate spheroid shape. Their
dimensions were, for GBV-C and HCV respectively, radii of 32 nm and 30 nm
along the x and y axes, and mean heights of each transcript molecule of 3.9 ± 1.0
nm (Davis et al., 2008). With GORS transcripts forming tight clusters, it may
be that the triphosphate groups are shielded from the binding site on the RIG-I
RD. Figure 5.14 show the effect of dephosphorylation on 4 kb transcripts in
A549 cells, and interestingly there is a small degree of IFN induction by the
dephosphorylated transcripts which had not been seen in the NIH3T3 cells.
Perhaps in this cell type there is a slightly contribution by MDA-5.
179
In A549 cells the 4 kb experiments had a different outcome. As can be seen in
figures 5.13 and 5.14, in this cell line the there is no significant difference
between the strength of induction across the panel of viruses. This is in contrast
to the result in this cell line using the longer transcripts which is more similar to
the result seen in NIH3T3 cells (see figures 5.4, 5.5, 5.6, 5.7). There may be a
difference in the exact nature of the innate defences present in these two cell
lines. Although the pathways of the IFN system may be shared by different cell
types, it may be that different cell types within the body have evolved defence
mechanisms that have been modified by exposure to viruses throughout
evolution and have adapted to respond accordingly. Future work in this area
could investigate the impact of different RNAs on all kinds of cell types, and
reveal more valuable information about the relationship between cells and RNA
viruses.
The dose response experiments have shown that the level of IFN induction is
dose dependant. In many persistent infections the viruses continue to replicate
at a low level, without lysing the cell and often are clinically silent. It would be
interesting to establish the viral RNA copy numbers detectable during the actual
infection by each of the viruses from this study. According to this study, below
~1 x 10¹⁰ viral copies per well (~5 x 10⁴ copies per cell) there was a barely
significant IFN response. The transfection efficiency of Lipofectamine 2000 in
these cells lines could have an effect on the outcome. Transfection efficiency is
expressed as the percentage of cells to have been transfected, although it is not
an indication of the exact mass of RNA to be delivered into the cell cytoplasm.
These RNA copy numbers may be also misleading as the experiments were
carried out in two cell types, NIH3T3 and A549, whereas in their natural hosts
each viruses may have evolved a very particular replication strategy and innate
immunity evasion strategy.
This study has investigated some of the complex relationships that exist between
viral RNAs and cellular mechanisms. It is difficult to investigate the biological
properties of the phenomenon of GORS as it exists across virus families that
infect different hosts and different cell types. In attempting to control for these
180
variables in their design, the experiments are necessarily artificial. It is difficult
to infer from these studies in cell culture what the mechanism is by which the
presence of GORS in the genome leads to persistence during natural infection.
It is an interesting finding that there was a consistent pattern of IFN induction
across the panel of predicted GORS and non-GORS viral transcripts, and that
none of the long GORS viruses induced. This could be the first indication of a
mechanistic role for GORS in persistence, although the failure of long RV or
SFV transcripts to induce remains unexplained. Further investigation is required
to highlight where within the innate immune system the transcripts are acting
and which pathways are involved. Future studies should broaden the scope of
the viral transcripts used and the cell types. Cells with various specific parts of
the innate immune system knocked out/down could be used to assess the effect
on RNA induced IFN. There was also no direct relation between strength of
IFN induction and other parameters such as genome GC content or the
dinucleotide UA or CG ratios. There is much to learn about the interaction
between viral RNA and cells, but the work presented in this chapter shows that
that relationship is complex, and that GORS may be one part of the picture.
181
5.5 Future work
A study for which some preliminary work was carried out, was designed to
quantify the dsRNA in cells during infection. A panel of predicted GORS and
non-GORS viruses would be used to infect cells. At the same point on their
respective growth curves the cells would fixed and, using the anti-dsRNA
antibody, J2 (Scicons), fluorescence-activated cell sorting (FACS) would be
used to quantify the level of dsRNA present. Viral copy number in cells
infected at the same time would then be determined so that for each virus the
level of dsRNA per virus copy number could be determined. The hypothesis
would be that GORS virus infection would produce less detectable dsRNA per
viral RNA copy than non-GORS viruses.
The panel of viruses chosen for the study were, the following GORS viruses:
canine calicivirus (CaCV) (an isolate of which was kindly provided by Dr Erwin
Duizer of the National Institute for Public Health and the Environment,
Netherlands), ERAV and MNV; and the following non-GORS viruses:
echovirus 11 (E11), Semliki Forest virus (provided by Prof John Fazakerley,
University of Edinburgh) and Theilers murine encephalomyelitis virus. Each
virus isolate was titrated by the end-point method and titres expressed as TCID50
/ ml. Seven wells of a 12-well plate were seeded with the following cell types
for each virus:
CaCV - MDCK cells
ERAV - Vero cells
MNV - RAW 264.7 cells
E11 - RD cells
SFV - NIH3T3 cells
TMEV - NIH3T3 cells
Each well was infected with the appropriate virus and the cells were collected
and frozen at 2, 4, 6 ,8 ,10, 12 and 24 hours post-infection, and stored at -80°C.
Total cellular RNA was extracted by the RNEasy kit (Qiagen); the RNA was
reverse transcribed into cDNA using the Reverse Transcription system
(Promega).
182
Standard curves for quantitative real-time PCR were prepared as described
previously. Briefly, RNA extracted from each virus was reverse transcribed and
a PCR carried out. The PCR product was purified and the concentration
determined by spectroscopy. Ten-fold dilution series were made according to
copy number and used as the standard curves. Growth curves for each virus,
based on intracellular viral copy number were made and are shown on figure
5.19 A-F. The plan was to infect two sets of cells; at the same point on each
growth curve to measure the intracellular viral copy number in one group and to
quantify the level of dsRNA in the other.
The anti-dsRNA, J2 (Scicons) has been used to demonstrate the presence of
dsRNA in viral infection. dsRNA has been detected in infections with positive-
sense, single-stranded RNA viruses, double stranded RNA viruses and DNA
viruses, but not with negative strand RNA viruses (Weber et al., 2006). The
plan was to use the J2 antibody in FACS analysis to quantify dsRNA. Some
preliminary immunostaining of MDCK cells infected with CaCV and RD cells
infected with E11 was carried out and multifocal, punctate bodies were seen
(data not shown), but unfortunately the remainder of the planned experiment
was not able to be carried out. This experiment, had it been successful, would
not have relied upon IFN-β expression, which as has been discussed before, may
vary considerably between cell lines; but would have attempted to quantify the
level of PAMP production by GORS and non-GORS viruses.
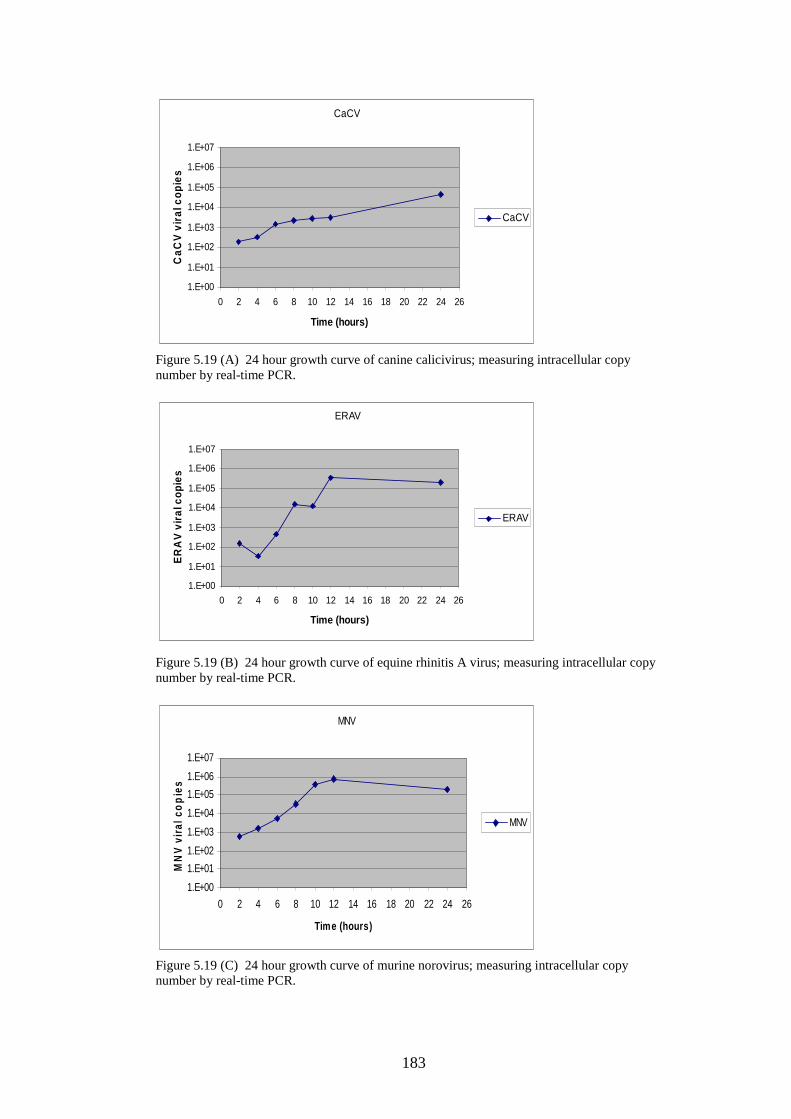
183
Figure 5.19 (A) 24 hour growth curve of canine calicivirus; measuring intracellular copy number by real-time PCR. Figure 5.19 (B) 24 hour growth curve of equine rhinitis A virus; measuring intracellular copy number by real-time PCR. Figure 5.19 (C) 24 hour growth curve of murine norovirus; measuring intracellular copy number by real-time PCR.
CaCV
1.E+00
1.E+01
1.E+02
1.E+03
1.E+04
1.E+05
1.E+06
1.E+07
0 2 4 6 8 10 12 14 16 18 20 22 24 26
Time (hours)
CaC
V v
iral c
opie
s
CaCV
ERAV
1.E+00
1.E+01
1.E+02
1.E+03
1.E+04
1.E+05
1.E+06
1.E+07
0 2 4 6 8 10 12 14 16 18 20 22 24 26
Time (hours)
ER
AV
vira
l cop
ies
ERAV
MNV
1.E+00
1.E+01
1.E+02
1.E+03
1.E+04
1.E+05
1.E+06
1.E+07
0 2 4 6 8 10 12 14 16 18 20 22 24 26
Time (hours)
MN
V v
iral c
op
ies
MNV
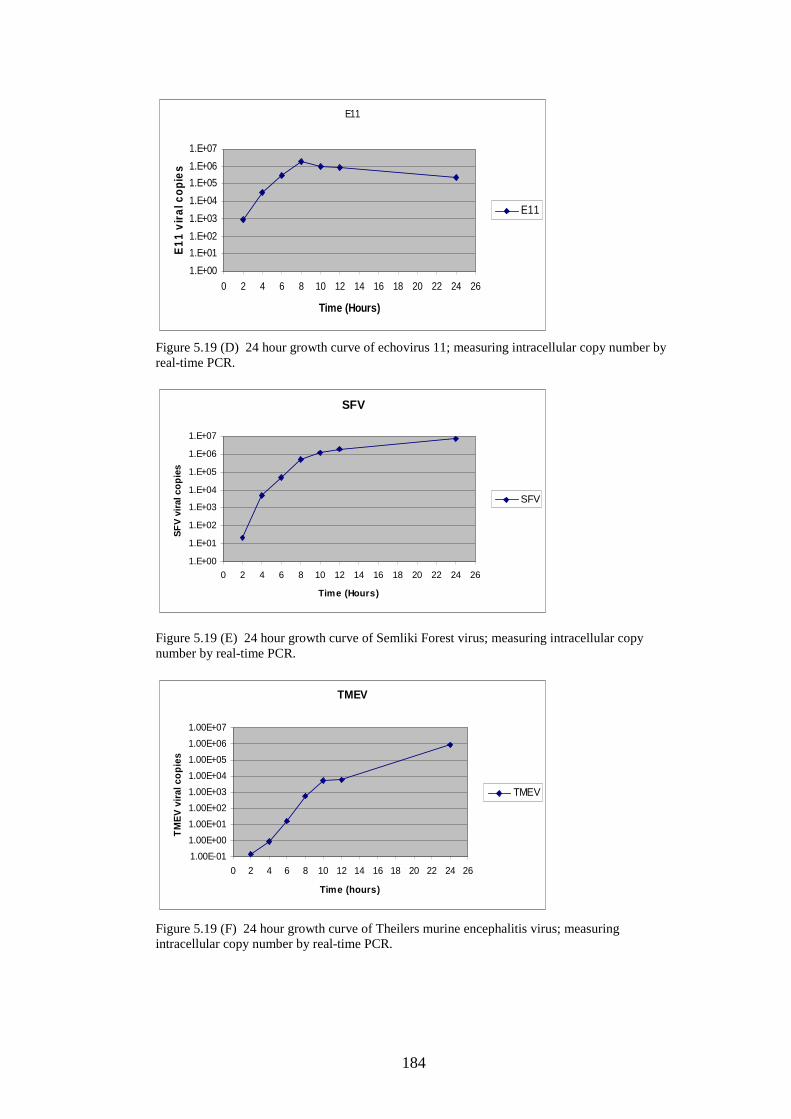
184
Figure 5.19 (D) 24 hour growth curve of echovirus 11; measuring intracellular copy number by real-time PCR. Figure 5.19 (E) 24 hour growth curve of Semliki Forest virus; measuring intracellular copy number by real-time PCR. Figure 5.19 (F) 24 hour growth curve of Theilers murine encephalitis virus; measuring intracellular copy number by real-time PCR.
E11
1.E+00
1.E+01
1.E+02
1.E+03
1.E+04
1.E+05
1.E+06
1.E+07
0 2 4 6 8 10 12 14 16 18 20 22 24 26
Time (Hours)
E11
vira
l cop
ies
E11
SFV
1.E+00
1.E+01
1.E+02
1.E+03
1.E+04
1.E+05
1.E+06
1.E+07
0 2 4 6 8 10 12 14 16 18 20 22 24 26
Time (Hours)
SF
V v
iral c
opie
s
SFV
TMEV
1.00E-01
1.00E+00
1.00E+01
1.00E+02
1.00E+03
1.00E+04
1.00E+05
1.00E+06
1.00E+07
0 2 4 6 8 10 12 14 16 18 20 22 24 26
Time (hours)
TM
EV
vira
l cop
ies
TMEV

185
Chapter 6 Final discussion
186
Chapter 6 Final discussion
Genome-scale ordered RNA structure (GORS) was first described in 2004 by
Simmonds et al. GORS was characterised by the presence of extensive
predicted secondary structures along the lengths of the entire genomes of certain
single-stranded, positive-sense RNA groups or genera. Viruses from the
families Picornaviridae and Flaviviridae were included in the study, which
analysed their RNA genomes by bioinformatic analysis, and it was shown that
of the genera within those two families, some were predicted to be GORS and
others non-GORS. It was considered that GORS could play not fundamental
role in virus replication as replication strategies are generally conserved within
virus families (Simmonds et al., 2004). Many RNA viruses have specific,
conserved regions of secondary structure involved in replication e.g. IRES, CRE
(Pelletier and Soenberg, 1988; Good fellow et al., 2000), but the presence of the
extensive secondary structure in GORS appeared to be unrelated to these well
characterised structures. The observation was also made that there was a
relationship between viruses that contained GORS and the ability to establish
persistent infections e.g. HCV, GBV-C, FMDV. It was speculated that GORS
may be an evolutionarily maintained phenomenon as it confers an evolutionary
advantage by contributing to viruses’ ability to become persistent. The
mechanism behind the contribution of GORS to persistence were unclear, but it
was speculated that by adopting elaborate RNA secondary structures throughout
the genome that the viruses would be able to evade recognition by cellular
innate immunity (Simmonds et al., 2004). Subsequent work includes further
bioinformatic predictions of GORS, including viruses from Togaviridae and
Caliciviridae. It was shown that of the caliciviruses, the genus Norovirus
contains genogroups which are predicted to be GORS (genogroup V containing
MNV)) as well as non-GORS (other genogroups). As part of the same study,
the physical nature of GORS was investigated by a probe hybridization
accessibility assay of RNA transcripts. It was shown that the transcripts of
predicted GORS viruses were markedly less accessible to the probes than
predicted non-GORS viruses. Atomic force microscopy also revealed that
GORS viral transcripts formed a tightly packed, condensed shape, whereas non-
187
GORS transcripts were pleomorphic and there were often protrusion of apparent
single-stranded RNA (Davis et al., 2008)
This thesis present work carried out in the investigation of GORS and its role in
viral persistence. There were two main paths of enquiry: the study of a GORS
virus in cell culture and an investigation into the interaction between a panel of
RNA transcripts of GORS and non-GORS viruses and the cellular mechanisms
of RNA stability and innate immunity.
The aim of studying a virus whose genome contains GORS was to investigate
the association between GORS and persistence in the natural host. The purpose
was to identify viruses by PCR from animals with a naturally occurring
persistent infection, which could then be analysed bioinformatically for
secondary structure. Laboratory strains of viruses often become cell culture
adapted and through mutations may lose features of wild-type viruses. The
study of GORS viruses is somewhat complicated by the fact that some of them a
not very convenient to work with the laboratory e.g. FMDV and HCV require
category 3 containment facilities. ERAV is the only other member of the genus
Aphthovirus apart from FMDV and is predicted to be a GORS virus. It causes a
relatively mild upper respiratory tract infection and has been shown to be
persistently shed for several weeks post-infection (McCollum and Timoney,
1992). We have shown the seroprevalence of ERAV in Scottish horse to be 56
%, which is comparable to similar studies in other countries (Kriegshauser et al.,
2005; De Boer et al., 1979; Holmes et al., 1978; Steck et al., 1978).
Unfortunately, it was not possible to isolate a wild type ERAV from an infected
horse which could then have formed the basis of further work; and isolates
kindly provided by the Animal Health Trust were the same strain as the
published laboratory strain.
MNV, a norovirus of the family Caliciviridae, is the ideal virus to study GORS:
the mean MFED of the first four published MNV sequences are 6.3 – 8.5 %; it
establishes subclinical, persistent infections in immunocompetent mice (Hsu et
al., 2006); uniquely among noroviruses there is a cell culture system available
(Wobus et al., 2004) and there are infectious clones making it amenable to
188
reverse genetics (Chaudhry et al., 2007). This thesis has revealed a prevalence
of MNV, by PCR screening of faecal samples, of 67 %; a similar value to other
research facilities in the United States, Canada, Germany and Japan (Koto et al.,
2009; Kitajima et al., 2009). Screening of faecal samples of wild mice revealed
a surprisingly low prevalence, just one positive sample from a wood mouse
(Apodemus sylvaticus) from a total of 56 samples (15 house mice (Mus
musculus), 11 wood mice (Apodemus sylvaticus), 8 field voles (Microtus
agrestis), and 12 bank voles (Myodes glareolus). A much wider prevalence
study in wild rodents would provide a more accurate figure for the prevalence of
MNV in wild rodents. As GORS has been associated with persistence, it would
be expected that GORS viruses would be reasonably prevalent in wild animal
populations, particularly if the viruses is able to replicate at a low level without
causing a debilitating disease. A possible reason for the prevalence in
laboratory mice being higher than that in wild mice is the absence of Mx in
many laboratory mouse strains (Staeheli et al., 1988). Mx is one of the IFN
induced genes that plays a role in the antiviral state, and the lack of Mx may
make it easier for persistent infections to become established; wild animals will
have fully competent immune systems. It is also true that MNV infection in
immunocompetent mice is clinically silent, and its discovery by Karst et al. in
2003 was as the cause of widespread disease in a seriously
immunocompromised, RAG/STAT-/- mouse. It is likely that MNV has existed
in research facilities for some time before its discovery. The effect of the
presence of MNV in laboratory mice in other studies is a current line of
investigation, and has been shown to have little or no effect on experiments with
murine cytomegalovirus (Doom et al., 2009) or on the adaptive immunity to
vaccinia virus or influenza A virus (Hensley et al., 2009). Laboratory mice are
also bred and live together in enclosed environments, allowing easier spread of
pathogens; wild mice may not live in such density. It is interesting that the pet
shop mouse samples were also positive for MNV as they are bred and raised in
captivity and may live at a higher population density than wild mice.
Phylogenetic analysis of the novel MNVs showed that the laboratory mouse and
pet shop mouse MNVs were closely related to all previously published MNVs.
The wood mouse MNV identified in this study may well be the first identified
member of a new genetic cluster/genotype of norovirus genogroup V. Current
189
published norovirus classifications (Zheng et al., 2006) state that while the other
norovirus genogroups contain different cluster, the MNVs made up a single
cluster in genogroup V. This study demonstrates that there are likely to be more
noroviruses in wild rodent species, and that maybe norovirus genogroup V has
further undiscovered clusters; the data presented in this thesis provide the first
evidence of that.
Bioinformatic analysis of the complete / almost complete genomes of these
novel MNVs revealed them to be GORS viruses. The fact that the wood mouse
virus can be classified as a member of genogroup V, and it genome also contains
GORS agrees with previous observation on the distribution of GORS within the
genus. The presence of GORS in the novel laboratory mouse MNVs also agrees
with the description of MNV as a clinically silent, persistent infection in
immunocompetent mice. The passage study of MNV-3 was designed to assess
the impact of cell culture adaptation on GORS. The fact that, after 33 passages,
there were so few mutations means that there was likely to be very little effect
on the degree of secondary structure. The changes were non-synonymous so
there must have been a degree of selection pressure during the passage series. It
is unclear what those adaptations may have been. This study could be greatly
expanded in the future study of the effect of GORS in viruses. Cell lines with
various parts of the innate immune system knocked out could be generated, the
hypothesis being that removing pressure from the immune system would make it
less of an advantage for the virus to maintain that degree of genomic secondary
structure. It is already known that mice the RAG/STAT-/- are susceptible to
MNV-1, a challenge study of knockout mice deficient in various immune genes
could provide an insight into the mechanism of persistence by tracking the
course of infection. It is certainly easier to consider experiments of this kind in
mice with MNV than in horses with ERAV, cattle with FMDV or chimpanzees
with HCV for example.
The relationship between viruses and the immune system is particularly
complex. Many viruses, over the course of their co-evolution with their hosts,
have developed a panoply of means to evade aspects of the immune system in
order to survive. Eukaryotic cells have likewise developed innate and adaptive
190
immune system in order to counteract the actions of invading pathogens.
dsRNA is the most important pathogen associated molecular pattern (PAMP)
produced during viral infections. It was speculated that the mechanism behind
the ability of GORS viruses to establish persistence was as a result of the
genome-scale structure to evade detection by cellular receptors by mimicking
the structured elements of cellular RNAs. It must be pointed out that many
viruses have evolved mechanisms to evade certain aspects of the innate or
adaptive immune systems (see Chapter 1), but that not all of them are persistent;
although in order to become persistent, viruses must prevent themselves from
being destroyed by the host. The work presented in this thesis investigates the
effect of transfecting RNA transcripts of GORS and non-GORS viruses into
cells and measuring the rate of decay of those transcripts, and their capacity for
IFN-β induction. This experimental design is necessarily artificial in that these
transcripts from a panel of viruses, which naturally infect a broad range of cell
types in different hosts, were transfected into two cell types, NIH3T3 and A549.
The experiments were carried out in this way to eliminate others variables so
that the only variable feature was the degree of secondary structure present in
the transcripts. In natural infections, the importance of the presence of GORS in
the viral genomes is likely to be most significant after uncoating; at this time the
viral RNA is released into the cytoplasm where it goes on to interact with
ribosomes to be translated. Production of the viral proteins and the
establishment of replication complexes associated with cellular organelle
membranes is likely to restrict the access of the cytoplasmic dsRNA receptors
RIG-I and MDA-5. Other points in the viral life cycle that involve dsRNA
include the production of replicatory intermediates and production of new
progeny RNA genomes that go on to encapsidation, but again, there is likely to
be shielding from cytoplasmic receptors during these processes. The
transfection experiments presented, in which RNA is delivered to the cytoplasm,
most resembles the situation after genome uncoating. The hypothesis of the
study states that GORS genomes would induce IFN-β less strongly than non-
GORS genomes; but the results are interesting in that while the GORS virus
transcripts did indeed induce IFN weakly, the non-GORS transcripts were gave
a variable response. It raises the question of the role of structure in the nature of
the response, as well as what other factors may be involved in explaining the
191
differences observed. The plant virus PEMV2, a predicted GORS virus, failed
to induce an IFN-β response. As a plant virus it will never have needed to
evolve any other mechanism to avoid IFN as plant cells used RNAi as their
mechanism of innate immunity (reviewed by Umbach and Cullen) – so the
degree of secondary structure may have been the feature that prevented it from
inducing a response in the mammalian cells, the RNA would certainly have been
foreign to them. The failure of the SFV and RV transcripts is particularly
surprising as i) they are both predicted non-GORS viruses and ii) they are both
known to induce an IFN response in their natural infections and in cell culture
(Fazakerley, 2002; Adamo et al., 2007). The reason for this is still unclear, but
they both belong to the same family, Togaviridae, and there may be feature of
togavirus RNA that has prevented these two transcripts from inducing IFN
under these experimental conditions. While it was necessary for these studies to
perform the experiments with all the viral transcripts simultaneously in the same
cell line, it does not accurately reproduce the conditions during natural infection
by each of these viruses in their own host cells. On the other hand, GORS is a
feature that is observed across virus families and genera and is invariably
associated with persistence, so the mechanism behind the role of GORS in
persistence may common to all GORS viruses. Further work to investigate the
interaction between GORS and non-GORS containing RNAs will be necessary
to further elucidate the mechanisms behind the associated of GORS and
persistence. The different reaction of NIH3T3 cells and A549 cells to the 4 kb
transcripts also raises more questions. By making the 4 kb transcripts many
variables could be removed from the experiment to focus the experiment
uniquely on the effect of RNA secondary structure; but in nature the relationship
between viral genomes and cells could be much more complicated and the
presence of GORS may be only be part of a bigger picture. The longer
transcripts are more likely to be representative of the situation during natural
infection, and the division between those transcripts that induced IFN strongly
and those that induced weakly or not at all was more marked in the long
transcript experiments.
An experiment planned but unfortunately not completed, would have quantified
intracytoplasmic dsRNA by means of FACS analysis using the anti-dsRNA
192
antibody, J2, during infection by a panel of GORS and non-GORS viruses. This
could have given an indication as to the potential of each viruses to induce an
IFN response; IFN could not be measure directly as many cell culture lines have
deficiencies in parts of the innate immune system e.g. IFN deficiency in Vero
cells.
This thesis set out to investigate the presence of GORS in positive-sense RNA
viruses and its role in viral persistence. The investigation into MNV has
confirmed that it is a common, subclinical infection of laboratory mice, is
present in pet shop mice, and that a potentially new genetic MNV cluster exists
in wild rodents; all of which have GORS; also that multiple passage in RAW
264.7 cells had little effect on the genome sequence. It has shown that GORS
and non-GORS viral transcripts do not degrade at different rates after
electroporation into cells. It has also shown, intriguingly, that transfection of a
panel GORS and non-GORS viral RNA transcripts produce a marked variability
in IFN-β induction, which while not confirming out original hypothesis, does
not rule out a role for GORS in the evasion of innate immunity as a possible
mechanism by which GORS viruses establish persistent infections.
193
Reference List
1. Abendroth, A. and A. Arvin . 2001. Immune evasion mechanisms of varicella-zoster virus. Arch. Virol. Suppl99-107.
2. Accola, M. A., B. Huang, M. A. Al, and M. A. McNive n. 2002. The antiviral dynamin family member, MxA, tubulates lipids and localizes to the smooth endoplasmic reticulum. J. Biol. Chem. 277:21829-21835.
3. Adamo, M. P., M. Zapata, and T. K. Frey . 2008. Analysis of gene expression in fetal and adult cells infected with rubella virus. Virology 370:1-11.
4. Adler, J. and R. Zickl . 1969. Winter vomiting disease. J Infect Dis 119:668-673.
5. Aguilar, P. V., S. C. Weaver, and C. F. Basler . 2007. Capsid protein of eastern equine encephalitis virus inhibits host cell gene expression. J. Virol. 81:3866-3876.
6. Alcami, A., J. A. Symons, and G. L. Smith . 2000. The vaccinia virus soluble alpha/beta interferon (IFN) receptor binds to the cell surface and protects cells from the antiviral effects of IFN. J. Virol. 74:11230-11239.
7. Alexandersen, S., Z. Zhang, and A. I. Donaldson . 2002. Aspects of the persistence of foot-and-mouth disease virus in animals--the carrier problem. Microbes. Infect. 4:1099-1110.
8. Alexopoulou, L., A. C. Holt, R. Medzhitov, and R. A . Flavell . 2001. Recognition of double-stranded RNA and activation of NF-kappaB by Toll-like receptor 3. Nature 413:732-738.
9. Alff, P. J., I. N. Gavrilovskaya, E. Gorbunova, K. Endriss, Y. Chong, E. Geimonen, N. Sen, N. C. Reich, and E. R. Mackow . 2006. The pathogenic NY-1 hantavirus G1 cytoplasmic tail inhibits RIG-I- and TBK-1-directed interferon responses. J. Virol. 80 :9676-9686.
10. Ambert-Balay, K., F. Bon, G. F. Le, P. Pothier, and E. Kohli . 2005. Characterization of new recombinant noroviruses. J. Clin. Microbiol. 43:5179-5186.
11. Ambros, V. and D. Baltimore . 1980. Purification and properties of a HeLa cell enzyme able to remove the 5'-terminal protein from poliovirus RNA. J. Biol. Chem. 255:6739-6744.
12. Ando, T., J. S. Noel, and R. L. Fankhauser . 2000. Genetic classification of "Norwalk-like viruses. J. Infect. Dis. 181 Suppl 2 :S336-S348.
13. Andrejeva, J., K. S. Childs, D. F. Young, T. S. Car los, N. Stock, S. Goodbourn, and R. E. Randall . 2004. The V proteins of paramyxoviruses bind the IFN-inducible RNA helicase, mda-5, and inhibit its activation of the IFN-beta promoter. Proc. Natl. Acad. Sci. U. S. A 101:17264-17269.
14. Anton, L. C., U. Schubert, I. Bacik, M. F. Princiot ta, P. A. Wearsch, J. Gibbs, P. M. Day, C. Realini, M. C. Rechsteiner, J. R. Bennink, and J. W. Yewdell . 1999. Intracellular localization of proteasomal degradation of a viral antigen. J. Cell Biol. 146:113-124.
15. Asanaka, M., R. L. Atmar, V. Ruvolo, S. E. Crawford , F. H. Neill, and M. K. Estes . 2005. Replication and packaging of Norwalk virus RNA in cultured mammalian cells. Proc. Natl. Acad. Sci. U. S. A 102:10327-10332.
194
16. Atmar, R. L. and M. K. Estes . 2001. Diagnosis of noncultivatable gastroenteritis viruses, the human caliciviruses. Clin. Microbiol. Rev. 14:15-37.
17. Baeuerle, P. A. and D. Baltimore . 1988. I kappa B: a specific inhibitor of the NF-kappa B transcription factor. Science 242:540-546.
18. Baeuerle, P. A. and D. Baltimore . 1988. Activation of DNA-binding activity in an apparently cytoplasmic precursor of the NF-kappa B transcription factor. Cell 53:211-217.
19. Balvay, L., R. S. Rifo, E. P. Ricci, D. Decimo, and T. Ohlmann . 2009. Structural and functional diversity of viral IRESes. Biochim. Biophys. Acta.
20. Banninger, G. and N. C. Reich . 2004. STAT2 nuclear trafficking. J. Biol. Chem. 279:39199-39206.
21. Barnard, P. and N. A. McMillan . 1999. The human papillomavirus E7 oncoprotein abrogates signaling mediated by interferon-alpha. Virology 259:305-313.
22. Barry, G., L. Breakwell, R. Fragkoudis, G. ttarzade h-Yazdi, J. Rodriguez-Andres, A. Kohl, and J. K. Fazakerley . 2009. PKR acts early in infection to suppress Semliki Forest virus production and strongly enhances the type I interferon response. J. Gen. Virol. 90:1382-1391.
23. Bashkirov, V. I., H. Scherthan, J. A. Solinger, J. M. Buerstedde, and W. D. Heyer . 1997. A mouse cytoplasmic exoribonuclease (mXRN1p) with preference for G4 tetraplex substrates. J. Cell Biol. 136:761-773.
24. Bass, B. L. and H. Weintraub . 1988. An unwinding activity that covalently modifies its double-stranded RNA substrate. Cell 55:1089-1098.
25. Bauhofer, O., A. Summerfield, K. C. McCullough, and N. Ruggli . 2005. Role of double-stranded RNA and Npro of classical swine fever virus in the activation of monocyte-derived dendritic cells. Virology 343:93-105.
26. Beattie, E., J. Tartaglia, and E. Paoletti . 1991. Vaccinia virus-encoded eIF-2 alpha homolog abrogates the antiviral effect of interferon. Virology 183:419-422.
27. Beck, E., S. Forss, K. Strebel, R. Cattaneo, and G. Feil . 1983. Structure of the FMDV translation initiation site and of the structural proteins. Nucleic Acids Res. 11:7873-7885.
28. Becker, K. M., C. L. Moe, K. L. Southwick, and J. N . MacCormack . 2000. Transmission of Norwalk virus during football game. N. Engl. J. Med. 343:1223-1227.
29. Becker, W., H. Heller, and P. Teufel . 1974. [Equine rhinovirus infection]. Berl Munch. Tierarztl. Wochenschr. 87:305-308.
30. Belsham, G. J., G. M. McInerney, and N. Ross-Smith . 2000. Foot-and-mouth disease virus 3C protease induces cleavage of translation initiation factors eIF4A and eIF4G within infected cells. J. Virol. 74:272-280.
31. Belsham, G. J. 2009. Divergent picornavirus IRES elements. Virus Res. 139:183-192.
195
32. Bernardi, R. and P. P. Pandolfi . 2003. Role of PML and the PML-nuclear body in the control of programmed cell death. Oncogene 22:9048-9057.
33. Bertolotti-Ciarlet, A., S. E. Crawford, A. M. Hutso n, and M. K. Estes . 2003. The 3' end of Norwalk virus mRNA contains determinants that regulate the expression and stability of the viral capsid protein VP1: a novel function for the VP2 protein. J. Virol. 77:11603-11615.
34. Best, S. M., K. L. Morris, J. G. Shannon, S. J. Rob ertson, D. N. Mitzel, G. S. Park, E. Boer, J. B. Wolfinbarger, and M. E. Bloom . 2005. Inhibition of interferon-stimulated JAK-STAT signaling by a tick-borne flavivirus and identification of NS5 as an interferon antagonist. J. Virol. 79:12828-12839.
35. Bhella, D., D. Gatherer, Y. Chaudhry, R. Pink, and I. G. Goodfellow . 2008. Structural insights into calicivirus attachment and uncoating. J. Virol. 82:8051-8058.
36. Billerbeck, E., T. Bottler, and R. Thimme . 2007. Regulatory T cells in viral hepatitis. World J. Gastroenterol. 13:4858-4864.
37. Bisbal, C. and R. H. Silverman . 2007. Diverse functions of RNase L and implications in pathology. Biochimie 89:789-798.
38. Bischof, O., O. Kirsh, M. Pearson, K. Itahana, P. G . Pelicci, and A. Dejean . 2002. Deconstructing PML-induced premature senescence. EMBO J. 21:3358-3369.
39. Black, T. L., G. N. Barber, and M. G. Katze . 1993. Degradation of the interferon-induced 68,000-M(r) protein kinase by poliovirus requires RNA. J. Virol. 67:791-800.
40. Blacklow, N. R., G. Cukor, M. K. Bedigian, P. Echev erria, H. B. Greenberg, D. S. Schreiber, and J. S. Trier . 1979. Immune response and prevalence of antibody to Norwalk enteritis virus as determined by radioimmunoassay. J. Clin. Microbiol. 10:903-909.
41. Blakeney, S. J., A. Cahill, and P. A. Reilly . 2003. Processing of Norwalk virus nonstructural proteins by a 3C-like cysteine proteinase. Virology 308:216-224.
42. Blindenbacher, A., F. H. Duong, L. Hunziker, S. T. Stutvoet, X. Wang, L. Terracciano, D. Moradpour, H. E. Blum, T. Alonzi, M . Tripodi, M. N. La, and M. H. Heim . 2003. Expression of hepatitis c virus proteins inhibits interferon alpha signaling in the liver of transgenic mice. Gastroenterology 124:1465-1475.
43. Blomstrom, D. C., D. Fahey, R. Kutny, B. D. Korant, and Knight E Jr . 1986. Molecular characterization of the interferon-induced 15-kDa protein. Molecular cloning and nucleotide and amino acid sequence. J. Biol. Chem. 261:8811-8816.
44. Bode, J. G., S. Ludwig, C. Ehrhardt, U. Albrecht, A . Erhardt, F. Schaper, P. C. Heinrich, and D. Haussinger . 2003. IFN-alpha antagonistic activity of HCV core protein involves induction of suppressor of cytokine signaling-3. FASEB J. 17:488-490.
45. Boege, U., D. S. Ko, and D. G. Scraba . 1986. Toward an in vitro system for picornavirus assembly: purification of mengovirus 14S capsid precursor particles. J. Virol. 57:275-284.
196
46. Bok, K., V. G. Prikhodko, K. Y. Green, and S. V. So snovtsev . 2009. Apoptosis in murine norovirus-infected RAW264.7 cells is associated with downregulation of survivin. J. Virol. 83:3647-3656.
47. Bonilla, W. V., D. D. Pinschewer, P. Klenerman, V. Rousson, M. Gaboli, P. P. Pandolfi, R. M. Zinkernagel, M. S. Salvato, and H. Hengartner . 2002. Effects of promyelocytic leukemia protein on virus-host balance. J. Virol. 76:3810-3818.
48. Bossert, B. and K. K. Conzelmann . 2002. Respiratory syncytial virus (RSV) nonstructural (NS) proteins as host range determinants: a chimeric bovine RSV with NS genes from human RSV is attenuated in interferon-competent bovine cells. J. Virol. 76:4287-4293.
49. Bouloy, M., C. Janzen, P. Vialat, H. Khun, J. Pavlo vic, M. Huerre, and O. Haller . 2001. Genetic evidence for an interferon-antagonistic function of rift valley fever virus nonstructural protein NSs. J. Virol. 75:1371-1377.
50. Boyman, O., J. F. Purton, C. D. Surh, and J. Sprent . 2007. Cytokines and T-cell homeostasis. Curr. Opin. Immunol. 19:320-326.
51. Brass, V., R. Gosert, and D. Moradpour . 2009. Investigation of the hepatitis C virus replication complex. Methods Mol. Biol. 510:195-209.
52. Breakwell, L., P. Dosenovic, G. B. Karlsson Hedesta m, M. D'Amato, P. Liljestrom, J. Fazakerley, and G. M. McInerney . 2007. Semliki Forest virus nonstructural protein 2 is involved in suppression of the type I interferon response. J. Virol. 81:8677-8684.
53. Brion, A., C. Cateigne, M. Fontaine, M. P. Fontaine , and R. Moraillon . 1966. [Equine influenza. Characterization of the influenza virus isolated in 1965]. Bull. Acad. Vet. Fr. 39:155-163.
54. Brown, E. A., H. Zhang, L. H. Ping, and S. M. Lemon . 1992. Secondary structure of the 5' nontranslated regions of hepatitis C virus and pestivirus genomic RNAs. Nucleic Acids Res. 20:5041-5045.
55. Brzozka, K., S. Finke, and K. K. Conzelmann . 2006. Inhibition of interferon signaling by rabies virus phosphoprotein P: activation-dependent binding of STAT1 and STAT2. J. Virol. 80:2675-2683.
56. Burysek, L. and P. M. Pitha . 2001. Latently expressed human herpesvirus 8-encoded interferon regulatory factor 2 inhibits double-stranded RNA-activated protein kinase. J. Virol. 75:2345-2352.
57. Camus-Bouclainville, C., L. Fiette, S. Bouchiha, B. Pignolet, D. Counor, C. Filipe, J. Gelfi, and F. Messud-Petit . 2004. A virulence factor of myxoma virus colocalizes with NF-kappaB in the nucleus and interferes with inflammation. J. Virol. 78:2510-2516.
58. Cao, Y., Z. Lu, J. Sun, X. Bai, P. Sun, H. Bao, Y. Chen, J. Guo, D. Li, X. Liu, and Z. Liu . 2009. Synthesis of empty capsid-like particles of Asia I foot-and-mouth disease virus in insect cells and their immunogenicity in guinea pigs. Vet. Microbiol. 137:10-17.
59. Cardenas, W. B., Y. M. Loo, M. Gale, Jr., A. L. Har tman, C. R. Kimberlin, L. Martinez-Sobrido, E. O. Saphire, and C. F. Basler . 2006. Ebola virus VP35 protein binds double-stranded RNA and inhibits alpha/beta interferon production induced by RIG-I signaling. J. Virol. 80:5168-5178.
197
60. Carrillo, E. C., C. Giachetti, and R. H. Campos . 1984. Effect of lysosomotropic agents on the foot-and-mouth disease virus replication. Virology 135:542-545.
61. Carrillo, E. C., C. Giachetti, and R. Campos . 1985. Early steps in FMDV replication: further analysis on the effects of chloroquine. Virology 147:118-125.
62. Caspar, D. L. and A. Klug . 1962. Physical principles in the construction of regular viruses. Cold Spring Harb. Symp. Quant. Biol. 27:1-24.
63. Castelli, J., K. A. Wood, and R. J. Youle . 1998. The 2-5A system in viral infection and apoptosis. Biomed. Pharmacother. 52:386-390.
64. Castelli, J. C., B. A. Hassel, A. Maran, J. Paranja pe, J. A. Hewitt, X. L. Li, Y. T. Hsu, R. H. Silverman, and R. J. Youle . 1998. The role of 2'-5' oligoadenylate-activated ribonuclease L in apoptosis. Cell Death. Differ. 5:313-320.
65. Catic, A., E. Fiebiger, G. A. Korbel, D. Blom, P. J . Galardy, and H. L. Ploegh . 2007. Screen for ISG15-crossreactive deubiquitinases. PLoS. One. 2:e679.
66. Cattaneo, R. 1994. Biased (A-->I) hypermutation of animal RNA virus genomes. Curr. Opin. Genet. Dev. 4:895-900.
67. Chachu, K. A., A. D. LoBue, D. W. Strong, R. S. Bar ic, and H. W. Virgin . 2008. Immune mechanisms responsible for vaccination against and clearance of mucosal and lymphatic norovirus infection. PLoS. Pathog. 4:e1000236.
68. Chang, H. W., J. C. Watson, and B. L. Jacobs . 1992. The E3L gene of vaccinia virus encodes an inhibitor of the interferon-induced, double-stranded RNA-dependent protein kinase. Proc. Natl. Acad. Sci. U. S. A 89:4825-4829.
69. Changotra, H., Y. Jia, T. N. Moore, G. Liu, S. M. K ahan, S. V. Sosnovtsev, and S. M. Karst . 2009. Type I and type II interferons inhibit the translation of murine norovirus proteins. J. Virol. 83:5683-5692.
70. Chaudhry, Y., A. Nayak, M. E. Bordeleau, J. Tanaka, J. Pelletier, G. J. Belsham, L. O. Roberts, and I. G. Goodfellow . 2006. Caliciviruses differ in their functional requirements for eIF4F components. J. Biol. Chem. 281:25315-25325.
71. Chaudhry, Y., M. A. Skinner, and I. G. Goodfellow . 2007. Recovery of genetically defined murine norovirus in tissue culture by using a fowlpox virus expressing T7 RNA polymerase. J. Gen. Virol. 88:2091-2100.
72. Chee, A. V. and B. Roizman . 2004. Herpes simplex virus 1 gene products occlude the interferon signaling pathway at multiple sites. J. Virol. 78:4185-4196.
73. Chelbi-Alix, M. K., L. Pelicano, F. Quignon, M. H. Koken, L. Venturini, M. Stadler, J. Pavlovic, L. Degos, and T. H. De . 1995. Induction of the PML protein by interferons in normal and APL cells. Leukemia 9:2027-2033.
74. Chelbi-Alix, M. K., F. Quignon, L. Pelicano, M. H. Koken, and T. H. De . 1998. Resistance to virus infection conferred by the interferon-induced promyelocytic leukemia protein. J. Virol. 72:1043-1051.
198
75. Chen, R., J. D. Neill, M. K. Estes, and B. V. Prasa d. 2006. X-ray structure of a native calicivirus: structural insights into antigenic diversity and host specificity. Proc. Natl. Acad. Sci. U. S. A 103:8048-8053.
76. Chen, Z. J. 2005. Ubiquitin signalling in the NF-kappaB pathway. Nat. Cell Biol. 7:758-765.
77. Child, S. J., L. K. Hanson, C. E. Brown, D. M. Janz en, and A. P. Geballe . 2006. Double-stranded RNA binding by a heterodimeric complex of murine cytomegalovirus m142 and m143 proteins. J. Virol. 80:10173-10180.
78. Childs, K., N. Stock, C. Ross, J. Andrejeva, L. Hil ton, M. Skinner, R. Randall, and S. Goodbourn . 2007. mda-5, but not RIG-I, is a common target for paramyxovirus V proteins. Virology 359:190-200.
79. Childs, K. S., J. Andrejeva, R. E. Randall, and S. Goodbourn . 2009. Mechanism of mda-5 Inhibition by paramyxovirus V proteins. J. Virol. 83:1465-1473.
80. Chin, K. C. and P. Cresswell . 2001. Viperin (cig5), an IFN-inducible antiviral protein directly induced by human cytomegalovirus. Proc. Natl. Acad. Sci. U. S. A 98:15125-15130.
81. Chin, Y. E., M. Kitagawa, W. C. Su, Z. H. You, Y. I wamoto, and X. Y. Fu . 1996. Cell growth arrest and induction of cyclin-dependent kinase inhibitor p21 WAF1/CIP1 mediated by STAT1. Science 272:719-722.
82. Chin, Y. E., M. Kitagawa, K. Kuida, R. A. Flavell, and X. Y. Fu . 1997. Activation of the STAT signaling pathway can cause expression of caspase 1 and apoptosis. Mol. Cell Biol. 17:5328-5337.
83. Chou, J., J. J. Chen, M. Gross, and B. Roizman . 1995. Association of a M(r) 90,000 phosphoprotein with protein kinase PKR in cells exhibiting enhanced phosphorylation of translation initiation factor eIF-2 alpha and premature shutoff of protein synthesis after infection with gamma 134.5- mutants of herpes simplex virus 1. Proc. Natl. Acad. Sci. U. S. A 92:10516-10520.
84. Chow, M., J. F. Newman, D. Filman, J. M. Hogle, D. J. Rowlands, and F. Brown . 1987. Myristylation of picornavirus capsid protein VP4 and its structural significance. Nature 327:482-486.
85. Christen, V., F. Duong, C. Bernsmeier, D. Sun, M. N assal, and M. H. Heim . 2007. Inhibition of alpha interferon signaling by hepatitis B virus. J. Virol. 81:159-165.
86. Clark, M. E., P. M. Lieberman, A. J. Berk, and A. D asgupta . 1993. Direct cleavage of human TATA-binding protein by poliovirus protease 3C in vivo and in vitro. Mol. Cell Biol. 13:1232-1237.
87. Clarke, B. E., D. V. Sangar, J. N. Burroughs, S. E. Newton, A. R. Carroll, and D. J. Rowlands . 1985. Two initiation sites for foot-and-mouth disease virus polyprotein in vivo. J. Gen. Virol. 66 ( Pt 12):2615-2626.
88. Clemens, M. J. and B. R. Williams . 1978. Inhibition of cell-free protein synthesis by pppA2'p5'A2'p5'A: a novel oligonucleotide synthesized by interferon-treated L cell extracts. Cell 13:565-572.
89. Clemens, M. J. 1997. PKR--a protein kinase regulated by double-stranded RNA. Int. J. Biochem. Cell Biol. 29:945-949.
199
90. Clemens, M. J. 2005. Translational control in virus-infected cells: models for cellular stress responses. Semin. Cell Dev. Biol. 16:13-20.
91. Colamonici, O. R., P. Domanski, S. M. Sweitzer, A. Larner, and R. M. Buller . 1995. Vaccinia virus B18R gene encodes a type I interferon-binding protein that blocks interferon alpha transmembrane signaling. J. Biol. Chem. 270:15974-15978.
92. Comoli, P., H. H. Hirsch, and F. Ginevri . 2008. Cellular immune responses to BK virus. Curr. Opin. Organ Transplant. 13:569-574.
93. Cougot, N., S. Babajko, and B. Seraphin . 2004. Cytoplasmic foci are sites of mRNA decay in human cells. J. Cell Biol. 165:31-40.
94. Cuddihy, A. R., A. H. Wong, N. W. Tam, S. Li, and A . E. Koromilas . 1999. The double-stranded RNA activated protein kinase PKR physically associates with the tumor suppressor p53 protein and phosphorylates human p53 on serine 392 in vitro. Oncogene 18:2690-2702.
95. Cui, S., K. Eisenacher, A. Kirchhofer, K. Brzozka, A. Lammens, K. Lammens, T. Fujita, K. K. Conzelmann, A. Krug, and K. P. Hopfner . 2008. The C-terminal regulatory domain is the RNA 5'-triphosphate sensor of RIG-I. Mol. Cell 29:169-179.
96. Cusson-Hermance, N., S. Khurana, T. H. Lee, K. A. F itzgerald, and M. A. Kelliher . 2005. Rip1 mediates the Trif-dependent toll-like receptor 3- and 4-induced NF-kappaB activation but does not contribute to interferon regulatory factor 3 activation. J. Biol. Chem. 280:36560-36566.
97. D'Cunha, J., S. Ramanujam, R. J. Wagner, P. L. Witt , Knight E Jr, and E. C. Borden . 1996. In vitro and in vivo secretion of human ISG15, an IFN-induced immunomodulatory cytokine. J. Immunol. 157:4100-4108.
98. Dai, C. and S. B. Krantz . 1999. Interferon gamma induces upregulation and activation of caspases 1, 3, and 8 to produce apoptosis in human erythroid progenitor cells. Blood 93:3309-3316.
99. Darnell, J. E., Jr., I. M. Kerr, and G. R. Stark . 1994. Jak-STAT pathways and transcriptional activation in response to IFNs and other extracellular signaling proteins. Science 264:1415-1421.
100. Darnell, J. E., Jr. 1997. STATs and gene regulation. Science 277:1630-1635.
101. Daughenbaugh, K. F., C. S. Fraser, J. W. Hershey, a nd M. E. Hardy . 2003. The genome-linked protein VPg of the Norwalk virus binds eIF3, suggesting its role in translation initiation complex recruitment. EMBO J. 22:2852-2859.
102. Daughenbaugh, K. F., C. E. Wobus, and M. E. Hardy . 2006. VPg of murine norovirus binds translation initiation factors in infected cells. Virol. J. 3:33.
103. Davis, M., S. M. Sagan, J. P. Pezacki, D. J. Evans, and P. Simmonds . 2008. Bioinformatic and physical characterizations of genome-scale ordered RNA structure in mammalian RNA viruses. J. Virol. 82:11824-11836.
104. Dawson, M. J. and J. A. Trapani . 1996. HIN-200: a novel family of IFN-inducible nuclear proteins expressed in leukocytes. J. Leukoc. Biol. 60:310-316.
200
105. de Boer, G. F., A. D. Osterhaus, J. T. van Oirschot , and R. Wemmenhove . 1979. Prevalence of antibodies to equine viruses in the Netherlands. Tijdschr. Diergeneeskd. 104 :suppl-74.
106. de Weerd, N. A., S. A. Samarajiwa, and P. J. Hertzo g. 2007. Type I interferon receptors: biochemistry and biological functions. J. Biol. Chem. 282:20053-20057.
107. de, Bouteiller. O., E. Merck, U. A. Hasan, S. Hubac , B. Benguigui, G. Trinchieri, E. E. Bates, and C. Caux . 2005. Recognition of double-stranded RNA by human toll-like receptor 3 and downstream receptor signaling requires multimerization and an acidic pH. J. Biol. Chem. 280:38133-38145.
108. de, Haro. C., R. Mendez, and J. Santoyo . 1996. The eIF-2alpha kinases and the control of protein synthesis. FASEB J. 10:1378-1387.
109. Delhaye, S., P. van, V, and T. Michiels . 2004. The leader protein of Theiler's virus interferes with nucleocytoplasmic trafficking of cellular proteins. J. Virol. 78:4357-4362.
110. Dellaire, G. and D. P. Bazett-Jones . 2004. PML nuclear bodies: dynamic sensors of DNA damage and cellular stress. Bioessays 26:963-977.
111. Deng, L., C. Wang, E. Spencer, L. Yang, A. Braun, J . You, C. Slaughter, C. Pickart, and Z. J. Chen . 2000. Activation of the IkappaB kinase complex by TRAF6 requires a dimeric ubiquitin-conjugating enzyme complex and a unique polyubiquitin chain. Cell 103:351-361.
112. Der, S. D., A. Zhou, B. R. Williams, and R. H. Silv erman . 1998. Identification of genes differentially regulated by interferon alpha, beta, or gamma using oligonucleotide arrays. Proc. Natl. Acad. Sci. U. S. A 95:15623-15628.
113. Devaney, M. A., V. N. Vakharia, R. E. Lloyd, E. Ehr enfeld, and M. J. Grubman . 1988. Leader protein of foot-and-mouth disease virus is required for cleavage of the p220 component of the cap-binding protein complex. J. Virol. 62:4407-4409.
114. Diao, F., S. Li, Y. Tian, M. Zhang, L. G. Xu, Y. Zh ang, R. P. Wang, D. Chen, Z. Zhai, B. Zhong, P. Tien, and H. B. Shu . 2007. Negative regulation of MDA5 but not RIG-I-mediated innate antiviral signalling by the dihydroxyacetone kinase. Proc. Natl. Acad. Sci. U. S. A 104:11706-11711.
115. DiPerna, G., J. Stack, A. G. Bowie, A. Boyd, G. Kot wal, Z. Zhang, S. Arvikar, E. Latz, K. A. Fitzgerald, and W. L. Marsh all . 2004. Poxvirus protein N1L targets the I-kappaB kinase complex, inhibits signaling to NF-kappaB by the tumor necrosis factor superfamily of receptors, and inhibits NF-kappaB and IRF3 signaling by toll-like receptors. J. Biol. Chem. 279:36570-36578.
116. Ditchfield, J. and L. W. MacPherson . 1965. THE PROPERTIES AND CLASSIFICATION OF TWO NEW RHINOVIRUSES RECOVERED FROM HORSES IN TORONTO, CANADA. Cornell Vet. 55:181-189.
117. Dolin, R., A. G. Levy, R. G. Wyatt, T. S. Thornhill , and J. D. Gardner . 1975. Viral gastroenteritis induced by the Hawaii agent. Jejunal histopathology and serologic response. Am. J. Med. 59:761-768.
118. Dolin, R., R. C. Reichman, and A. S. Fauci . 1976. Lymphocyte populations in acute viral gastroenteritis. Infect. Immun. 14:422-428.
201
119. Dong, B. and R. H. Silverman . 1995. 2-5A-dependent RNase molecules dimerize during activation by 2-5A. J. Biol. Chem. 270:4133-4137.
120. Dong, B. and R. H. Silverman . 1997. A bipartite model of 2-5A-dependent RNase L. J. Biol. Chem. 272:22236-22242.
121. Dong, B., M. Niwa, P. Walter, and R. H. Silverman . 2001. Basis for regulated RNA cleavage by functional analysis of RNase L and Ire1p. RNA. 7:361-373.
122. Doom, C. M., H. M. Turula, and A. B. Hill . 2009. Investigation of the impact of the common animal facility contaminant murine norovirus on experimental murine cytomegalovirus infection. Virology 392:153-161.
123. Doucas, V., A. M. Ishov, A. Romo, H. Juguilon, M. D . Weitzman, R. M. Evans, and G. G. Maul . 1996. Adenovirus replication is coupled with the dynamic properties of the PML nuclear structure. Genes Dev. 10:196-207.
124. Dragan, A. I., V. V. Hargreaves, E. N. Makeyeva, an d P. L. Privalov . 2007. Mechanisms of activation of interferon regulator factor 3: the role of C-terminal domain phosphorylation in IRF-3 dimerization and DNA binding. Nucleic Acids Res. 35:3525-3534.
125. Duizer, E., K. J. Schwab, F. H. Neill, R. L. Atmar, M. P. Koopmans, and M. K. Estes . 2004. Laboratory efforts to cultivate noroviruses. J. Gen. Virol. 85:79-87.
126. Duizer, E., P. Bijkerk, B. Rockx, G. A. De, F. Twis k, and M. Koopmans . 2004. Inactivation of caliciviruses. Appl. Environ. Microbiol. 70:4538-4543.
127. Duong, F. H., M. Filipowicz, M. Tripodi, M. N. La, and M. H. Heim . 2004. Hepatitis C virus inhibits interferon signaling through up-regulation of protein phosphatase 2A. Gastroenterology 126:263-277.
128. Ea, C. K., L. Deng, Z. P. Xia, G. Pineda, and Z. J. Chen . 2006. Activation of IKK by TNFalpha requires site-specific ubiquitination of RIP1 and polyubiquitin binding by NEMO. Mol. Cell 22:245-257.
129. Edelmann, K. H., S. Richardson-Burns, L. Alexopoulo u, K. L. Tyler, R. A. Flavell, and M. B. Oldstone . 2004. Does Toll-like receptor 3 play a biological role in virus infections? Virology 322:231-238.
130. Endo-Munoz, L., T. Warby, D. Harrich, and N. A. McM illan . 2005. Phosphorylation of HIV Tat by PKR increases interaction with TAR RNA and enhances transcription. Virol. J. 2:17.
131. Erlandsson, L., R. Blumenthal, M. L. Eloranta, H. E ngel, G. Alm, S. Weiss, and T. Leanderson . 1998. Interferon-beta is required for interferon-alpha production in mouse fibroblasts. Curr. Biol. 8:223-226.
132. Escarmis, C., J. Dopazo, M. Davila, E. L. Palma, an d E. Domingo . 1995. Large deletions in the 5'-untranslated region of foot-and-mouth disease virus of serotype C. Virus Res. 35:155-167.
133. Etchison, D., S. C. Milburn, I. Edery, N. Sonenberg , and J. W. Hershey . 1982. Inhibition of HeLa cell protein synthesis following poliovirus infection correlates with the proteolysis of a 220,000-dalton polypeptide associated with eucaryotic initiation factor 3 and a cap binding protein complex. J. Biol. Chem. 257:14806-14810.
202
134. Eulalio, A., I. Behm-Ansmant, D. Schweizer, and E. Izaurralde . 2007. P-body formation is a consequence, not the cause, of RNA-mediated gene silencing. Mol. Cell Biol. 27:3970-3981.
135. Farci, P. and R. H. Purcell . 2000. Clinical significance of hepatitis C virus genotypes and quasispecies. Semin. Liver Dis. 20:103-126.
136. Farkas, T., K. Sestak, C. Wei, and X. Jiang . 2008. Characterization of a rhesus monkey calicivirus representing a new genus of Caliciviridae. J. Virol. 82:5408-5416.
137. Fazakerley, J. K. 2002. Pathogenesis of Semliki Forest virus encephalitis. J. Neurovirol. 8 Suppl 2 :66-74.
138. Fernandez, M., J. A. Quiroga, and V. Carreno . 2003. Hepatitis B virus downregulates the human interferon-inducible MxA promoter through direct interaction of precore/core proteins. J. Gen. Virol. 84:2073-2082.
139. Ferraiuolo, M. A., S. Basak, J. Dostie, E. L. Murra y, D. R. Schoenberg, and N. Sonenberg . 2005. A role for the eIF4E-binding protein 4E-T in P-body formation and mRNA decay. J. Cell Biol. 170:913-924.
140. Ferran, M. C. and J. M. Lucas-Lenard . 1997. The vesicular stomatitis virus matrix protein inhibits transcription from the human beta interferon promoter. J. Virol. 71:371-377.
141. Ferrantini, M., I. Capone, and F. Belardelli . 2007. Interferon-alpha and cancer: mechanisms of action and new perspectives of clinical use. Biochimie 89:884-893.
142. Fessler, S. P., Y. R. Chin, and M. S. Horwitz . 2004. Inhibition of tumor necrosis factor (TNF) signal transduction by the adenovirus group C RID complex involves downregulation of surface levels of TNF receptor 1. J. Virol. 78:13113-13121.
143. Field, A. K., A. A. Tytell, G. P. Lampson, and M. R . Hilleman . 1967. Inducers of interferon and host resistance. II. Multistranded synthetic polynucleotide complexes. Proc. Natl. Acad. Sci. U. S. A 58:1004-1010.
144. Fire, A., S. Xu, M. K. Montgomery, S. A. Kostas, S. E. Driver, and C. C. Mello . 1998. Potent and specific genetic interference by double-stranded RNA in Caenorhabditis elegans. Nature 391:806-811.
145. Fitzgerald, K. A., S. M. McWhirter, K. L. Faia, D. C. Rowe, E. Latz, D. T. Golenbock, A. J. Coyle, S. M. Liao, and T. Maniatis . 2003. IKKepsilon and TBK1 are essential components of the IRF3 signaling pathway. Nat. Immunol. 4:491-496.
146. Flammini, C. F. and G. Allegri . 1970. Rhinovirus strain as a possible cause of equine respiratory infection. Arch. Vet. Ital. 21:309-316.
147. Flanegan, J. B., R. F. Petterson, V. Ambros, N. J. Hewlett, and D. Baltimore . 1977. Covalent linkage of a protein to a defined nucleotide sequence at the 5'-terminus of virion and replicative intermediate RNAs of poliovirus. Proc. Natl. Acad. Sci. U. S. A 74:961-965.
148. Flodstrom-Tullberg, M., M. Hultcrantz, A. Stotland, A. Maday, D. Tsai, C. Fine, B. Williams, R. Silverman, and N. Sarvetnick . 2005. RNase L and double-stranded RNA-dependent protein kinase exert complementary roles in islet cell defense during coxsackievirus infection. J. Immunol. 174:1171-1177.
203
149. Floyd-Smith, G., E. Slattery, and P. Lengyel . 1981. Interferon action: RNA cleavage pattern of a (2'-5')oligoadenylate--dependent endonuclease. Science 212:1030-1032.
150. Fontana, J., N. Lopez-Montero, R. M. Elliott, J. J. Fernandez, and C. Risco . 2008. The unique architecture of Bunyamwera virus factories around the Golgi complex. Cell Microbiol. 10:2012-2028.
151. Forss, S. and H. Schaller . 1982. A tandem repeat gene in a picornavirus. Nucleic Acids Res. 10:6441-6450.
152. Fortes, P., A. Beloso, and J. Ortin . 1994. Influenza virus NS1 protein inhibits pre-mRNA splicing and blocks mRNA nucleocytoplasmic transport. EMBO J. 13:704-712.
153. Fox, G., N. R. Parry, P. V. Barnett, B. McGinn, D. J. Rowlands, and F. Brown . 1989. The cell attachment site on foot-and-mouth disease virus includes the amino acid sequence RGD (arginine-glycine-aspartic acid). J. Gen. Virol. 70 ( Pt 3):625-637.
154. Foy, E., K. Li, R. Sumpter, Jr., Y. M. Loo, C. L. J ohnson, C. Wang, P. M. Fish, M. Yoneyama, T. Fujita, S. M. Lemon, and M. G ale, Jr. 2005. Control of antiviral defenses through hepatitis C virus disruption of retinoic acid-inducible gene-I signaling. Proc. Natl. Acad. Sci. U. S. A 102:2986-2991.
155. Fragkoudis, R., L. Breakwell, C. McKimmie, A. Boyd, G. Barry, A. Kohl, A. Merits, and J. K. Fazakerley . 2007. The type I interferon system protects mice from Semliki Forest virus by preventing widespread virus dissemination in extraneural tissues, but does not mediate the restricted replication of avirulent virus in central nervous system neurons. J. Gen. Virol. 88:3373-3384.
156. Fragkoudis, R., Y. Chi, R. W. Siu, G. Barry, G. tta rzadeh-Yazdi, A. Merits, A. A. Nash, J. K. Fazakerley, and A. Kohl . 2008. Semliki Forest virus strongly reduces mosquito host defence signaling. Insect Mol. Biol. 17:647-656.
157. Frahm, T., H. Hauser, and M. Koster . 2006. IFN-type-I-mediated signaling is regulated by modulation of STAT2 nuclear export. J. Cell Sci. 119:1092-1104.
158. Fresco, J. R., B. M. Alberts, and P. Doty . 1960. Some molecular details of the secondary structure of ribonucleic acid. Nature 188:98-101.
159. Friedman, J. M. and M. S. Horwitz . 2002. Inhibition of tumor necrosis factor alpha-induced NF-kappa B activation by the adenovirus E3-10.4/14.5K complex. J. Virol. 76:5515-5521.
160. Friedman, R. M. 1967. Interferon binding: the first step in establishment of antiviral activity. Science 156:1760-1761.
161. Frieman, M., B. Yount, M. Heise, S. A. Kopecky-Brom berg, P. Palese, and R. S. Baric . 2007. Severe acute respiratory syndrome coronavirus ORF6 antagonizes STAT1 function by sequestering nuclear import factors on the rough endoplasmic reticulum/Golgi membrane. J. Virol. 81:9812-9824.
162. Fry, E. E., S. M. Lea, T. Jackson, J. W. Newman, F. M. Ellard, W. E. Blakemore, R. bu-Ghazaleh, A. Samuel, A. M. King, a nd D. I. Stuart . 1999. The structure and function of a foot-and-mouth disease virus-oligosaccharide receptor complex. EMBO J. 18 :543-554.
163. Fu, X. Y., C. Schindler, T. Improta, R. Aebersold, and J. E. Darnell, Jr. 1992. The proteins of ISGF-3, the interferon alpha-induced transcriptional
204
activator, define a gene family involved in signal transduction. Proc. Natl. Acad. Sci. U. S. A 89:7840-7843.
164. Fukumi, H., R. Nakaya, S. Hatta, H. Noriki, H. Yuno ki, K. Kagi, T. Saito, K. Uchiyama, K. Kobari, and R. Nakanishi . 1957. An indication as to identity between the infectious diarrhea in Japan and the afebrile infectious nonbacterial gastroenteritis by human volunteer experiments. Jpn. J. Med. Sci. Biol. 10:1-17.
165. Fukushi, S., K. Katayama, C. Kurihara, N. Ishiyama, F. B. Hoshino, T. Ando, and A. Oya . 1994. Complete 5' noncoding region is necessary for the efficient internal initiation of hepatitis C virus RNA. Biochem. Biophys. Res. Commun. 199:425-432.
166. Gack, M. U., Y. C. Shin, C. H. Joo, T. Urano, C. Li ang, L. Sun, O. Takeuchi, S. Akira, Z. Chen, S. Inoue, and J. U. Jung . 2007. TRIM25 RING-finger E3 ubiquitin ligase is essential for RIG-I-mediated antiviral activity. Nature 446:916-920.
167. Gaddy, D. F. and D. S. Lyles . 2007. Oncolytic vesicular stomatitis virus induces apoptosis via signaling through PKR, Fas, and Daxx. J. Virol. 81:2792-2804.
168. Gale, M., Jr. and E. M. Foy . 2005. Evasion of intracellular host defence by hepatitis C virus. Nature 436:939-945.
169. Garcia, M. A., J. Gil, I. Ventoso, S. Guerra, E. Do mingo, C. Rivas, and M. Esteban . 2006. Impact of protein kinase PKR in cell biology: from antiviral to antiproliferative action. Microbiol. Mol. Biol. Rev. 70:1032-1060.
170. Garcin, D., J. B. Marq, L. Strahle, M. P. le, and D . Kolakofsky . 2002. All four Sendai Virus C proteins bind Stat1, but only the larger forms also induce its mono-ubiquitination and degradation. Virology 295:256-265.
171. Garneau, N. L., J. Wilusz, and C. J. Wilusz . 2007. The highways and byways of mRNA decay. Nat. Rev. Mol. Cell Biol. 8:113-126.
172. Gatignol, A., A. Buckler-White, B. Berkhout, and K. T. Jeang . 1991. Characterization of a human TAR RNA-binding protein that activates the HIV-1 LTR. Science 251:1597-1600.
173. George, C. X. and C. E. Samuel . 1999. Human RNA-specific adenosine deaminase ADAR1 transcripts possess alternative exon 1 structures that initiate from different promoters, one constitutively active and the other interferon inducible. Proc. Natl. Acad. Sci. U. S. A 96:4621-4626.
174. Giannakopoulos, N. V., J. K. Luo, V. Papov, W. Zou, D. J. Lenschow, B. S. Jacobs, E. C. Borden, J. Li, H. W. Virgin, and D. E . Zhang . 2005. Proteomic identification of proteins conjugated to ISG15 in mouse and human cells. Biochem. Biophys. Res. Commun. 336:496-506.
175. Gil, J., J. Alcami, and M. Esteban . 1999. Induction of apoptosis by double-stranded-RNA-dependent protein kinase (PKR) involves the alpha subunit of eukaryotic translation initiation factor 2 and NF-kappaB. Mol. Cell Biol. 19:4653-4663.
176. Girard, M., D. Baltimore, and J. Darnell . 1967. The poliovirus replication complex: Sites for synthesis of poliovirus RNA. J. Mol. Biol. 24:59-74.
205
177. Gitlin, L., W. Barchet, S. Gilfillan, M. Cella, B. Beutler, R. A. Flavell, M. S. Diamond, and M. Colonna . 2006. Essential role of mda-5 in type I IFN responses to polyriboinosinic:polyribocytidylic acid and encephalomyocarditis picornavirus. Proc. Natl. Acad. Sci. U. S. A 103:8459-8464.
178. Glass, P. J., L. J. White, J. M. Ball, I. Leparc-Go ffart, M. E. Hardy, and M. K. Estes . 2000. Norwalk virus open reading frame 3 encodes a minor structural protein. J. Virol. 74:6581-6591.
179. Goodfellow, I., Y. Chaudhry, I. Gioldasi, A. Gerond opoulos, A. Natoni, L. Labrie, J. F. Laliberte, and L. Roberts . 2005. Calicivirus translation initiation requires an interaction between VPg and eIF 4 E. EMBO Rep. 6:968-972.
180. Goto, K., N. Hayashimoto, M. Yasuda, T. Ishida, S. Kameda, A. Takakura, and T. Itoh . 2009. Molecular detection of murine norovirus from experimentally and spontaneously infected mice. Exp. Anim 58:135-140.
181. Graff, J. W., J. Ewen, K. Ettayebi, and M. E. Hardy . 2007. Zinc-binding domain of rotavirus NSP1 is required for proteasome-dependent degradation of IRF3 and autoregulatory NSP1 stability. J. Gen. Virol. 88:613-620.
182. Gray, J. J., X. Jiang, P. Morgan-Capner, U. Desselb erger, and M. K. Estes . 1993. Prevalence of antibodies to Norwalk virus in England: detection by enzyme-linked immunosorbent assay using baculovirus-expressed Norwalk virus capsid antigen. J. Clin. Microbiol. 31:1022-1025.
183. Green . 2007. Caliciviridae, p. 949-979. In D. Knipe and P. Howley (eds.), Fields Virology.
184. Green, K. Y., T. Ando, M. S. Balayan, T. Berke, I. N. Clarke, M. K. Estes, D. O. Matson, S. Nakata, J. D. Neill, M. J. Studdert, and H. J. Thiel . 2000. Taxonomy of the caliciviruses. J. Infect. Dis. 181 Suppl 2 :S322-S330.
185. Greenberg, H. B. and A. Z. Kapikian . 1978. Detection of Norwalk agent antibody and antigen by solid-phase radioimmunoassay and immune adherence hemagglutination assay. J. Am. Vet. Med. Assoc. 173:620-623.
186. Greenlund, A. C., M. A. Farrar, B. L. Viviano, and R. D. Schreiber . 1994. Ligand-induced IFN gamma receptor tyrosine phosphorylation couples the receptor to its signal transduction system (p91). EMBO J. 13:1591-1600.
187. Gruber, A. R., R. Neubock, I. L. Hofacker, and S. W ashietl . 2007. The RNAz web server: prediction of thermodynamically stable and evolutionarily conserved RNA structures. Nucleic Acids Res. 35:W335-W338.
188. Guermonprez, P., J. Valladeau, L. Zitvogel, C. Ther y, and S. Amigorena . 2002. Antigen presentation and T cell stimulation by dendritic cells. Annu. Rev. Immunol. 20:621-667.
189. Gunn, R. A., W. A. Terranova, H. B. Greenberg, J. Y ashuk, G. W. Gary, J. G. Wells, P. R. Taylor, and R. A. Feldman . 1980. Norwalk virus gastroenteritis aboard a cruise ship: an outbreak on five consecutive cruises. Am. J. Epidemiol. 112:820-827.
190. Gunther, H. and P. Otto . 1987. [Diarrhea in young calves. 7. "Zackenvirus" (Jena agent 117/80)--a new diarrhea pathogen in calves]. Arch. Exp. Veterinarmed. 41:934-938.
206
191. Guo, J., D. J. Hui, W. C. Merrick, and G. C. Sen . 2000. A new pathway of translational regulation mediated by eukaryotic initiation factor 3. EMBO J. 19:6891-6899.
192. Guo, Z., L. M. Chen, H. Zeng, J. A. Gomez, J. Plowd en, T. Fujita, J. M. Katz, R. O. Donis, and S. Sambhara . 2007. NS1 protein of influenza A virus inhibits the function of intracytoplasmic pathogen sensor, RIG-I. Am. J. Respir. Cell Mol. Biol. 36:263-269.
193. Gutierrez-Escolano, A. L., M. Vazquez-Ochoa, J. Esc obar-Herrera, and J. Hernandez-Acosta . 2003. La, PTB, and PAB proteins bind to the 3(') untranslated region of Norwalk virus genomic RNA. Biochem. Biophys. Res. Commun. 311:759-766.
194. Haasnoot, P. C., R. C. Olsthoorn, and J. F. Bol . 2002. The Brome mosaic virus subgenomic promoter hairpin is structurally similar to the iron-responsive element and functionally equivalent to the minus-strand core promoter stem-loop C. RNA. 8:110-122.
195. Hacker, H., V. Redecke, B. Blagoev, I. Kratchmarova , L. C. Hsu, G. G. Wang, M. P. Kamps, E. Raz, H. Wagner, G. Hacker, M. Mann, and M. Karin . 2006. Specificity in Toll-like receptor signalling through distinct effector functions of TRAF3 and TRAF6. Nature 439:204-207.
196. Hagmaier, K., H. R. Gelderblom, and G. Kochs . 2004. Functional comparison of the two gene products of Thogoto virus segment 6. J. Gen. Virol. 85:3699-3708.
197. Hagmaier, K., N. Stock, B. Precious, K. Childs, L. F. Wang, S. Goodbourn, and R. E. Randall . 2007. Mapuera virus, a rubulavirus that inhibits interferon signalling in a wide variety of mammalian cells without degrading STATs. J. Gen. Virol. 88:956-966.
198. Hahm, B., M. J. Trifilo, E. I. Zuniga, and M. B. Ol dstone . 2005. Viruses evade the immune system through type I interferon-mediated STAT2-dependent, but STAT1-independent, signaling. Immunity. 22:247-257.
199. Hakki, M. and A. P. Geballe . 2005. Double-stranded RNA binding by human cytomegalovirus pTRS1. J. Virol. 79:7311-7318.
200. Haller, O., P. Staeheli, and G. Kochs . 2007. Interferon-induced Mx proteins in antiviral host defense. Biochimie 89:812-818.
201. Haller, O., S. Stertz, and G. Kochs . 2007. The Mx GTPase family of interferon-induced antiviral proteins. Microbes. Infect. 9:1636-1643.
202. Han, J. Q., G. Wroblewski, Z. Xu, R. H. Silverman, and D. J. Barton . 2004. Sensitivity of hepatitis C virus RNA to the antiviral enzyme ribonuclease L is determined by a subset of efficient cleavage sites. J. Interferon Cytokine Res. 24:664-676.
203. Harber, J. and E. Wimmer . 1993. Aspects of the molecular biology of picornaviruses In Regulation of Gene Expression in Animal Viruses., p. 189-224. In L. Carrasco, N. Sonenberg, and E. Wimmer (eds.), Proc. NATO ASI.
204. Harte, M. T., I. R. Haga, G. Maloney, P. Gray, P. C . Reading, N. W. Bartlett, G. L. Smith, A. Bowie, and L. A. O'Neill . 2003. The poxvirus protein A52R targets Toll-like receptor signaling complexes to suppress host defense. J. Exp. Med. 197:343-351.
207
205. Harty, R. N., P. M. Pitha, and A. Okumura . 2009. Antiviral Activity of Innate Immune Protein ISG15. J. Innate. Immun. 1:397-404.
206. Hassel, B. A., A. Zhou, C. Sotomayor, A. Maran, and R. H. Silverman . 1993. A dominant negative mutant of 2-5A-dependent RNase suppresses antiproliferative and antiviral effects of interferon. EMBO J. 12:3297-3304.
207. Hayashi, Y., T. Ando, E. Utagawa, S. Sekine, S. Oka da, K. Yabuuchi, T. Miki, and M. Ohashi . 1989. Western blot (immunoblot) assay of small, round-structured virus associated with an acute gastroenteritis outbreak in Tokyo. J. Clin. Microbiol. 27:1728-1733.
208. Hayden, M. S. and S. Ghosh . 2004. Signaling to NF-kappaB. Genes Dev. 18:2195-2224.
209. Hedger, R. S. 1972. Foot-and-mouth disease and the African buffalo (Syncerus caffer). J. Comp Pathol. 82:19-28.
210. Heim, M. H. 1999. The Jak-STAT pathway: cytokine signalling from the receptor to the nucleus. J. Recept. Signal. Transduct. Res. 19:75-120.
211. Helbig, K. J., D. T. Lau, L. Semendric, H. A. Harle y, and M. R. Beard . 2005. Analysis of ISG expression in chronic hepatitis C identifies viperin as a potential antiviral effector. Hepatology 42:702-710.
212. Hensley, S. E., A. K. Pinto, H. D. Hickman, R. J. K astenmayer, J. R. Bennink, H. W. Virgin, and J. W. Yewdell . 2009. Murine norovirus infection has no significant effect on adaptive immunity to vaccinia virus or influenza A virus. J. Virol. 83:7357-7360.
213. Herrmann, J. E., N. A. Nowak, and N. R. Blacklow . 1985. Detection of Norwalk virus in stools by enzyme immunoassay. J. Med. Virol. 17:127-133.
214. Hilton, L., K. Moganeradj, G. Zhang, Y. H. Chen, R. E. Randall, J. W. McCauley, and S. Goodbourn . 2006. The NPro product of bovine viral diarrhea virus inhibits DNA binding by interferon regulatory factor 3 and targets it for proteasomal degradation. J. Virol. 80:11723-11732.
215. Hinson, E. R. and P. Cresswell . 2009. The N-terminal amphipathic alpha-helix of viperin mediates localization to the cytosolic face of the endoplasmic reticulum and inhibits protein secretion. J. Biol. Chem. 284:4705-4712.
216. Hinton, T. M., F. Li, and B. S. Crabb . 2000. Internal ribosomal entry site-mediated translation initiation in equine rhinitis A virus: similarities to and differences from that of foot-and-mouth disease virus. J. Virol. 74:11708-11716.
217. Ho, L. J., L. F. Hung, C. Y. Weng, W. L. Wu, P. Cho u, Y. L. Lin, D. M. Chang, T. Y. Tai, and J. H. Lai . 2005. Dengue virus type 2 antagonizes IFN-alpha but not IFN-gamma antiviral effect via down-regulating Tyk2-STAT signaling in the human dendritic cell. J. Immunol. 174:8163-8172.
218. Hoebe, K., X. Du, P. Georgel, E. Janssen, K. Tabeta , S. O. Kim, J. Goode, P. Lin, N. Mann, S. Mudd, K. Crozat, S. Sovath, J. Han, and B. Beutler . 2003. Identification of Lps2 as a key transducer of MyD88-independent TIR signalling. Nature 424:743-748.
219. Hofacker, I. L., M. Fekete, and P. F. Stadler . 2002. Secondary structure prediction for aligned RNA sequences. J. Mol. Biol. 319:1059-1066.
208
220. Hofer, B., F. Steck, H. Gerber, J. Lohrer, J. Nicol et, and M. Paccaud . 1973. An investigation of the etiology of viral respiratory disease in a remount depot, p. 103-109. In J. Bryans and H. Gerber (eds.), Equine infectious diseases.
221. Holmes, D., M. Kemen, and L. Coggins . 1978. Equine rhinovirus infection - serologic evidence of infection in selected United States horse populations In J. Bryans and H. Gerber (eds.), Equine infectious diseases IV.
222. Honda, K., H. Yanai, H. Negishi, M. Asagiri, M. Sat o, T. Mizutani, N. Shimada, Y. Ohba, A. Takaoka, N. Yoshida, and T. Ta niguchi . 2005. IRF-7 is the master regulator of type-I interferon-dependent immune responses. Nature 434:772-777.
223. Hornung, V., J. Ellegast, S. Kim, K. Brzozka, A. Ju ng, H. Kato, H. Poeck, S. Akira, K. K. Conzelmann, M. Schlee, S. Endres, and G. Hartmann . 2006. 5'-Triphosphate RNA is the ligand for RIG-I. Science 314:994-997.
224. Horvath, C. M. 2004. Weapons of STAT destruction. Interferon evasion by paramyxovirus V protein. Eur. J. Biochem. 271:4621-4628.
225. Houseley, J., J. LaCava, and D. Tollervey . 2006. RNA-quality control by the exosome. Nat. Rev. Mol. Cell Biol. 7:529-539.
226. Hovanessian, A. G., R. E. Brown, and I. M. Kerr . 1977. Synthesis of low molecular weight inhibitor of protein synthesis with enzyme from interferon-treated cells. Nature 268:537-540.
227. Hsu, C. C., C. E. Wobus, E. K. Steffen, L. K. Riley , and R. S. Livingston . 2005. Development of a microsphere-based serologic multiplexed fluorescent immunoassay and a reverse transcriptase PCR assay to detect murine norovirus 1 infection in mice. Clin. Diagn. Lab Immunol. 12:1145-1151.
228. Hsu, C. C., L. K. Riley, H. M. Wills, and R. S. Liv ingston . 2006. Persistent infection with and serologic cross-reactivity of three novel murine noroviruses. Comp Med. 56:247-251.
229. Hsu, C. C., L. K. Riley, and R. S. Livingston . 2007. Molecular characterization of three novel murine noroviruses. Virus Genes 34:147-155.
230. Huang, Z., S. Krishnamurthy, A. Panda, and S. K. Sa mal . 2003. Newcastle disease virus V protein is associated with viral pathogenesis and functions as an alpha interferon antagonist. J. Virol. 77:8676-8685.
231. Huthoff, H. and B. Berkhout . 2002. Multiple secondary structure rearrangements during HIV-1 RNA dimerization. Biochemistry 41:10439-10445.
232. Hutson, A. M., R. L. Atmar, D. M. Marcus, and M. K. Estes . 2003. Norwalk virus-like particle hemagglutination by binding to h histo-blood group antigens. J. Virol. 77:405-415.
233. Hutson, A. M., R. L. Atmar, and M. K. Estes . 2004. Norovirus disease: changing epidemiology and host susceptibility factors. Trends Microbiol. 12:279-287.
234. Hyde, J. L., S. V. Sosnovtsev, K. Y. Green, C. Wobu s, H. W. Virgin, and J. M. Mackenzie . 2009. Mouse norovirus replication is associated with virus-induced vesicle clusters originating from membranes derived from the secretory pathway. J. Virol. 83 :9709-9719.
209
235. Ihle, J. N. 1995. The Janus protein tyrosine kinase family and its role in cytokine signaling. Adv. Immunol. 60:1-35.
236. Imani, F. and B. L. Jacobs . 1988. Inhibitory activity for the interferon-induced protein kinase is associated with the reovirus serotype 1 sigma 3 protein. Proc. Natl. Acad. Sci. U. S. A 85:7887-7891.
237. Iordanov, M. S., J. D. Kirsch, O. P. Ryabinina, J. Wong, P. N. Spitz, V. B. Korcheva, A. Thorburn, and B. E. Magun . 2005. Recruitment of TRADD, FADD, and caspase 8 to double-stranded RNA-triggered death inducing signaling complexes (dsRNA-DISCs). Apoptosis. 10:167-176.
238. Iqbal, M., E. Poole, S. Goodbourn, and J. W. McCaul ey. 2004. Role for bovine viral diarrhea virus Erns glycoprotein in the control of activation of beta interferon by double-stranded RNA. J. Virol. 78:136-145.
239. Isaacs, A. and J. Lindenmann . 1957. Virus interference. I. The interferon. Proc. R. Soc. Lond B Biol. Sci. 147:258-267.
240. Ito, T., M. Yang, and W. S. May . 1999. RAX, a cellular activator for double-stranded RNA-dependent protein kinase during stress signaling. J. Biol. Chem. 274:15427-15432.
241. Jackson, W. T., T. H. Giddings, Jr., M. P. Taylor, S. Mulinyawe, M. Rabinovitch, R. R. Kopito, and K. Kirkegaard . 2005. Subversion of cellular autophagosomal machinery by RNA viruses. PLoS. Biol. 3:e156.
242. Jacobson, S. J., D. A. Konings, and P. Sarnow . 1993. Biochemical and genetic evidence for a pseudoknot structure at the 3' terminus of the poliovirus RNA genome and its role in viral RNA amplification. J. Virol. 67:2961-2971.
243. Jang, S. K., T. V. Pestova, C. U. Hellen, G. W. Wit herell, and E. Wimmer . 1990. Cap-independent translation of picornavirus RNAs: structure and function of the internal ribosomal entry site. Enzyme 44:292-309.
244. Jang, S. K. and E. Wimmer . 1990. Cap-independent translation of encephalomyocarditis virus RNA: structural elements of the internal ribosomal entry site and involvement of a cellular 57-kD RNA-binding protein. Genes Dev. 4:1560-1572.
245. Jaworska, J., A. Gravel, K. Fink, N. Grandvaux, and L. Flamand . 2007. Inhibition of transcription of the beta interferon gene by the human herpesvirus 6 immediate-early 1 protein. J. Virol. 81:5737-5748.
246. Jiang, X., M. Wang, D. Y. Graham, and M. K. Estes . 1992. Expression, self-assembly, and antigenicity of the Norwalk virus capsid protein. J. Virol. 66:6527-6532.
247. Jiang, X., J. Wang, D. Y. Graham, and M. K. Estes . 1992. Detection of Norwalk virus in stool by polymerase chain reaction. J. Clin. Microbiol. 30:2529-2534.
248. Jiang, Z., T. W. Mak, G. Sen, and X. Li . 2004. Toll-like receptor 3-mediated activation of NF-kappaB and IRF3 diverges at Toll-IL-1 receptor domain-containing adapter inducing IFN-beta. Proc. Natl. Acad. Sci. U. S. A 101:3533-3538.
249. Joachims, M., P. C. Van Breugel, and R. E. Lloyd . 1999. Cleavage of poly(A)-binding protein by enterovirus proteases concurrent with inhibition of translation in vitro. J. Virol. 73:718-727.
210
250. Joo, M., Y. S. Hahn, M. Kwon, R. T. Sadikot, T. S. Blackwell, and J. W. Christman . 2005. Hepatitis C virus core protein suppresses NF-kappaB activation and cyclooxygenase-2 expression by direct interaction with IkappaB kinase beta. J. Virol. 79:7648-7657.
251. Jordan, W. S., Jr., I. Gordon, and W. R. Dorrance . 1953. A study of illness in a group of Cleveland families. VII. Transmission of acute non-bacterial gastroenteritis to volunteers: evidence for two different etiologic agents. J. Exp. Med. 98:461-475.
252. Jounai, N., F. Takeshita, K. Kobiyama, A. Sawano, A . Miyawaki, K. Q. Xin, K. J. Ishii, T. Kawai, S. Akira, K. Suzuki, and K. Okuda . 2007. The Atg5 Atg12 conjugate associates with innate antiviral immune responses. Proc. Natl. Acad. Sci. U. S. A 104 :14050-14055.
253. Kadowaki, N., S. Ho, S. Antonenko, R. W. Malefyt, R . A. Kastelein, F. Bazan, and Y. J. Liu . 2001. Subsets of human dendritic cell precursors express different toll-like receptors and respond to different microbial antigens. J. Exp. Med. 194:863-869.
254. Kageyama, T., S. Kojima, M. Shinohara, K. Uchida, S . Fukushi, F. B. Hoshino, N. Takeda, and K. Katayama . 2003. Broadly reactive and highly sensitive assay for Norwalk-like viruses based on real-time quantitative reverse transcription-PCR. J. Clin. Microbiol. 41:1548-1557.
255. Kapikian, A. Z., R. G. Wyatt, R. Dolin, T. S. Thorn hill, A. R. Kalica, and R. M. Chanock . 1972. Visualization by immune electron microscopy of a 27-nm particle associated with acute infectious nonbacterial gastroenteritis. J. Virol. 10:1075-1081.
256. Kapikian, A. Z. 2000. The discovery of the 27-nm Norwalk virus: an historic perspective. J. Infect. Dis. 181 Suppl 2 :S295-S302.
257. Kaplan, J. E., R. Feldman, D. S. Campbell, C. Looka baugh, and G. W. Gary . 1982. The frequency of a Norwalk-like pattern of illness in outbreaks of acute gastroenteritis. Am. J. Public Health 72:1329-1332.
258. Kaplan, J. E., G. W. Gary, R. C. Baron, N. Singh, L . B. Schonberger, R. Feldman, and H. B. Greenberg . 1982. Epidemiology of Norwalk gastroenteritis and the role of Norwalk virus in outbreaks of acute nonbacterial gastroenteritis. Ann. Intern. Med. 96:756-761.
259. Karst, S. M., C. E. Wobus, M. Lay, J. Davidson, and H. W. Virgin . 2003. STAT1-dependent innate immunity to a Norwalk-like virus. Science 299:1575-1578.
260. Kato, H., O. Takeuchi, S. Sato, M. Yoneyama, M. Yam amoto, K. Matsui, S. Uematsu, A. Jung, T. Kawai, K. J. Ishii, O. Yamaguc hi, K. Otsu, T. Tsujimura, C. S. Koh, Reis e Sousa, Y. Matsuura, T. Fujita, and S. Akira . 2006. Differential roles of MDA5 and RIG-I helicases in the recognition of RNA viruses. Nature 441:101-105.
261. Kato, H., O. Takeuchi, E. Mikamo-Satoh, R. Hirai, T . Kawai, K. Matsushita, A. Hiiragi, T. S. Dermody, T. Fujita, and S. Akira . 2008. Length-dependent recognition of double-stranded ribonucleic acids by retinoic acid-inducible gene-I and melanoma differentiation-associated gene 5. J. Exp. Med. 205:1601-1610.
262. Katow, S. and A. Sugiura . 1988. Low pH-induced conformational change of rubella virus envelope proteins. J. Gen. Virol. 69 ( Pt 11):2797-2807.
211
263. Katpally, U., C. E. Wobus, K. Dryden, H. W. Virgin, and T. J. Smith . 2008. Structure of antibody-neutralized murine norovirus and unexpected differences from viruslike particles. J. Virol. 82:2079-2088.
264. Kawai, T., K. Takahashi, S. Sato, C. Coban, H. Kuma r, H. Kato, K. J. Ishii, O. Takeuchi, and S. Akira . 2005. IPS-1, an adaptor triggering RIG-I- and Mda5-mediated type I interferon induction. Nat. Immunol. 6:981-988.
265. Kawakami, T., M. Matsumoto, M. Sato, H. Harada, T. Taniguchi, and M. Kitagawa . 1995. Possible involvement of the transcription factor ISGF3 gamma in virus-induced expression of the IFN-beta gene. FEBS Lett. 358:225-229.
266. Kawakubo, K. and C. E. Samuel . 2000. Human RNA-specific adenosine deaminase (ADAR1) gene specifies transcripts that initiate from a constitutively active alternative promoter. Gene 258:165-172.
267. Kerr, I. M. and R. E. Brown . 1978. pppA2'p5'A2'p5'A: an inhibitor of protein synthesis synthesized with an enzyme fraction from interferon-treated cells. Proc. Natl. Acad. Sci. U. S. A 75:256-260.
268. Kerscher, O., R. Felberbaum, and M. Hochstrasser . 2006. Modification of proteins by ubiquitin and ubiquitin-like proteins. Annu. Rev. Cell Dev. Biol. 22:159-180.
269. Khabar, K. S., F. Al-Zoghaibi, M. N. Al-Ahdal, T. M urayama, M. Dhalla, N. Mukaida, M. Taha, S. T. Al-Sedairy, Y. Siddiqui, G. Kessie, and K. Matsushima . 1997. The alpha chemokine, interleukin 8, inhibits the antiviral action of interferon alpha. J. Exp. Med. 186:1077-1085.
270. Kieft, J. S., K. Zhou, R. Jubin, M. G. Murray, J. Y . Lau, and J. A. Doudna . 1999. The hepatitis C virus internal ribosome entry site adopts an ion-dependent tertiary fold. J. Mol. Biol. 292:513-529.
271. Kim, T. S. and S. Perlman . 2003. Protection against CTL escape and clinical disease in a murine model of virus persistence. J. Immunol. 171:2006-2013.
272. Kint, T., R. Goldsby, and B. Osbourne . 2007. Innate immunity, p. 52-75. Kuby Immunology.
273. Kirchweger, R., E. Ziegler, B. J. Lamphear, D. Wate rs, H. D. Liebig, W. Sommergruber, F. Sobrino, C. Hohenadl, D. Blaas, R. E. Rhoads, and . 1994. Foot-and-mouth disease virus leader proteinase: purification of the Lb form and determination of its cleavage site on eIF-4 gamma. J. Virol. 68:5677-5684.
274. Kirkegaard, K., M. P. Taylor, and W. T. Jackson . 2004. Cellular autophagy: surrender, avoidance and subversion by microorganisms. Nat. Rev. Microbiol. 2:301-314.
275. Knudsen, B. and J. Hein . 1999. RNA secondary structure prediction using stochastic context-free grammars and evolutionary history. Bioinformatics. 15:446-454.
276. Ko, G., Z. D. Jiang, P. C. Okhuysen, and H. L. DuPo nt . 2006. Fecal cytokines and markers of intestinal inflammation in international travelers with diarrhea due to Noroviruses. J. Med. Virol. 78:825-828.
277. Kochs, G. and O. Haller . 1999. Interferon-induced human MxA GTPase blocks nuclear import of Thogoto virus nucleocapsids. Proc. Natl. Acad. Sci. U. S. A 96:2082-2086.
212
278. Kolupaeva, V. G., I. B. Lomakin, T. V. Pestova, and C. U. Hellen . 2003. Eukaryotic initiation factors 4G and 4A mediate conformational changes downstream of the initiation codon of the encephalomyocarditis virus internal ribosomal entry site. Mol. Cell Biol. 23:687-698.
279. Kolykhalov, A. A., S. M. Feinstone, and C. M. Rice . 1996. Identification of a highly conserved sequence element at the 3' terminus of hepatitis C virus genome RNA. J. Virol. 70:3363-3371.
280. Kolykhalov, A. A., K. Mihalik, S. M. Feinstone, and C. M. Rice . 2000. Hepatitis C virus-encoded enzymatic activities and conserved RNA elements in the 3' nontranslated region are essential for virus replication in vivo. J. Virol. 74:2046-2051.
281. Kopecky-Bromberg, S. A., L. Martinez-Sobrido, M. Fr ieman, R. A. Baric, and P. Palese . 2007. Severe acute respiratory syndrome coronavirus open reading frame (ORF) 3b, ORF 6, and nucleocapsid proteins function as interferon antagonists. J. Virol. 81 :548-557.
282. Kotenko, S. V., L. S. Izotova, O. V. Mirochnitchenk o, E. Esterova, H. Dickensheets, R. P. Donnelly, and S. Pestka . 2001. Identification, cloning, and characterization of a novel soluble receptor that binds IL-22 and neutralizes its activity. J. Immunol. 166:7096-7103.
283. Krausslich, H. G., C. Holscher, Q. Reuer, J. Harber , and E. Wimmer . 1990. Myristoylation of the poliovirus polyprotein is required for proteolytic processing of the capsid and for viral infectivity. J. Virol. 64:2433-2436.
284. Kriegshauser, G., A. Deutz, E. Kuechler, T. Skern, H. Lussy, and N. Nowotny . 2005. Prevalence of neutralizing antibodies to Equine rhinitis A and B virus in horses and man. Vet. Microbiol. 106:293-296.
285. Kubota, K., K. Nakahara, T. Ohtsuka, S. Yoshida, J. Kawaguchi, Y. Fujita, Y. Ozeki, A. Hara, C. Yoshimura, H. Furukawa, H. Ha ruyama, K. Ichikawa, M. Yamashita, T. Matsuoka, and Y. Iijima . 2004. Identification of 2'-phosphodiesterase, which plays a role in the 2-5A system regulated by interferon. J. Biol. Chem. 279:37832-37841.
286. Kubota, T., N. Yokosawa, S. Yokota, and N. Fujii . 2001. C terminal CYS-RICH region of mumps virus structural V protein correlates with block of interferon alpha and gamma signal transduction pathway through decrease of STAT 1-alpha. Biochem. Biophys. Res. Commun. 283:255-259.
287. Kubota, T., N. Yokosawa, S. Yokota, and N. Fujii . 2002. Association of mumps virus V protein with RACK1 results in dissociation of STAT-1 from the alpha interferon receptor complex. J. Virol. 76:12676-12682.
288. Kubota, T., N. Yokosawa, S. Yokota, N. Fujii, M. Ta shiro, and A. Kato . 2005. Mumps virus V protein antagonizes interferon without the complete degradation of STAT1. J. Virol. 79:4451-4459.
289. Kuhn, R. 2007. Togaviridae: the viruses and their replication, p. 1001-1022. In D. Knipe and P. Howley (eds.), Field's Virology.
290. Kujala, P., A. Ikaheimonen, N. Ehsani, H. Vihinen, P. Auvinen, and L. Kaariainen . 2001. Biogenesis of the Semliki Forest virus RNA replication complex. J. Virol. 75:3873-3884.
291. Kumar, H., T. Kawai, H. Kato, S. Sato, K. Takahashi , C. Coban, M. Yamamoto, S. Uematsu, K. J. Ishii, O. Takeuchi, and S. Akira . 2006.
213
Essential role of IPS-1 in innate immune responses against RNA viruses. J. Exp. Med. 203:1795-1803.
292. L'Homme, Y., R. Sansregret, E. Plante-Fortier, A. M . Lamontagne, G. Lacroix, M. Ouardani, J. Deschamps, G. Simard, and C. Simard . 2009. Genetic diversity of porcine Norovirus and Sapovirus: Canada, 2005-2007. Arch. Virol. 154:581-593.
293. Langland, J. O., S. Pettiford, B. Jiang, and B. L. Jacobs . 1994. Products of the porcine group C rotavirus NSP3 gene bind specifically to double-stranded RNA and inhibit activation of the interferon-induced protein kinase PKR. J. Virol. 68:3821-3829.
294. Langland, J. O., J. M. Cameron, M. C. Heck, J. K. J ancovich, and B. L. Jacobs . 2006. Inhibition of PKR by RNA and DNA viruses. Virus Res. 119:100-110.
295. Le Bon. A. and D. F. Tough . 2002. Links between innate and adaptive immunity via type I interferon. Curr. Opin. Immunol. 14:432-436.
296. Le Bon. A., N. Etchart, C. Rossmann, M. Ashton, S. Hou, D. Gewert, P. Borrow, and D. F. Tough . 2003. Cross-priming of CD8+ T cells stimulated by virus-induced type I interferon. Nat. Immunol. 4:1009-1015.
297. Le Guyader. F., M. K. Estes, M. E. Hardy, F. H. Nei ll, J. Green, D. W. Brown, and R. L. Atmar . 1996. Evaluation of a degenerate primer for the PCR detection of human caliciviruses. Arch. Virol. 141:2225-2235.
298. Lee, H. K., J. M. Lund, B. Ramanathan, N. Mizushima , and A. Iwasaki . 2007. Autophagy-dependent viral recognition by plasmacytoid dendritic cells. Science 315:1398-1401.
299. Lee, S. B. and M. Esteban . 1994. The interferon-induced double-stranded RNA-activated protein kinase induces apoptosis. Virology 199:491-496.
300. Lee, T. G., J. Tomita, A. G. Hovanessian, and M. G. Katze . 1992. Characterization and regulation of the 58,000-dalton cellular inhibitor of the interferon-induced, dsRNA-activated protein kinase. J. Biol. Chem. 267:14238-14243.
301. Lee, Y. F., A. Nomoto, B. M. Detjen, and E. Wimmer . 1977. A protein covalently linked to poliovirus genome RNA. Proc. Natl. Acad. Sci. U. S. A 74:59-63.
302. Lenschow, D. J., C. Lai, N. Frias-Staheli, N. V. Gi annakopoulos, A. Lutz, T. Wolff, A. Osiak, B. Levine, R. E. Schmidt, A. Garci a-Sastre, D. A. Leib, A. Pekosz, K. P. Knobeloch, I. Horak, and H. W. Virgin . 2007. IFN-stimulated gene 15 functions as a critical antiviral molecule against influenza, herpes, and Sindbis viruses. Proc. Natl. Acad. Sci. U. S. A 104:1371-1376.
303. Leonard, G. T. and G. C. Sen . 1996. Effects of adenovirus E1A protein on interferon-signaling. Virology 224:25-33.
304. Li, C., C. Z. Ni, M. L. Havert, E. Cabezas, J. He, D. Kaiser, J. C. Reed, A. C. Satterthwait, G. Cheng, and K. R. Ely . 2002. Downstream regulator TANK binds to the CD40 recognition site on TRAF3. Structure. 10:403-411.
305. Li, F., G. F. Browning, M. J. Studdert, and B. S. C rabb . 1996. Equine rhinovirus 1 is more closely related to foot-and-mouth disease virus than to other picornaviruses. Proc. Natl. Acad. Sci. U. S. A 93:990-995.
214
306. Li, K., E. Foy, J. C. Ferreon, M. Nakamura, A. C. F erreon, M. Ikeda, S. C. Ray, M. Gale, Jr., and S. M. Lemon . 2005. Immune evasion by hepatitis C virus NS3/4A protease-mediated cleavage of the Toll-like receptor 3 adaptor protein TRIF. Proc. Natl. Acad. Sci. U. S. A 102:2992-2997.
307. Li, Q., R. Means, S. Lang, and J. U. Jung . 2007. Downregulation of gamma interferon receptor 1 by Kaposi's sarcoma-associated herpesvirus K3 and K5. J. Virol. 81:2117-2127.
308. Li, S., S. Labrecque, M. C. Gauzzi, A. R. Cuddihy, A. H. Wong, S. Pellegrini, G. J. Matlashewski, and A. E. Koromilas . 1999. The human papilloma virus (HPV)-18 E6 oncoprotein physically associates with Tyk2 and impairs Jak-STAT activation by interferon-alpha. Oncogene 18:5727-5737.
309. Li, S., J. Y. Min, R. M. Krug, and G. C. Sen . 2006. Binding of the influenza A virus NS1 protein to PKR mediates the inhibition of its activation by either PACT or double-stranded RNA. Virology 349:13-21.
310. Li, X., C. T. Ranjith-Kumar, M. T. Brooks, S. Dharm aiah, A. B. Herr, C. Kao, and P. Li . 2009. The RIG-I-like receptor LGP2 recognizes the termini of double-stranded RNA. J. Biol. Chem. 284:13881-13891.
311. Li, X., C. Lu, M. Stewart, H. Xu, R. K. Strong, T. Igumenova, and P. Li . 2009. Structural Basis of Double-stranded RNA Recognition by the RIG-I like Receptor MDA5. Arch. Biochem. Biophys.
312. Lin, R., C. Heylbroeck, P. M. Pitha, and J. Hiscott . 1998. Virus-dependent phosphorylation of the IRF-3 transcription factor regulates nuclear translocation, transactivation potential, and proteasome-mediated degradation. Mol. Cell Biol. 18:2986-2996.
313. Lin, R., P. Genin, Y. Mamane, M. Sgarbanti, A. Batt istini, W. J. Harrington, Jr., G. N. Barber, and J. Hiscott . 2001. HHV-8 encoded vIRF-1 represses the interferon antiviral response by blocking IRF-3 recruitment of the CBP/p300 coactivators. Oncogene 20:800-811.
314. Lin, R., R. S. Noyce, S. E. Collins, R. D. Everett, and K. L. Mossman . 2004. The herpes simplex virus ICP0 RING finger domain inhibits. J. Virol. 78:1675-1684.
315. Lin, R., J. Lacoste, P. Nakhaei, Q. Sun, L. Yang, S . Paz, P. Wilkinson, I. Julkunen, D. Vitour, E. Meurs, and J. Hiscott . 2006. Dissociation of a MAVS/IPS-1/VISA/Cardif-IKKepsilon molecular complex from the mitochondrial outer membrane by hepatitis C virus NS3-4A proteolytic cleavage. J. Virol. 80:6072-6083.
316. Lin, R. J., C. L. Liao, E. Lin, and Y. L. Lin . 2004. Blocking of the alpha interferon-induced Jak-Stat signaling pathway by Japanese encephalitis virus infection. J. Virol. 78:9285-9294.
317. Lin, W., S. S. Kim, E. Yeung, Y. Kamegaya, J. T. Bl ackard, K. A. Kim, M. J. Holtzman, and R. T. Chung . 2006. Hepatitis C virus core protein blocks interferon signaling by interaction with the STAT1 SH2 domain. J. Virol. 80:9226-9235.
318. Lindenbach, T. R. 2009. Flaviviridae, p. 1101-1152. In D. Knipe and P. Howley (eds.), Fields Virology.
319. Lindenmann, J. 1962. Resistance of mice to mouse-adapted influenza A virus. Virology 16:203-204.
215
320. Lindesmith, L., C. Moe, S. Marionneau, N. Ruvoen, X . Jiang, L. Lindblad, P. Stewart, J. LePendu, and R. Baric . 2003. Human susceptibility and resistance to Norwalk virus infection. Nat. Med. 9:548-553.
321. Lindesmith, L., C. Moe, J. LePendu, J. A. Frelinger , J. Treanor, and R. S. Baric . 2005. Cellular and humoral immunity following Snow Mountain virus challenge. J. Virol. 79:2900-2909.
322. Liu, B., I. N. Clarke, and P. R. Lambden . 1996. Polyprotein processing in Southampton virus: identification of 3C-like protease cleavage sites by in vitro mutagenesis. J. Virol. 70:2605-2610.
323. Liu, B., A. M. Woltman, H. L. Janssen, and A. Boons tra . 2009. Modulation of dendritic cell function by persistent viruses. J. Leukoc. Biol. 85:205-214.
324. Liu, B. L., P. R. Lambden, H. Gunther, P. Otto, M. Elschner, and I. N. Clarke . 1999. Molecular characterization of a bovine enteric calicivirus: relationship to the Norwalk-like viruses. J. Virol. 73:819-825.
325. Liu, G., S. M. Kahan, Y. Jia, and S. M. Karst . 2009. Primary high-dose murine norovirus 1 infection fails to protect from secondary challenge with homologous virus. J. Virol. 83:6963-6968.
326. Liu, J., M. A. Carmell, F. V. Rivas, C. G. Marsden, J. M. Thomson, J. J. Song, S. M. Hammond, L. Joshua-Tor, and G. J. Hanno n. 2004. Argonaute2 is the catalytic engine of mammalian RNAi. Science 305:1437-1441.
327. Liu, Y. C., J. Penninger, and M. Karin . 2005. Immunity by ubiquitylation: a reversible process of modification. Nat. Rev. Immunol. 5:941-952.
328. Liu, Z., M. Winkler, and B. Biegalke . 2009. Human cytomegalovirus: host immune modulation by the viral US3 gene. Int. J. Biochem. Cell Biol. 41:503-506.
329. LoBue, A. D., J. M. Thompson, L. Lindesmith, R. E. Johnston, and R. S. Baric . 2009. Alphavirus-adjuvanted norovirus-like particle vaccines: heterologous, humoral, and mucosal immune responses protect against murine norovirus challenge. J. Virol. 83 :3212-3227.
330. Lochridge, V. P., K. L. Jutila, J. W. Graff, and M. E. Hardy . 2005. Epitopes in the P2 domain of norovirus VP1 recognized by monoclonal antibodies that block cell interactions. J. Gen. Virol. 86:2799-2806.
331. Lochridge, V. P. and M. E. Hardy . 2007. A single-amino-acid substitution in the P2 domain of VP1 of murine norovirus is sufficient for escape from antibody neutralization. J. Virol. 81:12316-12322.
332. Loeb, K. R. and A. L. Haas . 1992. The interferon-inducible 15-kDa ubiquitin homolog conjugates to intracellular proteins. J. Biol. Chem. 267:7806-7813.
333. Look, D. C., W. T. Roswit, A. G. Frick, Y. Gris-Ale vy, D. M. Dickhaus, M. J. Walter, and M. J. Holtzman . 1998. Direct suppression of Stat1 function during adenoviral infection. Immunity. 9:871-880.
334. Lopman, B. A., M. H. Reacher, I. B. Vipond, J. Sara ngi, and D. W. Brown . 2004. Clinical manifestation of norovirus gastroenteritis in health care settings. Clin. Infect. Dis. 39:318-324.
335. Lu, G., J. T. Reinert, I. Pitha-Rowe, A. Okumura, M . Kellum, K. P. Knobeloch, B. Hassel, and P. M. Pitha . 2006. ISG15 enhances the innate
216
antiviral response by inhibition of IRF-3 degradation. Cell Mol. Biol. (Noisy. -le-grand) 52:29-41.
336. Lukavsky, P. J. 2009. Structure and function of HCV IRES domains. Virus Res. 139:166-171.
337. Malakhov, M. P., O. A. Malakhova, K. I. Kim, K. J. Ritchie, and D. E. Zhang . 2002. UBP43 (USP18) specifically removes ISG15 from conjugated proteins. J. Biol. Chem. 277 :9976-9981.
338. Malathi, K., J. M. Paranjape, E. Bulanova, M. Shim, J. M. Guenther-Johnson, P. W. Faber, T. E. Eling, B. R. Williams, and R. H. Silverman . 2005. A transcriptional signaling pathway in the IFN system mediated by 2'-5'-oligoadenylate activation of RNase L. Proc. Natl. Acad. Sci. U. S. A 102:14533-14538.
339. Manche, L., S. R. Green, C. Schmedt, and M. B. Math ews . 1992. Interactions between double-stranded RNA regulators and the protein kinase DAI. Mol. Cell Biol. 12:5238-5248.
340. Maniatis, T., J. V. Falvo, T. H. Kim, T. K. Kim, C. H. Lin, B. S. Parekh, and M. G. Wathelet . 1998. Structure and function of the interferon-beta enhanceosome. Cold Spring Harb. Symp. Quant. Biol. 63:609-620.
341. Marcus, P. I. and M. J. Sekellick . 1977. Defective interfering particles with covalently linked [+/-]RNA induce interferon. Nature 266:815-819.
342. Marcus, P. I. 1983. Interferon induction by viruses: one molecule of dsRNA as the threshold for interferon induction. Interferon 5:115-180.
343. Marie, I., J. E. Durbin, and D. E. Levy . 1998. Differential viral induction of distinct interferon-alpha genes by positive feedback through interferon regulatory factor-7. EMBO J. 17:6660-6669.
344. Markham, N. R. and M. Zuker . 2008. UNAFold: software for nucleic acid folding and hybridization. Methods Mol. Biol. 453:3-31.
345. Marsh, M., A. Helenius, K. Matlin, and K. Simons . 1983. Binding, endocytosis, and degradation of enveloped animal viruses. Methods Enzymol. 98:260-266.
346. Martinand, C., T. Salehzada, M. Silhol, B. Lebleu, and C. Bisbal . 1998. RNase L inhibitor (RLI) antisense constructions block partially the down regulation of the 2-5A/RNase L pathway in encephalomyocarditis-virus-(EMCV)-infected cells. Eur. J. Biochem. 254:248-255.
347. Martinez-Costas, J., C. Gonzalez-Lopez, V. N. Vakha ria, and J. Benavente . 2000. Possible involvement of the double-stranded RNA-binding core protein sigmaA in the resistance of avian reovirus to interferon. J. Virol. 74:1124-1131.
348. Martinez-Salas, E., J. C. Saiz, M. Davila, G. J. Be lsham, and E. Domingo . 1993. A single nucleotide substitution in the internal ribosome entry site of foot-and-mouth disease virus leads to enhanced cap-independent translation in vivo. J. Virol. 67 :3748-3755.
349. Mason, P. W., S. V. Bezborodova, and T. M. Henry . 2002. Identification and characterization of a cis-acting replication element (cre) adjacent to the internal ribosome entry site of foot-and-mouth disease virus. J. Virol. 76:9686-9694.
217
350. Mathews, D. H. 2004. Using an RNA secondary structure partition function to determine confidence in base pairs predicted by free energy minimization. RNA. 10:1178-1190.
351. Mathews, D. H., M. D. Disney, J. L. Childs, S. J. S chroeder, M. Zuker, and D. H. Turner . 2004. Incorporating chemical modification constraints into a dynamic programming algorithm for prediction of RNA secondary structure. Proc. Natl. Acad. Sci. U. S. A 101:7287-7292.
352. Mathews, D. H. and D. H. Turner . 2006. Prediction of RNA secondary structure by free energy minimization. Curr. Opin. Struct. Biol. 16:270-278.
353. Matsui, S. M., J. P. Kim, H. B. Greenberg, W. Su, Q . Sun, P. C. Johnson, H. L. DuPont, L. S. Oshiro, and G. R. Reyes . 1991. The isolation and characterization of a Norwalk virus-specific cDNA. J. Clin. Invest 87:1456-1461.
354. Matsumoto, M., S. Kikkawa, M. Kohase, K. Miyake, an d T. Seya . 2002. Establishment of a monoclonal antibody against human Toll-like receptor 3 that blocks double-stranded RNA-mediated signaling. Biochem. Biophys. Res. Commun. 293:1364-1369.
355. Matzener, P., I. Magkouras, T. Rumenapf, E. Peterha ns, and M. Schweizer . 2009. The viral RNase E(rns) prevents IFN type-I triggering by pestiviral single- and double-stranded RNAs. Virus Res. 140:15-23.
356. Mauroy, A., A. Scipioni, E. Mathijs, C. Saegerman, J. Mast, J. C. Bridger, D. Ziant, C. Thys, and E. Thiry . 2009. Epidemiological study of bovine norovirus infection by RT-PCR and a VLP-based antibody ELISA. Vet. Microbiol. 137:243-251.
357. McCartney, S. A., L. B. Thackray, L. Gitlin, S. Gil fillan, H. W. Virgin, and M. Colonna . 2008. MDA-5 recognition of a murine norovirus. PLoS. Pathog. 4:e1000108.
358. McCaskill, J. S. 1990. The equilibrium partition function and base pair binding probabilities for RNA secondary structure. Biopolymers 29:1105-1119.
359. McCollum, W. H and Timoney, P. Studies on the seroprevalence and the frequency of equine rhinovirus-I and II infection in normal horse urine. Proc.6th Equine.Infect.Dis.Conf. 83-88. 1992. Ref Type: Generic
360. McKenna, K., A. S. Beignon, and N. Bhardwaj . 2005. Plasmacytoid dendritic cells: linking innate and adaptive immunity. J. Virol. 79:17-27.
361. Melen, K., T. Ronni, B. Broni, R. M. Krug, C. H. vo n Bonsdorff, and I. Julkunen . 1992. Interferon-induced Mx proteins form oligomers and contain a putative leucine zipper. J. Biol. Chem. 267:25898-25907.
362. Merika, M. and D. Thanos . 2001. Enhanceosomes. Curr. Opin. Genet. Dev. 11:205-208.
363. Meylan, E., K. Burns, K. Hofmann, V. Blancheteau, F . Martinon, M. Kelliher, and J. Tschopp . 2004. RIP1 is an essential mediator of Toll-like receptor 3-induced NF-kappa B activation. Nat. Immunol. 5:503-507.
364. Meylan, E., J. Curran, K. Hofmann, D. Moradpour, M. Binder, R. Bartenschlager, and J. Tschopp . 2005. Cardif is an adaptor protein in the RIG-I antiviral pathway and is targeted by hepatitis C virus. Nature 437:1167-1172.
218
365. Mibayashi, M., L. Martinez-Sobrido, Y. M. Loo, W. B . Cardenas, M. Gale, Jr., and A. Garcia-Sastre . 2007. Inhibition of retinoic acid-inducible gene I-mediated induction of beta interferon by the NS1 protein of influenza A virus. J. Virol. 81:514-524.
366. Miller, D. M., B. M. Rahill, J. M. Boss, M. D. Lair more, J. E. Durbin, J. W. Waldman, and D. D. Sedmak . 1998. Human cytomegalovirus inhibits major histocompatibility complex class II expression by disruption of the Jak/Stat pathway. J. Exp. Med. 187:675-683.
367. Min, J. Y. and R. M. Krug . 2006. The primary function of RNA binding by the influenza A virus NS1 protein in infected cells: Inhibiting the 2'-5' oligo (A) synthetase/RNase L pathway. Proc. Natl. Acad. Sci. U. S. A 103:7100-7105.
368. Minks, M. A., D. K. West, S. Benvin, and C. Baglion i. 1979. Structural requirements of double-stranded RNA for the activation of 2',5'-oligo(A) polymerase and protein kinase of interferon-treated HeLa cells. J. Biol. Chem. 254:10180-10183.
369. Moe, C. L., J. Gentsch, T. Ando, G. Grohmann, S. S. Monroe, X. Jiang, J. Wang, M. K. Estes, Y. Seto, C. Humphrey, and . 1994. Application of PCR to detect Norwalk virus in fecal specimens from outbreaks of gastroenteritis. J. Clin. Microbiol. 32:642-648.
370. Moradpour, D., F. Penin, and C. M. Rice . 2007. Replication of hepatitis C virus. Nat. Rev. Microbiol. 5:453-463.
371. Mounts, A. W., T. Ando, M. Koopmans, J. S. Bresee, J. Noel, and R. I. Glass . 2000. Cold weather seasonality of gastroenteritis associated with Norwalk-like viruses. J. Infect. Dis. 181 Suppl 2 :S284-S287.
372. Mueller, N. H., D. H. Gilden, R. J. Cohrs, R. Mahal ingam, and M. A. Nagel . 2008. Varicella zoster virus infection: clinical features, molecular pathogenesis of disease, and latency. Neurol. Clin. 26:675-97, viii.
373. Muller, B., U. Klemm, M. A. Mas, and E. Schreier . 2007. Genetic diversity and recombination of murine noroviruses in immunocompromised mice. Arch. Virol. 152:1709-1719.
374. Mumphrey, S. M., H. Changotra, T. N. Moore, E. R. H eimann-Nichols, C. E. Wobus, M. J. Reilly, M. Moghadamfalahi, D. Shukla, and S. M. Karst . 2007. Murine norovirus 1 infection is associated with histopathological changes in immunocompetent hosts, but clinical disease is prevented by STAT1-dependent interferon responses. J. Virol. 81:3251-3263.
375. Munoz-Fontela, C., M. A. Garcia, I. Garcia-Cao, M. Collado, J. Arroyo, M. Esteban, M. Serrano, and C. Rivas . 2005. Resistance to viral infection of super p53 mice. Oncogene 24:3059-3062.
376. Munoz-Jordan, J. L., G. G. Sanchez-Burgos, M. Laure nt-Rolle, and A. Garcia-Sastre . 2003. Inhibition of interferon signaling by dengue virus. Proc. Natl. Acad. Sci. U. S. A 100:14333-14338.
377. Najarro, P., P. Traktman, and J. A. Lewis . 2001. Vaccinia virus blocks gamma interferon signal transduction: viral VH1 phosphatase reverses Stat1 activation. J. Virol. 75:3185-3196.
378. Nakamura, M., H. Saito, and T. Hibi . 2008. Advances in genomic research on hepatitis C virus with a useful tool, replicon system. Keio J. Med. 57:75-83.
219
379. Nanda, S. K. and M. D. Baron . 2006. Rinderpest virus blocks type I and type II interferon action: role of structural and nonstructural proteins. J. Virol. 80:7555-7568.
380. Napoli, C., C. Lemieux, and R. Jorgensen . 1990. Introduction of a Chimeric Chalcone Synthase Gene into Petunia Results in Reversible Co-Suppression of Homologous Genes in trans. Plant Cell 2:279-289.
381. Neill, J. D. and W. L. Mengeling . 1988. Further characterization of the virus-specific RNAs in feline calicivirus infected cells. Virus Res. 11:59-72.
382. Nguyen, K. B., T. P. Salazar-Mather, M. Y. Dalod, J . B. Van Deusen, X. Q. Wei, F. Y. Liew, M. A. Caligiuri, J. E. Durbin, and C. A. Biron . 2002. Coordinated and distinct roles for IFN-alpha beta, IL-12, and IL-15 regulation of NK cell responses to viral infection. J. Immunol. 169:4279-4287.
383. Nilsson, M., K. O. Hedlund, M. Thorhagen, G. Larson , K. Johansen, A. Ekspong, and L. Svensson . 2003. Evolution of human calicivirus RNA in vivo: accumulation of mutations in the protruding P2 domain of the capsid leads to structural changes and possibly a new phenotype. J. Virol. 77:13117-13124.
384. Nomoto, A., N. Kitamura, F. Golini, and E. Wimmer . 1977. The 5'-terminal structures of poliovirion RNA and poliovirus mRNA differ only in the genome-linked protein VPg. Proc. Natl. Acad. Sci. U. S. A 74:5345-5349.
385. Novak, J. E. and K. Kirkegaard . 1991. Improved method for detecting poliovirus negative strands used to demonstrate specificity of positive-strand encapsidation and the ratio of positive to negative strands in infected cells. J. Virol. 65:3384-3387.
386. Novick, D., B. Cohen, and M. Rubinstein . 1994. The human interferon alpha/beta receptor: characterization and molecular cloning. Cell 77:391-400.
387. Nussinov, R. and A. B. Jacobson . 1980. Fast algorithm for predicting the secondary structure of single-stranded RNA. Proc. Natl. Acad. Sci. U. S. A 77:6309-6313.
388. O'Donnell, V., M. Larocco, and B. Baxt . 2008. Heparan sulfate-binding foot-and-mouth disease virus enters cells via caveola-mediated endocytosis. J. Virol. 82:9075-9085.
389. Offermann, M. K. 2007. Kaposi sarcoma herpesvirus-encoded interferon regulator factors. Curr. Top. Microbiol. Immunol. 312:185-209.
390. Ohga, S., A. Nomura, H. Takada, and T. Hara . 2002. Immunological aspects of Epstein-Barr virus infection. Crit Rev. Oncol. Hematol. 44:203-215.
391. Oldstone, M. B. and F. J. Dixon . 1968. Direct immunofluorescent tissue culture assay for lymphocytic choriomeningitis virus. J. Immunol. 100:1135-1138.
392. Oldstone, M. B. 2006. Viral persistence: parameters, mechanisms and future predictions. Virology 344:111-118.
393. Oldstone, M. B. 2009. Anatomy of viral persistence. PLoS. Pathog. 5:e1000523.
394. Oliver, S. L., A. M. Dastjerdi, S. Wong, L. El-Atta r, C. Gallimore, D. W. Brown, J. Green, and J. C. Bridger . 2003. Molecular characterization of
220
bovine enteric caliciviruses: a distinct third genogroup of noroviruses (Norwalk-like viruses) unlikely to be of risk to humans. J. Virol. 77:2789-2798.
395. Oliver, S. L., E. Asobayire, A. M. Dastjerdi, and J . C. Bridger . 2006. Genomic characterization of the unclassified bovine enteric virus Newbury agent-1 (Newbury1) endorses a new genus in the family Caliciviridae. Virology 350:240-250.
396. Osiak, A., O. Utermohlen, S. Niendorf, I. Horak, an d K. P. Knobeloch . 2005. ISG15, an interferon-stimulated ubiquitin-like protein, is not essential for STAT1 signaling and responses against vesicular stomatitis and lymphocytic choriomeningitis virus. Mol. Cell Biol. 25:6338-6345.
397. Ou, J. H., E. G. Strauss, and J. H. Strauss . 1981. Comparative studies of the 3'-terminal sequences of several alpha virus RNAs. Virology 109:281-289.
398. Ou, J. H., C. M. Rice, L. Dalgarno, E. G. Strauss, and J. H. Strauss . 1982. Sequence studies of several alphavirus genomic RNAs in the region containing the start of the subgenomic RNA. Proc. Natl. Acad. Sci. U. S. A 79:5235-5239.
399. Ou, J. H., E. G. Strauss, and J. H. Strauss . 1983. The 5'-terminal sequences of the genomic RNAs of several alphaviruses. J. Mol. Biol. 168:1-15.
400. Palmenberg, A. C., G. D. Parks, D. J. Hall, R. H. I ngraham, T. W. Seng, and P. V. Pallai . 1992. Proteolytic processing of the cardioviral P2 region: primary 2A/2B cleavage in clone-derived precursors. Virology 190:754-762.
401. Palosaari, H., J. P. Parisien, J. J. Rodriguez, C. M. Ulane, and C. M. Horvath . 2003. STAT protein interference and suppression of cytokine signal transduction by measles virus V protein. J. Virol. 77:7635-7644.
402. Pampin, M., Y. Simonin, B. Blondel, Y. Percherancie r, and M. K. Chelbi-Alix . 2006. Cross talk between PML and p53 during poliovirus infection: implications for antiviral defense. J. Virol. 80:8582-8592.
403. Pang, X., B. Lee, L. Chui, J. K. Preiksaitis, and S . S. Monroe . 2004. Evaluation and validation of real-time reverse transcription-pcr assay using the LightCycler system for detection and quantitation of norovirus. J. Clin. Microbiol. 42:4679-4685.
404. Panne, D., T. Maniatis, and S. C. Harrison . 2004. Crystal structure of ATF-2/c-Jun and IRF-3 bound to the interferon-beta enhancer. EMBO J. 23:4384-4393.
405. Panne, D., S. M. McWhirter, T. Maniatis, and S. C. Harrison . 2007. Interferon regulatory factor 3 is regulated by a dual phosphorylation-dependent switch. J. Biol. Chem. 282:22816-22822.
406. Panne, D., T. Maniatis, and S. C. Harrison . 2007. An atomic model of the interferon-beta enhanceosome. Cell 129:1111-1123.
407. Parrino, T. A., D. S. Schreiber, J. S. Trier, A. Z. Kapikian, and N. R. Blacklow . 1977. Clinical immunity in acute gastroenteritis caused by Norwalk agent. N. Engl. J. Med. 297:86-89.
408. Patel, M. M., A. J. Hall, J. Vinje, and U. D. Paras har . 2009. Noroviruses: a comprehensive review. J. Clin. Virol. 44:1-8.
409. Patel, R. C. and G. C. Sen . 1998. PACT, a protein activator of the interferon-induced protein kinase, PKR. EMBO J. 17:4379-4390.
221
410. Pathak, H. B., J. J. Arnold, P. N. Wiegand, M. R. H argittai, and C. E. Cameron . 2007. Picornavirus genome replication: assembly and organization of the VPg uridylylation ribonucleoprotein (initiation) complex. J. Biol. Chem. 282:16202-16213.
411. Patterson, J. B. and C. E. Samuel . 1995. Expression and regulation by interferon of a double-stranded-RNA-specific adenosine deaminase from human cells: evidence for two forms of the deaminase. Mol. Cell Biol. 15:5376-5388.
412. Paul, A. V., E. Rieder, D. W. Kim, J. H. van Boom, and E. Wimmer . 2000. Identification of an RNA hairpin in poliovirus RNA that serves as the primary template in the in vitro uridylylation of VPg. J. Virol. 74:10359-10370.
413. Paulus, C., S. Krauss, and M. Nevels . 2006. A human cytomegalovirus antagonist of type I IFN-dependent signal transducer and activator of transcription signaling. Proc. Natl. Acad. Sci. U. S. A 103:3840-3845.
414. Paun, A. and P. M. Pitha . 2007. The IRF family, revisited. Biochimie 89:744-753.
415. Pedersen, K. W., M. Y. van der, N. Roos, and E. J. Snijder . 1999. Open reading frame 1a-encoded subunits of the arterivirus replicase induce endoplasmic reticulum-derived double-membrane vesicles which carry the viral replication complex. J. Virol. 73:2016-2026.
416. Pelletier, J. and N. Sonenberg . 1988. Internal initiation of translation of eukaryotic mRNA directed by a sequence derived from poliovirus RNA. Nature 334:320-325.
417. Perdue, K. A., K. Y. Green, M. Copeland, E. Barron, M. Mandel, L. J. Faucette, E. M. Williams, S. V. Sosnovtsev, W. R. E lkins, and J. M. Ward . 2007. Naturally occurring murine norovirus infection in a large research institution. J. Am. Assoc. Lab Anim Sci. 46:39-45.
418. Perry, J. W., S. Taube, and C. E. Wobus . 2009. Murine norovirus-1 entry into permissive macrophages and dendritic cells is pH-independent. Virus Res. 143:125-129.
419. Pichlmair, A., O. Schulz, C. P. Tan, T. I. Naslund, P. Liljestrom, F. Weber, and Reis e Sousa . 2006. RIG-I-mediated antiviral responses to single-stranded RNA bearing 5'-phosphates. Science 314:997-1001.
420. Planz, O., S. Pleschka, and T. Wolff . 2009. Borna disease virus: a unique pathogen and its interaction with intracellular signalling pathways. Cell Microbiol. 11:872-879.
421. Platanias, L. C. 2005. Mechanisms of type-I- and type-II-interferon-mediated signalling. Nat. Rev. Immunol. 5:375-386.
422. Plummer, G. and J. Kerry . 1962. Studies on an equine respiratory virus. Vet. Rec 74:967-970.
423. Plummer, G. 1962. An equine respiratory virus with enterovirus properties. Nature 195:519-520.
424. Plummer, G. 1963. An equine respiratory enterovirus. Some biological and physical properties. Arch. Gesamte Virusforsch. 12:694-700.
222
425. Pomerantz, J. L. and D. Baltimore . 1999. NF-kappaB activation by a signaling complex containing TRAF2, TANK and TBK1, a novel IKK-related kinase. EMBO J. 18:6694-6704.
426. Poppers, J., M. Mulvey, C. Perez, D. Khoo, and I. M ohr . 2003. Identification of a lytic-cycle Epstein-Barr virus gene product that can regulate PKR activation. J. Virol. 77:228-236.
427. Porter, F. W., Y. A. Bochkov, A. J. Albee, C. Wiese , and A. C. Palmenberg . 2006. A picornavirus protein interacts with Ran-GTPase and disrupts nucleocytoplasmic transport. Proc. Natl. Acad. Sci. U. S. A 103:12417-12422.
428. Powell, P. P., L. K. Dixon, and R. M. Parkhouse . 1996. An IkappaB homolog encoded by African swine fever virus provides a novel mechanism for downregulation of proinflammatory cytokine responses in host macrophages. J. Virol. 70:8527-8533.
429. Prasad, B. V., R. Rothnagel, X. Jiang, and M. K. Es tes . 1994. Three-dimensional structure of baculovirus-expressed Norwalk virus capsids. J. Virol. 68:5117-5125.
430. Prasad, B. V., M. E. Hardy, T. Dokland, J. Bella, M . G. Rossmann, and M. K. Estes . 1999. X-ray crystallographic structure of the Norwalk virus capsid. Science 286:287-290.
431. Prentice, E., W. G. Jerome, T. Yoshimori, N. Mizush ima, and M. R. Denison . 2004. Coronavirus replication complex formation utilizes components of cellular autophagy. J. Biol. Chem. 279:10136-10141.
432. Racaniello, V. R. 2001. Picornaviridae: the viruses and their replication, p. 529-566. In D. Knipe and P. Howley (eds.), Fundamental virology.
433. Ramachandran, A., J. P. Parisien, and C. M. Horvath . 2008. STAT2 is a primary target for measles virus V protein-mediated alpha/beta interferon signaling inhibition. J. Virol. 82:8330-8338.
434. Ramaswamy, M., L. Shi, M. M. Monick, G. W. Hunningh ake, and D. C. Look . 2004. Specific inhibition of type I interferon signal transduction by respiratory syncytial virus. Am. J. Respir. Cell Mol. Biol. 30:893-900.
435. Randall, R. E. and S. Goodbourn . 2008. Interferons and viruses: an interplay between induction, signalling, antiviral responses and virus countermeasures. J. Gen. Virol. 89:1-47.
436. Raschke, W. C., S. Baird, P. Ralph, and I. Nakoinz . 1978. Functional macrophage cell lines transformed by Abelson leukemia virus. Cell 15:261-267.
437. Reeves, R. H., B. F. O'Hara, W. J. Pavan, J. D. Gea rhart, and O. Haller . 1988. Genetic mapping of the Mx influenza virus resistance gene within the region of mouse chromosome 16 that is homologous to human chromosome 21. J. Virol. 62:4372-4375.
438. Regad, T., A. Saib, V. Lallemand-Breitenbach, P. P. Pandolfi, T. H. De, and M. K. Chelbi-Alix . 2001. PML mediates the interferon-induced antiviral state against a complex retrovirus via its association with the viral transactivator. EMBO J. 20:3495-3505.
439. Regad, T. and M. K. Chelbi-Alix . 2001. Role and fate of PML nuclear bodies in response to interferon and viral infections. Oncogene 20:7274-7286.
223
440. Reichelt, M., S. Stertz, J. Krijnse-Locker, O. Hall er, and G. Kochs . 2004. Missorting of LaCrosse virus nucleocapsid protein by the interferon-induced MxA GTPase involves smooth ER membranes. Traffic. 5:772-784.
441. Reid, S. P., L. W. Leung, A. L. Hartman, O. Martine z, M. L. Shaw, C. Carbonnelle, V. E. Volchkov, S. T. Nichol, and C. F . Basler . 2006. Ebola virus VP24 binds karyopherin alpha1 and blocks STAT1 nuclear accumulation. J. Virol. 80:5156-5167.
442. Reimann, H., J. Hodges, and A. Price . 1945. Epidemic diarrhea, nausea, and vomiting of unknown cause. JAMA 127:1-6.
443. Ren, J., B. Rastegari, A. Condon, and H. H. Hoos . 2005. HotKnots: heuristic prediction of RNA secondary structures including pseudoknots. RNA. 11:1494-1504.
444. Reshetnyak, V. I., T. I. Karlovich, and L. U. Ilche nko . 2008. Hepatitis G virus. World J. Gastroenterol. 14:4725-4734.
445. Reuter, G., H. Biro, and G. Szucs . 2007. Enteric caliciviruses in domestic pigs in Hungary. Arch. Virol. 152:611-614.
446. Rezaee, S. A., C. Cunningham, A. J. Davison, and D. J. Blackbourn . 2006. Kaposi's sarcoma-associated herpesvirus immune modulation: an overview. J. Gen. Virol. 87:1781-1804.
447. Rhoads, R. E. 1993. Regulation of eukaryotic protein synthesis by initiation factors. J. Biol. Chem. 268:3017-3020.
448. Richards, G. P., M. A. Watson, and D. H. Kingsley . 2004. A SYBR green, real-time RT-PCR method to detect and quantitate Norwalk virus in stools. J. Virol. Methods 116:63-70.
449. Ricour, C., F. Borghese, F. Sorgeloos, S. V. Hato, F. J. van Kuppeveld, and T. Michiels . 2009. Random mutagenesis defines a domain of Theiler's virus leader protein which is essential for antagonism of nucleocytoplasmic trafficking and of cytokine gene expression. J. Virol.
450. Rima, B. K. and N. V. McFerran . 1997. Dinucleotide and stop codon frequencies in single-stranded RNA viruses. J. Gen. Virol. 78 ( Pt 11):2859-2870.
451. Rivas, E. and S. R. Eddy . 2000. Secondary structure alone is generally not statistically significant for the detection of noncoding RNAs. Bioinformatics. 16:583-605.
452. Rivera, V. M., J. D. Welsh, and J. V. Maizel, Jr. 1988. Comparative sequence analysis of the 5' noncoding region of the enteroviruses and rhinoviruses. Virology 165:42-50.
453. Rockx, B., W. M. De, H. Vennema, J. Vinje, B. E. de , D. Y. Van, and M. Koopmans . 2002. Natural history of human calicivirus infection: a prospective cohort study. Clin. Infect. Dis. 35:246-253.
454. Rodriguez, J. J., J. P. Parisien, and C. M. Horvath . 2002. Nipah virus V protein evades alpha and gamma interferons by preventing STAT1 and STAT2 activation and nuclear accumulation. J. Virol. 76:11476-11483.
224
455. Rodriguez, J. J., L. F. Wang, and C. M. Horvath . 2003. Hendra virus V protein inhibits interferon signaling by preventing STAT1 and STAT2 nuclear accumulation. J. Virol. 77:11842-11845.
456. Romano, P. R., F. Zhang, S. L. Tan, M. T. Garcia-Ba rrio, M. G. Katze, T. E. Dever, and A. G. Hinnebusch . 1998. Inhibition of double-stranded RNA-dependent protein kinase PKR by vaccinia virus E3: role of complex formation and the E3 N-terminal domain. Mol. Cell Biol. 18:7304-7316.
457. Rombaut, B., R. Vrijsen, and A. Boeye . 1990. New evidence for the precursor role of 14 S subunits in poliovirus morphogenesis. Virology 177:411-414.
458. Romero-Lopez, C. and A. Berzal-Herranz . 2009. A long-range RNA-RNA interaction between the 5' and 3' ends of the HCV genome. RNA. 15:1740-1752.
459. Ronco, L. V., A. Y. Karpova, M. Vidal, and P. M. Ho wley . 1998. Human papillomavirus 16 E6 oncoprotein binds to interferon regulatory factor-3 and inhibits its transcriptional activity. Genes Dev. 12:2061-2072.
460. Rothenfusser, S., N. Goutagny, G. DiPerna, M. Gong, B. G. Monks, A. Schoenemeyer, M. Yamamoto, S. Akira, and K. A. Fitz gerald . 2005. The RNA helicase Lgp2 inhibits TLR-independent sensing of viral replication by retinoic acid-inducible gene-I. J. Immunol. 175:5260-5268.
461. Rueckert, R. R., A. K. Dunker, and C. M. Stoltzfus . 1969. The structure of mouse-Elberfeld virus: a model. Proc. Natl. Acad. Sci. U. S. A 62:912-919.
462. Ryan, M. D. and J. Drew . 1994. Foot-and-mouth disease virus 2A oligopeptide mediated cleavage of an artificial polyprotein. EMBO J. 13:928-933.
463. Ryzhakov, G. and F. Randow . 2007. SINTBAD, a novel component of innate antiviral immunity, shares a TBK1-binding domain with NAP1 and TANK. EMBO J. 26:3180-3190.
464. Saira, K., Y. Zhou, and C. Jones . 2009. The infected cell protein 0 encoded by bovine herpesvirus 1 (bICP0) associates with interferon regulatory factor 7 and consequently inhibits beta interferon promoter activity. J. Virol. 83:3977-3981.
465. Samuel, M. A., K. Whitby, B. C. Keller, A. Marri, W . Barchet, B. R. Williams, R. H. Silverman, M. Gale, Jr., and M. S. Diamond . 2006. PKR and RNase L contribute to protection against lethal West Nile Virus infection by controlling early viral spread in the periphery and replication in neurons. J. Virol. 80:7009-7019.
466. Sandrock, M., M. Frese, O. Haller, and G. Kochs . 2001. Interferon-induced rat Mx proteins confer resistance to Rift Valley fever virus and other arthropod-borne viruses. J. Interferon Cytokine Res. 21:663-668.
467. Sangar, D. V., S. E. Newton, D. J. Rowlands, and B. E. Clarke . 1987. All foot and mouth disease virus serotypes initiate protein synthesis at two separate AUGs. Nucleic Acids Res. 15:3305-3315.
468. Sarkar, S. N., K. L. Peters, C. P. Elco, S. Sakamot o, S. Pal, and G. C. Sen . 2004. Novel roles of TLR3 tyrosine phosphorylation and PI3 kinase in double-stranded RNA signaling. Nat. Struct. Mol. Biol. 11:1060-1067.
469. Sasai, M., H. Oshiumi, M. Matsumoto, N. Inoue, F. F ujita, M. Nakanishi, and T. Seya . 2005. Cutting Edge: NF-kappaB-activating kinase-associated
225
protein 1 participates in TLR3/Toll-IL-1 homology domain-containing adapter molecule-1-mediated IFN regulatory factor 3 activation. J. Immunol. 174:27-30.
470. Sasai, M., M. Shingai, K. Funami, M. Yoneyama, T. F ujita, M. Matsumoto, and T. Seya . 2006. NAK-associated protein 1 participates in both the TLR3 and the cytoplasmic pathways in type I IFN induction. J. Immunol. 177:8676-8683.
471. Sato, M., N. Tanaka, N. Hata, E. Oda, and T. Tanigu chi . 1998. Involvement of the IRF family transcription factor IRF-3 in virus-induced activation of the IFN-beta gene. FEBS Lett. 425:112-116.
472. Sato, S., M. Sugiyama, M. Yamamoto, Y. Watanabe, T. Kawai, K. Takeda, and S. Akira . 2003. Toll/IL-1 receptor domain-containing adaptor inducing IFN-beta (TRIF) associates with TNF receptor-associated factor 6 and TANK-binding kinase 1, and activates two distinct transcription factors, NF-kappa B and IFN-regulatory factor-3, in the Toll-like receptor signaling. J. Immunol. 171:4304-4310.
473. Scheuner, D., R. Patel, F. Wang, K. Lee, K. Kumar, J. Wu, A. Nilsson, M. Karin, and R. J. Kaufman . 2006. Double-stranded RNA-dependent protein kinase phosphorylation of the alpha-subunit of eukaryotic translation initiation factor 2 mediates apoptosis. J. Biol. Chem. 281:21458-21468.
474. Schindler, C., K. Shuai, V. R. Prezioso, and J. E. Darnell, Jr. 1992. Interferon-dependent tyrosine phosphorylation of a latent cytoplasmic transcription factor. Science 257:809-813.
475. Schmaljohn, C. 2007. Bunyaviridae, p. 1741-1789. In D. Knipe and D. Howley (eds.), Field's Virology.
476. Schmid, D., J. Dengjel, O. Schoor, S. Stevanovic, a nd C. Munz . 2006. Autophagy in innate and adaptive immunity against intracellular pathogens. J. Mol. Med. 84:194-202.
477. Scholthof, H. B. 2006. The Tombusvirus-encoded P19: from irrelevance to elegance. Nat. Rev. Microbiol. 4:405-411.
478. Schulz, O., S. S. Diebold, M. Chen, T. I. Naslund, M. A. Nolte, L. Alexopoulou, Y. T. Azuma, R. A. Flavell, P. Liljest rom, and Reis e Sousa . 2005. Toll-like receptor 3 promotes cross-priming to virus-infected cells. Nature 433:887-892.
479. Schweizer, M. and E. Peterhans . 2001. Noncytopathic bovine viral diarrhea virus inhibits double-stranded RNA-induced apoptosis and interferon synthesis. J. Virol. 75:4692-4698.
480. Seth, R. B., L. Sun, C. K. Ea, and Z. J. Chen . 2005. Identification and characterization of MAVS, a mitochondrial antiviral signaling protein that activates NF-kappaB and IRF 3. Cell 122:669-682.
481. Sheppard, P., W. Kindsvogel, W. Xu, K. Henderson, S . Schlutsmeyer, T. E. Whitmore, R. Kuestner, U. Garrigues, C. Birks, J. R oraback, C. Ostrander, D. Dong, J. Shin, S. Presnell, B. Fox, B. Haldeman, E. Cooper, D. Taft, T. Gilbert, F. J. Grant, M. Tackett, W. Krivan, G. McK night, C. Clegg, D. Foster, and K. M. Klucher . 2003. IL-28, IL-29 and their class II cytokine receptor IL-28R. Nat. Immunol. 4:63-68.
482. Sheth, U. and R. Parker . 2003. Decapping and decay of messenger RNA occur in cytoplasmic processing bodies. Science 300:805-808.
226
483. Sheth, U. and R. Parker . 2006. Targeting of aberrant mRNAs to cytoplasmic processing bodies. Cell 125:1095-1109.
484. Shisler, J. L. and X. L. Jin . 2004. The vaccinia virus K1L gene product inhibits host NF-kappaB activation by preventing IkappaBalpha degradation. J. Virol. 78:3553-3560.
485. Silvennoinen, O., J. N. Ihle, J. Schlessinger, and D. E. Levy . 1993. Interferon-induced nuclear signalling by Jak protein tyrosine kinases. Nature 366:583-585.
486. Simmonds, P., A. Tuplin, and D. J. Evans . 2004. Detection of genome-scale ordered RNA structure (GORS) in genomes of positive-stranded RNA viruses: Implications for virus evolution and host persistence. RNA. 10:1337-1351.
487. Simmonds, P., I. Karakasiliotis, D. Bailey, Y. Chau dhry, D. J. Evans, and I. G. Goodfellow . 2008. Bioinformatic and functional analysis of RNA secondary structure elements among different genera of human and animal caliciviruses. Nucleic Acids Res.
488. Skinner, M. A., V. R. Racaniello, G. Dunn, J. Coope r, P. D. Minor, and J. W. Almond . 1989. New model for the secondary structure of the 5' non-coding RNA of poliovirus is supported by biochemical and genetic data that also show that RNA secondary structure is important in neurovirulence. J. Mol. Biol. 207:379-392.
489. Smith, J. A., S. C. Schmechel, B. R. Williams, R. H . Silverman, and L. A. Schiff . 2005. Involvement of the interferon-regulated antiviral proteins PKR and RNase L in reovirus-induced shutoff of cellular translation. J. Virol. 79:2240-2250.
490. Sobacchi, C., V. Marrella, F. Rucci, P. Vezzoni, an d A. Villa . 2006. RAG-dependent primary immunodeficiencies. Hum. Mutat. 27:1174-1184.
491. Sokoloski, K. J., C. J. Wilusz, and J. Wilusz . 2006. Viruses: overturning RNA turnover. RNA. Biol. 3:140-144.
492. Sosnovtsev, S. V., G. Belliot, K. O. Chang, V. G. P rikhodko, L. B. Thackray, C. E. Wobus, S. M. Karst, H. W. Virgin, and K. Y. G reen . 2006. Cleavage map and proteolytic processing of the murine norovirus nonstructural polyprotein in infected cells. J. Virol. 80:7816-7831.
493. Spangberg, K., L. Wiklund, and S. Schwartz . 2000. HuR, a protein implicated in oncogene and growth factor mRNA decay, binds to the 3' ends of hepatitis C virus RNA of both polarities. Virology 274:378-390.
494. Spann, K. M., K. C. Tran, and P. L. Collins . 2005. Effects of nonstructural proteins NS1 and NS2 of human respiratory syncytial virus on interferon regulatory factor 3, NF-kappaB, and proinflammatory cytokines. J. Virol. 79:5353-5362.
495. Spitkovsky, D., S. P. Hehner, T. G. Hofmann, A. Mol ler, and M. L. Schmitz . 2002. The human papillomavirus oncoprotein E7 attenuates NF-kappa B activation by targeting the Ikappa B kinase complex. J. Biol. Chem. 277:25576-25582.
496. Srivastava, S. P., K. U. Kumar, and R. J. Kaufman . 1998. Phosphorylation of eukaryotic translation initiation factor 2 mediates apoptosis in response to activation of the double-stranded RNA-dependent protein kinase. J. Biol. Chem. 273:2416-2423.
227
497. Stack, J., I. R. Haga, M. Schroder, N. W. Bartlett, G. Maloney, P. C. Reading, K. A. Fitzgerald, G. L. Smith, and A. G. B owie . 2005. Vaccinia virus protein A46R targets multiple Toll-like-interleukin-1 receptor adaptors and contributes to virulence. J. Exp. Med. 201:1007-1018.
498. Staeheli, P., R. Grob, E. Meier, J. G. Sutcliffe, a nd O. Haller . 1988. Influenza virus-susceptible mice carry Mx genes with a large deletion or a nonsense mutation. Mol. Cell Biol. 8:4518-4523.
499. Staeheli, P. and J. G. Sutcliffe . 1988. Identification of a second interferon-regulated murine Mx gene. Mol. Cell Biol. 8:4524-4528.
500. Staeheli, P., F. Pitossi, and J. Pavlovic . 1993. Mx proteins: GTPases with antiviral activity. Trends Cell Biol. 3:268-272.
501. Steck, F., B. Hofer, B. Schaeren, J. Nicolet, and H . Gerbe . 1978. Equine rhinoviruses: new serotypes, p. 321-328. Equine Inf. Dis. IV.
502. Stertz, S., J. Dittmann, J. C. Blanco, L. M. Pletne va, O. Haller, and G. Kochs . 2007. The antiviral potential of interferon-induced cotton rat Mx proteins against orthomyxovirus (influenza), rhabdovirus, and bunyavirus. J. Interferon Cytokine Res. 27:847-855.
503. Stevenson, R. A., J. A. Huang, M. J. Studdert, and C. A. Hartley . 2004. Sialic acid acts as a receptor for equine rhinitis A virus binding and infection. J. Gen. Virol. 85:2535-2543.
504. Strahle, L., J. B. Marq, A. Brini, S. Hausmann, D. Kolakofsky, and D. Garcin . 2007. Activation of the beta interferon promoter by unnatural Sendai virus infection requires RIG-I and is inhibited by viral C proteins. J. Virol. 81:12227-12237.
505. Strauss, J. H. and E. G. Strauss . 1994. The alphaviruses: gene expression, replication, and evolution. Microbiol. Rev. 58:491-562.
506. Stuart, A. D. and T. D. Brown . 2006. Entry of feline calicivirus is dependent on clathrin-mediated endocytosis and acidification in endosomes. J. Virol. 80:7500-7509.
507. Studdert, M. J. and L. J. Gleeson . 1977. Isolation of equine rhinovirus type 1. Aust. Vet. J. 53:452.
508. Studdert, M. J. 1996. Equine rhinovirus infection, p. 211-217. In M. J. Studdert (ed.), Virus infections of equines.
509. Studdert, M. J., C. A. Hartley, K. Dynon, J. R. San dy, R. F. Slocombe, J. A. Charles, M. E. Milne, A. F. Clarke, and C. El-Hage . 2003. Outbreak of equine herpesvirus type 1 myeloencephalitis: new insights from virus identification by PCR and the application of an EHV-1-specific antibody detection ELISA. Vet. Rec. 153:417-423.
510. Sugieda, M., H. Nagaoka, Y. Kakishima, T. Ohshita, S. Nakamura, and S. Nakajima . 1998. Detection of Norwalk-like virus genes in the caecum contents of pigs. Arch. Virol. 143:1215-1221.
511. Suhy, D. A., T. H. Giddings, Jr., and K. Kirkegaard . 2000. Remodeling the endoplasmic reticulum by poliovirus infection and by individual viral proteins: an autophagy-like origin for virus-induced vesicles. J. Virol. 74:8953-8965.
228
512. Tabeta, K., P. Georgel, E. Janssen, X. Du, K. Hoebe , K. Crozat, S. Mudd, L. Shamel, S. Sovath, J. Goode, L. Alexopoulou, R. A. Flavell, and B. Beutler . 2004. Toll-like receptors 9 and 3 as essential components of innate immune defense against mouse cytomegalovirus infection. Proc. Natl. Acad. Sci. U. S. A 101:3516-3521.
513. Takaoka, A., S. Hayakawa, H. Yanai, D. Stoiber, H. Negishi, H. Kikuchi, S. Sasaki, K. Imai, T. Shibue, K. Honda, and T. Tanigu chi . 2003. Integration of interferon-alpha/beta signalling to p53 responses in tumour suppression and antiviral defence. Nature 424:516-523.
514. Takeuchi, O. and S. Akira . 2007. Recognition of viruses by innate immunity. Immunol. Rev. 220:214-224.
515. Takeuchi, T., T. Kobayashi, S. Tamura, and H. Yokos awa. 2006. Negative regulation of protein phosphatase 2Cbeta by ISG15 conjugation. FEBS Lett. 580:4521-4526.
516. Takeuchi, T. and H. Yokosawa . 2008. Detection and analysis of protein ISGylation. Methods Mol. Biol. 446:139-149.
517. Taliansky, M. E. and D. J. Robinson . 2003. Molecular biology of umbraviruses: phantom warriors. J. Gen. Virol. 84:1951-1960.
518. Talloczy, Z., W. Jiang, H. W. Virgin, D. A. Leib, D . Scheuner, R. J. Kaufman, E. L. Eskelinen, and B. Levine . 2002. Regulation of starvation- and virus-induced autophagy by the eIF2alpha kinase signaling pathway. Proc. Natl. Acad. Sci. U. S. A 99:190-195.
519. Talon, J., C. M. Horvath, R. Polley, C. F. Basler, T. Muster, P. Palese, and A. Garcia-Sastre . 2000. Activation of interferon regulatory factor 3 is inhibited by the influenza A virus NS1 protein. J. Virol. 74:7989-7996.
520. Tan, M., P. Huang, J. Meller, W. Zhong, T. Farkas, and X. Jiang . 2003. Mutations within the P2 domain of norovirus capsid affect binding to human histo-blood group antigens: evidence for a binding pocket. J. Virol. 77:12562-12571.
521. Tan, S. L. and M. G. Katze . 1998. Biochemical and genetic evidence for complex formation between the influenza A virus NS1 protein and the interferon-induced PKR protein kinase. J. Interferon Cytokine Res. 18:757-766.
522. Tanaka, N., M. Nakanishi, Y. Kusakabe, Y. Goto, Y. Kitade, and K. T. Nakamura . 2004. Structural basis for recognition of 2',5'-linked oligoadenylates by human ribonuclease L. EMBO J. 23:3929-3938.
523. Tang, X., J. S. Gao, Y. J. Guan, K. E. McLane, Z. L . Yuan, B. Ramratnam, and Y. E. Chin . 2007. Acetylation-dependent signal transduction for type I interferon receptor. Cell 131:93-105.
524. Taube, S., J. W. Perry, K. Yetming, S. P. Patel, H. Auble, L. Shu, H. F. Nawar, C. H. Lee, T. D. Connell, J. A. Shayman, and C. E. Wobus . 2009. Ganglioside-linked terminal sialic acid moieties on murine macrophages function as attachment receptors for murine noroviruses. J. Virol. 83:4092-4101.
525. Taylor, D. R., S. T. Shi, P. R. Romano, G. N. Barbe r, and M. M. Lai . 1999. Inhibition of the interferon-inducible protein kinase PKR by HCV E2 protein. Science 285:107-110.
229
526. Terenzi, F., S. Pal, and G. C. Sen . 2005. Induction and mode of action of the viral stress-inducible murine proteins, P56 and P54. Virology 340:116-124.
527. Teunis, P. F., C. L. Moe, P. Liu, S. E. Miller, L. Lindesmith, R. S. Baric, P. J. Le, and R. L. Calderon . 2008. Norwalk virus: how infectious is it? J. Med. Virol. 80:1468-1476.
528. Thackray, L. B., C. E. Wobus, K. A. Chachu, B. Liu, E. R. Alegre, K. S. Henderson, S. T. Kelley, and H. W. Virgin . 2007. Murine noroviruses comprising a single genogroup exhibit biological diversity despite limited sequence divergence. J. Virol. 81:10460-10473.
529. Thomas, D., G. Blakqori, V. Wagner, M. Banholzer, N . Kessler, R. M. Elliott, O. Haller, and F. Weber . 2004. Inhibition of RNA polymerase II phosphorylation by a viral interferon antagonist. J. Biol. Chem. 279:31471-31477.
530. Tinoco, I., Jr., P. N. Borer, B. Dengler, M. D. Lev in, O. C. Uhlenbeck, D. M. Crothers, and J. Bralla . 1973. Improved estimation of secondary structure in ribonucleic acids. Nat. New Biol. 246:40-41.
531. Todd, S., J. S. Towner, D. M. Brown, and B. L. Seml er. 1997. Replication-competent picornaviruses with complete genomic RNA 3' noncoding region deletions. J. Virol. 71:8868-8874.
532. Tough, D. F., P. Borrow, and J. Sprent . 1996. Induction of bystander T cell proliferation by viruses and type I interferon in vivo. Science 272:1947-1950.
533. Tsukiyama-Kohara, K., N. Iizuka, M. Kohara, and A. Nomoto . 1992. Internal ribosome entry site within hepatitis C virus RNA. J. Virol. 66:1476-1483.
534. Tuplin, A., J. Wood, D. J. Evans, A. H. Patel, and P. Simmonds . 2002. Thermodynamic and phylogenetic prediction of RNA secondary structures in the coding region of hepatitis C virus. RNA. 8:824-841.
535. Uchil, P. D. and V. Satchidanandam . 2003. Architecture of the flaviviral replication complex. Protease, nuclease, and detergents reveal encasement within double-layered membrane compartments. J. Biol. Chem. 278:24388-24398.
536. Ulane, C. M. and C. M. Horvath . 2002. Paramyxoviruses SV5 and HPIV2 assemble STAT protein ubiquitin ligase complexes from cellular components. Virology 304:160-166.
537. Ulane, C. M., J. J. Rodriguez, J. P. Parisien, and C. M. Horvath . 2003. STAT3 ubiquitylation and degradation by mumps virus suppress cytokine and oncogene signaling. J. Virol. 77:6385-6393.
538. Umbach, J. L. and B. R. Cullen . 2009. The role of RNAi and microRNAs in animal virus replication and antiviral immunity. Genes Dev. 23:1151-1164.
539. Unterstab, G., S. Ludwig, A. Anton, O. Planz, B. Da uber, D. Krappmann, G. Heins, C. Ehrhardt, and T. Wolff . 2005. Viral targeting of the interferon-beta-inducing Traf family member-associated NF-kappaB activator (TANK)-binding kinase-1. Proc. Natl. Acad. Sci. U. S. A 102:13640-13645.
540. Uze, G., G. Lutfalla, and I. Gresser . 1990. Genetic transfer of a functional human interferon alpha receptor into mouse cells: cloning and expression of its cDNA. Cell 60:225-234.
230
541. Valchanova, R. S., M. Picard-Maureau, M. Budt, and W. Brune . 2006. Murine cytomegalovirus m142 and m143 are both required to block protein kinase R-mediated shutdown of protein synthesis. J. Virol. 80:10181-10190.
542. van der Poel, W. H., J. Vinje, H. R. van der, M. I. Herrera, A. Vivo, and M. P. Koopmans . 2000. Norwalk-like calicivirus genes in farm animals. Emerg. Infect. Dis. 6:36-41.
543. van Vlijmen, H. W., S. Curry, M. Schaefer, and M. K arplus . 1998. Titration calculations of foot-and-mouth disease virus capsids and their stabilities as a function of pH. J. Mol. Biol. 275:295-308.
544. Venkataraman, T., M. Valdes, R. Elsby, S. Kakuta, G . Caceres, S. Saijo, Y. Iwakura, and G. N. Barber . 2007. Loss of DExD/H box RNA helicase LGP2 manifests disparate antiviral responses. J. Immunol. 178:6444-6455.
545. Vinje, J., J. Green, D. C. Lewis, C. I. Gallimore, D. W. Brown, and M. P. Koopmans . 2000. Genetic polymorphism across regions of the three open reading frames of "Norwalk-like viruses". Arch. Virol. 145:223-241.
546. Vinje, J., H. Vennema, L. Maunula, C. H. von Bonsdo rff, M. Hoehne, E. Schreier, A. Richards, J. Green, D. Brown, S. S. Be ard, S. S. Monroe, B. E. de, L. Svensson, and M. P. Koopmans . 2003. International collaborative study to compare reverse transcriptase PCR assays for detection and genotyping of noroviruses. J. Clin. Microbiol. 41:1423-1433.
547. Vyas, J., A. Elia, and M. J. Clemens . 2003. Inhibition of the protein kinase PKR by the internal ribosome entry site of hepatitis C virus genomic RNA. RNA. 9:858-870.
548. Wang, C., L. Deng, M. Hong, G. R. Akkaraju, J. Inou e, and Z. J. Chen . 2001. TAK1 is a ubiquitin-dependent kinase of MKK and IKK. Nature 412:346-351.
549. Wang, Q. H., M. Souza, J. A. Funk, W. Zhang, and L. J. Saif . 2006. Prevalence of noroviruses and sapoviruses in swine of various ages determined by reverse transcription-PCR and microwell hybridization assays. J. Clin. Microbiol. 44:2057-2062.
550. Wang, Q. H., V. Costantini, and L. J. Saif . 2007. Porcine enteric caliciviruses: genetic and antigenic relatedness to human caliciviruses, diagnosis and epidemiology. Vaccine 25:5453-5466.
551. Wang, X., E. R. Hinson, and P. Cresswell . 2007. The interferon-inducible protein viperin inhibits influenza virus release by perturbing lipid rafts. Cell Host. Microbe 2:96-105.
552. Ward, J. M., C. E. Wobus, L. B. Thackray, C. R. Ere xson, L. J. Faucette, G. Belliot, E. L. Barron, S. V. Sosnovtsev, and K. Y. Green . 2006. Pathology of immunodeficient mice with naturally occurring murine norovirus infection. Toxicol. Pathol. 34:708-715.
553. Ward, V. K., C. J. McCormick, I. N. Clarke, O. Sali m, C. E. Wobus, L. B. Thackray, H. W. Virgin, and P. R. Lambden . 2007. Recovery of infectious murine norovirus using pol II-driven expression of full-length cDNA. Proc. Natl. Acad. Sci. U. S. A 104:11050-11055.
554. Weber, F., V. Wagner, S. B. Rasmussen, R. Hartmann, and S. R. Paludan . 2006. Double-stranded RNA is produced by positive-strand RNA viruses and DNA viruses but not in detectable amounts by negative-strand RNA viruses. J. Virol. 80:5059-5064.
231
555. Weihua, X., S. Ramanujam, D. J. Lindner, R. D. Kuda ravalli, R. Freund, and D. V. Kalvakolanu . 1998. The polyoma virus T antigen interferes with interferon-inducible gene expression. Proc. Natl. Acad. Sci. U. S. A 95:1085-1090.
556. Wherry, E. J., J. N. Blattman, K. Murali-Krishna, M . R. van der, and R. Ahmed . 2003. Viral persistence alters CD8 T-cell immunodominance and tissue distribution and results in distinct stages of functional impairment. J. Virol. 77:4911-4927.
557. Widdowson, M. A., A. Sulka, S. N. Bulens, R. S. Bea rd, S. S. Chaves, R. Hammond, E. D. Salehi, E. Swanson, J. Totaro, R. Wo ron, P. S. Mead, J. S. Bresee, S. S. Monroe, and R. I. Glass . 2005. Norovirus and foodborne disease, United States, 1991-2000. Emerg. Infect. Dis. 11:95-102.
558. Wilson, J. C., J. T. Bryans, E. R. Doll, and L. Tud or . 1965. ISOLATION OF A NEWLY IDENTIFIED EQUINE RESPIRATORY VIRUS. Cornell Vet. 55:425-431.
559. Wobus, C. E., S. M. Karst, L. B. Thackray, K. O. Ch ang, S. V. Sosnovtsev, G. Belliot, A. Krug, J. M. Mackenzie, K. Y. Green, and H. W. Virgin . 2004. Replication of Norovirus in cell culture reveals a tropism for dendritic cells and macrophages. PLoS. Biol. 2:e432.
560. Wong, S. K., S. Sato, and D. W. Lazinski . 2003. Elevated activity of the large form of ADAR1 in vivo: very efficient RNA editing occurs in the cytoplasm. RNA. 9:586-598.
561. Woode, G. N. and J. C. Bridger . 1978. Isolation of small viruses resembling astroviruses and caliciviruses from acute enteritis of calves. J. Med. Microbiol. 11:441-452.
562. Workman, C. and A. Krogh . 1999. No evidence that mRNAs have lower folding free energies than random sequences with the same dinucleotide distribution. Nucleic Acids Res. 27:4816-4822.
563. Worobey, M. and E. C. Holmes . 1999. Evolutionary aspects of recombination in RNA viruses. J. Gen. Virol. 80 ( Pt 10):2535-2543.
564. Wreschner, D. H., J. W. McCauley, J. J. Skehel, and I. M. Kerr . 1981. Interferon action--sequence specificity of the ppp(A2'p)nA-dependent ribonuclease. Nature 289:414-417.
565. Wullaert, A., K. Heyninck, S. Janssens, and R. Beya ert . 2006. Ubiquitin: tool and target for intracellular NF-kappaB inhibitors. Trends Immunol. 27:533-540.
566. Wutz, G., H. Auer, N. Nowotny, B. Grosse, T. Skern, and E. Kuechler . 1996. Equine rhinovirus serotypes 1 and 2: relationship to each other and to aphthoviruses and cardioviruses. J. Gen. Virol. 77 ( Pt 8):1719-1730.
567. Xi, J. N., D. Y. Graham, K. N. Wang, and M. K. Este s. 1990. Norwalk virus genome cloning and characterization. Science 250:1580-1583.
568. Xiang, W., K. S. Harris, L. Alexander, and E. Wimme r. 1995. Interaction between the 5'-terminal cloverleaf and 3AB/3CDpro of poliovirus is essential for RNA replication. J. Virol. 69:3658-3667.
569. Xu, L. G., Y. Y. Wang, K. J. Han, L. Y. Li, Z. Zhai , and H. B. Shu . 2005. VISA is an adapter protein required for virus-triggered IFN-beta signaling. Mol. Cell 19:727-740.
232
570. Yamashita, K., T. Imaizumi, K. Taima, T. Fujita, A. Ishikawa, H. Yoshida, C. Oyama, and K. Satoh . 2005. Polyinosinic-polycytidylic acid induces the expression of GRO-alpha in BEAS-2B cells. Inflammation 29:17-21.
571. Yi, M. and S. M. Lemon . 2003. 3' nontranslated RNA signals required for replication of hepatitis C virus RNA. J. Virol. 77:3557-3568.
572. Yokota, S., H. Saito, T. Kubota, N. Yokosawa, K. Am ano, and N. Fujii . 2003. Measles virus suppresses interferon-alpha signaling pathway: suppression of Jak1 phosphorylation and association of viral accessory proteins, C and V, with interferon-alpha receptor complex. Virology 306:135-146.
573. Yokota, S., N. Yokosawa, T. Okabayashi, T. Suzutani , S. Miura, K. Jimbow, and N. Fujii . 2004. Induction of suppressor of cytokine signaling-3 by herpes simplex virus type 1 contributes to inhibition of the interferon signaling pathway. J. Virol. 78 :6282-6286.
574. Yoneyama, M., M. Kikuchi, T. Natsukawa, N. Shinobu, T. Imaizumi, M. Miyagishi, K. Taira, S. Akira, and T. Fujita . 2004. The RNA helicase RIG-I has an essential function in double-stranded RNA-induced innate antiviral responses. Nat. Immunol. 5:730-737.
575. Yoneyama, M., M. Kikuchi, K. Matsumoto, T. Imaizumi , M. Miyagishi, K. Taira, E. Foy, Y. M. Loo, M. Gale, Jr., S. Akira, S . Yonehara, A. Kato, and T. Fujita . 2005. Shared and unique functions of the DExD/H-box helicases RIG-I, MDA5, and LGP2 in antiviral innate immunity. J. Immunol. 175:2851-2858.
576. You, J., J. L. Croyle, A. Nishimura, K. Ozato, and P. M. Howley . 2004. Interaction of the bovine papillomavirus E2 protein with Brd4 tethers the viral DNA to host mitotic chromosomes. Cell 117:349-360.
577. You, S., D. D. Stump, A. D. Branch, and C. M. Rice . 2004. A cis-acting replication element in the sequence encoding the NS5B RNA-dependent RNA polymerase is required for hepatitis C virus RNA replication. J. Virol. 78:1352-1366.
578. Yuan, W. and R. M. Krug . 2001. Influenza B virus NS1 protein inhibits conjugation of the interferon (IFN)-induced ubiquitin-like ISG15 protein. EMBO J. 20:362-371.
579. Zahn, R. C., I. Schelp, O. Utermohlen, and L. D. vo n. 2007. A-to-G hypermutation in the genome of lymphocytic choriomeningitis virus. J. Virol. 81:457-464.
580. Zahorsky, J. 1929. Hyperemesis hiemis or the winter vomiting disease. Archives of Pediatrics 46:391-395.
581. Zhang, B., M. Li, L. Chen, K. Yang, Y. Shan, L. Zhu , S. Sun, L. Li, and C. Wang . 2009. The TAK1-JNK cascade is required for IRF3 function in the innate immune response. Cell Res. 19:412-428.
582. Zhang, Y., C. W. Burke, K. D. Ryman, and W. B. Klim stra . 2007. Identification and characterization of interferon-induced proteins that inhibit alphavirus replication. J. Virol. 81:11246-11255.
583. Zhang, Z. and S. Alexandersen . 2004. Quantitative analysis of foot-and-mouth disease virus RNA loads in bovine tissues: implications for the site of viral persistence. J. Gen. Virol. 85:2567-2575.
233
584. Zhao, C., S. L. Beaudenon, M. L. Kelley, M. B. Wadd ell, W. Yuan, B. A. Schulman, J. M. Huibregtse, and R. M. Krug . 2004. The UbcH8 ubiquitin E2 enzyme is also the E2 enzyme for ISG15, an IFN-alpha/beta-induced ubiquitin-like protein. Proc. Natl. Acad. Sci. U. S. A 101:7578-7582.
585. Zhao, C., C. Denison, J. M. Huibregtse, S. Gygi, an d R. M. Krug . 2005. Human ISG15 conjugation targets both IFN-induced and constitutively expressed proteins functioning in diverse cellular pathways. Proc. Natl. Acad. Sci. U. S. A 102:10200-10205.
586. Zheng, D. P., T. Ando, R. L. Fankhauser, R. S. Bear d, R. I. Glass, and S. S. Monroe . 2006. Norovirus classification and proposed strain nomenclature. Virology 346:312-323.
587. Zhou, A., B. A. Hassel, and R. H. Silverman . 1993. Expression cloning of 2-5A-dependent RNAase: a uniquely regulated mediator of interferon action. Cell 72:753-765.
588. Zhou, A., J. Paranjape, T. L. Brown, H. Nie, S. Nai k, B. Dong, A. Chang, B. Trapp, R. Fairchild, C. Colmenares, and R. H. Silve rman . 1997. Interferon action and apoptosis are defective in mice devoid of 2',5'-oligoadenylate-dependent RNase L. EMBO J. 16:6355-6363.
589. Zuker, M. 1989. Computer prediction of RNA structure. Methods Enzymol. 180:262-288.
590. Zuker, M. 2003. Mfold web server for nucleic acid folding and hybridization prediction. Nucleic Acids Res. 31:3406-3415.
591. Zuniga, E. I., L. Y. Liou, L. Mack, M. Mendoza, and M. B. Oldstone . 2008. Persistent virus infection inhibits type I interferon production by plasmacytoid dendritic cells to facilitate opportunistic infections. Cell Host. Microbe 4:374-386.

234
Appendix Original sequence data generated during project
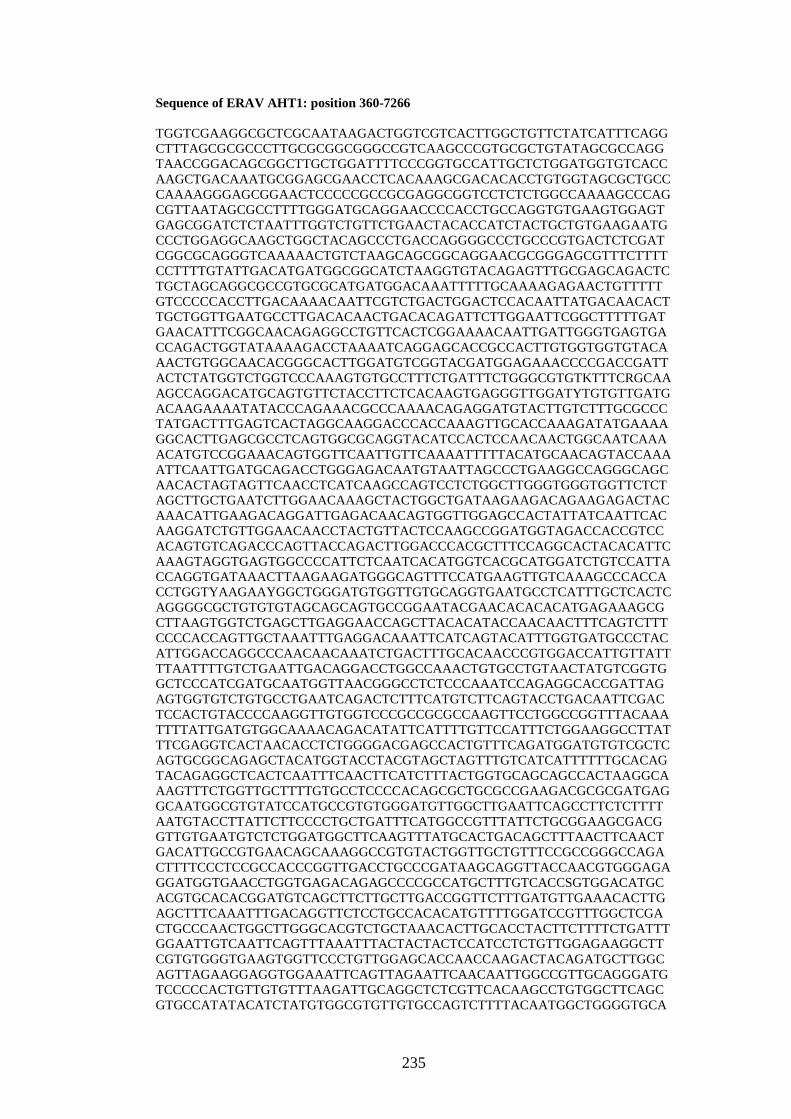
235
Sequence of ERAV AHT1: position 360-7266 TGGTCGAAGGCGCTCGCAATAAGACTGGTCGTCACTTGGCTGTTCTATCATTTCAGGCTTTAGCGCGCCCTTGCGCGGCGGGCCGTCAAGCCCGTGCGCTGTATAGCGCCAGGTAACCGGACAGCGGCTTGCTGGATTTTCCCGGTGCCATTGCTCTGGATGGTGTCACCAAGCTGACAAATGCGGAGCGAACCTCACAAAGCGACACACCTGTGGTAGCGCTGCCCAAAAGGGAGCGGAACTCCCCCGCCGCGAGGCGGTCCTCTCTGGCCAAAAGCCCAGCGTTAATAGCGCCTTTTGGGATGCAGGAACCCCACCTGCCAGGTGTGAAGTGGAGTGAGCGGATCTCTAATTTGGTCTGTTCTGAACTACACCATCTACTGCTGTGAAGAATGCCCTGGAGGCAAGCTGGCTACAGCCCTGACCAGGGGCCCTGCCCGTGACTCTCGATCGGCGCAGGGTCAAAAACTGTCTAAGCAGCGGCAGGAACGCGGGAGCGTTTCTTTTCCTTTTGTATTGACATGATGGCGGCATCTAAGGTGTACAGAGTTTGCGAGCAGACTCTGCTAGCAGGCGCCGTGCGCATGATGGACAAATTTTTGCAAAAGAGAACTGTTTTTGTCCCCCACCTTGACAAAACAATTCGTCTGACTGGACTCCACAATTATGACAACACTTGCTGGTTGAATGCCTTGACACAACTGACACAGATTCTTGGAATTCGGCTTTTTGATGAACATTTCGGCAACAGAGGCCTGTTCACTCGGAAAACAATTGATTGGGTGAGTGACCAGACTGGTATAAAAGACCTAAAATCAGGAGCACCGCCACTTGTGGTGGTGTACAAACTGTGGCAACACGGGCACTTGGATGTCGGTACGATGGAGAAACCCCGACCGATTACTCTATGGTCTGGTCCCAAAGTGTGCCTTTCTGATTTCTGGGCGTGTKTTTCRGCAAAGCCAGGACATGCAGTGTTCTACCTTCTCACAAGTGAGGGTTGGATYTGTGTTGATGACAAGAAAATATACCCAGAAACGCCCAAAACAGAGGATGTACTTGTCTTTGCGCCCTATGACTTTGAGTCACTAGGCAAGGACCCACCAAAGTTGCACCAAAGATATGAAAAGGCACTTGAGCGCCTCAGTGGCGCAGGTACATCCACTCCAACAACTGGCAATCAAAACATGTCCGGAAACAGTGGTTCAATTGTTCAAAATTTTTACATGCAACAGTACCAAAATTCAATTGATGCAGACCTGGGAGACAATGTAATTAGCCCTGAAGGCCAGGGCAGCAACACTAGTAGTTCAACCTCATCAAGCCAGTCCTCTGGCTTGGGTGGGTGGTTCTCTAGCTTGCTGAATCTTGGAACAAAGCTACTGGCTGATAAGAAGACAGAAGAGACTACAAACATTGAAGACAGGATTGAGACAACAGTGGTTGGAGCCACTATTATCAATTCACAAGGATCTGTTGGAACAACCTACTGTTACTCCAAGCCGGATGGTAGACCACCGTCCACAGTGTCAGACCCAGTTACCAGACTTGGACCCACGCTTTCCAGGCACTACACATTCAAAGTAGGTGAGTGGCCCCATTCTCAATCACATGGTCACGCATGGATCTGTCCATTACCAGGTGATAAACTTAAGAAGATGGGCAGTTTCCATGAAGTTGTCAAAGCCCACCACCTGGTYAAGAAYGGCTGGGATGTGGTTGTGCAGGTGAATGCCTCATTTGCTCACTCAGGGGCGCTGTGTGTAGCAGCAGTGCCGGAATACGAACACACACATGAGAAAGCGCTTAAGTGGTCTGAGCTTGAGGAACCAGCTTACACATACCAACAACTTTCAGTCTTTCCCCACCAGTTGCTAAATTTGAGGACAAATTCATCAGTACATTTGGTGATGCCCTACATTGGACCAGGCCCAACAACAAATCTGACTTTGCACAACCCGTGGACCATTGTTATTTTAATTTTGTCTGAATTGACAGGACCTGGCCAAACTGTGCCTGTAACTATGTCGGTGGCTCCCATCGATGCAATGGTTAACGGGCCTCTCCCAAATCCAGAGGCACCGATTAGAGTGGTGTCTGTGCCTGAATCAGACTCTTTCATGTCTTCAGTACCTGACAATTCGACTCCACTGTACCCCAAGGTTGTGGTCCCGCCGCGCCAAGTTCCTGGCCGGTTTACAAATTTTATTGATGTGGCAAAACAGACATATTCATTTTGTTCCATTTCTGGAAGGCCTTATTTCGAGGTCACTAACACCTCTGGGGACGAGCCACTGTTTCAGATGGATGTGTCGCTCAGTGCGGCAGAGCTACATGGTACCTACGTAGCTAGTTTGTCATCATTTTTTGCACAGTACAGAGGCTCACTCAATTTCAACTTCATCTTTACTGGTGCAGCAGCCACTAAGGCAAAGTTTCTGGTTGCTTTTGTGCCTCCCCACAGCGCTGCGCCGAAGACGCGCGATGAGGCAATGGCGTGTATCCATGCCGTGTGGGATGTTGGCTTGAATTCAGCCTTCTCTTTTAATGTACCTTATTCTTCCCCTGCTGATTTCATGGCCGTTTATTCTGCGGAAGCGACGGTTGTGAATGTCTCTGGATGGCTTCAAGTTTATGCACTGACAGCTTTAACTTCAACTGACATTGCCGTGAACAGCAAAGGCCGTGTACTGGTTGCTGTTTCCGCCGGGCCAGACTTTTCCCTCCGCCACCCGGTTGACCTGCCCGATAAGCAGGTTACCAACGTGGGAGAGGATGGTGAACCTGGTGAGACAGAGCCCCGCCATGCTTTGTCACCSGTGGACATGCACGTGCACACGGATGTCAGCTTCTTGCTTGACCGGTTCTTTGATGTTGAAACACTTGAGCTTTCAAATTTGACAGGTTCTCCTGCCACACATGTTTTGGATCCGTTTGGCTCGACTGCCCAACTGGCTTGGGCACGTCTGCTAAACACTTGCACCTACTTCTTTTCTGATTTGGAATTGTCAATTCAGTTTAAATTTACTACTACTCCATCCTCTGTTGGAGAAGGCTTCGTGTGGGTGAAGTGGTTCCCTGTTGGAGCACCAACCAAGACTACAGATGCTTGGCAGTTAGAAGGAGGTGGAAATTCAGTTAGAATTCAACAATTGGCCGTTGCAGGGATGTCCCCCACTGTTGTGTTTAAGATTGCAGGCTCTCGTTCACAAGCCTGTGGCTTCAGCGTGCCATATACATCTATGTGGCGTGTTGTGCCAGTCTTTTACAATGGCTGGGGTGCA
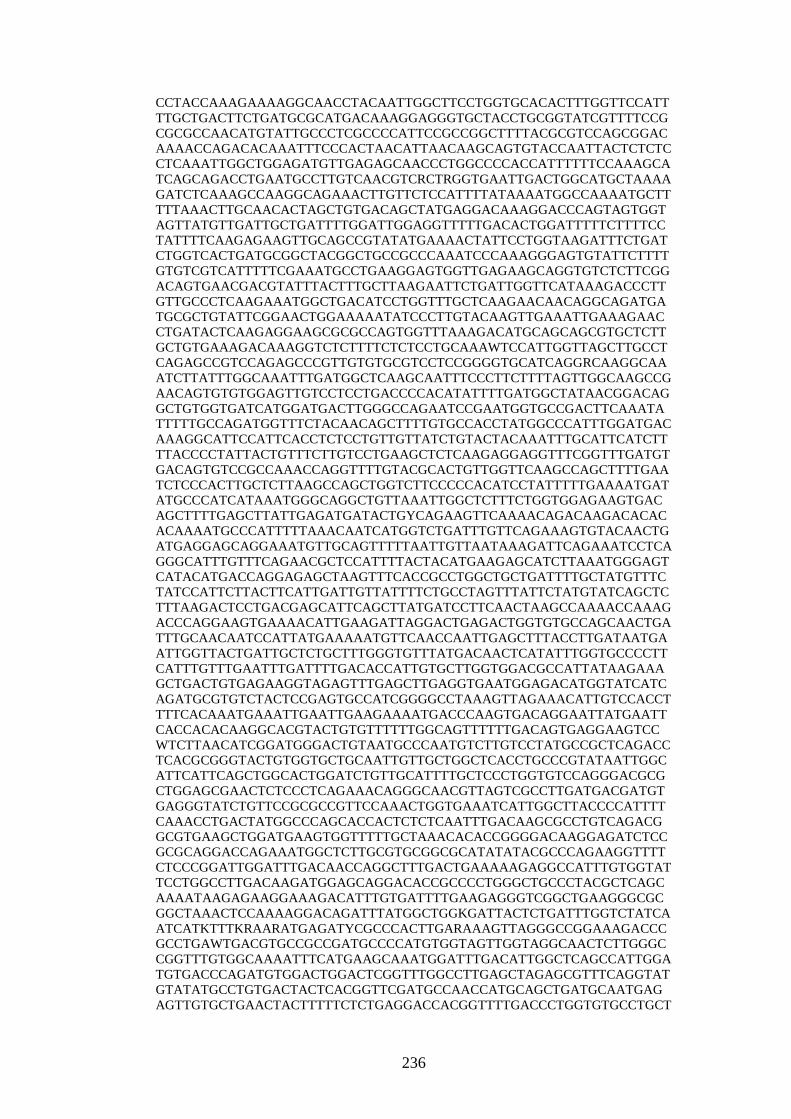
236
CCTACCAAAGAAAAGGCAACCTACAATTGGCTTCCTGGTGCACACTTTGGTTCCATTTTGCTGACTTCTGATGCGCATGACAAAGGAGGGTGCTACCTGCGGTATCGTTTTCCGCGCGCCAACATGTATTGCCCTCGCCCCATTCCGCCGGCTTTTACGCGTCCAGCGGACAAAACCAGACACAAATTTCCCACTAACATTAACAAGCAGTGTACCAATTAC TCTCTCCTCAAATTGGCTGGAGATGTTGAGAGCAACCCTGGCCCCACCATTTTTTCCAAAGCATCAGCAGACCTGAATGCCTTGTCAACGTCRCTRGGTGAATTGACTGGCATGCTAAAAGATCTCAAAGCCAAGGCAGAAACTTGTTCTCCATTTTATAAAATGGCCAAAATGCTTTTTAAACTTGCAACACTAGCTGTGACAGCTATGAGGACAAAGGACCCAGTAGTGGTAGTTATGTTGATTGCTGATTTTGGATTGGAGGTTTTTGACACTGGATTTTTCTTTTCCTATTTTCAAGAGAAGTTGCAGCCGTATATGAAAACTATTCCTGGTAAGATTTCTGATCTGGTCACTGATGCGGCTACGGCTGCCGCCCAAATCCCAAAGGGAGTGTATTCTTTTGTGTCGTCATTTTTCGAAATGCCTGAAGGAGTGGTTGAGAAGCAGGTGTCTCTTCGGACAGTGAACGACGTATTTACTTTGCTTAAGAATTCTGATTGGTTCATAAAGACCCTTGTTGCCCTCAAGAAATGGCTGACATCCTGGTTTGCTCAAGAACAACAGGCAGATGATGCGCTGTATTCGGAACTGGAAAAATATCCCTTGTACAAGTTGAAATTGAAAGAACCTGATACTCAAGAGGAAGCGCGCCAGTGGTTTAAAGACATGCAGCAGCGTGCTCTTGCTGTGAAAGACAAAGGTCTCTTTTCTCTCCTGCAAAWTCCATTGGTTAGCTTGCCTCAGAGCCGTCCAGAGCCCGTTGTGTGCGTCCTCCGGGGTGCATCAGGRCAAGGCAAATCTTATTTGGCAAATTTGATGGCTCAAGCAATTTCCCTTCTTTTAGTTGGCAAGCCGAACAGTGTGTGGAGTTGTCCTCCTGACCCCACATATTTTGATGGCTATAACGGACAGGCTGTGGTGATCATGGATGACTTGGGCCAGAATCCGAATGGTGCCGACTTCAAATATTTTTGCCAGATGGTTTCTACAACAGCTTTTGTGCCACCTATGGCCCATTTGGATGACAAAGGCATTCCATTCACCTCTCCTGTTGTTATCTGTACTACAAATTTGCATTCATCTTTTACCCCTATTACTGTTTCTTGTCCTGAAGCTCTCAAGAGGAGGTTTCGGTTTGATGTGACAGTGTCCGCCAAACCAGGTTTTGTACGCACTGTTGGTTCAAGCCAGCTTTTGAATCTCCCACTTGCTCTTAAGCCAGCTGGTCTTCCCCCACATCCTATTTTTGAAAATGATATGCCCATCATAAATGGGCAGGCTGTTAAATTGGCTCTTTCTGGTGGAGAAGTGACAGCTTTTGAGCTTATTGAGATGATACTGYCAGAAGTTCAAAACAGACAAGACACACACAAAATGCCCATTTTTAAACAATCATGGTCTGATTTGTTCAGAAAGTGTACAACTGATGAGGAGCAGGAAATGTTGCAGTTTTTAATTGTTAATAAAGATTCAGAAA TCCTCAGGGCATTTGTTTCAGAACGCTCCATTTTACTACATGAAGAGCATCTTAAATGGGAGTCATACATGACCAGGAGAGCTAAGTTTCACCGCCTGGCTGCTGATTTTGCTATGTTTCTATCCATTCTTACTTCATTGATTGTTATTTTCTGCCTAGTTTATTCTATGTATCAGCTCTTTAAGACTCCTGACGAGCATTCAGCTTATGATCCTTCAACTAAGCCAAAACCAAAGACCCAGGAAGTGAAAACATTGAAGATTAGGACTGAGACTGGTGTGCCAGCAACTGATTTGCAACAATCCATTATGAAAAATGTTCAACCAATTGAGCTTTACCTTGATAATGAATTGGTTACTGATTGCTCTGCTTTGGGTGTTTATGACAACTCATATTTGGTGCCCCTTCATTTGTTTGAATTTGATTTTGACACCATTGTGCTTGGTGGACGCCATTATAAGAAAGCTGACTGTGAGAAGGTAGAGTTTGAGCTTGAGGTGAATGGAGACATGGTATCATCAGATGCGTGTCTACTCCGAGTGCCATCGGGGCCTAAAGTTAGAAACATTGTCCACCTTTTCACAAATGAAATTGAATTGAAGAAAATGACCCAAGTGACAGGAATTAT GAATTCACCACACAAGGCACGTACTGTGTTTTTTGGCAGTTTTTTGACAGTGAGGAAGTCCWTCTTAACATCGGATGGGACTGTAATGCCCAATGTCTTGTCCTATGCCGCTCAGACCTCACGCGGGTACTGTGGTGCTGCAATTGTTGCTGGCTCACCTGCCCGTATAATTGGCATTCATTCAGCTGGCACTGGATCTGTTGCATTTTGCTCCCTGGTGTCCAGGGACGCGCTGGAGCGAACTCTCCCTCAGAAACAGGGCAACGTTAGTCGCCTTGATGACGATGTGAGGGTATCTGTTCCGCGCCGTTCCAAACTGGTGAAATCATTGGCTTACCCCATTTTCAAACCTGACTATGGCCCAGCACCACTCTCTCAATTTGACAAGCGCCTGTCAGACGGCGTGAAGCTGGATGAAGTGGTTTTTGCTAAACACACCGGGGACAAGGAGATCTCCGCGCAGGACCAGAAATGGCTCTTGCGTGCGGCGCATATATACGCCCAGAAGGTTTTCTCCCGGATTGGATTTGACAACCAGGCTTTGACTGAAAAAGAGGCCATTTGTGGTATTCCTGGCCTTGACAAGATGGAGCAGGACACCGCCCCTGGGCTGCCCTACGCTCAGCAAAATAAGAGAAGGAAAGACATTTGTGATTTTGAAGAGGGTCGGCTGAAGGGCGCGGCTAAACTCCAAAAGGACAGATTTATGGCTGGKGATTACTCTGATTTGGTCTATCAATCATKTTTKRAARATGAGATYCGCCCACTTGARAAAGTTAGGGCCGGAAAGACCCGCCTGAWTGACGTGCCGCCGATGCCCCATGTGGTAGTTGGTAGGCAACTCTTGGGCCGGTTTGTGGCAAAATTTCATGAAGCAAATGGATTTGACATTGGCTCAGCCATTGGATGTGACCCAGATGTGGACTGGACTCGGTTTGGCCTTGAGCTAGAGCGTTTCAGGTATGTATATGCCTGTGACTACTCACGGTTCGATGCCAACCATGCAGCTGATGCAATGAGAGTTGTGCTGAACTACTTTTTCTCTGAGGACCACGGTTTTGACCCTGGTGTGCCTGCT

237
TTTGTTGAGTCGCTGATCGATTCAGTGCATGCCTATGAAGAGAAAAGGTACAACATCTACGGTGGCTTGCCATCCGGGTGTTCCTGCACATCAATTTTGAATACCATTTTGAACAATGTTTACATCCTTGCAGCTATGATGAAGGCTTATGAAAACTTTGAGCCGGATGACATTCAAGTCATTTGCTATGGGGACGACTGCCTCATTCGTTCTGA
238
Sequence of MNV – Laboratory mouse F12: position 58-7268 GC---AAAAACCAAAAGGCTTCATCTAAGGCTAGTGTCTCCTTTGGAGCACCTAGCTTACTCTCTTCGGAGAGTGAAGATGAAGTTAATTATTTGACCCCTCCTGAGCAGGAAGCTCAGCCCGGCACTCTYGCGGCCCTTCATGGGGACGGGCCGCATGCCGGGCTCCCTGTGACCCGAAGTGATGCACGCGTGCTGATCTTCAACGATTGGGAGGAGAGGAAGAAGTCTGAGCCGTGGCTACGGCTGGACATGTCTGACAAGGCCATCTTCCGCCGCTTCCCCCATTTGCGGCCTAAGGAGGACAAGGCTGATGCACCCTCCCACGCGGAGGATGCCATGGATGCAAAGGAGCCCATAATTGGGTCTATCCTTGAGCAGGACGACCACAAGTTCTACCACTACTCTGTCTACATTGGTAATGGCCAGGTGATGGGCGTCAACAACCCCGGCGCCGCCGTCTGCCAGGCTGTGATCGATGTGGAGAAGCTCCACCTGTGGTGGAGGCCAGTCTGGGAACCCCGCCAACCCCTCGACCCGGCTGAGTTGAGGAGATGTGTTGGTATGACTGTCCCCTATGTGGCGACCACTGTCAACTGCTATCAGGTCTGCTGCTGGATTGTTGGGATTAGAGACACCTGGCTGAAGAGGGCGAAGATCTCTAGGGACTCGCCCTTCTACAGCCCTGTCCAGGACTGGAACATCGACCCCCAGGAGCCCTTCATCCCTTCCAAACTCAGGATGGTCTCTGATGGCATCTTAGTGGCTCTTGCAACGGTGATTGGTCGGCCTATCAAGAACCTGCTTGCATCTGTGAAGCCGCTCAACATTCTTAACATCGTGTTGAGCTGCGACTGGACTTTCTCGGGCATTGTCAACGCCCTGATTCTCCTTGCTGAACTTTTTGACATCTTCTGGACCCCCCCTGATGTCACCAACTGGATGGTCTCCATCTTTGGAGAGTGGCAGGCTGAGGGCCCCTTTGACCTCGCCCTAGATGTTGTGCCCACCCTTCTTGGTGGGATTGGCATGGCTTTCGGCCTAACATCTGAAACCATTGGGCGYAAGCTYGCYTCCACCAACTCGGCCCTTAAGGCCGCCCAGGAGATGGGCAAGTTTGCAATTGAGGTCTTCAAGCAAATCATGGCATGGATCTGGCCCTCCGAGGACCCGGTTCCCGCCCTGCTCTCCAACATGGAGCAGGCTGTCATTAAGAATGAGTGTCAACTTGAGAACCAGCTCACGGCCATGCTGCGGGATCGCAACGCTGGAGCTGAGTTTTTGAAAGCGCTCGATGAGGAAGAGCAGGAGGTCCGGAAGATTGCTGCCAAGTGCGGCAACTCCGCCACCACGGGCACGACCAACGCTCTGCTAGCTAGGATTAGCATGGCGCGCGCGGCCTTTGAGAAGGCCCGCGCTGAGCAGACATCTCGGGTTCGACCCGTCGTGATCATGGTCTCTGGCAGGCCCGGGATCGGGAAAACCTGCTTTTGCCAGAGCTTGGCAAAGAGGATTGCCGCCTCCCTTGGGGATGAGACATCAGTTGGCATCATCCCGCGCGCCGATGTGGACCACTGGGACGCCTACAAGGGCGCCAGAGTTGTTCTTTGGGACGACTTTGGCATGGACAATGTGGTGAAGGATGCACTGCGGCTGCAGATGCTTGCTGACACTTGCCCTGTCACGCTCAACTGTGACAGAATTGAGAACAAGGGGAAGATGTTTGACTCTCAGGTTATCATCATCACCACCAACCAGCAGACCCCAGTACCCSTGGACTATGTCAACCTGGAGGCAGTTTGCCGCCGCATAGACTTTCTGGTCTATGCTGAGAGCCCCGTGGTCGACGCTGCTCGAGCCAGATCACCCGGCGACGCGGCCGCCGTTAAGGCCGCCATGAGACCAGACTACAGCCATATCAATTTCATCCTGGCACCACAGGGTGGCTTTGACCGGCAGGGCAACACCCCCTATGGTAAGGGCGTCACCAAGATCATTGGCGCCACCGCGCTCTGCGCGAGGGCAGTTGCCCTTGTTCATGAGCGCCATGATGATTTCGGCCTCCAAAACAAGRYCTATGATTTTGATGCTGGCAAGGTGACTGCCTTCAAGGCTATGGCAGCTGATGCCGGCATCCCTTGGTACAAGATGGCAGCGATTGGCTGCAAGGCCATGAGCTGCACCTGTGTGGAGGAAGCCATGAACCTGCTTAAGGATTATGAGGTGGCCCCGTGCCAGGTGATCTATAACGGGGCCACTTATAATGTCAGCTGCATCAAGGGTGCTCCCATGGTTGAGAGGGTCAAGGAGCCCGAGCTGCCCAAAACACTAGTCAATTGTGTTAGGAGGATCAAGGAGGCCCGCCTCCGCTGCTATTGCAGGATGGCCACGGATGTCATCACCTCCATCCTGCAGGCGGCTGGAACAGCTTTCTCCATCTACCATCAGATTGAGAAGAAAACCCGGCCCTCCTTCTACTGGGATCACGGTTACACCTACCGCGATGGCCCGGGTGCYTTTGATCTCTTTGAGGATGAC---AACGACGGGTGGTACCACTCTGAAGGCAAGAAAGGCAAGAACAAGGGAGGCCGGGGG---CGTCCTGGAGTTTTCAAGTCCCGTGGGCTCACGGACGAGGAGTACGATGAATTCAAGAAGCGCCGCGAGTCTAAGGGCGGTAAGTACTCCATTGATGATTACCTCGCTGACCGTGAGCGAGAAGAAGAACTCCAGGAGCGTGATGAAGAGGAGGCCATCTTCGGGGACGGCCCTGGCCTGAAGGCCACACGCCGCTCCCGCAGAGCAGAGAGAGCCAGGCTTGGCTTGATTTCGGGCGGTGATATCCGTGCCCGCAAGCCAATCGACTGGAATGTGGTTGGCCCCTCCTGGGCTGATGACGAGCGCCAGGTTGACTATGGTGAGAAGATCAACTTTGAGGCTCCAGTTTCCATCTGGYCCCGCGTTGTGCAATTTGGCACGGGGTGGGGCTTCTGGGTCAGTGGCCATGTGTTCATCACCGCTAAGCATGTGGCACCAGCCAAGGGCACGGAGGTGTTCGGGCGCAAGCCCGAGGAGTTCACCGTCACCTCTAGTGGGGACTTTCTGAAGTACCACTTCACCAGTGCCGTTAGACCTGACATTCCCGCCATGGTCCTGGAGA
239
ATGGTTGCCAGGAGGGCGTCGTCGCCTCAGTCCTCGTTAAGAGGGCCTCTGGTGAGATGCTTGCCCTGGCAGTCAGGATGGGCTCGCAGGCCGCCATCAAGATCGGCAGCGCTGTGGTACACGGGCAAACTGGCATGCTCTTGACTGGCTCCAACGCCAAGGCGCANGATCTCGGGACCATCCCGGGCGATTGTGGTTGCCCCTATGTCTACAAGAAAGGTAACACCTGGGTTGTGATCGGGGTGCATGTGGCGGCTACTAGGTCTGGCAACACGGTCATTGCTGCCACTCATGGAGAACCCACACTTGAGGCCCTGGAATTCCAAGGTCCCCCCATGCTCCCCCGCCCTTCTGGCACCTATGCGGGCCTTCCCATCGCCGATTACGGCGATGCCCCCCCTTTGAGCACCAAGACCATGTTCTGGCGCACCTCGCCAGAGAAGCTTCCCCCTGGAGCTTGNGAGCCTGCCTACCTCGGCTCCAAGGATGAGAGAGTGGATGGTCCTTCTTTGCAGCAGGTTATGCGGGATCAGCTTAAGCCCTACTCAGAGCCACGTGGCTTGCTGCCCCCTCAGGAGATTTTGGACGCGGTTTGTGACGCCATCGAGAACCGCCTCGAGAACACCCTTGAACCACAGAAACCTTGGACGTTCAAGAAGGCCTGTGAGAGTCTGGATAAGAACACCAGCAGTGGATACCCCCACCACAAGCAGAAAAGCAAGGACTGGACGGGAACCGCCTTCATTGGCGATCTCGGCGACCAGGCCACCCATGCCAACAACATGTATGAGATGGGCAAGTCCATGCGGCCCGTCTACACAGCTGCCCTCAAGGATGAGCTAGTTAAGCCAGACAAGATCTACAAGAAGATAAAGAAGAGGCTCCTCTGGGGTTCTGACCTCGGCACCATGATCCGTGCCGCCCGTGCTTTTGGCCCCTTTTGTGAAGCTTTGAAAGAAACTTGTATCCTTAATCCCATCAGAGTGGGCATGTCGATGAACGAGGATGGACCCTTCATCTTCGCGAGGCACGCCAATTTCAGATACCACATGGATGCAGATTACACCAGGTGGGACTCCACCCAGCAAAGAGCCATTCTGAAGCGCGCTGGCGACATCATGGTGCGCCTCTCTCNTGAGCCAGAGTTAGCTCGGGTGGTGATGGACGACCTCCTGGCCCCTTCCTTGCTGGATGTCGGCGACTACAAGATCGTCGTCGAAGAGGGGCTCCCGTCTGGCTGCCCTTGCACTACACAACTGAACAGCATGGCCCACTGGATTTTGACCCTCTGCGCAATGGTGGAGGTGACCCGGATTGACCCTGATATTGTGATGCAGGAGTCTGAGTTTTCCTTTTATGGTGATGATGAAGTGGTTTCGACCAACCTAGAGCTGGACATGACCAAGTACACCATGGCCCTGAAGCGGTACGGTCTCCTCCCGACGCGTGCGGACAAGGAGGAGGGGCCCCTGGAGCGCCGTCAGACGCTGCAGGGCATCTCCTTCCTGCGCCGCGCGATAGTCGGTGACCAGTTTGGCTGGTATGGTCGCCTCGATCGTGCCAGCATTGATCGCCAGCTTCTCTGGACCAAAGGACCTAACCATCAGAACCCTTTTGAGACCCTCCCAGGACACGCTCAGAGACCCTCCCAATTGATGGCCCTGCTCGGTGAGGCTGCCATGCATGGTGAAAGGTATTACAGGACTGTGGCTTCCCGGGTCTCCAAGGAGGCCGCCCAGAGTGGGATAGAAATGGTGGTCCCACGCCACCGGTCTGTTCTGCGCTGGGTGCGCTTTGGAACAATGGATGCTGAGACCCCGCAGGAACGCTCAGCAGTCTTTGTGAATGAGGATGAGTGATGGCGCAGCGCCAAAAGCCAACGGCTCTGAAGCCAGCGGCCAGGATCTTGTTCCTACCGCCGTTGAACAGGCCGTCCCCATTCAGCCCGTGGCTGGCGCGGCTCTTGCCGCCCCCGCCGCCGGGCAAATTAACCAAATTGACCCCTGGATTTTCCAAAATTTTGTCCAGTGCCCCCTTGGTGAGTTTTCCATTTCACCTCGAAACACCCCAGGTGAAATATTGTTTGATTTGGCCCTCGGGCCAGGGCTCAACCCCTACCTTGCCCACCTCTCGGCCATGTACACCGGCTGGGTTGGGAACATGGAGGTTCAGCTGGTCCTCGCCGGCAATGCCTTTACTGCTGGCAAGGTGGTTGTTGCCCTTGTACCACCCTATTTTCCCAAAGGGTCACTCACCACTGCTCAAATCACATGCTTCCCACATGTCATGTGTGATGTGCGCACCCTGGAGCCCATTCAACTCCCTCTTCTTGACGTGCGTCGAGTTCTTTGGCATGCTACCCAGGATCAGGAGGAATCTATGCGCCTGGTTTGCATGCTGTACACGCCACTCCGCACAAACAGCCCGGGTGATGAGTCTTTCGTGGTCTCTGGCCGCCTTCTTTCTAAGCCGGCAGCTGATTTTAATTTTGTATACCTGACCCCCCCCATTGAGAGGACTATTTATCGGATGGTTGACTTGCCCGTGTTGCAGCCGCGGCTGTGCACGCACGCTCGTTGGCCAGCACCGGTCTATGGCCTCTTAGTGGACCCATCCCTCCCGTCCAACCCCCAGTGGCAGAATGGAAGAGTGCATGTTGATGGGACCCTCCTTGGTACAACACCTATTTCTGGGTCCTGGGTTTCCTGCTTTGCAGCTGAGGCTGCCTACGAGTTTCAGTCTGGAACCGGTGAGGTGGCGACCTTCACCCTGATTGAGCAAGACGGGTCCGCCTATGTCCCTGGTGACAGGRCGGCTCCCCTTGGCTACCCCGATTATTCCGGGCAGCTGGAAATTGAGGTGCAGACTGAGACCAACAAGGCAGGAGACAAGCTGAAGGTGACCACCTTTGAGATGATYCTTGGCCCCACCACCAATGTGGACCAGGCGCCCTACCAGGGCAGGGTATACGCTAACCTAACGGTTGCGTCCTCCCTTGACCTGGTGGATGGCAGGGTTAGGGCGGTCCCGCGCTCTGTCAATGGCTTCCAGGATGTGATTCCCGAGTATAATGATGGTCTTCTTGTTCCCCTTGCCCCCCCTATTGGCCCCTTTCTTCCTGGTGAGGTGCTCCTGAGGTTCCGGACCTACATGCGCCAGATTGACAGCTCTGATGCCGCAGCGGAAGCCATTGACTGCGCCCTTCCACAGGAATTCGTCTCGTGGTTCGCGAGTAGCGCATTCACGGTGCAGTCGGAGGCTCTGCTTCTTAGGTACAGGAACACCCTGACTGGGCAGCTGCTGTTTGAGTGCAAGCTCTACAGCGAAGGCTACATCGCCCTATCCTATTCGGGCTCAGGACCGCTCACCTTCCCAACTGACGGCTTCTTTGA
240
GGTTGTTAGCTGGGTCCCCCGCCTTTATCAATTGGCCTCTGTGGGAAGCTTGGCAACAGGCCGAACACTCAAACAATAATGGCTGGCGCACTTTTTGGTGCGATTGGAGGTGGCCTGATGGGCATAATTGGCAACTCCATCTCAACAGTTCAGAACCTTCAGGCAAATAAMCAATTGGCTGCACAACAATTTGGCTATAATTCCTCTTTGCTTGCAACGCAAATTCAGGCCCAGAAGGATCTCACACTGATGGGGCAGCAATTCAACCAGCAGCTCCAAGCCAACTCTTTMAAGCA TGACCTTGAGATGCTTGGCGCCCAGGTGCAAGCCCAGGCGCAGGCCCAGGAGAACGCCATCAACATCAGGTCGGCGCAGCTCCAGGCCGCAGGCTTTTCAAGGTCCGAMGCCATTCGCCTGGCCTCGGGGCAGCAGCCGACGAAGGCCGTCGACTGGTCTGGGACGCGGTATTACGCCGCCAACCAGCCGGTTACGGGCTTCTCGGGTGGTTTTACCCCAAGTTACACTCCAGGTAGGCAAATGGCAGTCCGCCCTGTGGACACATCCCCTCTACCGGTCCCAGGTGGGCACGTGCCGTCCCTTCGTGGAGGTTCCTGGTCCCCGCGTGATTACACGCCGCAGACTCAAGGCACCTACACG
241
Sequence of MNV – Laboratory mouse F17: position 103-7329 GAGCACCTAGCCTTCTCTCTTCGGAGAGCGAAGACGAAATTAATTACATGACCCCTCCTGAGCAGGAAGCTCAGCCCGGCGCCCTTGCGGCCCTTCATGCGGAAGGGCCGCTTGCCGGGCTCCCCGTGACGCGTAGTGATGCACGCGTGCTGATCTTCAATGAGTGGGAGGAGAGGAAGAAGTCTGATCCGTGGCTACGGCTGGACATGTCTGATAAGGCTATCTTCCGCCGTTACCCCCATCTGCGGCCTAAGGAGGATAGGNCTGACGCGCCCTCCCATGCGGAGGACGCTATGGATGCCAAGGAGCCTGTGATCGGCTCTATCTTGGAGCAGGATGATCACAAGTTTTACCATTACTCTGTCTACATCGGTGNCGGCCTTGTGATGGGNGTCAACAACCCCAGTGCTGCGGTCTGCCAGGCAACGATTGATGTGGAGAAGCTACACCTCTGGTGGCGGCCTGTCTGGGAGCCCCGCCATCCCCTTGACTCGGNTGAGTTGAGGAAGTGCGTGGGCATGACWGTCCCYTACGTGGCCACCACCGTYAACTGYTAYCAGGTGTGYTGCTGGATTGTTGGCATCAAGGACACYTGGCTGAAGAGGGCGAAGATCTCCAGAGATTCGCCTTTCTACAGCCCTGTCCAGGATTGGAATGTTGATCCCAAGGAGCCCTTCATTCCCTCCAAGCTTAGGATGGTCTCTGATGGTATCCTGGTGGCCCTGTCAACGGTGATTGGTCGGCCAATCAAGAACCTGCTTGCCTCAGTCAAGCCGCTCAACATACTTAACATCGTGCTGAGCTGTGATTGGACCTTCTCGGGCATTGTCAACGCCCTAATCCTCCTGGCTGAGCTCTTTGACATCTTCTGGACCCCCCCTGATGTGACCAACTGGATGATCTCCATCTTCGGGGAGTGGCAGGCCGAGGGGCCCTTCGACCTTGCCCTTGATGTTGTGCCCACCCTGCTGGGTGGGATTGGTATGGCCTTCGGCCTGACCTCTGAGACTATTGGGCGCAAGCTCGCYTCCACCAATTCGGCCCTGAAGGCCGCCCAAGAGATGGGTAAGTTTGCCATTGAGGTCTTCAAGCAGATCATGGCCTGGATCTGGCCCTCTGAGGATCCGGTGCCGGCCCTCCTGTCCAACATGGAGCAGGCCGTTATCAAGAATGAGTGCCAGTTGGAGAATCAGCTCACGGCTATGCTGCGAGATCGCAACGCCGGGGCTGAATTCCTGAAGTCCCTTGATGAGGAGGAGCAGGAGGTCCGAAAGATCGCGGCCAAGTGTGGCAACTCAGCCACCACTGGAACCACCAATGCCTTGCTTGCTAGGATTAGCATGGCACGCGCGGCATTTGAGAAGGCCCGCGCCGAGCAGACCTCCCGGGTTCGTCCCGTGGTGATTATGGTCTCAGGCAGGCCCGGGATCGGGAAGACCTGCTTTTGCCAGAACTTGGCCAAGAGGATTGCCGCGTCACTAGGTGATGAGACCTCTGTCGGCATCATACCACGTGCAGATGTCGACCACTGGGACGCCTATAAGGGGGCCAGAGTGGTCCTTTGGGATGACTTCGGCATGGATAATGTGGTGAAGGACGCGTTGAGACTCCAGATGCTTGCTGACACATGCCCCGTGACACTTAACTGTGATAGGATTGAGAACAAAGGCAAGATGTTTGATTCCCAGGTCATCATCATCACTACAAACCAGCAGACCCCCGTGCCCTTGGACTATGTCAACTTGGAGGCGGTCTGCCGCCGCATAGACTTTCTGGTCTATGCTGAGAGCCCTGTGGTTGACGCCGCCCGGGCCAGGTCCCCTGGTGACGCGGGCGCGGTCAAGGCCGCCATGAGGCCCGACTACAGCCATATCAAYTTCATCTTGGCGCCACAGGGAGGCTTTGACCGCCAGGGTAACACCCCCTATGGCAAGGGCGTCACCAAGATCATCGGTGCCACTGCCCTCTGCGCGAGGGCGGTCGCTCTTGTCCATGAACGCCATGATGATTTTGGCCTCCAGAGTAAGATCTATGACTTTGATGCTGGCAAGGTCACCGCCTTTAAGGCCATGGCGGCTGACGCCGGCATCCCATGGTACAAAATGGCAACAATTGGATACAAGGCTATGGGCTGCACCTGTGTGGAAGAGGCCATGAACCTCCTCAAGGATTATGAGGTGGCCCCATGTCAAGTGNTTTACAATGGTGCTACCTACAATGTGAGCTGCATCAAGGGTGCCCCAATGGTTGAAAAGATCAAAGAACCTGAATTGCCCAAAACCCTAGTCAACTGTGTTAGGAGGATAAAAGAGGCCCGTCTCCGCTGCTATTGCAGAATGGCAACAGATGTCATCACGTCCATTCTGCAGGCAGCCGGGACGGCCTTCTCCATCTACCACCAGATCGAGAAGAGGTCCAGACCCTCTTTCTACTGGGACCATGGATACACCTACCGTGATGGTCCCGGGGCCTTTGACATCTTTGAGGATGAT---GATGATGGGTGGTACCACTCTGAGAGCAAGAAGGGTAAGAACAAGAAAGGCCGTGGG---CGGCCAGGAGTTTTCAGATCCCGTGGGCTCACGGATGAGGAGTACGATGAGTTCAAGAAGCGCCGCGAGTCTAAGGGCGGCAAGTACTCCGTTGATGACTACCTCGCTGACCGCGAGCGAGAAGAGGAACTCTTGGAGCGTGATGAGGAGGAGGCTGTTTTCGGCGACGGCCTTGGACTGAAGGCCACCCGTCGCTCTCGCAAGGCAGAGAGAGCTAGATTGGGTCTGGTCTCAGGTGGTGACATTCGTGCCCGCAAGCCAATTGACTGGAGCGTGGTTGGCCCCTCCTGGGCCGACGACGACCGCCAGGTCGATTATGGCGAGAAGATCAACTTTGAAGCCCCAGTYTCCATCAGGTCTCGAGTCGTGCAATTCGGCACAGGGTGGGGCTTCTGGGTTAGTGGCCATGTGTTCATCACCGCCAAACATGTGGCGCCACCCAAGGGCACAGAGGTGTTTGGGCGCAAGCCTGACGAGTTCACCGTCACCTCAAGTGGAGATTTCCTGAAATACCATTTCACCAGTGCTGTCAGGCCTGGCGTTCCTGCCATGGTCTTGGAGAACGGCTGCCAGGAAGGCGTCGTCGCCTCAGTCCTCGTTAAGAGGGCTTCTGGTGA
242
GATGCTCGCCCTGGCAGTTAGAATGGGCTCACAGGCTGCCATTAAGATCGGCAGCGCTGTGGTGCACGGGCAGACTGGTATGCTCCTGACTGGCTCTAATGCCAAAGCCCAGGACCTCGGGACCATTCCGGGTGACTGCGGATGCCCCTATGTCTATAAGAAGGGTAACACCTGGGTTGTGATAGGGGTGCACGTGGCGGCCACCAGATCTGGCAATACGGTGATTGCCGCCACCCATGGAGAGCCCACACTTGAGGCCTTGGAGTTCCAGGGCCCCCCCATGCTTCCCCGTCCATCTGGCACTTATGCAGGTCTCCCTATTGCCGATTACGGCGATGCCCCCCCCYTGAGCACCAAGACCATGTTCTGGCGCACATCGCCAGARAAGCTCCCTCCTGGAGCCTGGGAGCCAGCTTACCTCGGCTCCAAGGATGAGAGAGTGGATGGCCTTTCCTTCCACCAGTTCATGGGAGACCAGTTCAAGCCTTATTTTGAGCCCCGCGTTTTGTTCCCCCCCCAGGAAATTTTRGATGCGGTTTGKGATGCCWTCGAGAACCCCCTTGAGACCACCCTTGAGCCCCAGAAGCCATGGCCCTTTAAGAAAGCTTGTGAGAGTTTGGTTAAGACCCCCACCAGTGGGTACCCTTTTCCCAACCAAAAGATTAAGGACTGGCCAGGGACCGCCTTTTTSGGGGAATTCGGTGTTCAGGTTACCCACGCCAATACCATGTATGAGATGGGTAAGTCCATGCGGCCTGTTTACCCAGCTGCCTTCAAGGATGAACTGGTCAAGCCAGCCAAGTTTTCCAGGAAAATAAAGAAGAGACTTCTCTGGGGTTCTGACCCTGGCACCATGANTCGTGCGGCCCGCGCCTTCGGCCCTTTTTGTGATGCCCTGAAGGAAACTTGTATCTTCAACCCTATCAGGGTGGGTATGTCGATGAACGAAGATGGGCCCTTCATYTTCGCGAGGCATGCTAACTTTAGATACCACATGGATGCAGACTACACACGGTGGGATTCCACTCAGCAGAGGGCCATTTTGAAGCGCGCTGGCGACATCATGGTGCGTCTTTCCCCCGAACCAGACTTAGCTCGAGTGGTGATGGATGACCTTTTGGCCCCTTCTTTGCTAGATGTCGGCGACTATAAGATTGTCGTCGAAGAGGGGCTCCCATCTGGCTGCCCCTGCACCACACAGCTGAATAGCTTGGCCCACTGGATTCTGACCCTCTGTGCAATGGTTGAAGTGACCCGCATTGACCCCGACATTGTGATGCAAGAGTCTGAGTTCTCCTTTTATGGTGATGACGAGGTGGTTTCGACCAACCTCGAATTGGACATGACCAAATACACCATGGCCCTGAAGCGGTACGGTCTCCTCCCAACCCGTGCGGACAAGGAGGAGGGACCCCTGGAGCGTCGCCAAACGCTGCAGGGCATCTCCTTCTTGCGCCGCGCGATAGTTGGTGACCAGTTTGGTTGGTACGGCCGTCTTGACCGTGCCAGCATCGACCGCCAGCTCCTCTGGACCAAGGGACCCAACCACCAGAACCCCTTTGAAACCCTTCCTGGACACGCTCARAGACCCTCCCAATTGATGGCCCTGCTCGGTGAGGCTGCCATGCATGGTGAAAAGTATTATAGGACTGTTGCTTCCCGGGTCTCCAAGGAGGCAGCCCAGAGTGGGATAGAGATGGTGGTCCCACGCCACCGATCTGTTCTGCGCTGGGTGCGCTTCGGAACAATGGATGCTGAGACCCCGCAGRAACGCTCAGCAGTCTTTGTGAATGAGGATGAGTGATGGCGCAGCGCCAAAGGCCAACGGCCCTGAAGCCACCGGCCAGGATCTTGTTCCTACCGCCGTTGAACAGGCCGTCCCCATTCAGCCCGTGGCTGGTGCGTCTCTTGCCGCCCCCGCCGCTGGGCAAATTAACCAAATTGACCCATGGATCTTCCAAAATTTTGTCCAATGCCCCTTGGGTGAGTTTTCCATTTCACCTCGAAACACCCCAGGTGAAATACTGTTTGATCTGGCCCTCGGACCAGGGCTCAACCCGTACCTTGCCCATCTCTCAGCCATGTACACCGGCTGGGTTGGGAACATGGAGGTTCAGCTGGTCCTCGCCGGCAATGCCTTTACTGCTGGCAAGGTGGTTGTTGCCCTTGTACCACCCTATTTTCCCAAAGGGTCACTCACCACCGCYCAGATCACATGCTTCCCACATGTCATGTGCGATGTGCGCACCCTGGAGCCCATTCAATTGCCTCTTCTTGACGTGCGTCGAGTTCTTTGGCATGCTACCCAGGATCAGGAGGAATCTATGCGCCTGGTTTGCATGCTGTACACCCCACTCCGCACAAACAGCCCGGGTGATGAGTCTTTTGTGGTCTCTGGCCGCCTTCTATCTAAGCCGGCGGCTGATTTCAATTTTGTATACTTGACCCCTCCCATCGAGAGAACCATCTATCGGATGGTCGACCTGCCCGTGTTGCAGCCGCGGCTGTGCACGCACGCGCGTTGGCCTGCCCCGATTTATGGCCTCTTGGTGGACCCCTCCCTCCCATCCAACCCCCAGTGGCAGAATGGTAGAGTGCATGTTGATGGGACCCTTCTTGGTACAACACCCGTGTCTGGGTCCTGGGTCTCCTGCTTTGCAGCTGAGGCCGCCTACGAGTTCCAATCTGGGACTGGTGAGGTGGCAACCTTCACCCTGATTGAGCAGGACGGGTCCGCTTATGTCCCCGGCGACAGAGCGGCCCCCCTTGGATATCCCGATTTCTCCGGGCAACTGGAGATYGAGGTGCAGACAGAGACTACCAAGGCAGGAGACAAATTGAAGGTGACCACCTTTGAAATGATCCTTGGCCCCATCACCAATGTGGACCAGGCCCCCTACCAGGGTAGGGTGTACGCGAGCCTATCGGTCCCGGCCTCCCTAGACCTGGTGGATGGCAGAGTTAGGGCTGTCCCACGTTCCGTCTACAGCTTTAAGGACGTGGTGCCAGAGTATAATGATGGCTTACTTGTTCCCCTTGCCCCCCCTATTGGTCCCTTTCTCCCTGGTGAAGTCCTTTTGAGGTTCCGCACCTATATGCGCCAGGTTGACAGCTCTGACGCTGCGGCGGAGGCTATTGACTGTGCCCTTCCCCAAGAATTCATCTCGTGGTTCGCGAGCAATGCATTCACAGTGCAGTCTGAGGCTCTGCTTCTTAGGTACAGGAACACCCTAACGGGGCAGTTGCTGTTTGAGTGCAAGCTCTACAGCGATGGCTACATCGCCCTGTCTTATTCAGGATCAGGACCACTTACCTTCCCCACCGACGGCTTCTTTGAGGTCGTTAGCTGGGTCCCCCGCCTTTATCAATTGGCCTCTGTGGGAAGCTTGGCA

243
ACAGGCCGAACACTCAAACAATAATGGCTGGTGCTCTTTTTGGGGCGATTGGAGGTGGCTTGATGGGCATAATTGGCAATTCCATCTCAACTGTCCAAAAYCTTCAGGCWAATAAACAATTGGCTGCTCAGCAATTTGGTTATAATTCCTCCCTGCTTGCAACGCAAATTCAGGCCCAGAAGGATCTCACTTTGATGGGGCAGCAGTTCAACCAGCAGCTCCAAACCAACTCTTTCAAGCA TGACTTGGAAATGCTTGGCGCTCAGGTACAAGCCCAGGCGCAGGCYCAGGAGAACGCCATYAACATCAAAACGGCGCAGCTCCAAGCCGCAGGCTTTTCGAAGTCGGATGCCATTCGCCTTGCCTCAGGGCAGCAGCCCACGAGGTCCGTGGATTGGTCGGGGACGCGGTACTTTACCGCYAACCAACCAGTCACGGGCTTCTCGGGTGGCTTCACCCCGAGTTACACTCCTGGTAGGCAAATGACAGCCCGCCCTGTGGACACATCCTCTCTACCGGTCTCGAGCGGACGCTTGCCCTCCCTTCGTGGAGGTTCCTGGTCGCCACGTGATTACACGCCGGCGACTCAAGGCACCTACACGAACGGACGGTTCGTGTCCTTCCCAAAGA-TCGGGAGTAGCAGGGCATAGGTTGGAANAGAA
244
Sequence of MNV – Laboratory mouse F18: position 58-7229 GC---AAAACCAAAAAGGCTTCATCCAAAGCTAGTGTCTCCTTTGGAGCACCTAGCCTTCTCTCTTCGGAGAGTGAAGACGAAGTTAATTATATGACCCCTCCTGAGCAGGAAGCTCCGCCCGGCGCCCTCGCGGCCCTCCACGCAGAAGGGCCGCATGCCGGGCTCCCCGTGACGCGAAGTGACGCACGCGTGCTGATCTTCAATGAGTGGGAGGAGAGGAAAAAGTCTGAGCCGTGGCTACGGCTCGACATGTCTGACAAGGCCATCTTCCGCCGCTACCCCCACCTGCGGCCTAAGGAGGATAAGCCTGACGCGCCCTCCCACGCGGAGGACGCCATGGATGCTAAGGAGCCCGTGATCGGCTCCATCTTGGAGCAGGATGACCACAAATTCTATCATTACTCTGTTTACATTGGCAATGGTCTTGTGATGGGAGTCAACAACCCTGGTGCTGCGGTCTGCCAGGCAACAATTGATGTTGAGAAGCTACACCTTTGGTGGCGTCCCGTCTGGGAACCTCGCCAGCCTCTTGACTCGGCTGAGTTGAGAAAGTGCGTTGGCATGACAGTCCCCTACGTGGCCACCACCGTCAACTGCTACCAGGTGTGCTGCTGGATTGTTGGCATCAAGGATACTTGGCTGAAGAGGGCGAAGATCTCCAGGGACTCGGCCTTCTACAGCCCTGTCCAGGATTGGAATGTTGACCCCCAGGAGCCCCACATCCCCTCCAAGCTTAGGATGGTCTCAGATGGTATTCTGGTGGCTTTGTCAACGGTGATTGGTCGGCCGATCAAGAACCTGCTTGCCTCAGTCAAGCCGCTCAACATTCTCAACATCGTGCTGAGCTGTGATTGGACTTTCTCGGGCATTGTCAACGCCCTGATCCTCCTGGCTGAGCTCTTTGACATCTTCTGGACCCCCCCTGATGTGACCAACTGGATGATCTCCATCTTTGGGGAGTGGCAGGCCGAGGGGCCYTTCGACCTCGCCCTTGATGTTGTGCCCACCCTGCTGGGTGGGATTGGCATGGCCTTCGGCCTGACCTCTGAGACTATCGGGCGCAAGCTCGCCTCCACCAACTCGGCCCTGAAGGCCGCCCAAGAGATGGGCAAATTTGCCATTGAGGTTTTCAAGCAGATCATGGCCTGGATCTGGCCCTCTGAGGATCCGGTGCCGGCCCTCCTTTCCAACATGGAGCAGGCCGTTATCAAGAATGAGTGCCAGTTGGAGAACCAGCTCACGGCCATGCTGCGGGATCGCAATGCCGGGGCTGAATTCCTGAAATCCCTTGATGAGGAAGAGCAAGAGGTCCGCAAGATCGCGGCCAAGTGTGGTAACTCAGCCACTACTGGAACCACCAACGCTCTGCTGGCCAGGATCAGCATGGCCCGCGCGGCCTTTGAGAAGGCCCGTGCTGAGCAGACCTCTCGGGTTCGTCCCGTGGTGATTATGGTCTCAGGCAGGCCCGGGATCGGGAAGACCTGCTTTTGCCAGAACTTGGCCAAGAGGATTGCTGCGTCGCTAGGCGACGAGACCTCTGTCGGCATCATTCCACGTGCAGATGTCGACCACTGGGATGCTTATAAGGGAGCCAGAGTGGTCCTTTGGGATGACTTTGGCATGGACAATGTGGTGAAGGACGCACTGAGACTTCAGATGCTTGCTGACACATGCCCCGTGACACTCAACTGTGACAGGATTGAGAACAAAGGCAAGATGTTTGACTCCCAAGTCATCATCATTACCACAAATCAGCAAACCCCCGTGCCCCTGGATTATGTCAACTTGGAGGCAGTTTGCCGCCGCATAGACTTTCTAGTCTATGCTGAGAGCCCTGTTGTTGATGCCGCCCGGGTTAGGTCCCCTGGTGATGTGGCTGCGATCAAGGCCGCCATGAGGCCCGATTACAGTCACATCAATTTCATCTTGGCGCCACAGGGAGGCTTTGATCGCCAAGGCAACACCCCCTATGGCAAGGGCGTCACCAAGGTCATCGGCGCTACTGCCCTCTGCGCGAGAGCGGTCGCCCTTGTCCATGAGCGCCATGATGATTTCGGCCTCCAGAGCAAGGTCTATGACTTTGATGCTGGCAAGGTCACCGCCTTCAAGGCCATGGCGGCTGATGCCGGCATCCCGTGGTACAAAATGGCAGCAATTGGATACAAGGCCATGGGTTGCACCTGTGTGGAAGAGGCCATGAATCTCCTCAAGGATTATGAGGTGGCCCCGTGTCAAGTGATCTACAATGGCGCCACCTACAATGTGAGCTGCATCAAGGGTGCCCCGATGGTTGAAAAGACCAAAGAGCCTGATTTGCCCAAGACCCTTGTCAACTGTGTTAGGAGGATAAAGGAGGCCCGCCTCCGCTGCTACTGCAGGATGGCAACAGACGTCATCACGTCCATTCTGCAGGCAGCCGGGACGGCCTTTTCCATTTACCACCAGATTGAGAAGAAGTCCAGACCCTCCTTCTATTGGGACCATGGATACACCTACCGTGATGGTCCCGGAGCCTTTGATATCTTTGAGGATGAC---AATGATGGATGGTACCATTCTGAGAGCAAGAAGGGTAAGAACAAGAAAGGCCGTGGG---CGACCAGGAGTTTTCAAATCCCGTGGACTCACGGATGAGGAGTACGATGAGTTCAAGAAGCGCCGCGAGTCTAAGGGCGGCAAGTACTCCATTGATGACTACCTCGCTGACCGCGAGCGAGAAGAGGAACTCCTGGAGCGGGATGAGGAAGAGGCCGTCTTCGGTGATGGCTTCGGACTGAAGGCCACCCGTCGCTCTCGCAAGGCAGAGAGAGCTAGATTGGGCCTGGTCTCAGGTGGTGACATTCGTGCCCGCAAGCCGATCGACTGGAGTGTGGTTGGCCCCTCCTGGGCCGACGACGACCGCCAGGTTGACTACGGCGAGAAGATCAACTTTGAGGCCCCAGTTTCCATCTGGTCCCGTGTCGTGCAATTCGGCACAGGGTGGGGCTTYTGGGTCAGTAGCCACGTGTTCATCACCGCCAAGCACGTGGCACCATCCAAGGGCTCGGAGGTGTTTGGGCGCAAGCCCGAAGAGTTCACCGTCACCTCGAGTGGAGATTTCCTGAAGTACAACTTCACCAGCGCCGTCAGGCCTGACATCCCTGCCATGGTCTTGGAG
245
AACGGCTGCCAGGAAGGCGTCGTCGCCTCAGTCCTCGTCAAGAGGGCCTCTGGCGAGATGCTCGCCCTGGCAGTCAGGATGGGCTCACAGGCTGCCATCAAGATCGGCAGCGCCGTGGTGCACGGGCAGACCGGCATGCTCCTGACCGGCTCTAACGCCAAAGCCCAGGACCTCGGGACCATTCCGGGTGACTGTGGATGCCCCTATGTTTACAAGAAGGGTAACACCTGGGTTGTGATTGGGGTGCACGTGGCGGCCACCAGATCTGGCAATACGGTGATTGCCGCCACTCACGGAGAGCCCACACTTGAGGCCCTAGAGTTCCAGGGCCCCCCCATGCTCCCCCGTCCATCTGGCACTTATGCAGGCCTTCCCATTGCCGACTATGGTGATGCCCCCCCCCTGAGCACCAAGACCATGTTCTGGCGTACATCGCCAGAGAAGCTCCCCCCCGGAGCTTGGGAGCCAGCCTATCTTGGCTCCAAGGATGAGAGAGTGGAAGGCCCTTCCTTACAGCAGGTCATGCGAGATCAGCTCAAGCCCTACTCTGAGCCACGCGGCCTACTCCCCCCCCAGGAAATCTTGGATGCGGTTTGTGATGCCATCGAGAACCGCCTTGAGAACACCCTTGAGCCACAGAAGCCCTGGACCTTTAAGAAGGCTTGTGAGAGTTTGGATAAGAACACCAGCAGTGGGTACCCCTATCACAAACAAAAGAGTAAAGATTGGACAGGGACCGCCTTTGTGGGCGAGCTTGGCGATCAAGCCACCCATGCCAACAACATGTATGAGATGGGCAAGTCCATGCGGCCCGTCTATACAGCTGCCCTTAAGGATGAGCTGGTCAAGCCAGATAAGATCTATAAGAAAATAAAGAAGAGACTTCTCTGGGGTTCCGATCTTGGCACCATGATTCGCGCGGCTCGCGCCTTTGGCCCCTTTTGTGATGCCCTAAAGGAAACCTGCATTTTTAATCCTATCAGGGTGGGCATGTCAATGAATGAAGATGGACCCTTCATCTTCGCGAGGCACGCCAATTTCAGGTACCACATGGATGCAGACTACACAAGGTGGGATTCCACTCAGCAGAGGGCCATTTTGAAGCGCGCTGGTGACATCATGGTGCGCCTCTCCCCCGAGCCAGACTTGGCCCGAGTGGTAATGGATGACCTTCTGGCCCCTTCTTTGCTGGATGTCGGCGACTATAAGATCGTCGTCGAAGAGGGGCTCCCATCTGGCTGCCCCTGCACCACACAGCTGAATAGTATGGCCCACTGGATTTTGACCCTCTGTGCAATGGTTGAGGTGACCCGCATTGACCCTGACATTGTGATGCAAGAGTCTGAGTTCTCCTTTTATGGTGATGACGAGGTGGTTTCGACCAACCTCGAATTGGACATGACCAAATACACCATGGCCCTGAGGCGGTACGGTCTCCTCCCGACCCGTGCGGACAAGGAGGAAGGACCCCTGGAGCGTCGTCAAACGCTGCAGGGCATCTCCTTCTTGCGCCGTGCGATAGTTGGTGACCAGTTTGGTTGGTACGGTCGTCTCGACCGCGCCAGCATCGACCGCCAGCTCCTCTGGACCAAGGGACCCAATCACCAGAACCCCTTTGAAACCCTTCCTGGACACGCTCAGAGACCCTCCCAATTGATGGCCCTGCTCGGTGAGGCTGCCATGCACGGTGAAAAGTACTACAGGACTGTTGCTTCCCGGGTCTCCAAGGAGGCAGCCCATAGTGGGATAGAAATGGTGGTCCCACGCCACCGGTCTGTCCTGCGCTGGGTGCGCTTCGGAACAATGGATGCTGAGACCCCGCAGGAACGCTCAGCAGTCTTTGTGAATGAGGATGAGTGATGGCGCAGCGCCAAAAGCCAACGGCTCTGAAGCCAGCGGCCAGGATCTTGTTCCTACCGCCGTTGAACAGGCCGTCCCCATTCAGCCCGTGGCTGGTGCGTCTCTTGCCGCCCCCGCCGCCGGGCAAATCAACCAAATTGACCCATGGATCTTCCAAAATTTTGTCCAATGCCCCTTGGGTGAGTTTTCCATTTCACCTCGAAACACCCCAGGTGAAATACTGTTTGATCTGGCCCTCGGACCAGGGCTCAACCCATACCTTGCCCACCTCTCAGCCATGTACACCGGCTGGGTTGGGAACATGGAGGTTCAGCTGGTCCTCGCCGGCAATGCCTTTACTGCTGGCAAGGTGGTTGTTGCCCTTGTACCACCCTATTTTCCCAAAGGGTCACTCACCACTGCTCAGATCACATGCTTCCCACATGTCATGTGTGATGTGCGCACCCTGGAGCCCATTCAACTGCCTCTTCTTGACGTGCGTCGAGTTCTTTGGCATTCTACCCAGGATCAGGAGGAATCTATGCGCCTGGTTTGCATGCTGTACACGCCACTCCGCACAAACAGCCCGGGTGATGAGTCTTTTGTGGTCTCTGGCCGCCTTCTATCTAAGCCGGCGGCTGATTTCAATTTTGTATACCTGACCCCCCCCATTGAGAGAACTATCTATCGGATGGTCGACCTGCCCGTGTTGCAGCCGCGGCTGTGCACGCACGCACGTTGGCCTGCCCCGATCTATGGCCTCTTAGTGGACCCGTCCCTCCCATCCAACCCCCAGTGGCAGAATGGCAGAGTGCATGTTGATGGTACCCTTCTTGGCACAACACCTGTGTCCGGGTCCTGGGTCTCCTGCTTCGCAGCTGAAGCCGCCTACGAGTTCCAATCTGGGACYGGTGAGGTGGCAACCTTCACCCTGATTGAGCAGGATGGGTCCGCTTATGTCCCTGGCGACAGAGCGGCCCCCCTTGGGTATCCCGATTTCTCCGGGCAACTGGAGATTGAGGTGCAGACTGAGACCACCAAGACAGGAGACAAACTGAAGGTGACCACCTTTGAAATGATCCTTGGCCCCACCACCAATGTGGACCAGGCCCCCTACCAGGGTAGGGTGTACGCGAGCCTATCGGCCGCGGCCTCCTTAGACTTGGTGGATGGCAGGGTTAGAGCTGTCCCACGTTCCATCTATGGCTTTCAGGATGTGGTGCCGGAGTATAATGATGGCTTGCTTGTTCCCCTTGCCCCCCCCATTGGTCCCTTTCTCCCTGGTGAAGTCCTTCTGAGGTTCCGCACCTACATGCGCCAGATTGACAGCTCTGACGCTGCAGCGGAGGCTATTGACTGCGCCCTCCCTCAAGAGTTCATCTCGTGGTTTGCGAGCAATGCATTCACGGTGCAGTCTGAGGCTCTGCTTCTTAGGTACAGGAACACCCTGACGGGGCAGTTGCTGTTTGAGTGCAAGCTCTACAGCGATGGCTACATCGCCCTGTCTTATTCAGGATCAGGACCACTCACCTTCCCCACTGACGGCTTCTTT
246
GAGGTCGTTAGCTGGGTCCCCCGCCTTTTTCAATTGGCCTCTGTGGGAAGCTTGGCAACAGGCCGAACACTCAAACAATAATGGCTGGTGCTCTTTTTGGGGCGATTGGAGGTGGCCTGATGGGCATAATTGGCAATTCCATCTCAACTGTTCAGAATCTTCAGGCTAACAAACAATTGGCTGCCCAGCAATTTGGCTATAATTCCTCTTTGCTTGCAACGCAAATTCAGGCCCAGAAGGATCTCACTTTGATGGGGCAGCAGTTCAACCAGCAGCTCCAGACCAACTCTTTCAAGCA TGATTTGGAAATGCTTGGCGCTCAGGTGCAAGCCCAGGCGCAGGCTCAGGAGAACGCCATCAACATCAAAGCGGCGCAGCTCCAAGCCGCAGGCTTTTCAAAATCGGATGCCATTCGCCTTGCCTCAGGGCAGCAGCCCACGAGGTCCGTGGATTGGTCGGGGACGCGGTACTTTACCGCTAACCAACCGGTCACGGGCTTCTCGGGTGGCTTCACCCCAAGTTWCACTCCTGGTAGGCAAATGACAGCCCGCCCTGTGGACACATCCCCTCTGCCGATCTCGAGTGGACGCTTGCCCCCCCTTCGTGGAGGTTCCTGGTCC

247
Sequence of MNV – Laboratory mouse F22: position 58-7329 GC---AAAACCAAAAAGGCTTCATCCAAAGCTAGTGTCTCCTTTGGAGCACCTAGCCTTCTCTCTTCGGAGAGTGAAGACGAAGTTAAYTATATGACCCCTCCTGAGCAGGAAGCTCCGCCCGGCGCCCTCGCGGCCCTCCACGCAGAAGGGCCGCATGCCGGGCTCCCCGTGACGCGAAGTGACGCACGCGTGCTGATCTTCAATGAGTGGGAGGAGAGGAAAAAGTCTGAGCCGTGGCTACGGCTCGACATGTCTGACAAGGCCATCTTCCGCCGCTACCCCCACCTGCGGCCTAAGGAGGATAAGCCTGACGCGCCCTCCCACGCGGAGGACGCCATGGATGCCAAGGAGCCCGTGATCGGCTCCATCTTGGAGCAGGATGACCACAAATTCTATCATTACTCTGTTTACATTGGTAATGGTCTTGTGATGGGAGTCAACAACCCTGGCGCTGCGGTCTGCCAGGCAACAATTGATGTTGAGAAGCTACACCTTTGGTGGCGGCCCGTCTGGGAACCTCGCCAGCCTCTTGACTCGGCTGAGTTGAGAAAGTGCGTGGGCATGACAGTCCCCTACGTGGCCACCACCGTCAACTGCTACCAGGTGTGCTGCTGGATTGTTGGCATCAAGGATACTTGGCTGAAGAGGGCGAAGATCTCCAGGGACTCGCCCTTCTACAGCCCTGTCCAGGATTGGAATGTTGACCCCCAGGAGCCCCACATCCCCTCCAAGCTTAGGATGGTCTCAGATGGCATTCTGGTGGCTCTGTCAACGGTGATTGGTCGGCCGATCAAGAACCTGCTTGCCTCAGTCAAGCCGCTCAACATTCTCAACATCGTGCTGAGCTGTGATTGGACTTTCTCGGGCATCGTCAACGCCCTGATCCTCCTGGCTGAGCTCTTTGACATCTTCTGGACCCCCCCTGATGTGACCAACTGGATGATCTCCATCTTTGGGGAGTGGCAGGCCGAGGGGCCCTTCGACCTCGCCCTTGATGTTGTGCCCACCCTGCTGGGTGGGATTGGCATGGCCTTCGGCCTGACCTCTGAGACTATCGGGCGCAAGCTCGCCTCCACCAACTCGGCCCTGAAGGCCGCCCAAGAGATGGGCAAATTTGCCATTGAGGTTTTCAAGCAGATCATGGCCTGGATCTGGCCCTCTGAGGATCCGGTGCCGGCCCTCCTTTCCAACATGGAGCAGGCCGTTATCAAGAATGAGTGCCAGTTGGAGAACCAGCTCACGGCCATGTTGCGGGATCGCAATGCCGGGGCTGAATTCCTGAAGTCCCTTGATGAGGAAGAGCAAGAGGTCCGCAAGATCGCGGCCAAGTGTGGTAACTCAGCCACTACTGGAACCACCAACGCTCTGCTGGCTAGGATCAGCATGGCCCGCGCGGCCTTTGAGAAGGCCCGTGCTGAGCAGACCTCTCGGGTTCGTCCCGTGGTGATTATGGTCTCAGGCAGGCCCGGGATCGGGAAGACCTGCTTTTGCCAGAACTTGGCCAAGAGGATTGCTGCGTCGCTAGGCGACGAGACCTCTGTCGGCATCATACCACGTGCAGATGTCGACCACTGGGATGCCTATAAGGGAGCCAGAGTGGTCCTTTGGGATGACTTTGGCATGGACAATGTGGTGAAGGACGCACTGAGACTTCAGATGCTTGCTGACACATGCCCCGTGACACTCAACTGTGACAGGATTGAGAACAAAGGCAAGATGTTTGACTCCCAGGTCATCATCATTACCACAAATCAGCAAACCCCCGTGCCCCTGGATTATGTTAACTTGGAGGCAGTTTGCCGCCGCATAGACTTTCTAGTCTATGCTGAGAGCCCTGTTGTTGATGCCGCCCGGGTCAGGTCCCCTGGTGATGTGACCGCGATCAAGGCCGCCATGAGGCCCGATTACAGTCACATCAACTTCATCTTGGCGCCACAGGGAGGCTTTGATCGCCAAGGYAACACCCCCTATGGCAAGGGCGTYACCAAGATCATCGGCGCCACTGCCCTCTGCGCGAGAGCGGTCGCTCTTGTCCACGAGCGCCATGATGATTTCGGCCTCCAGAGCAAGGTCTATGATTTTGATGCTGGCAAGGTCACCGCCTTCAAGGCCATGGCGGCTGACGCCGGCATCCCGTGGTACAAAATGGCAGCAATTGGATACAAGGCCATGGGCTGCACCTGTGTGGAAGAGGCCATGAACCTCCTCAAGGATTATGAGGTGGCCCCGTGTCAAGTGATCTACAATGGTGCCACCTACAATGTGAGCTGCATCAAGGGTGCCCCGATGGTTGAAAAGACCAAAGAGCCTGATTTGCCCAAAACCCTTGTCAACTGTGTTAGGAGGATAAAGGAGGCCCGCCTCCGCTGCTACTGTAGGATGGCAACGGACGTCATCACGTCTATTCTGCAGGCGGCCGGGACGGCCTTCTCCATTTACCACCAGATTGAGAAGAAGTCCAGACCCTCCTTCTACTGGGACCATGGATACACCTACCGTGACGGTCCCGGAGCCTTTGACATCTTTGAGGATGAC---GATGATGGATGGTACCACTCTGAGAGCAAGAAGGGTAAGAACAAGAAGGGCCGTGGG---CGGCCAGGAGTTTTCAAGTCCCGTGGGCTCACTGATGAGGAGTACGATGAGTTCAAGAAGCGCCGCGAGTCTAAGGGCGGCAAGTACTCCATTGATGACTAYCTCGCTGACCGCGAGCGAGAAGAGGAGCTCCTGGAGCGGGATGAGGAGGAGGCCGTCTTCGGTGATGGCTTCGGACTGAAAGCCACCCGTCGCTCTCGCAAGGCAGAGAGAGCYAGATTGGGCCTGGTCTCAGGTGGTGACATTCGTGCCCGCAAGCCRATTGACTGGAGTGTGGTTGGCCCCTCCTGGGCCGACGAYGACCGCCAGGTCGATTACGGCGAGAAGATCAACTTTGAGGCCCCAGTTTCCATCTGGTCCCGTGTCGTGCAATTCGGCACAGGGTGGGGCTTCTGGGTCAGTAGTCACGTGTTCATTACCGCCAANCACGTGGCACCATCCAAGGGCTCGGAGGTGTTTGGGCGCAAGCCCGATGAGTTCACCGTCACCTCGAGTGGGGATTTCCTGAAGTACAACTTCACCAGTGCTGTTAGGCCTGACATTCCTGCCATGGTCTTGGAGA
248
ACGGCTGCCAGGAAGGCGTCGTCGCCTCAGTCCTCGTCAAGAGGGCCTCCGGCGAGATGCTCGCCCTGGCAGTCAGGATGGGCTCACAGGCTGCCATCAAGATCGGCAGCGCCGTGGTGCACGGGCAGACTGGTATGCTTCTGACCGGCTCTAACGCCAAAGCCCAGGACCTCGGGACTATTCCGGGTGACTGTGGATGCCCCTATGTTTACAAGAAGGGTAACACCTGGGTTGTGATTGGGGTGCACGTGGCGGCCACCAGATCTGGCAATACGGTGATTGCCGCCACTCATGGAGAGCCCACACTTGAGGCCCTAGAGTTCCAGGGCCCCCCCATGCTCCCCCGTCCATCTGGCACTTATGCAGGTCTTCCCATTGCCGACTATGGTGATGCCCCCCCCCTGAGCACCAAGACCATGTTCTGGCGTACATCGCCAGAGAAGCTCCCCCCCGGAGCTTGGGAGCCAGCCTATCTCGGCTCCAAGGATGAGAGAGTGGATGGCCCTTCCTTACAGCAGGTCATGCGAGATCAGCTCAAGCCCTACTCTGAGCCACGCGGCCTACTCCCCCCCCAGGAAATCTTGGATGCGGTTTGTGATGCCATCGAGAACCGCCTTGAGAACACCCTTGAGCCACAGAAGCCCTGGACCTTTAAGAAGGCTTGTGAGAGTTTGGATAAGAACACCAGCAGTGGGTATCCCTATCACAAACAAAAGAGTAAGGATTGGACAGGGACCGCCTTTGTTGGCGAGCTTGGCGATCAAGCCACCCATGCCAACAACATGTATGAGATGGGCAAGTCCATGCGGCCCGTCTATACAGCTGCCCTTAAGGATGAGCTGGTCAAGCCAGATAAGATCTATAAGAAAATAAAGAAGAGACTTCTCTGGGGTTCTGACCTTGGCACCATGATTCGCGCGGCTCGCGCCTTTGGCCCCTTTTGTGATGCCCTAAAGGAAACCTGCATTTTTAATCCTATCAGGGTGGGCATGTCAATGAATGAAGATGGACCTTTCATCTTCGCGAGGCACGCCAATTTCAGATACCACATGGATGCAGACTACACAAGGTGGGATTCCACTCAGCAGAGGGCCATTTTGAAGCGCGCTGGTGACATCATGGTGCGCCTCTCCCCCGAGCCAGACTTGGCCCGAGTGGTAATGGATGATCTTCTGGCCCCTTCTTTGCTGGATGTCGGCGACTATAAGATCGTCGTCGAAGAGGGACTCCCATCTGGCTGCCCCTGCACCACGCAGCTGAATAGTATGGCCCACTGGATCTTGACCCTCTGTGCAATGGTTGAAGTGACCCGCATTGATCCTGACATTGTGATGCAAGAGTCTGAGTTCTCCTTTTATGGTGATGACGAGGTGGTTTCGACCAACCTCGAATTGGACATGACCAAATACACCATGGCCCTGAGGCGGTACGGTCTCCTCCCGACCCGTGCGGACAAGGAGGAAGGACCCCTGGAGCGTCGTCAAACGCTGCAGGGCATCTCCTTCTTGCGTCGTGCGATAGTTGGTGACCAGTTTGGTTGGTACGGTCGTCTCGACCGCGCCAGCATCGACCGCCAGCTTCTCTGGACCAAGGGACCCAATCACCAGAACCCCTTTGAAACCCTTCCTGGACATGCTCAGAGACCCTCCCAATTGATGGCCCTGCTCGGTGAGGCTGCCATGCATGGTGAAAAGTACTACAGGACTGTTGCTTCCCGGGTCTCCAAGGAGGCAGCCCATAGTGGGATAGAAATGGTGGTCCCACGCCACCGGTCTGTCCTGCGCTGGGTGCGCTTCGGAACAATGGATGCTGAGACCCCGCAGGAACGCTCAGCAGTCTTTGTGAATGAGGATGAGTGATGGCGCAGCGCCAAAAGCCAACGGCTCTGAAGCCAGCGGCCAGGATCTTGTTCCTACCGCCGTTGAACAGGCCGTCCCCATTCAGCCCGTGGCTGGTGCGTCTCTTGCCGCCCCCGCCGCCGGGCAAATCAACCAAATTGACCCATGGATCTTCCAAAATTTTGTCCAATGCCCCTTGGGTGAGTTTTCCATTTCACCTCGAAACACCCCAGGTGAAATACTGTTTGATCTGGCCCTCGGACCAGGGCTCAACCCATACCTTGCCCACCTCTCAGCCATGTACACCGGCTGGGTTGGGAACATGGAGGTTCAGCTGGTCCTCGCCGGCAATGCCTTTACTGCTGGCAAGGTGGTTGTTGCCCTTGTACCACCCTATTTTCCCAAAGGGTCACTCACCACTGCTCAGATCACATGCTTCCCACATGTCATGTGTGATGTGCGCACCCTGGAGCCCATTCAACTGCCTCTTCTTGACGTGCGTCGAGTTCTTTGGCATGCTACCCAGGATCAGGAGGAATCTATGCGCCTGGTTTGCATGCTGTACACGCCACTCCGCACAAACAGCCCGGGTGATGAGTCTTTTGTGGTCTCTGGCCGCCTTCTATCTAAGCCGGCGGCTGATTTCAATTTTGTATACCTGACCCCTCCCATCGAGAGAACCATCTATCGGATGGTCGACCTGCCCGTGTTGCAGCCGCGGCTGTGCACGCACGCACGTTGGCCTGCCCCGGTGTATGGTCTCTTGGTGGACCCGTCCCTCCCATCCAACCCCCAGTGGCAGAATGGTAGAGTGCATGTTGATGGAACCCTTCTTGGTACAACACCTGTGTCTGGGTCCTGGGTCTCCTGCTTTGCAGCTGAGGCCGCCTACGAGTTCCAATCTGGGACTGGTGAGGTGGCAACCTTCACCCTGATTGAACAGGACGGGTCCGCTTATGTCCCTGGCGACAGAGCGGCCCCCCTTGGATATCCCGACTTCTCCGGGCAACTGGAGATTGAGGTGCAGACTGAGACTACCAAGGCAGGAGACAAACTGAAGGTGACCACCTTTGAAATGATCCTCGGCCCCACCACCAATGTGGATCAGGCCCCCTACCAGGGTAGGGTGCACGCGAGCACATCGGTCACGGCCTCCTTAAACCTGGTGGATGGCAGGGTTAGGGCTGTCCCACGTTCCATCTACAGCTTTCAGGATGTGGTGCCAGAGTATAATGATGGTCTACTTGTTCCCCTTGCCCCCCCCATTGGTCCCTTTCTCCCTGGTGAAGTTCTTCTGAGGTTCCGCACCTACATGCGCCAGATTGACAGCTCTGACGCCGCGGCGGAAGCTATCGACTGTGCCCTCCCTCAAGAATTCATCTCGTGGTTCGCGAGCAACGCATTCACGGTGCAGTCTGAGGCTCTGCTTCTTAGGTACAGGAACACCCTGACGGGGCAGTTGCTGTTTGAGTGCAAGCTCTACAGCGAGGGTTACATCGCTCTGTCCTACTCAGGGTCAGGACCACTCACCTTCCCTACTGACGGCTTCTTTGA
249
GGTCGTTAGTTGGGTCCCCCGCCTTTATCAATTGGCCTCTGTGGGAAGCTTGGCAACAGGCCGAACACTCAAACAATAATGGCTGGTGCTCTTTTTGGGGCGATTGGAGGTGGCTTGATGGGCATAATTGGCAATTCCATCTCAACTGTCCAAAATCTTCAGGCTAATAAGCAATTGGCTGCTCAGCAATTTGGCTATAATTCCTCTCTGCTTGCAACGCAAATTCAGGCCCAGAAGGATCTCACTTTGATGGGGCAGCAATTCAATCAGCAGCTCCAAACCAACTCTTTCAAGCA TGACTTGGAAATGCTTGGCGCTCAGGTGCAAGCCCAGGCGCAGGCCCAGGAGAACGCCATCAACATCAGGACGGCGCAGCTCCAAGCCGCAGGCTTTTCAAAGTCGGACGCCATTCGCCTTGCCTCAGGGCAGCAGCCCACGAGGTCCGTGGACTGGTCGGGGACGCGGTATTTTACCGCTAACCAACCGGTCACGGGCTTCTCGGGTGGCTTCACCCCAAGTTACACTCCTGGTAGGCAAATGACGGCCCGCCCTGTGGACACATCCCCTCTACCGGTCTCGGGTGGACGCTTGCCCTCCCTTCGTGGAGGTTCCTGGTCGCCACGTGACTACACGCCGGCGACTCAAGGCACCTACACGAACGGACGGTTCGTGTCTTTCCCAAAGA-TCGGGAGCAGCAGGGCATAGTTGGGAAGAGAA
250
Sequence of MNV – Pet shop mouse 1: position 70-7328 AAAAGGCTTCATCTAGAGCTAGTGTCTCCTTTGGAGCACCTAGCCTACYCTCTTYGGARAGTGAAGATGAAGTTAACTATATGACCCCTCCTGAGCAGGAAGCTCAGCCCGGCACCCTCGCGGCCCTTCATGCTGACGGGCCGCACGCTGGGCTCCCCGTGACCCGAAGTGATGCACGCGTGCTGATCTTCAATGACTGGGAGGAGAGGAAGAAGTCCGAGCCGTGGCTACGGCTGGACATGTCTGACAAGGCCATCTTCCGCCGCTACCCCCATCTGCGGCCCAAGGAAGACAAGGCCGACGCGCCCTCCCACGCGGAGGACGCCATGGATGCAAGAGAGCCCGTGGTGGGATCTATTCTTGAGCAGGATGATCACAAGTTCTACCACTACTCTGTCTACATCGGCAACGGTATGGTGATGGGCGTTAACAACCCCGGCGCCGCCGTCTGCCAGGCTGTGATTGATGTGGAGAAGCTCCACCTGTGGTGGAGGCCAGTTTGGGAGCCCCGCCAGCCCCTCGACCCGGCTGAGTTGAGGAAGTGTGTTGGCATGACTGTCCCCTACGTGGCAACCACCGTCAATTGCTACCAAGTCTGCTGCTGGATTGTTGGGATCAAGGACACCTGGCTGAAGAGGGCGAAGATCTCTAGGGACTCGCCTTTCTACAGCCCSGTCCAGGATTGGAACACTGACCCCCAGGAGCCCTTCATCCCATCCAAGCTTAGGATGGTCTCTGACGGCATCTTGGTAGCTCTCTCAACGGTGATTGGTCGGCCGATCAAGAACCTACTGGCATCTGTGAAGCCGCTCAACATTCTGAATATTGTGCTGAGCTGCGACTGGACTTTTTCGGGCATTGTCAACGCCCTGATTCTCCTGGCTGAGCTCTTTGATATCTTCTGGACCCCCCCTGATGTGACTAACTGGATGATTTCCATCTTTGGAGAGTGGCAGGCCGAGGGGCCCTTCGACCTTGCCCTTGATGTTGTGCCCACCCTGCTGGGCGGGATTGGGATGGCCTTTGGTCTAACCTCTGAGACCATTGGACGCAAGCTGGCCTCCACCAACTCGGCTCTGAAAGCCGCCCAAGAGATGGGCAAATTCGCCATCGAGGTTTTCAAGCAGATCATGGCCTGGATTTGGCCCTCTGAGGACCCAGTACCGGCCCTCCTGTCCAACATGGAGCAGGCCGTTATCAAGAATGAGTGCCAACTGGAGAACCAGCTCACAACCATGTTGCGGGACCGCAACGCTGGAGCTGAATTCCTGAAAGCCCTGGATGAAGAGGAGCAAGAGGTCCGCAAGATCGCGGCCAAGTGTGGGAATTCTGCCACCACGGGCACAACCAACGCCCTGCTGGCTAGGATTAGCATGGCTCGCGCGGCCTTCGAGAAGGCTCGTGCTGAGCAGACCTCCCGGGTTCGCCCCGTGGTGATTATGGTCTCTGGCAGGCCCGGGATCGGGAAAACCTGCTTCTGTCAAAACCTGGCAAAGAGGATAGCCGCCTCCCTTGGAGACGAGACTTCAGTCGGCATTATACCACGTGCCGATGTGGACCACTGGGACGCCTACAAGGGCGCCAGAGTCGTTCTCTGGGACGATTTTGGCATGGATAATGTRGTGAAGGATGCACTGCGGCTGCAGATGCTCGCTGACACCTGCCCCGTCACGCTCAACTGTGACAGAATTGAGAACAAGGGRARRATGTTTGACTCCCAGGTCATCATCATCACCACCAACCAACAAACCCCAGTGCCCCTGGATTATGTCAACTTGGAGGCAGTCTGCCGTCGCATAGATTTCCTGGTCTATGCTGAGAGCCCCGTGGTTGATGCTGCCCGGGCCCGGTCCCCAGGTGACGTGGCCGCCGTCAAGGCCGCTATGAGACCGGACTACAGCCACATCAAYTTCATCCTAGCACCACAGGGCGGCTTTGACCGGCAGGGTAATACCCCTTACGGCAAGGGCGTCACTAAGATCATTGGCGCCACTGCGCTCTGCGCGAGGGCAGTCGCCCTTGTCCATGAGCGCCATGATGATTTTGGCCTCCAGAATAAGGTCTATGACTTTGATGCTGGCAAAGTGACTGCCTTCAAGGCCATGGCGGCTGATGCCGGCATCCCCTGGTATAAGATGGCAGCAATTGGCTACANGGCTATGGGCTGCACTTGTGTGGAGGAAGCCATGAACTTGCTCAAGGACTATGAGGTAGCCCCGTGCCAGGTGATCTACAATGGGGCTACCTACAATGTCAGCTGCATCAAGGGGGCCCCCATGGTTGAGAAGATCAAGGAGCCTGAGCTGCCCAAGACACTGGTCAACTGTGTTAGGAGGATCAAGGAGGCCCGCCTCCGCTGCTACTGTAGGATGGCCACAGATGTCATCACCTCCATCTTGCAGGCAGCCGGAACAGCCTTCTCCATCTACCACCAAATTGAGAAGAAATCCAGACCCTCYTTTTACTGGGACCACGGATACACCTACCGTGATGGTCCCGGKGCCTTTGACATCTTTGAGGATGAC---AATGACGGGTGGTACCACCCTGAGGGTAAGAAGGGCAAGAGCAAGAGAGGCCGCGGC---CGCCCTGGAGTCTTCAAGTCCCGTGGGCTCACGGACGAGGAGTATGATGAATTCAAGAAGCGCCGCGAGTCCAAGGGCGGCAAGTACTCCATTGATGACTACCTCGCTGATCGCGAGCGAGAAGAAGAGCTCCTGGAGCGTGATGAGGAAGAGGCCATCTTCGGGGATGGCTTTGGTCTGAAAGCCACACGCCGCTCCCGCAAAGCAGAGAGGGCCAGGCTTGGCCTAGTCTCGGGCGGTGACATCCGTGCCCGTAAACCAATCGACTGGAACGTGGTTGGCCCTTCCTGGGCTGACGACGACCGCCAGGTCGACTACAGTGAGAAACTCAGTTTTGAGGCCCCGGTTTCCATCTGGTCCCGTGTTGTCCAGTTCGGTACGGGGTGGGGCTTTTGGGTCAGCGGGCATGTTTTCATCACCGCCAAGCATGTGGCACCACCCAAAGGCACGGAGGTCTTCGGGCGCAAGCCTGAAGAGTTCACCGTCACCTCCAGTGGAGACTTCCTGAAGTACCATTTCACCAGCGCCGTCAGGCCCGACATCCCCGCCATGGTTCTGGAGAATGGCTGTCAGGAGGGCGTTGTTGCCTCAGTCCTCGTCAAGAGGGCCTCTGGCGA
251
GATGCTTGCCCTGGCAGTCAGGATGGGCTCGCAAGCTGCCATCAAGATCGGCAATGCTGTGGTGCACGGGCAGACTGGCATGCTTTTAACCGGCTCCAATGCTAAAGCCCAGGACCTCGGGACCATCCCAGGTGATTGTGGCTGCCCCTATGTCTACAAGAAAGGTAACACCTGGGTCGTGATTGGGGTGCACGTGGCGGCCACTAGATCTGGCAACACAGTGATCGCCGCCACCCATGGAGAGCCCACACTTGAAGCCCTGGAATTCCAGGGTCCCCCCATGCTTCCCCGCCCCTCTGGCACCTATGCGGGCCTCCCCATTGCCGACTACGGCGACGCCCCTCCCCTGAGCACCAAAACCATGTTCTGGCGCACTTCGCCAGAGAAGCTTCCCCCCGGGGCGTGGGAGCCAGCCTATCTTGGTTCCAAGGATGAGAGAGTGGACGGCCCCTCCTTGCAGCAGGTCATGCGAGATCAGCTCAAGCCCTACTCAGAGCCACGTGGCCTACTCCCTCCTCAGGAAATTCTGGATGCGGTTTGCGATGCCATCGAGAACCGTCTTGAGAACACCCTTGAACCGCAGAAGCCCTGGACATTCAAGAAGGCCTGTGAGAGCTTGGACAAGAACACAAGCAGTGGGTACCCTTACCACAAGCAGAAGAGCAAGGACTGGACAGGAACCGCCTTCGTTGGCGAGCTCGGTGACCAGGCCACCCATGCTAACAACATGTATGAGATGGGCAAATCCATGCGGCCTGTCTACACAGCTGCCCTCAAGGATGAGCTAGTCAAGCCAGACAAAATTTACAAGAAGATAAAGAAAAGACTTCTCTGGGG TTCTGATCTTGGCACCATGATTCGCGCTGCCCGCGCCTTTGGCCCCTTCTGTGAAGCTCTCAAAGAGACCTGCATTTTCAACCCCATCAGAGTGGGTATGTCGATGAACGAAGATGGACCCTTCATCTTCGCGAGGCATGCCAATTTYAGATATCACATGGATGCAGATTACTCCAGGTGGGACTCCACTCAGCAAAGGGCCATCTTGAAGCGCGCCGGTGACATCATGGTGCGCCTTTCCCCTGAGCCAGAGCTGGCACGGGTGGTGATGGATGACCTCCTGGCCCCTTCATTGCTGGACGTCGGCGACTACAAGATCGTCGTCGAAGAAGGACTTCCATCTGGCTGCCCCTGCACCACGCAGTTGAACAGTTTGGCCCACTGGATTCTGACCCTCTGTGCAATGGTTGAAGTAACCCGGATTGACCCTGATATTGTGATGCAAGAGTCTGAGTTCTCCTTCTATGGTGATGATGAGGTAGTCTCGACCAACCTCGAATTGGACATGACCAAATACACCATGGCCCTGAGGCGGTACGGTCTTTTACCGACGCGTGCGGACAAGGAGGAGGGACCCCTGGAGCGCCGACAGACGCTGCAGGGCATTTCCTTCTTGCGCCGTGCGATAATCGGTGACCAGTTTGGCTGGTATGGCCGCCTCGACCGGGCCAGCATTGACCGCCAGCTTCTTTGGACTAAAGGACCCAACCACCAGAATCCCTTTGAGACTCTTCCAGGACATGCTCAGAGACCCTCCCAATTGATGGCCCTGCTCGGTGAGGCTGCCATGCATGGTGAAAAGTATTACAGGACTGTGGCTTCCCGGGTCTCCAAGGAGGCCGCCCATAGTGGGATAGAAATGGTGGTCCCACGCCACCGGTCTGTCCTGCGCTGGGTGCGCTTTGGAACAATGGATGCTGAGACCCCGCAGGAACGCTCAGCAGTCTTTGTGAATGAGGATGAGTGATGGCGCAGCGCCAAAAGCCAACGGCTCTGAAGCCAGCGGCCAGGATCTTGTTCCTACCGCCGTTGAACAGGCCGTCCCCATTCAGCCCGTGGCTGGCGCGGCTCTTGCCGCCCCCGCCGCCGGGCAAATCAACCAAATTGACCCCTGGATCTTCCAAAATTTTGTCCAATGCCCCCTTGGTGAGTTTTCCATTTCACCTCGAAACACCCCAGGTGAAATATTGTTTGATTTGGCCCTCGGGCCAGGGCTCAACCCCTACCTTGCCCACCTCTCAGCCATGTACACCGGCTGGGTTGGGAACATGGAGGTTCAGCTGGTCCTCGCCGGCAATGCCTTTACTGCTGGCAAGGTGGTTGTTGCCSTTGTACCACCCTAWTTTYCMAAAGGGTCACTCACCACTGCTCAGATCACATGCTTCCCACATGTCATGTGTGATGTGCGCACCCTGGAGCCCATTCAACTCCCTCTTCTTGACGTGCGTCGAGTTCTTTGGCATGCTACCCAGGATCAGGAGGAATCTATGCGCCTGGTCTGCATGCTGTACACGCCACTCCGCACAAACAGCCCGGGTGATGAGTCTTTTGTGGTCTCTGGCCGCCTTCTTTCTAAGCCGGCRGCTGATTTCAACTTTGTATACCTGACCCCCCCCATTGAGAGAACCATTTACCGGATGGTCGACTTGCCCGTGTTGCAGCCGCGGCTGTGCACGCACGCTCGTTGGCCGGCCCCGGTCTATGGCCTCCTGGTAGACCCATCCCTTCCATCTAACCCCCAATGGCAGAATGGCAGAGTGCATGTTGATGGGACTCTTCTTGGTACAACACCTGTTTCTGGTTCTTGGGTTTCCTGCTTTGCWGCTGAGGCCGCCTACGAGTTCCAATCTGGGAYTGGTGAGGTGGCGACTTTCACCATGATTGAGCAGGACGGGTCCGCTTATGTYCCCGGCGACAGGGCGGCCCCCCTTGGGTACCCCGAYTACTCCGGGCAACTGGAGATCGAGGTGCAGACTGAGACCACCAAGACGGGTGATAAGCTCAAGGTGACCACCTTTGAGATGACCCTGGGACCCACCACTAACGTGGACCAGGCCCCCTACCAGGGTAGGGCGTACGCGAGCCTGGCGGCTGCAGCCTCGCTCGACCTGGTGGATGGGAGGGTCAGGGCAGTCCCGCGCTCCATCTATTCTTTCCAGGATGTGCTCCCAGAATACAATGATGGTCTTTTGGTTCCCCTCGCCCCACCACTAGGTCCCTTCCTTCCCGGTGAGGTTTTGTTGAGGTTCCGTACCTACATGCGCCAGCTCGACACCGCTGACGCCACAGCGCAGCCGATCGACTGTGCCTTGCCTCAGGAGTTCATCTCCTGGTTTGCAAGCAACAACTTCACAGTCCAGTCGGACGCGCTCCTGGTTAGGTACCGGAATACCTTGACCGGCCAGCTCCTGTTTGAGGCTAAGCTTTATAGCGAAGGCTACATTGCTGTGTCTTATTCAGGGTCCGGTCCCCTCACCTTTCCCACTGACGGCTTCTTCGAGGTTGTCAGCTGGGTCCCCCGCCTCTTTCAATTGGCCTCTGTGGGAAGCTTGGCA
252
ACAGGCCGAACACTCAAACAATAATGGCTGGTGCACTTTTTGGTGCGATTGGAGGTGGCCTGATGGGCATAATTGGCAATTCCATCTCAACAGTCCAGAACCTTCAGGCAAATAAACAATTGGCTGCACAACAATTTGGCTACAATTCCTCTTTGCTTGCAACGCAAATTCAGGCCCAGAAGGATCTCACGCTGATGGGGCAGCAATTCAACCAGCAGCTCCAAGCCAACTCTTTCAAGCA CGACCTTGAGATGCTTGGCGCCCAGGTGCAAGCCCAGGCGCAGGCCCAGGAGAATGCCATCAACATCAAGTCGGCACAACTCCAGGCTGCAGGCTATTCAAGGTCCGACGCCATTCGCCTGGCCTCGGGGCAGCAGCCGACGAGGGCCGTTGACTGGTCGGGGACGCGGTACTATACCGCCAACCAGCCGGTTACGGGCTTCTCGGGTGGCTTCACCCCAAGCTACACTTCAGGTAGGCAAATGGCAGTCCGCCCTGTGGACACATCCCCTCTGCCGGTCTCGGGTGGACGCATGCCGTCCCTTCGTGGAGGTTCCTGGTCTCCGCGTGATTACACGCCGCAGACACAAGGCACCTACACGAATGGGCGGTTCGTGTCCTTCCCAAAGA-TCGGGAGTAGCAGGGCATAGGTTGGAAGANA
253
Sequence of MNV – Wild rodent (Apodemus sylvaticus) 960: position 1-7321 GTGAAATGAGGATGGCAACGCCATCTTCTGCGCCCTCCGCGCGCAAAGCGGAAAAGCGC---AAAAATAANAAGGCTTCGTCTCCTGTTGGTGTTTCTTTTGGAGCACCAGCACCGCTCTCATCTGAGAGCGAAGACGAAGTTTGTTATATGACCCCTCCTGAGCAAGAAGCTCAGCCTGATGGGCTGGCCGCCGTTCATCTTAGCGGCCCTAACGTTGGGCTCCCCGTGACCCGTAGCGACGCACGCGTGCTGGTCTACAAAGAGTGGGAGGAGAGGAAGAAGAGCGAGCCGTGGCTGCGGCTCGATTTGTCTGACACCTGCATCTATCGGCGCTACCCACATCTGCGCCCCCAG------TGTGATGCTGAGGCCGCCCCCTCTGAAGTGGCGACCATTGCCCACGAGCTCAAGGTTGGATCCATTCTTGAGNAGGATGACCACAAGTTTTACCATTATTCTGTGTATCTCGGTAATGGGCAAGTGCTTGGGGTCAACAACCCTGGAGCTGCCGTGTGCCAAGCTGTCATCGATGCCGAGAAACTCCACCTGTGGTGGCGGGTGGACTGGGAACCGCAGAACCCTATGGATGCCTCAGAGCTCAGGAAGTGTGTGGGCATGACTGTCCCATACGTGGCCACCACGGTTAATTGCTATCAGGTCTGTTGCTGGATTGTGGGGCTGAAGGATTCCTGGCTTAAGCGTGCCAAGGTCACTCGCAACTCACCCTTCTTCAGCCCTGTGCAGGATTGGAATAAGGACCCCCAGGAGCCGTTTGTGCCTTCCAAACTCCGGGTGGTTTCTGATGGCATCCTGGTAGCTATGGCCACAGTGGTTAGCCGACCTGTTAAGAACCTGTTGGCTGCTGTCAAGCCCTTGAATATTTTGAACATCGTCCTGAGTTGTGATTGGACCTTTGGTGGCATAGTTAATGCTCTGATCCTTCTGGCTGAACTTTTTGATATCTTCTGGACCCCCCCAGACGTCACTAACTGGCTGATCTCGGTCTTTGGGGAGTGGCAGGCGGAGGGCCCTCTTGATCTTGCCTTAGAAGTTGTGCCCACTCTTTTGGGTGGTTTGGGGATGGCCCTTGGCATGACTTCTGAGACTCTTGGGAGGAAGCTGGCGTCCACCAACTCCGCCCTCAAGGCCGCTCAAGACATGGGGAAGTTCGCCATAGAAGTCTTCAGACAGATAATGGCTTGGATCTGGCCTAAGGAGGACCCCACACCCGCCCTGATCGCTAACATGGAGCAGGCGGTTATTAAGAGTGAATGCCAGCTCGAGAACCAACTCACCACCATGCTTCGAGACCGCGCTGCCGGGACAGACTTCCTTAAAGCCCTTGATGATGAAGAGCTTGAGGTTAGGAAGATTGCCGCCAAGTGCGGTAATAGCGCCACCACTGGCACCACCAACGCCCTCTTGTCGAGGATCAGCATGGCTAGGGCTGCCTTTGAGAAGGCGCGTTCTGAGCAGAGCTCGCGGGTGCGCCCAGTCGTCATCATGGTGTCGGGTCGCCCTGGCATTGGCAAGACTTGGTTTTGCCAGAATCTGGCCAAGAAGATTGCTGCATCTCTCGGGGACTCCAATTCAGTTGGCATTGTGCCTCGAGCCGATGTCGATCACTGGGACACTTATAAGGGGTCCAGAGTTGTTGTATGGGATGATTTTGGCATGGACAATGTGGTGAAGGATGCCTTGAGACTCCAAATGTTGGCTGACACTTGCCCGGTCACACTGAACTGCGATCGCATTGAGAACAAGGGCAAGATGTTTGATTCTCAAGTCATTATCATCACTACCAACCAGCAGACCCCTGTGCCCTTGGATTATGTCAACCTAGAGGCAGTGTGCCGGCGTATTGACTTTTTGGTCTACGCTGAGAGCCCTGCCGTGGATGCTGTTAGAGCTCAGTGCCCTGGTGACACTGCTGCAGTAAAGGCTGTGATGAAACAAGATTATAGCCATATCAACTTCATCCTGGCCCCACAGGGTGGTTTTGACCGACAAGGAAACACCCCCTATGGCAAAGGCCCCACTAAGAACATTGGGGCGGTTGCCCTCTGTGCCCGGGCCGTGGCGCTGGTCCATGAGCGCCAAGATGATTATGGCTTGCAGTCTAAGACCTATGATTTTGATGCTGGGAAAGTCACGGCTTTCAAGGCTATGGCTACTGATGCTGGCATCCCTTGGTATAAGATGGCAACCATCGGCTACAAGGCAATGGCCTGTACCTGTATTGAGGAAGCTGTGCACCTCCTCAAGGATTATGAAGTCCCTCCCTGCCAAGTTATCTACAATGGGGCGACATACAGCGTTAGCTGCATTAAGGGAGCACCCATGATTGAGAAGACCAAGGAACCTGAGGTTGTCAAGACCCTCGCTAATTGTGTCCGGAGAATCAAGGAGGCCCGTCTCAAGTGCTACTGTCGAATGGCCACTGATGTGGTGTCAACTGTCCTCCAAGCCGCCGGAGCAGCCTTCTCGATATACCACCAAATCGAGAAGAAGACTCGCCCCTCTTATTACTGGGACCACGGCTATACATACCGCGATGTGCCCGGGGCCTTTGACATCTATGATGATGGAGAAGAGGACGGGTGGTACATCTCAGAGAGCAAGAAGGGTAAGAACAAGAAGGGTCGTGGCGCCCGCCCTGGTGTCTTCAGGACTCGTGGGCTCACTGATGAGGAGTATGACGAGTTCAAGAAGCGCCGAGAATCAAAGGGTGGAAAGYACACGATTGATGATTACCTTGCAGACCGAGAGCGTGAGGAAGAGATAGAAGAGAGAGACCAGTTTGAAGAAATGTTTGGTGACGGCCCCAAGCAAAGGGCGACGCGTCGCTCAAGGAAGGCCGAAAGGGCTCGGCTGGGTCTTGTGGCGGGCGGTGACATTCGTGCTCGCAAACCAATTGACTGGAATGTCGTTGGCCCCTCCTGGGCAGATGATAACCGGCAGGTTGACTATAGTGCCAAACTTGATTTCGAGGCGCCTGTTTCAATCTGGTCACGTGTTGTCCAGTTTGGCGCTGGATGGGGCTTCTGGGTGAGTGGTAATGTGTTCATAACAGCTAAACACGTTGCACCACCCAAGGGCAGTGAGATCTTCGGTCGCCA
254
GCCGAGCGACTTCACAGTCACCTCTAGTGGAGATTTTCTGAAATACCATTTCACCACAGCTGTCCGCCCCGACATCCCGGCCATGGTGTTGGAGAGTGGGTGTCAGGAGGGTGTTGTTGCCTCGGTCCTGGTGAAGCGCGCCTCTGGAGAGATGCTTGCTTTGGCTGTCAGGATGGGTGCTCAGGCCGCTGTCAAGATCGGTCATTCTGTTGTGCATGGTCAGACAGGTATGTTACTGACCGGCTCCAATGCAAAGGCCCAAGACCTTGGCACCATCCTGGATGACTGTGGGTGCCCTTATGTTTACAAGAAGGGGAACACTTGGGTTGTGATTGGGGTTCACGTGGCTGCGACGCGCTCTGGGAACACAGTGATTGCAGCCACTCAGGGTGAACCCACACTTGAGGCACTAGAGCTTCAAGGTCCACCTGTGCCC---CGTCCATCGGGCACCTATGCGGGCCTTCCCATTGCCGACTTTGGAGACGCTCCACCGCTCAGCACTAAGACTATGTTCTGGCGCACCTCTCCAGAAAAGCTTCCCCCCGGGGCCTGGGAGCCTGCATATCTCGGCTCCAAGGATGAGAGGGTGGAGGGCCCTTCCCTGCAACAGGTGATGAGAGACCAATTAAAACCTTTTTCTGAGCCGCGTGGCTCACTCCCCCCCTTGGAGGTGCTCGACGCAGTCTGTGATGCTATTGAGCATAGGCTTGAGAACACCCTCGAGCCCCAGAAGCCCTGGACCTTCAAGAAAGCCTGCGAGAGCTTGGACAAGAACACCAGCAGTGGCTACCCTTACCATAAGGCTAAGAATAAAGACTGGACGGGCACTTGCTTTGTGGGTGAGCTAGGTGACCAGGCGACCCATGCTAACAACATGTATGAGATGTGCAAGTCCATGAGACCAGTCTACACCGCTGCCCTTAAAGATGAGCTAGTCAAACCTGAGAGAATATACACCAAAATCAAGAAGAGGTTGTTGTGGGGCTCGGACTTGGGGACTATGGTACGAGCTGCACGTGCATTTGGGCCCTTTTGTGATGCACTTAAGGAGACATGTGTCATCAATCCAGTGAGAGTTGGCATGTCCATGAACGAAGATGGACCATTCATCTTCGCAAGGCACGCCCAATTCAAGTACCACACTGATGCTGACTTCTCTCGCTGGGATTCTACCCAGCAACGTGCTATCCTCCGGCGTGCAGGTGACATCATGGTGCGCCTTTCACCCGAGCCAGAGAGAGCTAGGGTGGTTATGGATGATCTGCTGGCCCCCTCTCTTCTGGATGTTGGTGACTACAAAGTGCTTGTTGATGAGGGTCTCCCGTCAGGTTGCCCATGTACAACTCAGCTCAATAGCATTGCCCATTGGATACTGACCTTGAGTGCCATCGTTGAAACCACTAGGATAGATCCCGACATCGTCATGCAGGAGTCTGAGTTCTCCTTCTATGGTGATGACGAAGTGGTTTCGACCAACCTTGAATTGGATATGTCAAAATATACCCTAGTGCTCAAGAAGTATGGCCTTATACCAACCAGGGCCGATAAACAAGAAGGCCCTCTCGAGCGTCGCCAAACCCTGCAAGGGGTGTCATTCTTGCGGCGTTCGATAGTTGGTGACCAGTTCGGTTGGTTTGGGCGCCTGGATCGTGCCAGTATCGATCGGCAACTATTATGGACCAAAGGACCAAACCACCTGAACCCATTTGAAACGCTCCCCGGGCATGCTCAAAGACCCTCCCAGCTCATGGCCTTGCTTGGTGAGGCTGCTATGCATGGTGAGAAGTACTATCGGGCTGTTGCCTCCCGGGTCTCAAAAGAGGCCGCCCAGAGTGGGATAGAAATGGTGGTCCCACGCCACCGCTCTGTCCTGCGCTGGGTGCGCTTTGGAACAATGGATGCCGAGACCCCGCAGGAACGCTCGGCAGTCTTTGTGAATGAGGATGAGTGATGGCGCAACGCCCAAAACCCAGGCTTCTGAAGCCTCGGGCCAGGATCTTGTTCCTTCCTCCGTGGAGCAGTNCATCCCCATTCAGCCCGTGGCGGGTGCGGCTGTTGCCGCCCCCACCGCGGGGCAGATCAACCAAATTGACCCCTGGATCGTCCAAAACTTTGTCCAGTGTCACCTTGGTGAATTTTCCATCTGCGCCAGAAATACCCCAGGTGAGATTCTGTTTGATTTGACCCTCGGTCCAGGACTCAATCCTTACCTTGCACACCTCTCAGCCATGTACACCGGCTGGGTTGGGAACATGGAGGTTCAGCTGGTTCTCGCCGGCAATGCCTTTACTGCTGGCAAGGTGGTGGTTGCCCTTGTACCACCGTATTTCCCCAAGGGATCCCTCACCACAGCGCAGATCACATGTTTCCCACACGTCATGTGTGATGTGCGCACCCTGGAACCCATTCAACTACCACTCCTTGACGTGCGTAGGGTTTTGTGGCATGCTACTCAAGATCAGGAGGAGGCTATGCGCCTCGTCTGCATGCTCTACACACCCCTCCGCACTAACAGCCCTGGTGATGAGTCATTTGTGGTGTCTGGCCGACTACTATCGAGGCCTGCTGTAGACTTTAACTTTGTCTACCTCACCCCACCCATTGAGAGGACCATCTACCGCATGGTGGACCTTCCTGTCATACAGCCTAGGTTGTGCACCCATTCTCGCTGGCCCGCTCCTGTGTACCAGATCTTGGTGGACCCCTCTCTTCCCTCGAATCCACAATGGCAGAATGGTAGAGTCCAGCTGGATGGTACTTTGCTTGGCACCACACCCCTTTCCAGCAGCTGGGTGGCTTCCTTCGCTGGCAATGCAGAGTACCAATTTGAGTCCAGCGTTGGTGAGATAGCTACTGTGAAGTTGATTGAGATTGATGGTTCTGCCTACACCCCTGGGGATCGGGCGGCCCCTTTGGGTTACCCCGATTTCTCTGGGAAGCTTGAGGTTGAGATACAGACTGAGACCACCAAAACCGGCCAGAAACTCAATGTCACCACTTTCAATGTTGCTTTGGGTCCCACCACCAATGTAGACCAGACACCATACCAGGGCCAAATCTTTGCGGATTTTCAAGCTTCCGCATCTTTGGACCTGGTGGATGGTAGGATTAGGGCCTCCCCAAGGGCCGTTGTTGACTTCCAGGACACTCTCCCGGAATACAATGATGGGCTCCTTGTCCCCCTTGCCCCTCCTCTAGGTCCCTTTCTCCCTGGTGAGGTGCTTCTCAGGTTTCGCACCTACGCCCGTCATGTGGACAAGACCGATGCGACGGCCCAGTCAGTTGATTGCGCCTTGCCGCAGGAGTTCGTCACGTGGCTGGCCAGCAACAGCTTTACAGTGCAATCTGAAGCCCTCCTTCTCAGATACAGGAATACTTTAACGG
255
GGCAGCTCCTGTTTGAGTGCAAGTTCTACAATGAGGGTTACATCGCCCTGTCATACTCTGGTTCTGGACCCCTCACCTTCCCAACTGACGGTTTCTTTGAGGTTGTCAGCTGGGTTCCCCGTCTTTACCAATTGGCCTCTGTGGGAAGTCTGACAACAGGCCGAACACTCAAGCAATAATGGCTAGTGCAATAGCTGGAGCAATTGGGGGAGGGTTGATGGGCATAATTGGCAACTCGCTCTCAACCTGGCAAAATTTGCAGGCCAACAAGCAATTGGCAGCCCAACAATTTGGATATAACTCTGCTCTTCTGCAAACGCAAGTTCAAGCCCAGAAGGATCTCACTCTTATGGGCCAGAGTTTTAACCAGCAGCTTCAGGCCAACTCATTCCAACA TGACCTCAGAATGTTAGAGGCGCAGGTCCAGGCTCAGGCGCAGGCCCAACAGAATGCTATGGACATCCGCGCCTCGCAGCTTGAGAAGGCGGGGTTTTCAAGATCTGATGCCATTCGCCTTGCCTCGGGTCAGCAGCCTACAAAGGCCGTAGACTGGTCTGGTACGCGGTACTACACCGCTAATCAGCCGGTCACTGGCTTTTCGGGTGGTTTCAGCCCGGGTTACACTTCAGGTAGGCAAATGGTTGCTCGCTCTGTGGACACATCCCCGCTTCCTACTTCTGGGATCCGCGTTCCCTCACTTCGTGGAGGTTCCTGGTCGCCGGCGGAGTACACGCCTAACACCCAAGGGACCTACACGAATGGTCGGTTCGTGTCATTCCCAAAGA-TAGGAAGCAGCAGAGCATAGTTGA
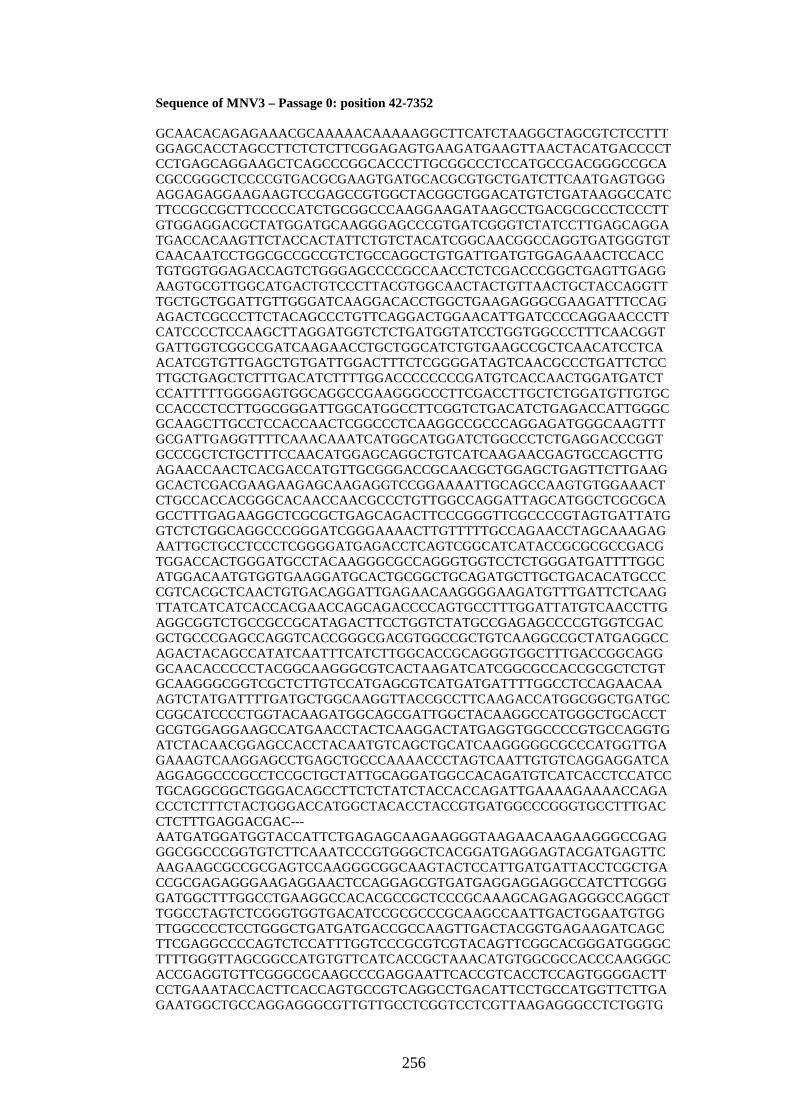
256
Sequence of MNV3 – Passage 0: position 42-7352 GCAACACAGAGAAACGCAAAAACAAAAAGGCTTCATCTAAGGCTAGCGTCTCCTTTGGAGCACCTAGCCTTCTCTCTTCGGAGAGTGAAGATGAAGTTAACTACATGACCCCTCCTGAGCAGGAAGCTCAGCCCGGCACCCTTGCGGCCCTCCATGCCGACGGGCCGCACGCCGGGCTCCCCGTGACGCGAAGTGATGCACGCGTGCTGATCTTCAATGAGTGGGAGGAGAGGAAGAAGTCCGAGCCGTGGCTACGGCTGGACATGTCTGATAAGGCCATCTTCCGCCGCTTCCCCCATCTGCGGCCCAAGGAAGATAAGCCTGACGCGCCCTCCCTTGTGGAGGACGCTATGGATGCAAGGGAGCCCGTGATCGGGTCTATCCTTGAGCAGGATGACCACAAGTTCTACCACTATTCTGTCTACATCGGCAACGGCCAGGTGATGGGTGTCAACAATCCTGGCGCCGCCGTCTGCCAGGCTGTGATTGATGTGGAGAAACTCCACCTGTGGTGGAGACCAGTCTGGGAGCCCCGCCAACCTCTCGACCCGGCTGAGTTGAGGAAGTGCGTTGGCATGACTGTCCCTTACGTGGCAACTACTGTTAACTGCTACCAGGTTTGCTGCTGGATTGTTGGGATCAAGGACACCTGGCTGAAGAGGGCGAAGATTTCCAGAGACTCGCCCTTCTACAGCCCTGTTCAGGACTGGAACATTGATCCCCAGGAACCCTTCATCCCCTCCAAGCTTAGGATGGTCTCTGATGGTATCCTGGTGGCCCTTTCAACGGTGATTGGTCGGCCGATCAAGAACCTGCTGGCATCTGTGAAGCCGCTCAACATCCTCAACATCGTGTTGAGCTGTGATTGGACTTTCTCGGGGATAGTCAACGCCCTGATTCTCCTTGCTGAGCTCTTTGACATCTTTTGGACCCCCCCCGATGTCACCAACTGGATGATCTCCATTTTTGGGGAGTGGCAGGCCGAAGGGCCCTTCGACCTTGCTCTGGATGTTGTGCCCACCCTCCTTGGCGGGATTGGCATGGCCTTCGGTCTGACATCTGAGACCATTGGGCGCAAGCTTGCCTCCACCAACTCGGCCCTCAAGGCCGCCCAGGAGATGGGCAAGTTTGCGATTGAGGTTTTCAAACAAATCATGGCATGGATCTGGCCCTCTGAGGACCCGGTGCCCGCTCTGCTTTCCAACATGGAGCAGGCTGTCATCAAGAACGAGTGCCAGCTTGAGAACCAACTCACGACCATGTTGCGGGACCGCAACGCTGGAGCTGAGTTCTTGAAGGCACTCGACGAAGAAGAGCAAGAGGTCCGGAAAATTGCAGCCAAGTGTGGAAACTCTGCCACCACGGGCACAACCAACGCCCTGTTGGCCAGGATTAGCATGGCTCGCGCAGCCTTTGAGAAGGCTCGCGCTGAGCAGACTTCCCGGGTTCGCCCCGTAGTGATTATGGTCTCTGGCAGGCCCGGGATCGGGAAAACTTGTTTTTGCCAGAACCTAGCAAAGAGAATTGCTGCCTCCCTCGGGGATGAGACCTCAGTCGGCATCATACCGCGCGCCGACGTGGACCACTGGGATGCCTACAAGGGCGCCAGGGTGGTCCTCTGGGATGATTTTGGCATGGACAATGTGGTGAAGGATGCACTGCGGCTGCAGATGCTTGCTGACACATGCCCCGTCACGCTCAACTGTGACAGGATTGAGAACAAGGGGAAGATGTTTGATTCTCAAGTTATCATCATCACCACGAACCAGCAGACCCCAGTGCCTTTGGATTATGTCAACCTTGAGGCGGTCTGCCGCCGCATAGACTTCCTGGTCTATGCCGAGAGCCCCGTGGTCGACGCTGCCCGAGCCAGGTCACCGGGCGACGTGGCCGCTGTCAAGGCCGCTATGAGGCCAGACTACAGCCATATCAATTTCATCTTGGCACCGCAGGGTGGCTTTGACCGGCAGGGCAACACCCCCTACGGCAAGGGCGTCACTAAGATCATCGGCGCCACCGCGCTCTGTGCAAGGGCGGTCGCTCTTGTCCATGAGCGTCATGATGATTTTGGCCTCCAGAACAAAGTCTATGATTTTGATGCTGGCAAGGTTACCGCCTTCAAGACCATGGCGGCTGATGCCGGCATCCCCTGGTACAAGATGGCAGCGATTGGCTACAAGGCCATGGGCTGCACCTGCGTGGAGGAAGCCATGAACCTACTCAAGGACTATGAGGTGGCCCCGTGCCAGGTGATCTACAACGGAGCCACCTACAATGTCAGCTGCATCAAGGGGGCGCCCATGGTTGAGAAAGTCAAGGAGCCTGAGCTGCCCAAAACCCTAGTCAATTGTGTCAGGAGGATCAAGGAGGCCCGCCTCCGCTGCTATTGCAGGATGGCCACAGATGTCATCACCTCCATCCTGCAGGCGGCTGGGACAGCCTTCTCTATCTACCACCAGATTGAAAAGAAAACCAGACCCTCTTTCTACTGGGACCATGGCTACACCTACCGTGATGGCCCGGGTGCCTTTGACCTCTTTGAGGACGAC---AATGATGGATGGTACCATTCTGAGAGCAAGAAGGGTAAGAACAAGAAGGGCCGAGGGCGGCCCGGTGTCTTCAAATCCCGTGGGCTCACGGATGAGGAGTACGATGAGTTCAAGAAGCGCCGCGAGTCCAAGGGCGGCAAGTACTCCATTGATGATTACCTCGCTGACCGCGAGAGGGAAGAGGAACTCCAGGAGCGTGATGAGGAGGAGGCCATCTTCGGGGATGGCTTTGGCCTGAAGGCCACACGCCGCTCCCGCAAAGCAGAGAGGGCCAGGCTTGGCCTAGTCTCGGGTGGTGACATCCGCGCCCGCAAGCCAATTGACTGGAATGTGGTTGGCCCCTCCTGGGCTGATGATGACCGCCAAGTTGACTACGGTGAGAAGATCAGCTTCGAGGCCCCAGTCTCCATTTGGTCCCGCGTCGTACAGTTCGGCACGGGATGGGGCTTTTGGGTTAGCGGCCATGTGTTCATCACCGCTAAACATGTGGCGCCACCCAAGGGCACCGAGGTGTTCGGGCGCAAGCCCGAGGAATTCACCGTCACCTCCAGTGGGGACTTCCTGAAATACCACTTCACCAGTGCCGTCAGGCCTGACATTCCTGCCATGGTTCTTGAGAATGGCTGCCAGGAGGGCGTTGTTGCCTCGGTCCTCGTTAAGAGGGCCTCTGGTG
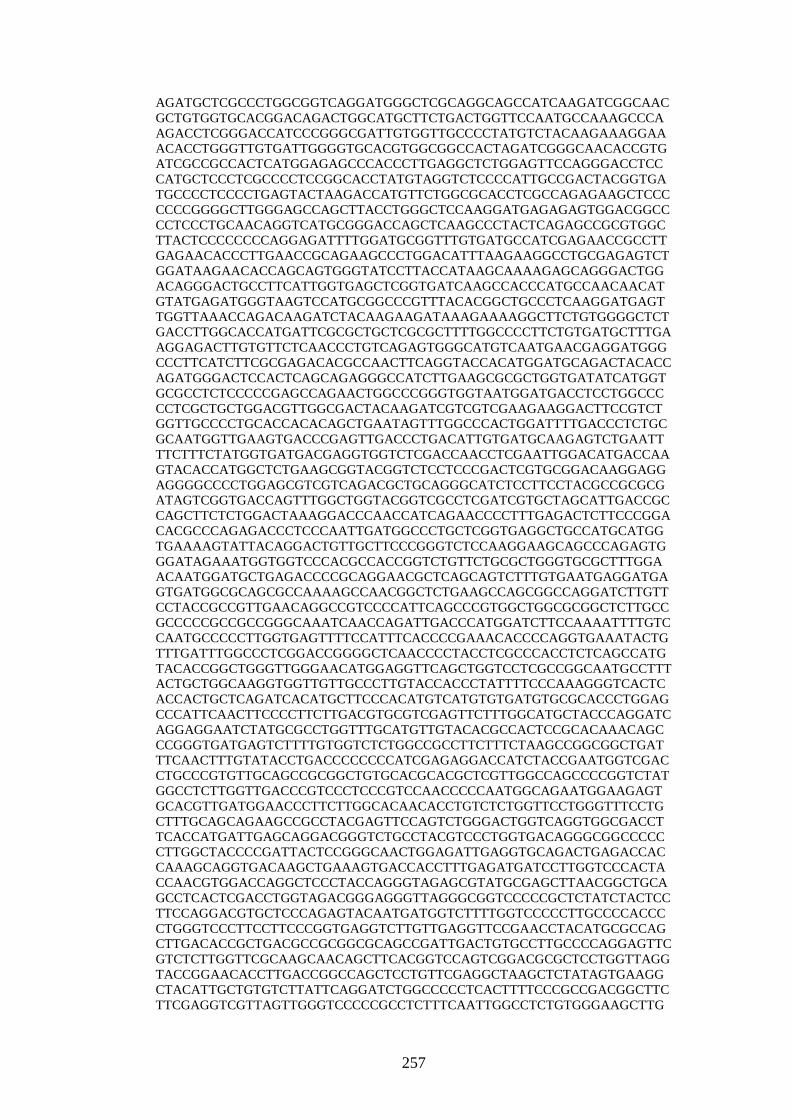
257
AGATGCTCGCCCTGGCGGTCAGGATGGGCTCGCAGGCAGCCATCAAGATCGGCAACGCTGTGGTGCACGGACAGACTGGCATGCTTCTGACTGGTTCCAATGCCAAAGCCCAAGACCTCGGGACCATCCCGGGCGATTGTGGTTGCCCCTATGTCTACAAGAAAGGAAACACCTGGGTTGTGATTGGGGTGCACGTGGCGGCCACTAGATCGGGCAACACCGTGATCGCCGCCACTCATGGAGAGCCCACCCTTGAGGCTCTGGAGTTCCAGGGACCTCCCATGCTCCCTCGCCCCTCCGGCACCTATGTAGGTCTCCCCATTGCCGACTACGGTGATGCCCCTCCCCTGAGTACTAAGACCATGTTCTGGCGCACCTCGCCAGAGAAGCTCCCCCCCGGGGCTTGGGAGCCAGCTTACCTGGGCTCCAAGGATGAGAGAGTGGACGGCCCCTCCCTGCAACAGGTCATGCGGGACCAGCTCAAGCCCTACTCAGAGCCGCGTGGCTTACTCCCCCCCCAGGAGATTTTGGATGCGGTTTGTGATGCCATCGAGAACCGCCTTGAGAACACCCTTGAACCGCAGAAGCCCTGGACATTTAAGAAGGCCTGCGAGAGTCTGGATAAGAACACCAGCAGTGGGTATCCTTACCATAAGCAAAAGAGCAGGGACTGGACAGGGACTGCCTTCATTGGTGAGCTCGGTGATCAAGCCACCCATGCCAACAACATGTATGAGATGGGTAAGTCCATGCGGCCCGTTTACACGGCTGCCCTCAAGGATGAGTTGGTTAAACCAGACAAGATCTACAAGAAGATAAAGAAAAGGCTTCTGTGGGGCTCTGACCTTGGCACCATGATTCGCGCTGCTCGCGCTTTTGGCCCCTTCTGTGATGCTTTGAAGGAGACTTGTGTTCTCAACCCTGTCAGAGTGGGCATGTCAATGAACGAGGATGGGCCCTTCATCTTCGCGAGACACGCCAACTTCAGGTACCACATGGATGCAGACTACACCAGATGGGACTCCACTCAGCAGAGGGCCATCTTGAAGCGCGCTGGTGATATCATGGTGCGCCTCTCCCCCGAGCCAGAACTGGCCCGGGTGGTAATGGATGACCTCCTGGCCCCCTCGCTGCTGGACGTTGGCGACTACAAGATCGTCGTCGAAGAAGGACTTCCGTCTGGTTGCCCCTGCACCACACAGCTGAATAGTTTGGCCCACTGGATTTTGACCCTCTGCGCAATGGTTGAAGTGACCCGAGTTGACCCTGACATTGTGATGCAAGAGTCTGAATTTTCTTTCTATGGTGATGACGAGGTGGTCTCGACCAACCTCGAATTGGACATGACCAAGTACACCATGGCTCTGAAGCGGTACGGTCTCCTCCCGACTCGTGCGGACAAGGAGGAGGGGCCCCTGGAGCGTCGTCAGACGCTGCAGGGCATCTCCTTCCTACGCCGCGCGATAGTCGGTGACCAGTTTGGCTGGTACGGTCGCCTCGATCGTGCTAGCATTGACCGCCAGCTTCTCTGGACTAAAGGACCCAACCATCAGAACCCCTTTGAGACTCTTCCCGGACACGCCCAGAGACCCTCCCAATTGATGGCCCTGCTCGGTGAGGCTGCCATGCATGGTGAAAAGTATTACAGGACTGTTGCTTCCCGGGTCTCCAAGGAAGCAGCCCAGAGTGGGATAGAAATGGTGGTCCCACGCCACCGGTCTGTTCTGCGCTGGGTGCGCTTTGGAACAATGGATGCTGAGACCCCGCAGGAACGCTCAGCAGTCTTTGTGAATGAGGATGAGTGATGGCGCAGCGCCAAAAGCCAACGGCTCTGAAGCCAGCGGCCAGGATCTTGTTCCTACCGCCGTTGAACAGGCCGTCCCCATTCAGCCCGTGGCTGGCGCGGCTCTTGCCGCCCCCGCCGCCGGGCAAATCAACCAGATTGACCCATGGATCTTCCAAAATTTTGTCCAATGCCCCCTTGGTGAGTTTTCCATTTCACCCCGAAACACCCCAGGTGAAATACTGTTTGATTTGGCCCTCGGACCGGGGCTCAACCCCTACCTCGCCCACCTCTCAGCCATGTACACCGGCTGGGTTGGGAACATGGAGGTTCAGCTGGTCCTCGCCGGCAATGCCTTTACTGCTGGCAAGGTGGTTGTTGCCCTTGTACCACCCTATTTTCCCAAAGGGTCACTCACCACTGCTCAGATCACATGCTTCCCACATGTCATGTGTGATGTGCGCACCCTGGAGCCCATTCAACTTCCCCTTCTTGACGTGCGTCGAGTTCTTTGGCATGCTACCCAGGATCAGGAGGAATCTATGCGCCTGGTTTGCATGTTGTACACGCCACTCCGCACAAACAGCCCGGGTGATGAGTCTTTTGTGGTCTCTGGCCGCCTTCTTTCTAAGCCGGCGGCTGATTTCAACTTTGTATACCTGACCCCCCCCATCGAGAGGACCATCTACCGAATGGTCGACCTGCCCGTGTTGCAGCCGCGGCTGTGCACGCACGCTCGTTGGCCAGCCCCGGTCTATGGCCTCTTGGTTGACCCGTCCCTCCCGTCCAACCCCCAATGGCAGAATGGAAGAGTGCACGTTGATGGAACCCTTCTTGGCACAACACCTGTCTCTGGTTCCTGGGTTTCCTGCTTTGCAGCAGAAGCCGCCTACGAGTTCCAGTCTGGGACTGGTCAGGTGGCGACCTTCACCATGATTGAGCAGGACGGGTCTGCCTACGTCCCTGGTGACAGGGCGGCCCCCCTTGGCTACCCCGATTACTCCGGGCAACTGGAGATTGAGGTGCAGACTGAGACCACCAAAGCAGGTGACAAGCTGAAAGTGACCACCTTTGAGATGATCCTTGGTCCCACTACCAACGTGGACCAGGCTCCCTACCAGGGTAGAGCGTATGCGAGCTTAACGGCTGCAGCCTCACTCGACCTGGTAGACGGGAGGGTTAGGGCGGTCCCCCGCTCTATCTACTCCTTCCAGGACGTGCTCCCAGAGTACAATGATGGTCTTTTGGTCCCCCTTGCCCCACCCCTGGGTCCCTTCCTTCCCGGTGAGGTCTTGTTGAGGTTCCGAACCTACATGCGCCAGCTTGACACCGCTGACGCCGCGGCGCAGCCGATTGACTGTGCCTTGCCCCAGGAGTTCGTCTCTTGGTTCGCAAGCAACAGCTTCACGGTCCAGTCGGACGCGCTCCTGGTTAGGTACCGGAACACCTTGACCGGCCAGCTCCTGTTCGAGGCTAAGCTCTATAGTGAAGGCTACATTGCTGTGTCTTATTCAGGATCTGGCCCCCTCACTTTTCCCGCCGACGGCTTCTTCGAGGTCGTTAGTTGGGTCCCCCGCCTCTTTCAATTGGCCTCTGTGGGAAGCTTG
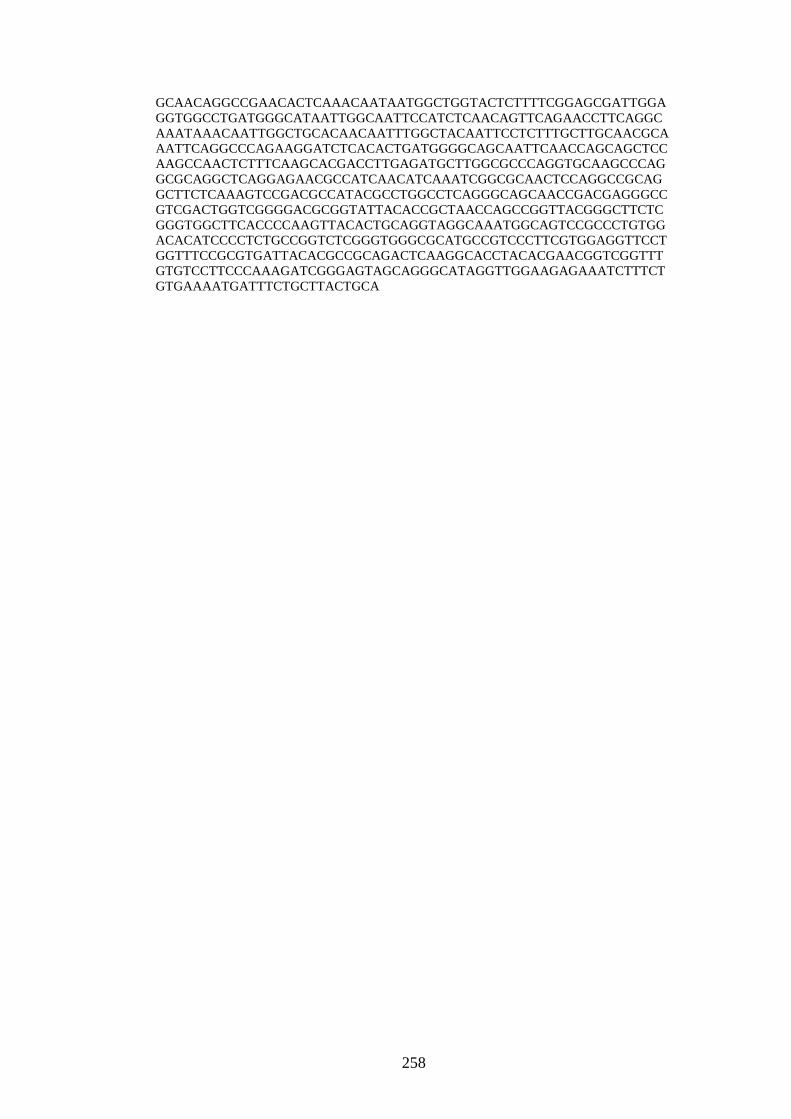
258
GCAACAGGCCGAACACTCAAACAATAATGGCTGGTACTCTTTTCGGAGCGATTGGAGGTGGCCTGATGGGCATAATTGGCAATTCCATCTCAACAGTTCAGAACCTTCAGGCAAATAAACAATTGGCTGCACAACAATTTGGCTACAATTCCTCTTTGCTTGCAACGCAAATTCAGGCCCAGAAGGATCTCACACTGATGGGGCAGCAATTCAACCAGCAGCTCCAAGCCAACTCTTTCAAGCACGACCTTGAGATGCTTGGCGCCCAGGTGCAAGCCCAGGCGCAGGCTCAGGAGAACGCCATCAACATCAAATCGGCGCAACTCCAGGCCGCAGGCTTCTCAAAGTCCGACGCCATACGCCTGGCCTCAGGGCAGCAACCGACGAGGGCCGTCGACTGGTCGGGGACGCGGTATTACACCGCTAACCAGCCGGTTACGGGCTTCTCGGGTGGCTTCACCCCAAGTTACACTGCAGGTAGGCAAATGGCAGTCCGCCCTGTGGACACATCCCCTCTGCCGGTCTCGGGTGGGCGCATGCCGTCCCTTCGTGGAGGTTCCTGGTTTCCGCGTGATTACACGCCGCAGACTCAAGGCACCTACACGAACGGTCGGTTTGTGTCCTTCCCAAAGATCGGGAGTAGCAGGGCATAGGTTGGAAGAGAAATCTTTCTGTGAAAATGATTTCTGCTTACTGCA
259
Sequence of MNV3 – Passage 33, high moi: position 4-7351 AAATGAGGATGGCAACGCCATCTTCTGCGTCCTCCGTGCGCAACACAGAGAAACGCAAAAACAAAAAGGCTTCATCTAAGGCTAGCGTCTCCTTTGGAGCACCTAGCCTTCTCTCTTCGGAGAGTGAAGATGAAGTTAACTACATGACCCCTCCTGAGCAGGAAGCTCAGCCCGGCACCCTTGCGGCCCTCCATGCCGACGGGCCGCACGCCGGGCTCCCCGTGACGCGAAGTGATGCACGCGTGCTGATCTTCAATGAGTGGGAGGAGAGGAAGAAGTCCGAGCCGTGGCTACGGCTGGACATGTCTGATAAGGCCATCTTCCGCCGCTTCCCCCATCTGCGGCCCAAGGAAGATAAGCCTGACGCGCCCTCCCTTGTGGAGGACGCTATGGATGCAAGGGAGCCCGTGATCGGGTCTATCCTTGAGCAGGATGACCACAAGTTCTACCACTATTCTGTCTACATCGGCAACGGCCAGGTGATGGGTGTCAACAATCCTGGCGCCGCCGTCTGCCAGGCTGTGATTGATGTGGAGAAACTCCACCTGTGGTGGAGACCAGTCTGGGAGCCCCGCCAACCTCTCGACCCGGCTGAGTTGAGGAACTGCGTTGGCATGACTGTCCCTTACGTGGCAACTACTGTTAACTGCTACCAGGTTTGCTGCTGGATTGTTGGGATCAAGGACACCTGGCTGAAGAGGGCGAAGATTTCCAGAGACTCGCCCTTCTACAGCCCTGTTCAGGACTGGAACATTGATCCCCAGGAACCCTTCATCCCCTCCAAGCTTAGGATGGTCTCTGATGGTATCCTGGTGGCCCTTTCAACGGTGATTGGTCGGCCGATCAAGAACCTGCTGGCATCTGTGAAGCCGCTCAACATCCTCAACATCGTGTTGAGCTGTGATTGGACTTTCTCGGGGATAGTCAACGCCCTGATTCTCCTTGCTGAGCTCTTTGACATCTTTTGGACCCCCCCCGATGTCACCAACTGGATGATCTCCATTTTTGGGGAGTGGCAGGCCGAAGGGCCCTTCGACCTTGCTCTGGATGTTGTGCCCACCCTCCTTGGCGGGATTGGCATGGCCTTCGGTCTGACATCTGAGACCATTGGGCGCAAGCTTGCCTCCACCAACTCGGCCCTCAAGGCCGCCCAGGAGATGGGCAAGTTTGCGATTGAGGTTTTCAAACAAATCATGACATGGATCTGGCCCTCTGAGGACCCGGTGCCCGCTCTGCTTTCCAACATGGAGCAGGCTGTCATCAAGAACGAGTGCCAGCTTGAGAACCAACTCACGACCATGTTGCGGGACCGCAACGCTGGAGCTGAGTTCTTGAAGGCACTCGACGAAGAAGAGCAAGAGGTCCGGAAAATTGCAGCCAAGTGTGGAAACTCTGCCACCACGGGCACAACCAACGCCCTGTTGGCCAGGATTAGCATGGCTCGCGCAGCCTTTGAGAAGGCTCGCGCTGAGCAGACTTCCCGGGTTCGCCCCGTAGTGATTATGGTCTCTGGCAGGCCCGGGATCGGGAAAACTTGTTTTTGCCAGAACCTAGCAAAGAGAATTGCTGCCTCCCTCGGGGATGAGACCTCAGTCGGCATCATACCGCGCGCCGACGTGGACCACTGGGATGCCTACAAGGGCGCCAGGGTGGTCCTCTGGGATGATTTTGGCATGGACAATGTGGTGAAGGATGCACTGCGGCTGCAGATGCTTGCTGACACATGCCCCGTCACGCTCAACTGTGACAGGATTGAGAACAAGGGGAAGATGTTTGATTCTCAAGTTATCATCATCACCACGAACCAGCAGACCCCAGTGCCTTTGGATTATGTCAACCTTGAGGCGGTCTGCCGCCGCATAGACTTCCTGGTCTATGCCGAGAGCCCCGTGGTCGACGCTGCCCGAGCCAGGTCACCGGGCGACGTGGCCGCTGTCAAGGCCGCTATGAGGCCAGACTACAGCCATATCAATTTCATCTTGGCACCGCAGGGTGGCTTTGACCGGCAGGGCAACACCCCCTACGGCAAGGGCGTCACTAAGATCATCGGCGCCACCGCGCTCTGTGCAAGGGCGGTCGCTCTTGTCCATGAGCGTCATGATGATTTTGGCCTCCAGAACAAAGTCTATGATTTTGATGCTGGCAAGGTTACCGCCTTCAAGACCATGGCGGCTGATGCCGGCATCCCCTGGTACAAGATGGCAGCGATTGGCTACAAGGCCATGGGCTGCACCTGCGTGGAGGAAGCCATGAACCTACTCAAGGACTATGAGGTGGCCCCGTGCCAGGTGATCTACAACGGAGCCACCTACAATGTCAGCTGCATCAAGGGGGCGCCCATGGTTGAGAAAGTCAAGGAGCCTGAGCTGCCCAAAACCCTAGTCAATTGTGTCAGGAGGATCAAGGAGGCCCGCCTCCGCTGCTATTGCAGGATGGCCACAGATGTCATCACCTCCATCCTGCAGGCGGCTGGGACAGCCTTCTCTATCTACCACCAGATTGAAAAGAAAACCAGACCCTCTTTCTACTGGGACCATGGCNACACCTACCGTGATGGCCCGGGTGCCTTTGACCTCTTTGAGGACGAC---AATGATGGATGGTACCATTCTGAGAGCAAGAAGGGTAAGAACAAGAAGGGCCGAGGGCGGCCCGGTGTCTTCAAATCCCGTGGGCTCACGGATGAGGAGTACGATGAGTTCAAGAAGCGCCGCGAGTCCAAGGGCGGCAAGTACTCCATTGATGATTACCTCGCTGACCGCGAGAGGGAAGAGGAACTCCAGGAGCGTGATGAGGAGGAGGCCATCTTCGGGGATGGCTTTGGCCTGAAGGCCACACGCCGCTCCCGCAAAGCAGAGAGGGCCAGGCTTGGCCTAGTCTCGGGTGGTGACATCCGCGCCCGCAAGCCAATTGACTGGAATGTGGTTGGCCCCTCCTGGGCTGATGATGACCGCCAAGTTGACTACGGTGAGAAGATCAGCTTCGAGGCCCCAGTCTCCATTTGGTCCCGCGTCGTACAGTTCGGCACGGGATGGGGCTTTTGGGTTAGCGGCCATGTGTTCATCACCGCTAAACATGTGGCGCCACCCAAGGGCACCGAGGTGTTCGGGCGCAAGCCCGAGGAATTCACCGTCACCTCCAGTGGGGACTTCCTGAAATACCACTTCACCAGTGCCGTCAGGCCTGACATTCCTGCCATGGTTCTTGA
260
GAATGGCTGCCAGGAGGGCGTTGTTGCCTCGGTCCTCGTTAAGAGGGCCTCTGGTGAGATGCTCGCCCTGGCGGTCAGGATGGGCTCGCAGGCAGCCATCAAGATCGGCAACGCTGTGGTGCACGGACAGACTGGCATGCTTCTGACTGGTTCCAATGCCAAAGCCCAAGACCTCGGGACCATCCCGGGCGATTGTGGTTGCCCCTATGTCTACAAGAAAGGAAACACCTGGGTTGTGATTGGGGTGCACGTGGCGGCCACTAGATCGGGCAACACCGTGATCGCCGCCACTCATGGAGAGCCCACCCTTGAGGCTCTGGAGTTCCAGGGACCTCCCATGCTCCCTCGCCCCTCCGGCACCTATGTAGGTCTCCCCATTGCCGACTACGGTGATGCCCCTCCCCTGAGTACTAAGACCATGTTCTGGCGCACCTCGCCAGAGAAGCTCCCCCCCGGGGCTTGGGAGCCAGCTTACCTGGGCTCCAAGGATGAGAGAGTGGACGGCCCCTCCCTGCAACAGGTCATGCGGGACCAGCTCAAGCCCTACTCAGAGCCGCGTGGCTTACTCCCCCCCCAGGAGATTTTGGATGCGGTTTGTGATGCCATCGAGAACCGCCTTGAGAACACCCTTGAACCGCAGAAGCCCTGGACATTTAAGAAGGCCTGCGAGAGTCTGGATAAGAACACCAGCAGTGGGTATCCTTACCATAAGCAAAAGAGCAGGGACTGGACAGGGACTGCCTTCATTGGTGAGCTCGGTGATCAAGCCACCCATGCCAACAACATGTATGAGATGGGTAAGTCCATGCGGCCCGTTTACACGGCTGCCCTCAAGGATGAGTTGGTTAAACCAGACAAGATCTACAAGAAGATAAAGAAAAGGCTTCTGTGGGGCTCTGACCTTGGCACCATGATTCGCGCTGCTCGCGCTTTTGGCCCCTTCTGTGATGCTTTGAAGGAGACTTGTGTTCTCAACCCTGTCAGAGTGGGCATGTCAATGAACGAGGATGGGCCCTTCATCTTCGCGAGACANGCCAACTTCAGGTACCACATGGATGCAGACTACACCAGATGGGACTCCACTCAGCAGAGGGCCATCTTGAAGCGCGCTGGTGATATCATGGTGCGCCTCTCCCCCGAGCCAGAACTGGCCCGGGTGGTAATGGATGACCTCCTGGCCCCCTCGCTGCTGGACGTTGGCGACTACAAGATCGTCGTCGAAGAAGGACTTCCGTCTGGTTGCCCCTGCACCACACAGCTGAATAGTTTGGCCCACTGGATTTTGACCCTCTGCGCAATGGTTGAAGTGACCCGAGTTGACCCTGACATTGTGATGCAAGAGTCTGAATTTTCTTTCTATGGTGATGACGAGGTGGTCTCGACCAACCTCGAATTGGACATGACCAAGTACACCATGGCTCTGAAGCGGTACGGTCTCCTCCCGACTCGTGCGGACAAGGAGGAGGGGCCCCTGGAGCGTCGTCAGACGCTGCAGGGCATCTCCTTCCTACGCCGCGCGATAGTCGGTGACCAGTTTGGCTGGTACGGTCGCCTCGATCGTGCTAGCATTGACCGCCAGCTTCTCTGGACTAAAGGACCCAACCATCAGAACCCCTTTGAGACTCTTCCCGGACACGCCCAGAGACCCTCCCAATTGATGGCCCTGCTCGGTGAGGCTGCCATGCATGGTGAAAAGTATTACAGGACTGTTGCTTCCCGGGTCTCCAAGGAAGCAGCCCAGAGTGGGATAGAAATGGTGGTCCCACGCCACCGGTCTGTTCTGCGCTGGGTGCGCTTTGGAACAATGGATGCTGAGACCCCGCAGGAACGCTCAGCAGTCTTTGTGAATGAGGATGAGTGATGGCGCAGCGCCAAAAGCCAACGGCTCTGAAGCCAGCGGCCAGGATCTTGTTCCTACCGCCGTTGAACAGGCCGTCCCCATTCAGCCCGTGGCTGGCGCGGCTCTTGCCGCCCCCGCCGCCGGGCAAATCAACCAGATTGACCCATGGATCTTCCAAAATTTTGTCCAATGCCCCCTTGGTGAGTTTTCCATTTCACCCCGAAACACCCCAGGTGAAATACTGTTTGATTTGGCCCTCGGACCGGGGCTCAACCCCTACCTCGCCCACCTCTCAGCCATGTACACCGGCTGGGTTGGGAACATGGAGGTTCAGCTGGTCCTCGCCGGCAATGCCTTTACTGCTGGCAAGGTGGTTGTTGCCCTTGTACCACCCTATTTTCCCAAAGGGTCACTCACCACTGCTCAGATCACATGCTTCCCACATGTCATGTGTGATGTGCGCACCCTGGAGCCCATTCAACTTCCCCTTCTTGACGTGCGTCGAGTTCTTTGGCATGCTACCCAGGATCAGGAGGAATCTATGCGCCTGGTTTGCATGTTGTACACGCCACTCCGCACAAACAGCCCGGGTGATGAGTCTTTTGTGGTCTCTGGCCGCCTTCTTTCTAAGCCGGCGGCTGATTTCAACTTTGTATACCTGACCCCCCCCATCGAGAGGACCATCTACCGAATGGTCGACCTGCCCGTGTTGCAGCCGCGGCTGTGCACGCACGCTCGTTGGCCAGCCCCGGTCTATGGCCTCTTGGTTGACCCGTCCCTCCCGTCCAACCCCCAATGGCAGAATGGAAGAGTGCACGTTGATGGAACCCTTCTTGGCACAACACCTGTCTCTGGTTCCTGGGTTTCCTGCTTTGCAGCAGAAGCCGCCTACGAGTTCCAGTCTGGGATTGGTCAGGTGGCGACCTTCACCATGATTGAGCAGGACGGGTCTGCCTACGTCCCTGGTGACAGGGCGGCCCCCCTTGGCTACCCCGATTACTCCGGGCAACTGGAGATTGAGGTGCAGACTGAGACCACCAAAGCAGGTGACAAGCTGAAAGTGACCACCTTTGAGATGATCCTTGGTCCCACTACCAACGCGGACCAGGCTCCCTACCAGGGTAGAGCGTATGCGAGCTTAACGGCTGCAGCCTCACTCGACCTGGTAGACGGGAGGGTTAGGGCGGTCCCCCGCTCTATCTACTCCTTCCAGGACGTGCTCCCAGAGTACAATGATGGTCTTTTGGTCCCCCTTGCCCCACCCCTGGGTCCCTTCCTTCCCGGTGAGGTCTTGTTGAGGTTCCGAACCTACATGCGCCAGCTTGACACCGCTGACGCCGCGGCGCAGCCGATTGACTGTGCCTTGCCCCAGGAGTTCGTCTCTTGGTTCGCAAGCAACAGCTTCACGGTCCAGTCGGACGCGCTCCTGGTTAGGTACCGGAACACCTTGACCGGCCAGCTCCTGTTCGAGGCTAAGCTCTATAGTGAAGGCTACATTGCTGTGTCTTATTCAGGATCTGGCCCCCTCACTTTTCCCGCCGACGGCATC
261
TTCGAGGTCGTTAGTTGGGTCCCCCGCCTCTTTCAATTGGCCTCTGTGGGAAGCTTGGCAACAGGCCGAACACTCAAACAATAATGGCTGGTGCTCTTTTCGGAGCGATTGGAGGTGGCCTGATGGGCATAATTGGCAATTCCATCTCAACAGTTCAGAACCTTCAGGCAAATAAACAATTGGCTGCACAACAATGTGGCTACAATTCCTCTTTGCTTGCAACGCAAATTCAGGCCCAGAAGGATCTCACACTGATGGGGCAGCAATTCAACCAGCAGCTCCAAGCCAACTCTTTCAAGCACGACCTTGAGATGCTTGGCGCCCAGGTGCAAGCCCAGGCGCAGGCTCAGGAGAACGCCATCAACATCAAATCGGCGCAACTCCAGGCCGCAGGCTTCTCAAAGTCCGACGCCATACGCCTGGCCTCAGGGCAGCAACCGACGAGGGCCGTCGACTGGTCGGGGACGCGGTATTACACCGCTAACCAGCCGGTTACGGGCTTCTCGGGTGGCTTCACCCCAAGTTACACTGCAGGTAGGCAAATGGCAGTCCGCCCTGTGGACACATCCCCTCTGCCGGTCTCGGGTGGGCGCATGCCGTCCCTTCGTGGAGGTTCCTGGTTTCCGCGTGATTACACGCCGCAGACTCAAGGCACCTACACGAACGGTCGGTTTGTGTCCTTCCCAAAGATCGGGAGTAGCAGGGCATAGGTTGGAAGAGAAATCTTTCTGTGAAAATGATTTCTGCTTACTGC