Embed Size (px)
Citation preview

University of Central Florida University of Central Florida
STARS STARS
Electronic Theses and Dissertations, 2004-2019
2009
An Investigation Into Hotel Employees' Perception Of Green An Investigation Into Hotel Employees' Perception Of Green
Practices Practices
Sun-Hwa Kim University of Central Florida
Part of the Hospitality Administration and Management Commons, and the Tourism and Travel
Commons
Find similar works at: https://stars.library.ucf.edu/etd
University of Central Florida Libraries http://library.ucf.edu
This Masters Thesis (Open Access) is brought to you for free and open access by STARS. It has been accepted for
inclusion in Electronic Theses and Dissertations, 2004-2019 by an authorized administrator of STARS. For more
information, please contact [email protected].
STARS Citation STARS Citation Kim, Sun-Hwa, "An Investigation Into Hotel Employees' Perception Of Green Practices" (2009). Electronic Theses and Dissertations, 2004-2019. 4166. https://stars.library.ucf.edu/etd/4166
AN INVESTIGATION INTO HOTEL EMPLOYEES’ PERCEPTION OF
GREEN PRACTICES
by
SUN-HWA KIM
B.S. University of Central Florida, 2005
A thesis submitted in partial fulfillment of the requirements
for the degree of Master of Science in Tourism and Hospitality Management
in the Rosen College of Hospitality Management
at the University of Central Florida
Orlando, Florida
Fall Term
2009

ii
© 2009 Sun-Hwa Kim

iii
ABSTRACT
This study examined how employees of the hotel industry perceived green practices.
Data was collected from 220 employees working in eight green certified hotels in Orlando.
Research results revealed that performance levels of green practices implemented by hotels were
lower than the importance levels of those same green practices as perceived by hotel employees.
The results of the study illustrated that (1) the employees’ perception regarding green practices
was not different than one of hoteliers in terms of importance and performance, and (2)
employees weighted the green practices that were beneficial to them as more important than
green practices that required their behavior change.
Also, a positive correlation between organizational commitment and green practices
detected in this study which suggests that hotel organizations may anticipate positive
ramifications of green practices in relation to HR approach when they embrace green practices.
Unfortunately, employees’ green perceptions at work were not generalized by their demographic
characteristics, yet a number of considerable results were garnered from this study. These were
(1) employees in operational departments were more green conscious than employees in other
departments, (2) generation X was critical about green performance by the hotels, and (3)
minorities showed more green concerns than other ethnicities.
This study suggests that hotels need to spend more time and effort in communicating
their green practice to employees. Training to improve green practices should be versatile and
job-specific with strategies developed to motivate the employees to engage in green practices.

iv
Overall, this study proposes for hotels simply deploying green practices is not enough. They
should carefully plan their green practices by training and motivating employees.

v
For my mom and sister who have always prayed for me.
vi
ACKNOWLEDGMENTS
I would like to express the deepest appreciation to my committee members who were so
patient with me. Dr. Fevzi Okumus, who embodied the figure of a kind professor, provided
support and instilled mental stimulation in regards to my research. Without his guidance this
study would not have been possible. Dr. Heejung Ro inspired me to take pride in my research;
her enthusiasm for research efforts will have a significant affect on my future projects. Without
her persistence, I would have lost my motivation. Dr. Youngsoo Choi gave direction when it
was most needed. His advice throughout this process kept me focused on this topic.
Also, I am grateful to my friends Emily Hummel, Deborah Weiggburg and Emilys’ mom,
Carol Hummel, who helped me tremendously. Thank you to Gerald Knock, Stephen Lee, and
Xu Li who listened to my complaints and Kathy King and Daren Cane who made my school life
easier. I wish to thank my extended family, Carolina, Daphne, Kelly, Ken, and Nancy who fed
and surprised me and my bosses Sonya Bonnell and Dehlia Laurenson who taught and supported
me; their support was greatly appreciated.
I also thank pastor Kang and Mrs. Kang who prayed for me and Ji-Hee and Jung-Suk Lee
who helped me a lot. Finally, I express my deepest appreciation to my mom and my sister who
prayed for me every day and without them I wouldn’t be where I am today.

vii
TABLE OF CONTENTS
LIST OF FIGURES ....................................................................................................................... xi
LIST OF TABLES ........................................................................................................................ xii
CHAPTER ONE: INTRODUCTION ............................................................................................. 1
Problem Statement ...................................................................................................................... 2
Definition of Terms ..................................................................................................................... 5
Organization of the Study ........................................................................................................... 6
CHAPTER TWO: LITERATURE REVIEW ................................................................................. 8
Introduction ................................................................................................................................. 8
Part One ....................................................................................................................................... 9
Background of Green Practices ............................................................................................... 9
Definition of Green Practices .............................................................................................. 9
Catalyst of Green Practices ............................................................................................... 11
Challenges of Green Practices Deployment ..................................................................... 15
Part Two .................................................................................................................................... 17
Dimensions of Green Practices .............................................................................................. 17
Energy Efficiency ............................................................................................................. 17
Water Conservation .......................................................................................................... 19
Recycling .......................................................................................................................... 21
Clean Air ........................................................................................................................... 24
Part Three .................................................................................................................................. 27

viii
Organizational Commitment ................................................................................................. 27
Demographic Characteristics and Green Perception ............................................................. 31
Age and Green Perception ................................................................................................ 32
Gender and Green Perception ........................................................................................... 32
Marital Status and Green Perception ................................................................................ 33
Income and Green Perception ........................................................................................... 34
Education Level and Green Perception ............................................................................. 35
Ethnicity and Green Perception ........................................................................................ 35
Summary and Conclusions ........................................................................................................ 37
CHAPTER THREE: METHODOLOGY ..................................................................................... 40
Introduction ............................................................................................................................... 40
Research Design ........................................................................................................................ 40
Survey Instrument ..................................................................................................................... 41
Pilot Test ................................................................................................................................... 45
Sample ....................................................................................................................................... 46
Data Collection Procedure ........................................................................................................ 47
Response Rate ........................................................................................................................... 49
Data Analysis Procedures .......................................................................................................... 49
Importance – Performance Analysis (IPA) ............................................................................ 53
T-tests .................................................................................................................................... 55
Correlation Analysis .............................................................................................................. 56

ix
Multivariate analysis of variance (MANOVA) ..................................................................... 57
One-way analysis of variance (ANOVA) .............................................................................. 59
Post hoc tests .......................................................................................................................... 60
Conclusion ................................................................................................................................. 61
CHAPTER FOUR: RESEARCH RESULTS ............................................................................... 62
Introduction ............................................................................................................................... 62
Sample Profiles ......................................................................................................................... 62
Importance – Performance Analysis (IPA) ............................................................................... 65
IPA grid ..................................................................................................................................... 67
Evaluation of Green Dimensions .............................................................................................. 70
Correlation between Organizational Commitment and Green Practices................................... 72
Demographic Characteristics and Green Perception ................................................................. 74
Multivariate Analysis of Variance (MANOVA) ................................................................... 74
Analyses of Variances (ANOVA) ......................................................................................... 76
CHAPTER FIVE: DISCUSSIONS & CONCLUSION ................................................................ 87
Introduction ............................................................................................................................... 87
Summary of Study Results ........................................................................................................ 87
Discussion ................................................................................................................................. 90
Comparison of Importance and Performance ........................................................................ 90
Organizational Commitment and Green Practices ................................................................ 95
Ethnicity and green perception ......................................................................................... 96

x
Department and green perception ..................................................................................... 97
Age and green perception ................................................................................................. 97
Practical Implications of Study ................................................................................................. 98
Conclusions ............................................................................................................................. 101
Limitations and Future Research ............................................................................................. 102
APPENDIX A: SURVEY INSTRUMENT ................................................................................ 104
APPENDIX B: UCF IRB NOTICE OF EXEMPTION .............................................................. 109
APPENDIX C: INFORMED CONSENT FORM ...................................................................... 111
APPENDIX D: SURVEY PARTICIPATION LETTER ............................................................ 114
LIST OF REFERENCE .............................................................................................................. 116
xi
LIST OF FIGURES
Figure 1: IPA grid and interpretations .......................................................................................... 55
Figure 2: Employee perception on green practices to IPA ........................................................... 69
Figure 3: Assessment of each green attribute in importance and performance by employees ..... 70
xii
LIST OF TABLES
Table 1: Construct reliability and descriptive statistics ................................................................ 52
Table 2: Demographic profile of respondents (Employees N=220) ............................................. 64
Table 3: Importance and performance ratings of green practices by the hotel employees ........... 66
Table 4: Results of Paired T-Tests ................................................................................................ 72
Table 5: Correlations between OC and importance of green practices ........................................ 73
Table 6: Correlations between OC and performance of green practices ...................................... 73
Table 7: MANOVA - Importance of green practices by demographic variables ......................... 75
Table 8: MANOVA - Performance of green practices by demographic variables ....................... 76
Table 9: ANOVA - Importance and demographic variables ........................................................ 78
Table 10: ANOVA - Performance and demographic variables .................................................... 78
Table 11: Multiple comparisons - Importance of RC on ethnicity ............................................... 80
Table 12: Multiple comparisons - Importance of CA on department ........................................... 81
Table 13: Multiple comparisons - Importance of EF on department ........................................... 82
Table 14: Multiple comparisons - Performance of CA on generation .......................................... 83
Table 15:Multiple comparisons - Performance of EF on generation ............................................ 83
Table 16: Independent sample t-test - Performance of RC and EF by hotel classification .......... 84
Table 17: Mean scores of groups – generation, ethnicity, and department .................................. 85
1
CHAPTER ONE: INTRODUCTION
During the past thirty years, the hotel industry has identified environmentally responsible
movements as one of most important items on the agenda for hotel operations (Mensah, 2004).
Evidenced by a myriad of practices aimed at improving the environmental impact on the hotel
industry, hoteliers are more committed to environmental issues. A recent Green Assessment
Survey conducted by American Hotel & Lodging Association polled 217 respondents’ properties
and revealed that nearly ninety percent of them have adopted green activities (American Hotel &
Lodging Association [AH&LA], 2008). This statistic is an indication that green practices are not
only widely accepted but have also become the norm in the hotel industry.
Various studies have been conducted relating to environmental concerns, yet the scope
has its limitations as the majority of these studies focus primarily on the area of marketing
strategy, often investigating consumer perceptions about green products (Clark, Kotchen, &
Moore, 2003; Dalton, Lockington, & Baldock, 2008; Goldstein, Cialdini, & Griskevicius, 2008;
Gustin & Weaver, 1996; Mainieri, Barnett, Valdero, Unipan, & Oskamp, 1997; Manaktola &
Jauhari, 2007; Robert, 1996; Straughan & Roberts, 1999), green marketing (Davis, 1991; Grove,
Fisk, Pickett, & Kangun,1996; Menon & Menon, 1997; Kalafatis, Pollard, East, & Tsogas,
1999), and environmental strategies (Buysse & Verbeke, 2003; Gago & Antolín, 2004;
Henriques & Sadorsky, 1999; Hunt & Auster, 1990; Roome, 1992 ; Vastag, Kerekes, &
Rondinelli, 1996).

2
There are a few studies that have investigated environmental concerns within the hotel
industry, but the majority of them focus on hoteliers’ attitudes or awareness (Bohdanowicz,
Simanci, & Martinac, 2005; Bohdanowicz, 2006; Harris & Crane; 2002; Kirk, 1998; Claver-
Cortés, Molina-Azorín, Pereira-Moliner, & López-Gamero, 2007) and driving forces towards
green practices of the hotel industry (Bohdanowicz, Churie-Kalhauge, & Martinac, 2001; Claver-
Cortés et al., 2007; Enz & Siguaw, 1999; Tzschentke, Kirk, & Lynch, 2004). In fact, the
perspective of hotel employees regarding green practices has gone virtually uninvestigated even
though the success of implementing green practices will largely be achieved by employees
(Jesitus, 1992; Kirk, 1995; Ramus & Steger, 2000).
Problem Statement
Although studies on green concerns in industry have proliferated, two major research
gaps exist in regards to the hotel industry. First, the majority of studies on green practices have
focused on manufacturing operations; the hotel industry as a whole should be investigated as it
has a unique set of circumstances and challenges that could likely yield differing results. (Chung
& Parker, 2008; Foster, Sampson, & Dunn, 2000; González & León, 2001; Maxwell,
Rothenberg, Briscoe, & Marcus, 1997; Stabler & Goodall, 1997; Vastag et al., 1996). Green
practices of hotels differ from those of manufacturing on two levels: (1) generally, hotels tend to
be more labor intensive than the manufacturing firms. Labor intensive in this context implies
that hotels heavily rely on manpower to exercise green practices (Foster et al., 2000).

3
Additionally, the amount of natural resources used at work by the employees is not predictable,
unlike the machines of the manufacturing industry, and (2) the operational nature of the hotel
business, open 365 days per year, expects more natural resources consumption than
manufacturing firms do. Therefore, it is essential to examine green practices in the hotel
industry specifically.
Second, there is a need to examine how hotel employees perceive green practices in order
to better understand application of green practices to the hotel industry. Previous studies have
not examined the employees’ perspectives on green practices, but have instead focused on guest
perceptions (Gustin & Weaver, 1996; Goldstein et al., 2008; Manaktola & Jauhari, 2007) and
attitudes of managers (Bohdanowicz, 2005; 2006; Claver-Cortés et al., 2007; Kirk, 1998).
Meanwhile, researchers suggest that employee perception or attitude towards green activities
may affect the organization’s ultimate green performance (Daily & Steiner, 2001; Perron, Côte,
& Duffy, 2006).
Also, employees lead the way to success by not only creating a green culture (Fineman,
1996; Govindarajula & Daily, 2004; Newton & Harte, 1997) but being one of the crucial
elements to having a greener hotel industry considering that they demonstrate hands-on green
activities in the work environment (Daily & Huang, 2001; Jesitus, 1992; Murillo-Luna, Garcés-
Ayerbe, & Rivers-Torres, 2007). Therefore, understanding how hotel employees perceive green
practices is not only critical in implementing successful green programs but also an essential
element to consider when developing appropriate plans and evaluating capabilities in order to
remain competitive in the hotel market of the future.
4
Research Questions and Objectives of the Study
The aim of this study is to examine green practices from the perspective of hotel
employees. This study will specifically focus on green practices in terms of importance and
performance as perceived by hotel employees, the relationship between organizational
commitment and green practices, and demographic factors in order to examine and evaluate
employees’ green perception at work. These research focuses will be maintained in the three
main research questions listed below.
1. How do hotel employees perceive green practices?
1.1. Does a gap exist between importance and performance level on green
practices from the perspective of hotel employees?
• Do the employees think that green practices are important?
• How do the employees evaluate the performance of green practices
implemented by the hotels?
2. Do green practices relate to organizational commitment?
3. Are the green perceptions at work different based on the employee’s
demographic characteristics?
This research was conducted to answer the research questions above and examined the
perception of hotel employees regarding green practices. Specifically, this study has the
following objectives:

5
1. To examine green practices in terms of importance from the perspective of the
hotel employees.
2. To evaluate green practices in terms of performance from the perspective of
the hotel employees.
3. To examine the relationship between organizational commitment and green
practices.
4. To investigate whether the employee’s green perceptions at work are different
based on the demographic characteristics of employees.
5. To recommend Human Resource Management (HRM) approaches for hotels
involved in green practices.
Definition of Terms
Ecolodge: A lodging establishment that is located in natural areas
(Osalnd & Mackoy, 2004; Russell, Bottrill, & Meredith,
1995).
Green Practices: Internal efforts or activities of a hotel to implement
environmentally friendly practices towards the goal of
becoming a green facility.

6
Green Dimensions: Four functional areas of green practices consisting of
energy efficiency, water conservation, waste reduction and
air quality (Bohdanowicz, 2005).
Green Hotel: An environmentally sensitive hotel that operates its
business in a manner that minimized degradation of the
environment (Iwanowski & Rushmore, 1994; Kirk, 1995).
Indoor Air Quality: The quality of air inside buildings as expressed by
concentrations of pollutants and the thermal conditions that
affect the health, comfort, and performance of the
occupants (U.S. Environmental Protection Agency, 2009).
Organizational Commitment: An attitude as highly perceived support of employees
and a strong sense of emotional attachment to the
organization which may lead to better job performance
(Eisenberger, Fasolo, & Davis-LaMastro, 1990).
Organization of the Study
This study is composed of five chapters. Chapter one presents an introduction of the
study and identifies the goal and objectives of research. Chapter two consists of three main
parts. Part one reviews literature on the background of green practices in the hotel industry
including definition, catalyst and challenge of green practices. Then, the second part presents

7
literature on the dimensions of green practices, specifically in the area of energy efficiency,
water conservation, recycling and clean air. Finally, part three recapitulates literature about (1)
the relationship between organizational commitment and green practices, and (2) people’s green
perceptions as they relate to their demographic characteristics. In addition, this chapter
summarizes deductions made in literature on each subject and proposes relevant hypothesis.
Chapter three explains the methodology employed in the study. Chapter four illustrates the
results of the data analysis. Chapter five provides the discussion of the results in relation to
previous findings and elaborates the conclusion of the study with the implications of the
research, its limitations, and suggestions for future research.

8
CHAPTER TWO: LITERATURE REVIEW
Introduction
The following chapter provides an overview of the existing literature on the hotel
industry’s green practices presented in three parts: (1) background of green practices, (2)
dimensions of green practices, and (3) organizational commitment and demographic factors as
they relate to green practices.
Specifically presented in part one is a review of literature regarding (1) the definition of
green practices, (2) the catalyst of green practices, and (3) the challenge of green practices
deployment. The second part identifies the dimensions of green practices from environmentally
friendly activities literature, specifically focusing on the area of energy efficiency, water
conservation, recycling, and clean air. The third part of this chapter presents a review of
literature discussion on: (1) the relationships between organizational commitment and green
practices and (2) employees’ demographic characteristics to predict their green perception at
work. Finally, a brief summary of the literature review for each main subject ends with the
author’s proposed hypotheses.

9
Part One
Background of Green Practices
Definition of Green Practices
Currently, the term “green” is used to signify “environmentally friendly” (Shrum,
McCarty, & Lowrey, 1995) when, in fact, it is much more than that. One of the important
aspects that should be understood about green practices is that the range of the term “green” is
broad and varying based on perspective. From an economic management point of view, Gupta
(1995) defines “greening” as corporate environmental performance in meeting stockholders’
expectations. Shrivastava (1995) views environmental management as a tool to fit into a social
and ecological system. Further, Gupta and Sharma (1996) define green practices as
environmentally friendly management principles in which executive levels convert natural
resources into better outputs or products.
In the hotel industry, practices associated with green concerns are diverse; they may
encompass a variety of activities from pollution prevention to stakeholders’ education regarding
these activities. However, for the purpose of the study this research views green practices as
internal efforts or activities of a hotel to implement environmentally friendly practices towards
the goal of becoming a green facility.
In general, the term “green facility or hotel” can be used interchangeably with or
synonymously for “an environment friendly hotel,” “an eco-friendly hotel,” or “a sustainable

10
hotel.” During the last few decades it has become a common phenomenon to focus on the
environmental impact of the hotel industry with each hotel striving to achieve environmental
sensitivity even though there is no universally agreed upon definition of a green hotel (Harris &
Crane, 2002). This has not stopped academics, governmental agencies and nonprofit
environmental organizations from introducing their own definitions. For instance, some scholars
define a green hotel as an environmentally sensitive hotel that operates its business in a manner
that minimizes degradation of the environment (Iwanowski & Rushmore, 1994; Kirk 1995). The
specific areas of focus are energy efficiency, recycling, water conversation, and clean air
practices (Bohdanowicz 2005; 2006; Bohdanowicz et al., 2001; Bohdanowicz, & Martinac,
2007; Coalition for Environmentally Responsible Economics [CERES], 2001; Department of
Environmental Protection of Florida, 2009; Fisher, 2003; Iwanowski & Rushmore, 1994; Kirk,
1995; Scanlon, 2007; Shanklin, 1993; Stipanuk, 1996; Welford, Ytterhus, & Eligh, 1999;
Withiam, 1993). Similarly, Manaktola and Jauhari (2007) define a green hotel as a lodging
facility committed to ecological practices such as saving of water, energy and waste.
Interestingly, several states including Florida, Pennsylvania, Michigan, and California
have introduced definitions of a green facility in order to encourage or reinforce green practices
by hotels in their states. Such definitions are worth mentioning as they might provide a more
practical view of what a green hotel should be. According to the state of Pennsylvania, green
hotels are defined as properties which are managed utilizing environmentally friendly business
procedures (Department of Environmental Protection of Pennsylvania, 2008), which include
policies and procedures as well as activities such as water and energy conservation and waste

11
reduction. The state of Florida characterizes a green hotel as an environmentally conscientious
facility that pursues water conservation, energy efficiency, recycling (waste reduction), clean air
practice and communication with stakeholders (Department of Environmental Protection of
Florida, 2009).
Nonprofit organizations such as the International Tourism Partnership (ITP), which
evolved from International Hotels Environmental Initiative (IHEI), and Zero Waste Alliance
(ZWA) have also attempted to define a green hotel. According to Alexander (2002), a green
hotel is defined as a property which strives to pursue environmentally friendly business
disciplines through energy efficiency, conservation of water and reduction of waste.
Based on these various concepts of what comprises a green hotel, this study utilizes the
definition of focuses on the following: a green hotel as one that must practice certain functional
or operational tasks in the areas of energy efficiency, water conservation, recycling (waste
reduction), and clean air (air quality control) (Bohdanowicz, 2005).
Catalyst of Green Practices
Despite the popularity of being an environmentally responsible hotel, the driving force
behind it is arguable (Tzschentke et al., 2004). In fact, conventional literature most often
explains the motivations of green practices in the context of Corporate Social Responsibility
(CSR) or awareness at the management level (Hass, 1996; Hussain, 1999; Tzschentke et al.,
2004). While CSR and awareness are imperative factors, evidence from previous studies have
identified three major motivations for green practices within the hotel industry (Chan & Wong,

12
2006; Claver-Cortés et al., 2007; Enz & Siquaw, 1999; González & León, 2001; Iwanowski &
Rushmore, 1994; Kirk, 1995; 1998; Mensah, 2004; Post & Altmanm, 1994; Tzschentke et al.,
2004).
The first driving force involves current pressures or regulations of government towards
green practices (Chan & Wong, 2006; Kirk, 1995; 1998; Mensah, 2004; Tzschentke et al., 2004).
Demands of government or regulations that encourage being green have pressured the hotel
industry. For instance, effective in 2008, Florida state agencies have been required not to hold
meetings or conferences with hotels unless the properties have adopted green practices
(Department of Environmental Protection of Florida, 2009). In extreme cases, some countries
such as Australia and New Zealand impose financial penalties for a property’s non-compliance
to green policies (Mensah, 2004).
The second driver involves monetary benefits or financial gains that can be realized from
green practices (González & León, 2001; Iwanowski & Rushmore, 1994; Mensah, 2004;
Tzschentke et al., 2004). Many hotel organizations have reported financial benefits resulting
from being green. Hyatt Regency Chicago, for example, reported that the property saved
$120,000 through recycling hotel items (Enz & Siquaw, 1999). Similarly, the Westin hotel in
Seattle announced that it reduced its energy consumption by sixty six percent which is equivalent
to $400,000 annually by using energy efficient appliances (Mensah, 2004). In another example,
the Hyatt Regency International Hotel in New Zealand installed an energy saving system. The
cost of the system was $16,000, yet in only a 14-month period, a savings of $14,000 was realized
(Alexander, 2002).
13
The third motivation for hotels adopting green practices is fostering positive public
relations and marketing (Florida Green Lodging Conference, 2008; Kirk, 1995; 1998; Claver-
Cortés et al., 2007; Tzschentke et al., 2004). The term “green hotel” aids in attracting more
business based on various reports which show that corporations want to hold their business
meetings at green hotels. According to Mensah, (2004) the number of firms that considered
green facilities for their meetings spaces increased by 10 percent between 1997 and 1998. This
significant growth in attention paid to green practices in the hotel industry is clearly
demonstrated in the case of the Saunders Hotel Group which estimated that its promotion of the
term “green practices” contributed to bringing over $2 million of new group business
(Glanzrock, 1995).
In addition, the number of consumers pursuing a greener lifestyle has been increasing
(Bohdanowicz, 2005). Roberts (1996) notes that green consumers are different than other when
shopping; they look out for green products (Phillips, 1999). For the hotel industry, green
consumers are imperative as they choose a green facility when traveling. Heung, Fei, and Hu
(2006) found that guests in China were willing to stay at a green hotel although they were
uncertain about what a green hotel should be. Also, Manaktola and Jauari (2007) suggest that
hotels’ green practices influence consumers choosing a hotel for their staying. Gustin and
Weaver further (1996) suggest that travelers support hotels’ green practices. Consequently,
marketing plans targeting these green consumers are an opportunity for the hotel industry.
Importantly, the hotel industry is one of the most energy-intensive sectors of the
hospitality industry; it expels large amounts of solid waste (Bohdanowicz, 2006). Also, in many

14
cases hotels employ landscaping practices that pollute local water systems by causing erosion
and soil degradation (Scanlon, 2007). Even hoteliers admit that hotels have a significant impact
on the environment (Bohdanowicz, 2005) which makes green practices essential rather than
optional.
To date, no comprehensive data measuring the U.S. hotel industry’s negative impacts on
the environment has been generated. However, Sustainable Travel International (STI) estimates
the average total amount of carbon dioxide emissions per typical hotel room, which is
approximately 300 square feet based on the U.S. Energy Information Administration’s lodging
category. According to the computation of STI, a typical hotel room in the U.S. emits
approximately 33.6 pounds of carbon dioxide annually and consumes 29.3 Kilowatt-hours of
energy per square foot. In European hotels, a typical hotel annually anticipates emitting between
160 and 200 kg (about 352 to 440 pounds) of greenhouse gas per room depending on the fuel
used to generate electricity, heating, or cooling. (Bohdanowicz et al., 2005).
In the study of European hotels’ green practices, Bohdanowicz et al. (2005) also
demonstrate that guests consume up to 440 liters (about 117 gallons) of water and produce 1 kg
(about 2.2 pounds) of waste per night. The alarming fact regarding resource consumption by the
hotel industry is that its resource usage impacts the community in which its organizations
operate. For instance, the water needed for a single standard hotel room in some developing
countries such as the Philippines is equivalent to the amount of water that supports at least ten of
its local people (Alexander, 2002). These figures emphasize the fact that the hotel industry not

15
only must implement green practices to minimize negative effects on the environment but also
take social responsibility through them.
Challenges of Green Practices Deployment
Although green practices are widely accepted by the hotel industry, there are still some
challenges in implementing green practices in the industry that need to be examined in order to
move green practices forward. As discussed, there is the lack of a universally or widely accepted
definition of green practices (Harris & Crane, 2002). Consequently, confusion may arise
between a green hotel fulfilling its ultimate goal of green practices and some synonymous terms.
For example, a green hotel and an ecolodge may be confusing due to the similarity of the terms.
Although these two concepts commonly embrace green initiatives into their operations, an
ecolodge clearly differs from a green hotel for the following two reasons. First, an ecolodge is a
nature dependent lodging facility (Osland & Mackoy, 2004; Russell, Bottrill, & Meredith, 1995).
In other words, ecolodges are lodging establishments that are located in natural areas: in contrast,
a green hotel does not have to be nature dependent. Second, ecolodges are considered as a
segment of ecotourism (Osland & Mackoy, 2004; Weaver & Lawton, 2002; Wight, 1997) while
green hotels are not. Rather, they are business operations that incorporate a green philosophy
into their managing system.
Additionally, there are some doubts in terms of the financial impact of green practices
among practitioners. Bohdanowicz (2006) points out in the study of managers’ perceptions in
European hotels that doubts have been raised regarding financial effectiveness of green practices
16
because the functional attributes of green practices are highly related to installation of new
technologies or systems that increase costs. However, several case studies indicate the fact that
the cost of new systems will be offset by savings in water, energy and waste reduction costs
within a few years (Claver-Cortés et al., 2007; Iwanowski & Rushmore, 1994). According to a
case study of five properties in Jamaica (Meade & Pringle, 2001), green practices significantly
reduced the hotels’ water and energy consumption and paid off the installation costs in a short
period of time. It also illustrated that the payback period for the initial investment is
approximately two years with about 150 % return on investment (ROI) (Meade & Pringle, 2001).
In addition, it should be noted that savings via green practices are continuous (Meade & Pringle,
2001).
Another point is that the hotel industry has expressed concerns regarding decreasing
service standards. Some green practices may present an impression of compromised quality
(Bohdanowicz et al., 2001; Bohdanowicz, 2006; Heung et al., 2006; Kirk, 1995). In fact,
Dagmar (1994) notes that conservation practices such as using shampoo dispensers may reduce
waste, but may be contrary to guest expectations of indulgence and comfort. This concern,
however, is not realized in actual hotel guests’ research. According to the North America Hotel
Guest Satisfaction Study by J.D. Power & Associate (2007), seventy three percent of respondents
- hotel guests - indicated that they were willing to participate in green practices.

17
Part Two
Dimensions of Green Practices
For the purposes of this study, green practices in the hotel industry are divided into the
following four functional / operational areas (Bohdanowicz, 2005): (1) energy efficiency, (2)
water conservation, (3) recycling, and (4) clean air. These are the areas of operations that the
majority of hotels currently embrace, and according to studies on green practices in the hotel
industry they are also identified as environmentally friendly solutions that are easily
implemented by hotel organizations (Alexander, 2002; Bohdanowicz et al., 2001; Bohdanowicz,
2005,2006; Bohdanowicz & Martinac, 2007; CERES, 2001; Department of Environmental
Protection of Florida, 2009 ; Department of Environmental Protection of Pennsylvania, 2008;
Fisher, 2003; Green Hotel Association, 2009; Heung et al., 2006; Iwanowski & Rushmore, 1994;
Kirk, 1995; Manaktola & Jauhari, 2007; Scanlon; 2007; Shanklin, 1993; Stipanuk, 1996; Trung
& Kumar, 2005; U.S. Environmental Protection Agency [EPA], 2007; Withiam, 1993; Welford
et al., 1999). Each dimension is explained below.
Energy Efficiency
Due to its nature – providing comfort and service to guests – the hotel industry is one of
the most energy consumptive industries (Bohdanowicz et al., 2001). Although in hotels the level
of energy usage varies based on types, size, age of the facility and/or the number of rooms, in
18
general, the cost of energy per available room in both hotels and motels in the United States is
approximately $2,196 annually which represents roughly 6 percent of all hotel operation costs
(U.S. EPA, 2007). Positively, green practices that promote energy efficiency for hotels generally
results in a 10 to 25 percent reduction in expenditures on energy when using energy efficient
equipment (Blank, 1999; Heung et al., 2006); this would be a savings of nearly $20,000 per year
for a typical hotel size of 100,000-ft2 (U.S. EPA, 2007).
In a report comparing hotels in six different countries, Bohdanowicz et al. (2001) found a
positive correlation between outdoor climate and overall electricity use of hotels. Since most
hotels use the majority of their electrical energy for air conditioning and heating, hotels have
gained financial benefits by implementing more energy efficiency programs for their heating and
cooling systems. This is evidenced in the case of Habitat Suites in Texas which saved $10,954
per year by controlling air-conditioning units of the hotel (Mensah, 2004).
Lighting can account for seven to twenty percent of total energy consumption for a hotel
depending on the size and age of the property as well as maintenance and operating procedures
(Bohdanowicz, 2006). However, lighting is a typical expense that has considerable saving
potential and is the easiest area to implement energy savings initiatives. Installation of new
equipment such as fluorescent lights would be costly, but the benefits should be realized not on
the initial cost but on the entire life cycle (Bohdanowicz, 2006). The savings are resulted
because fluorescent lamps can last eight to ten times longer than incandescent lamps, and
compact fluorescent light bulbs can be lasted 12 months longer than incandescent light products
(Alexander, 2002). A retrofit of energy efficient devices typically pays for itself in a very short

19
period of time. For instance, according to Alexander (2002), the Sheraton Tacoma Hotel
changed from incandescent lights to compact fluorescent lights producing a cost savings of
$15,000 in 18 months.
Water Conservation
The U.S Geological Survey (2008) indicates that water availability has become an
important concern in the United States, primarily for the hospitality industry. Shanklin (1993)
claims the availability of safe water dramatically affects the hospitality industry. Further,
Hankinson (1992) categorizes water supply use into two sources for the restaurant sector of the
hospitality industry, pure water for food and non-potable for cleaning uses. This implies that
water conservation activities should be practiced in all areas of hospitality operation.
In addition, Alexander (2002) relates the concerns of water availability to social
responsibility that the hotel industry can take. In the cases of water conservation by hotels in
developing countries, he describes how the amount of water consumed by hotels effects local
communities. For example, for one single standard hotel room in the Philippines water
consumption is about 396 gallons per day, and this amount of water can support fourteen people
at their current standard of living. It is even more alarming that it is predicted that water
consumption is expected to increase by over 20 % to approximately 475 gallons per day by 2010
in luxury facilities in some developing countries (Alexander, 2002).
In the hotel industry, water consumption is influenced by several factors such as the type
and size of the facility, the services that facility offers and guest nights sold (Bohdanowicz,

20
2006; Bohdanowicz & Martinac, 2007). It is reasonable to assume that water consumption will
vary based on the property type. For instance, water consumption at full service luxury resorts
providing services such as spas and swimming pools will differ greatly from more economically
based hotels. Such water dependent services have a significant influence on water consumption
(Bohdanowicz & Martinac, 2007). Waggett and Arotsky (2006) specifically note in their
research that water consumption in the hotel industry is strongly related to “star” ratings of
hotels. In a study of a Vietnamese hotel, Trung and Kumar (2005) also reveal that four-star
hotels consume more water than three-star hotels. Based on accommodation sectors, water
consumption can be figured differently; however, importantly, every hotel type incurs a cost and
has an environmental impact regardless of the rating of hotels.
Among water conservation practices, towel and linen reuse programs have already been
widely adopted by hotels. AH&LA’s current green assessment survey (2008) revealed that
nearly ninety percent of respondents’ properties have implemented towel and linen reuse
activities. According to the Green Hotel Association’s (GHA) report (2009), over seventy
percent of hotel guests participate in such programs. Significantly, these linen reuse programs
not only contribute to water conservation but also reduce detergent use and, hence, reduce the
industrial detergent related chemicals released into the environment. As most water
consumption occurs in hotel rooms, water efficient fixtures such as low flow showerheads can
significantly contribute to water conservation (Bohdanowicz, 2006). For instance, the Habitat
Suites Hotel in Texas installed low-flow showerheads and aerating faucets in the property. The
result was a savings of nearly $10,000 per year (Mensah, 2004).

21
For some hotels, such as the Willard InterContinental Hotel in Washington DC, water
conservation does not solely mean financial benefits. This hotel expands water conversation
practices to a different level of social responsibility by using its saving from linen reuse
programs to clean rivers such as Anacostia River (Houdré, 2008). By practicing this type of
green programs, it has succeeded in focusing the communities’ attention on environmental
protection.
Recycling
Although the quantity of waste generated by hotels is influenced by factors such as
occupancy rate or type of property (Shanklin, Petrillose, & Pettay, 1991), one advantage of waste
reduction practices is that hotels can recycle as much as 80 percent of the wastes produced
(California Integrated Waste Management Board [CIWMB], 2009). Currently, waste generation
is as high as 30 pounds per room per day within the hotel industry (CIWMB, 2009).
Financial gains, as well as minimizing negative environmental impact, would be
predictable as a result of waste reduction practices. Heung et al. (2006) emphasize that solid
wastes can be dramatically reduced in the hotel industry which would result in financial gains.
For example, the Westin San Francisco Airport Hotel reports that the hotel saves twenty-two
tons of solid wastes and $6,000 annually since the property started waste reduction activities in
1994 (Alexander, 2002). Waste reduction programs also abate negative impacts on the
environment by averting toxic waste from landfills (Okazaki, Turn, & Flachsbart, 2008; Shanklin
et al., 1991)

22
Waste reduction involves different types of materials including paper, food and glass
(Alexander, 2002). Among the many components, food waste makes up nearly 50 percent of all
waste production (Alexander, 2002; CIWMB, 2009); unfortunately. programs to reduce food
waste have not effectively penetrated the hotel industry. This current phenomenon involving
food waste reduction is certainly evidenced in the Green Assessment Survey (AH&LA, 2008)
and the reports of states, specifically California (CIWMB, 2009). The Green Assessment Survey
(2008) identifies food waste reduction as one of the areas that the industry needs to improve
upon. Additionally, the state of California reports that two percent of its food waste comes from
the hotel industry in California (CIWMB, 2009).
The significant point is that the high percentage of food waste produced by the hotel
industry has not decreased even though hospitality organizations are recognizing green practices
increasingly. In fact, the result from a waste generation study examining 25 hotels from 1991 to
1993 revealed that food waste comprised 46 percent of the hotels’ total waste (Alexander, 2002).
Unfortunately, the figures on food waste have not changed since then and most food waste is still
not recycled or composted according to a current study of food waste in the hospitality industry
(Okazaki et al., 2008).
Possible justifications for the high percentage of food waste produced by the hotel
industry include three points of view. First, although food waste can be greatly reduced by such
an activity as food donation (Alexander, 2002; Bohdanowicz, 2006), it is controversial and
frequently prohibited by local regulations governing sanitation (Bohdanowicz, 2006). The
second contributing factor to food waste is related to the nature of the cooking process itself. In

23
the kitchen, over-preparation, cooking losses or packaging failures quickly lead to the
accumulation of food waste (Bohaanowicz, 2006). Third, food waste reduction activities involve
continuous observation and are time-consuming (Okazaki et al., 2008). Reduction efforts for
other types of solid waste such as non-waxed paper products, cans or plastic are relatively
undemanding as compared to food waste reduction. Unlike the efforts to reduce solid wastes,
food waste reduction involves additional time and effort by kitchen staff members because the
effectiveness of food waste reduction efforts mandates constant monitoring of the food
inventory, the amount of food per a meal and the percentage of waste per meal (Okazaki et al.,
2008)
Although not many successful cases for food waste reduction were reported, there are a
few cases that represent what should be done in order to benefit from food waste. For example,
the Totem Pole Restaurant in Minnesota reduced its food waste by 20 percent and over $5,500
annually was saved by kitchen personnel who constantly monitored food inventory as described
above (Alexander, 2002). It should be noted, however, that these activities will not eliminate
food waste completely, but they will significantly reduce the amount of food waste produced.
Various strategies referred to as the concept of “R” – reuse, recycle and replace (Heung et
al., 2006) to mitigate waste have been implementing in the hotel industry. Although examples of
impressive “R” strategies have been highlighted in trade journals, the articles did not seem to
fully investigate waste reduction in the hotel industry (Hayward, 2008; Vermillion, 2008).
Additionally, Okazaki et al. (2008) conducted research pertaining to waste practices in
Hawaii. It demonstrates that the number of employees participating in waste reduction practices

24
and the effectiveness of waste reduction has a weak correlation. Based on the study, it is logical
to assume that waste reduction practices in the hotel industry require education or awareness
among all involved, especially employees and guests (Trung & Kumar, 2005). Energy and
water conservation practices are more reliant upon technology and the organizations’ financial
ability to initiate them; on the other hand, the success of waste reduction practice is based on the
participants’ efforts (Olli, Grendstad, & Wollebaek, 2001) and their willingness to participate in
waste reduction activities.
Clean Air
The U.S. Environmental Protection Agency (EPA) (2009) defines indoor air quality as
the quality of air inside buildings as expressed by concentrations of pollutants and the thermal
conditions that affect the health, comfort, and performance of the occupants. It also considers
the factors of an enclosed environment such as temperature and relative humidity. Some
researchers claim that the hospitality industry may not be at the front line in causing air pollution
(Kirk, 1995); yet, this perspective has changed as lodging properties do produce toxic air
pollutants and ozone-depleting substances such as chlorofluorocarbons that can be released by
the improper maintenance of heating, ventilation, and air conditioning units (U.S. EPA, 2009).
As the market becomes more competitive, projects of a hotel such as renovation,
expansion and maintenance of the facility become more prevalent in the hotel industry; this
results in an increased awareness of negative influences on air quality (Cascardo, 2007). A
current report indicates that ninety-three percents of hotel guests prefer a room with better

25
quality of indoor air illustrating its importance to the guest (Vermillion, 2008). Choosing
environmentally friendly and non-toxic cleaning products, especially in the area of
housekeeping, is strongly recommended for air quality improvement.
The primary reason for controlling air quality in lodging facilities is related to human
health (Shanklin, 1993). The most prevalent focus for air quality of green practices is non-
smoking policies. The motivation for no-smoking policies exists for the well-being/health of
guests and employees; apparently, the policies are the most prominent operational initiative
contributing to improving air quality in the hotel industry (Suttell, 2005), although it still remains
somewhat controversial due to the economic impact of a smoking ban.
Studies of non-smoking policies in areas such as consumer perception, health problems
of employees, and the economic impacts of a smoking ban have been performed. According to
Biener and Fitzgerald (1999) who investigated perceptions of non-smokers in public places
where smoking is permitted such as a restaurant, seventy six percent of 4,929 respondents in
Massachusetts were bothered by tobacco smoke. Forty-six percent of the respondents were non-
smokers and avoided smoking places due to unpleasant smell and the concern of health issues
from secondhand smoke. Repace (2004) expanded the smoking issue to address the health
concerns of hospitality employees. The research examined indoor air quality before and after a
smoking ban in eight hospitality establishments in Delaware. The study (2004) found that indoor
air quality among hospitality establishments was poorer than other places because ventilation
rates were very low. After no smoking policies were enacted, indoor air quality levels in all
eight businesses had significantly improved. Repace (2004) also illustrated that secondhand

26
smoke comprised nearly ninety percent of the particle air pollution and almost eighty-five
percent of the carcinogenic polycyclic aromatic hydrocarbons (PPAH) which influence
increasing the risk of respiratory disease, heart disease, and stroke (Repace,2004; U.S. EPA,
2009). Repace (2004) concluded that having a no-smoking policy eliminated most of the
pollution hazard in the hospitality industry and greatly improved the working environment.
Additionally, Scollo, Lai, Hyland, and Glantz (2003) reviewed the economic impacts of
no-smoking policies in segments of the hospitality industry and suggested that policymakers
should protect employees and patrons from toxins by reinforcing a smoking ban because there
are no negative economic impacts of smoking bans involved in hospitality organizations.
However, as mentioned earlier, there are other causes of poor indoor air quality, for instance
poorly designed, maintained or operated ventilation system are primary areas of focus because
mold, bacteria and other biological contaminants can quickly spread if the ventilation system is
not properly maintained or operated (Cascardo, 2007).
Green certified cleaning products such as “Green Seal” improve indoor air quality and
reduce emissions of volatile organic chemicals (Department of Environmental Protection of
Pennsylvania, 2008; Garrison, 2009). Some challenges accompany the use of these products
such as the effectiveness of these cleaners and their higher price. Regardless of these challenges,
green products certainly contribute to improving air quality by reducing toxic emissions
(Iwanowski & Rushmore, 1994).
Ironically, the tactics for improving indoor air quality may be problematic and could
contradict energy efficiency practices. Although one of the easiest methods to increase energy

27
efficiency is reducing the electricity consumption by controlling the indoor temperature that is
not being used, this type of activities could create ventilation problems which lead to spreading
mold or bacteria. In order to handle this type of quandary, a well structured energy management
routine and monitoring system are suggested (Bohdanowicz et al., 2001).
Part Three
Organizational Commitment
The concept of employee commitment is multidimensional and takes various forms
(Collier & Esteban 2007; Iles, Mabey, & Robertson, 1990; Meyer & Herscovitch, 2001)
including trust, feelings of affiliation (Eisenberger, Fasolo, & Davis-LaMastro, 1990) and loyalty
(Iles et al., 1990). Eisenberger et al. (1990) describe commitment as highly perceived support
from employees and a strong emotional attachment to the organization which may lead to better
job performance. Meyer and Herscovitch (2001) affirm that commitment should be
distinguished from motivation and general attitude. According to them, commitment is a force
which creates an individual’s connection to the organization and improves employee
performance (course of action) which makes the firm better.
Although commitment has been defined in many different ways (Meyer & Herscovitch,
2001), this study accepts that employee commitment has two main constructs: behavioral and

28
attitudinal commitment (Mowday, Steer, & Porter, 1979; Mottaz, 1989). Behavioral
commitment refers to the degree to which an employee performs beyond normal expectations to
connect himself/herself to the organization (Mottaz, 1989). Attitudinal commitment refers to the
degree to which an employee identifies with the goals and values of the organizations (Mottaz,
1989). Attitudinal commitment specifically is related to the employees’ perceptions of the
organization’s fairness (Collier & Esteban, 2007) in return for rewards, recognition or promotion
(Becker, 1960). It is important to understand commitment correctly because commitment,
specifically attitudinal, is related to employees’ behavioral characteristics such as performance,
turnover and absenteeism (Meyer & Herscovitch, 2002).
Aguilera, Rupp, Williams, and Ganapathi (2007) note that employees’ perceptions of the
company’s social responsibility (CSR) shape their attitudes and behaviors toward the firm.
Based on the authors, organizations’ social responsibility activities are critical to determining the
virtue of the organization and contribute to defining the level of social justice towards their
employees. Therefore, the company acting socially responsible is an essential matter to
employees. Overall, the previous studies that addressed the association of employee
commitment and CSR indicate that a socially responsible company has positive effects on its
employees’ commitment level (Aguilera et al., 2007; Burke & Logsdon, 1996; Maignana,
Ferrell, Hult. 1999; Peterson, 2004), and a positive corporate image will attract qualified
candidates for employment (Riordan, Gatewood, & Bill, 1997). Those candidates take that
corporate image into account when considering employment offers (Albinger & Freeman, 2000;
Backhaus, Stone, & Heiner, 2002; Greening & Turban, 2000; Turban & Greening, 1997).
29
One of favorable rationales posited for this is the social identity theory (Ashforth & Mael,
1989) which states that employees will increase their self-worth/self-confidence by identifying
with a company that is socially responsible (Peterson, 2004). Another possible underlying
principle for this is that commitment is influenced by employees’ perceptions; favorable
perceptions of CSR is related to stronger employee commitment (Peterson, 2004).
In the framework of CSR constructs Burke and Logsdon (1996) propose five dimensions
of CSR: centrality, specificity, proactivity, voluntarism and visibility. Among these five
dimensions, they claim that CSR is a visible action for employees; it will not only retain
employees but also increase job performances by improving employees’ morale and loyalty.
Similarly, in the framework of antecedents of CSR, Maignan et al. (1999) posit that employee
commitment is one of the benefits of CSR. According to the researchers, CSR increases
employee commitment in two ways: (1) CSR is significant in improving the quality of workplace
experiences, and (2) CSR approaches critical social issues such as the environment that are of
concern to society as a whole.
The empirical evidence of Brammer, Millington, and Raton (2007) illustrates that an
employee’s perception of CSR has a positive relationship to employee commitment. To note,
specifically, females attached more importance to that relationship than males in the
investigation. In addition to academic empirical evidence, there are practical perspectives which
contend that CSR produces employee satisfaction. For example, Arthur. D. Little (2003), a well-
known management consulting firm, agrees that employee satisfaction is one of benefits that a
company can gain from CSR.

30
Apparently, the concept of organizational commitment in the single aspect of green
practices has not been fully investigated in academia (Aguilera et al., 2007; Albinger & Freeman,
2000; Backhaus et al., 2002; Collier & Esteban 2007; Davis, 1973; Greening & Turban, 2000;
Hussain, 1999; Maignana et al., 1999; Peterson, 2004; Turban & Greening, 1997) instead the
majority of hospitality journals applied green practices in the context of CSR (Lynn, 2008).
Organizations such as the Society for Human Resource Management (SHRM) have conducted
studies about organizational commitment in relation to the concept of green practices. In 2007,
SHRM conducted Green Work Place Survey to examine green practices in relation to HR issues.
According to the survey, forty-four percent of 429 HR professional respondents surveyed said
that the most prominent positive result by green practices was improving employee morale.
Also, a significant figure about this survey was that sixty-one percent of 504 employees who
were working for the companies that embrace green practices indicated that they were very likely
to stay with the organization because of their green programs.
Additionally, Insync survey (2008), which examined 14,000 employees from all types of
companies, demonstrated that a strong positive correlation existed between a company’s green
practices and employees’ commitment and job satisfaction. Similarly, Bohdanowicz et al.
(2005) examined over 3,000 employees who worked for Swedish Scandinavian hotels and found
that the employees were proud of their company for being green. Taking these collectively, it is
predictable that green practices have a positive influence on employee commitment.
31
Demographic Characteristics and Green Perception
After a review of the studies on demographics as indicators of environmental concerns,
the association between demographics and indicators of green concerns is quite low, and
empirical evidences of demographic influence on green concerns are split and inconclusive (Van
Liere & Dunlap, 1980). Despite the mixed result, using demographic characteristics as a
predictor of green perception is a popular tool for green consumer profiling because
demographic information is relatively easy to obtain (Diamantopoulos, Schlegelmilch,
Sinkovics, & Bohlen, 2003) and is considered an easy method to identify market segmentation
(Straughan & Roberts, 1999).
It is significant that the majority of studies on the green subject characterized that
demographic gears exist in the marketing field for consumer profiling, named the green
consumer (Bhate & Lawler, 1997; Diamantopoulos et al., 2003; Laroche, Bergeron, & Barbaro-
Forleo, 2001; Peattie, 2001; Roberts, 1996; Straughan & Roberts, 1999; Shrum et al., 1995).
Yet, after a review of previous studies using demographic characteristics as a predictor of green
concerns or green behaviors, one conclusion is apparent: the link between demographic variables
and green consciousness is inconsistent and inconclusive. Although demographics are a weak
factor to generalize people’s green perception, it is still worth to reviewing to better understand
green practices in the hotel industry.

32
Age and Green Perception
Given the variables of age and environmental concerns, several studies suggest that
younger people are more apt to be green (Fransson and Gärling, 1999; Straughan & Roberts,
1999; Van Liere & Dunlap, 1980; Klineberg, McKeever, & Rothenbach, 1998), and two
explanations are widely cited in the academic literature to support this claim. According to Van
Liere and Dunlap (1980), younger people appear to be more environmentally conscious because
“going green” might be seen as a threat to the existing social order in which they less participate.
They are liberal and can adopt green attitude without much resistance. Similarly, Straughan and
Roberts (1999) support the contention that the younger generation is more likely to embrace a
green attitude because environment degradation is a noticeable issue, and it is perceived that the
problem will be increased as they age.
In contrast, some studies suggest that older people display a more environmentally
friendly attitude. One explanation for the positive relationship between older age and green
behavior focuses on the ethic of conservation that was prevalent in the Depression era. Many
seniors today lived through the “Depression-era” and conservation was required to get through
the economic hardships (Samdahl & Roberston, 1989). In a literature review on this topic, it is
apparent that there is a non-significant relationship between age and green consciousness.
Gender and Green Perception
Studies using gender as an indicator of green concerns also show mixed results. Van
Liere and Dunlap (1980) review studies on this subject and conclude that there is no absolute

33
relationship of gender as a predictor for green behaviors. Despite mixed patterns displayed,
studies in general suggest that females are more environmentally friendly. Klineberg et al.
(1998) suggest that gender is a significant predictor of green concerns and cite that females are
more environmentally concerned than males. Also, Diamantopoulos et al. (2003) and Davidson
and Freudenburg (1996) suggest that females are more supportive and participate in the efforts of
being green. Similarly, Roberts’s empirical evidence (1996) illustrates that females are more
environmentally friendly due to some typically female gender roles such as housework, shopping
and recycling.
This predominantly female tendency to be green also shows that women support green
activities of government such as green regulations or green laws (Vaske, Donnelly, Williams, &
Jonker, 2001). Vaske et al. (2001) identify females as more environmentally oriented and
believe in supporting environmental regulation for forest preservation more than males do.
Meanwhile, the empirical evidence of Bhate and Lawler (1997) indicates that gender has no
significant impact on green behaviors. Furthermore, Arcury and Christianson (1990) find that
males have more green-related concerns than females.
Marital Status and Green Perception
Marital status has been less investigated than other demographic factors in terms of green
behaviors. Diamantopoulos et al. (2003), for example, suggest that there are no perceived
differences of green attitudes between married couples and unmarried individuals. On the other
hand, Loroche et al. (2001) find out that married couples, specifically married people with
34
children, are more willing to pay for purchasing green products, and presume the reason is that
married couples are more concern about the negative impacts on the environment because of its
impact on their spouses and their children. Macey and Brown (1983) expand positive green
behaviors to married couples’ lifestyles. According to them, married couples who own homes
are more energy conservative than married couples who do not own homes. Although there is
research regarding the relationship between green behaviors and marital status, it is hard to
confirm a relationship between the two.
Income and Green Perception
In fact, several studies support the belief that a higher income has a positive relationship
with green concerns (Arcury & Christianson, 1990; Van Liere & Dunlap, 1981). The
assumption that higher income levels have more green concerns is supported by the position that
higher income levels are likely to witness environmental problems because they are more
politically involved in organizations and enjoy more leisure (Diamantopoulos et al., 2003).
Klineberg et al. (1998) find that household income positively influences green behaviors and add
that higher income earners may have access to more information about the degradation of the
environment which naturally leads to green concerns.
In contrast, some research studies display a negative relationship between green concerns
and income (Samdahl & Robertson, 1989; Roberts, 1996). In fact, Olli et al. (2001) find that
lower income levels perform more environmentally friendly behaviors. Further, Diamantopoulos
et al. (2003) reveal no significant relationship between income and green concerns as did Roberts

35
(1996) who presumes that environmental degradation may spread widely among the public
regardless of income level.
Education Level and Green Perception
It seems that education and green issues exhibit a more consistent relationship than the
other demographic characteristics. In general, highly educated people are considered to be more
environmentally responsible because they presumably are more exposed to green information
(Klineberg et al., 1998). In Newell and Green’s (1997) examination of racial influence on green
concerns, the researchers find that higher education levels show more environmental concerns.
Vaske et al. (2001) also find that college-educated people are more concerned about negative
environmental impacts than those who are not. Unlike other studies cited, the examination of
Shrum et al. (1995) illustrates that the education factor and purchasing pattern of consumers for
green products are independent and are not associated. Similarly, Bhate & Lawler (1997) reveals
that social class factors such as education are non-significantly related to green behaviors.
Ethnicity and Green Perception
Several studies have examined the relationship between ethnicity and green issues
(Cutter, 1995; Greenburg, 2005; Howenstine, 1993; Mohai, 1990; Newell & Green, 1997;
Vaughan & Nordenstam, 1991), and by most accounts, there are differences between white and
non-white people concerning the environment (Greenberg, 2005). Howenstine (1993) suggests
that African-Americans are lacking in the area of recycling because they face social problems

36
such as drugs and crime. This claim continues to Newell and Green’s investigation (1997) which
reveals that, as a whole, African-Americans have less environmental concerns than White
Americans. However, the influence of race also demonstrates inconsistency as a predictor of
green concerns.
Interestingly, significance exists at higher income and education levels for race
categories. This investigation suggests that the level of education and income significantly
differentiates green concerns among African-Americans (Newell & Green, 1997). On the other
hand, income and education do not significantly affect attitudes among White Americans. In the
investigation of recycling behavior, Howenstine (1993) identifies that Asians perceive recycling
as too much work. This pattern is also evidenced in Greenberg’s study that examined people’s
environmental perception in New Jersey based on race. Greenberg (2005) finds that Asian and
Hispanic individuals exhibit less green behaviors than their Caucasian and African-American
counterparts. More specifically, Asians are the least concerned and interested group as far as
green concerns and behaviors. In his investigation, African-American and Hispanic people
perceive that stronger government regulations for the environment are needed. However, both
groups demonstrate low support for sacrificing economic growth for environmental protection
(Greenberg, 2005). These findings were explained by suggestions that these groups are
relatively in more economic difficulty than White or Asian respondents. Also, it was found that
Hispanics who speaks Spanish have adopted fewer green issues than Hispanics who speak
English.

37
Unlike previous studies which introduce differences between race and green concerns,
Mohai (1990) suggest that Whites and African-Americans have no difference in environmental
concerns. Also, Mohai and Bryant (1998) find little evidence to support the existence of
differences between White and Black Americans in perceiving green issues. They rather suggest
that African-Americans are more concerned about local environmental problems than White-
Americans.
As previously mentioned, relationships between demographic characteristics and green
perception are inconclusive and weak. However, it should be noted herein that in order to expect
a more consistent result of green perception by using demographic characteristics, it is suggested
that demographic factors can be combined with psychological and situational factors (Bhate &
Lawler, 1997; Shrum et al., 1995).
Summary and Conclusions
In summary, although green practices are widely embraced by hotel firms, one of the
major challenges is that there is no globally accepted definition of green practices. However, it
seems that literature, government and nonprofit organizations commonly include one major
concept as they discuses green practices. That is that green practices should contain functional
or operational green activities in the areas of energy efficiency, water conservation, recycling
(waste reduction), and clean air (air quality control). Consequently, this study defines green
practices for the hotel industry as internal efforts or activities of a hotel’s pro-environmental

38
practices to be a green hotel. Furthermore, as mentioned earlier, there are some challenges that
should be overcome for developing green practices of the hotel industry.
Although the performance levels of green practices are influenced by various factors such
as size of the hotel or type of services the hotel offers, green practices have been embraced
widely by hotel organizations. In particular, green activities such as non-smoking policies are
well recognized within the hotel industry. However, some areas such as energy efficiency and
food waste reduction are still remaining in challenge.
The majority of literature on organizational commitment and green practices support the
proposition that green practices may create positive perceptions among employees toward their
company. Also, employees are proud of their company for implementing green practices. As a
result of this, it is assumed that the employees’ commitment might be improved when their
organization participates in green practices.
It is true that a few demographic factors such as education demonstrate more consistent
results on green concerns; for instance, highly educated people show more concern for
environmental issues. However, although demographic characteristics are broadly used as a tool
to generalize green attitudes of people, the results of their influence on green concerns are mixed.
Hence, it is suggested that a more consistent result pertaining to the impact demographic
characteristics on perceptions regarding green activities might be expected in combination with
psychological and situational factors (Bhate & Lawler, 1997; Shrum et al., 1995).
Lastly, this study proposes the following hypotheses:
H1: There will be a significant difference between green importance perception

39
and green performance perception.
H2: Green practices will be positively correlated with organizational
commitment.
H3: The hotel employees’ demographic characteristics will not generalize their
perception regarding green practices at work.

40
CHAPTER THREE: METHODOLOGY
Introduction
This chapter outlines the methods employed to examine green practices implemented by
hotels from the hotel employees’ perspectives. The following sections are covered in the
chapter: (1) research design, (2) survey instrument, (3) pilot test, (4) sample, (5) data collection
procedure, and (6) data analysis procedures.
Research Design
The goal of the study was to examine green practices of the hotel industry from its
employees’ perspectives. This study adopted a descriptive cross sectional research method
which employed a self-administrated and closed-ended questionnaire to survey employees in the
hotel industry. The reason this study employed the survey method was to obtain research data
aimed at generalizing green perceptions from the sample to a population so that inferences can
be suggested (Creswell, 2003). Also, three advantages of the survey were recognized. These
were: (1) the rapid turnaround in data collection, (2) suitability to obtaining the targeted sample
size, and (3) the economy of the design (Creswell, 2003).

41
Survey Instrument
A closed-ended question and self administrated questionnaire was developed after
conducting a relevant literature review of green practices. Fifty-six total items were listed under
four different sections: (1) dimension of green practices in importance, (2) dimension of green
practices in performance, (3) organizational commitment, and (4) demographic characteristics.
Specifically, the first and second section – the dimension of green practices in importance and
performance respectively - illustrated four major green dimensions: energy efficiency (EF),
water conservation (WC), recycling (RC), and clean air (CA) which were followed by the five
functional green attributes underneath each. The green dimensions were generated from the
previous academic literature, and the five functional green features were introduced and
modified from literature, green surveys of organizations, and the requirements to be enlisted in a
green lodging in the state of Florida.
The majority of this survey used 5-point Likert scale items based on a scale from
“unimportant” to “extremely important” for importance measure and from “poor” to “excellent”
for performance measure. In order to measure organizational commitment, a scale from
“strongly disagree” to “strongly agree” was used. Demographic characteristics – factual
information - asked the respondents to check the category that they belonged. However, three
items - age, working experience for the hotels, and the industry - requested that respondents
provide actual years by filling in the blanks. The detail of each section of the questionnaire used
to survey the hotel employees is discussed below.

42
First section: “How important is each attribute to your hotel.” This section was used to
investigate what green features are perceived as being important from the hotel employees’
perspective. It contained four major constructs: (1) recycling (RC), (2) clean air (CA), (3)
energy efficiency (EF), and (4) water conservation (WC). Also, each illustrated five green
features operated by hotels. The detailed description of each is as followed.
(1) recycling (RC):
• recycling (cardboards, papers, cans, plastics, bottles, etc)
(AH& LA, 2008; CERES, 2001; DEP of Florida, 2009)
• using reusable utensils rather than disposable ones
(CERES, 2001; DEP of Florida, 2009)
• purchasing and using consumer recyclable products
(AH & LA, 2008; DEP of Florida, 2009 )
• serve proper portions of food to reduce food waste
(Alexander, 2002; CIWMB, 2009; Okazaki et al., 2008)
• paperless policy including use of electronic system (E-copy, email, etc).
(AH & LA, 2008; CERES, 2001; DEP of Florida, 2009)
(2) clean air (CA):
• non-smoking policy throughout property
(DEP of Florida, 2009; Suttell, 2005)
• place green live plants on property
(Heung et al., 2006)

43
• keeping humidity at certain level to prevent the growth of mold
(DEP of Florida, 2009)
• using environmentally preferable cleaning products
(CERES, 2001; DEP of Florida, 2009)
• cleaning AC units regularly to prevent bacteria
(Cascardo, 2007; DEP of Florida, 2009)
(3) energy efficiency (EF):
• using automatic sensor lighting
(AH & LA, 2008; CERES, 2001; DEP of Florida, 2009; Heung et al, 2006)
• using Energy Star rated equipments (refrigerator, copier, etc)
(AH & LA, 2008; CERES, 2001; DEP of Florida, 2009)
• using high energy efficient lighting (compact fluorescents)
(Alexander, 2002; AH & LA, 2008; CERES, 2001)
• setting an appropriate temperature
(Bohdanowicz et al., 2001; Cascardo, 2007)
• using sky-lights to maximize natural light
(Heung et al., 2006; U.S. EPA, 2007)
(4) water conservation (WC):
• towel and linen reuse program
(AH & LA, 2008; CERES, 2001; DEP of Florida, 2009)
• using low-flow fixtures

44
(AH & LA, 2008; CERES, 2001; DEP of Florida, 2009)
• using automatic low-flow fixtures
(AH & LA, 2008; Bohdanowicz, 2006; CERES, 2001; DEP of Florida, 2009)
• using water for reuse
(AH & LA, 2008; DEP of Florida, 2009)
• landscaping with native plants
(AH & LA, 2008; DEP of Florida, 2009)
Second section: “How well does your hotel perform green practices?” The main
objective of this section was to uncover the extent to which the hotel employees evaluated green
practices implemented by the hotels. The 20 items to assess performance level of the green
practices used in this section were identical to the first section.
Third section: “Organizational commitment.” The goal of this section was to
investigate whether a correlation appears between employees’ green perception and
organizational commitment. A total of six items were adopted from the 15 items of
Organizational Commitment Questionnaire (OCQ) by Mowday, Steers and Porter in 1979. OCQ
was employed for this study because the questionnaire is widely used by academicians when
they measure organizational commitment; it was used over 2000 times in various articles. Also,
the six items were specifically chosen because they clearly reflected the construct of
commitment (behavioral and attitudinal commitment which this study accepted) in a concise
statement.

45
Fourth section: “Employees’ demographic factors.” This section was developed to
explore whether employees’ green perception at work can be generalized from the sample by
their demographic characteristics. Respondents answered 10 items: gender, age, marital status,
level of education, ethnicity, annual salary range, working experience of the company, working
experience of the hospitality industry, position, and department.
Pilot Test
The developed questionnaire – a total of 56 items - was tested on 20 employees at various
departments in a hotel. Originally, the 5-point Likert scale had only two terms: extremely
important and unimportant for importance measure, and excellent and poor for performance
measure. However, the pilot test indicated that the questionnaire would be more comprehensive
if each term was expressed individually at each point on the scale. Based on the results, the
terms used at each of the five points on the importance measure were “5” = extremely important,
“4” = very important, “3” = important, “2” = slightly important, “1” = unimportant. For
performance measures, “5” = excellent, “4” = very good, “3” = good, “2” = fair, and “1” = poor
were adopted.
Additionally, the pilot test addressed the fact that the questionnaire needed to clarify
some items for better understanding of the questions. First, the third green feature of waste
reduction (RC3) was “purchasing and using recyclable products.” However, the employees
indicated that the term “recyclable products” was not fully understandable in the statement.

46
Hence, the content was replaced by “post consumer recyclable products.” As the result of
clarification, the item was replaced by “purchasing and using post consumer recyclable
products.”
Some items of the demographic factors were also modified. Originally, the question for
the current position was expressed as “full-time line employee” and “part-time line employee.”
However, the 20 employees were not only unclear about the term “line employees,” but also
shared their opinions that there was no need to separate a position as “full” and “part” time
because, most likely, part time employees would not have a chance to participate in the survey.
After the clarification and modification of some items, five people at the management
level reviewed the survey and suggested that the terms used at each point of the importance scale
would be more clear if the terms were changed from “important” to “moderately important” at
point 3, “little important” instead of “slightly important” at point 2, and “unimportant” instead of
“not important,” at point 1. Using their feedback, the terms for each point were modified
accordingly. Hence, the terms eventually used to measure the importance level were finalized as
extremely important, very important, moderately important, little important, and unimportant.
Sample
The population of interest consists of employees in the hotel industry. More specifically,
the sampling was geared to the employees at green certified hotels in Orlando; it included all
types of occupations and departments. The main reason that the sample was strictly limited to

47
the employees from green certified hotels was to compare importance and performance levels.
In order to assess the performance level of green practices by the hotels, it was critical and
essential that the employees be familiar with green practices at work by performing and
observing them. It also was limited to hotels in Orlando because of the accessibility of the
samples. Due to the fact that many of the major hotels in the Orlando area are compliant with
“Green Lodging” programs, it provided a variety of green initiatives to choose from and was
convenient for the author to compile information for this study.
The sample was composed of 227 hotel employees from eight hotels in Florida.
Importantly, at the point of survey these eight hotels were green certified (Palm certification) as
either level one or level two according to the Department of Environmental Protection of the
state of Florida. At the point of the survey, two hotels obtained level two of the green
certification, and six properties were level one green certified. Note: level two is a higher level
than level one in the “Palm” certification system. Further, these eight hotels were chosen and
contacted to be surveyed after reviewing the list of green lodgings on the website of the
Department of Environmental Protection of Florida. As noted, there were 400 green designated
properties in Florida and about 77 green resorts in Orlando as of January 2009 (Graham, 2009).
Data Collection Procedure
Data was collected over a one-month period between April and May in 2009. Initially, a
survey packet – a brief explanation as to the nature of the research, an informed consent form,

48
and survey questionnaire - was sent to the human resource (HR) departments of fifteen green
certified hotels in Florida, and eight of them agreed to participate. The fifteen hotels were
initially contacted based on convenience of location. After obtaining permission from the hotels,
the author of this research project visited three hotels to hand out the questionnaires to the
employees. The author visited each department at the hotels and explained the nature of the
study to the head of the departments and left copies of the questionnaire and the informed
consent form.
The survey collection boxes were set up at a designated area - the employees’ entrance or
employee cafeteria - for a week, so employees could drop off the survey as they came in and out.
The location of those boxes was given to the head of each department. A follow-up visitation
was made to the HR department three days after the initial visitation. A total of 400
questionnaires were distributed and 121 surveys were collected in this manner.
The other three hotels’ HR departments preferred to distribute the questionnaire
internally instead. However, the HR department asked the author to set up a box for collection
of the questionnaires. Per their requests, the author took the surveys to the HR department of
the three hotels and set up a collection box at each HR office. The HR department distributed
the questionnaires to each department in their properties. Three days after the initial visitation to
these hotels, the author visited the HR departments in the hotels to request a follow-up
announcement so employees who took the questionnaire could be reminded one more time what
the purpose of the questionnaire was. In this manner, a total of 150 surveys were distributed and
69 questionnaires were generated.

49
For the last two hotels, the author did not visit the hotels to hand out the survey or collect
the questionnaire. A contact person at each of the two hotels was interested in participating in
the survey under one condition: that they distributed and collected the questionnaire to send to
the author. The contact person at the hotels used the original survey packet to distribute the
questionnaire to the employees. A total of 37 surveys were generated from these two hotels.
Response Rate
In all, 550 questionnaires were distributed for this research to the employees in the eight
hotels in Orlando. The total number of responses generated was 227 which represented a
response rate of 41.27 %. Among the 227 surveys collected, 105 questionnaires came from the
level “two” green certified hotels, and 122 questionnaires came from the six hotels had level one
green certification. Originally, 227 questionnaires in total were yielded from the eight
properties; however, 7 questionnaires were eliminated because of an excessive amount of
missing data. After elimination, 220 usable questionnaires were retained for the analysis of this
research.
Data Analysis Procedures
Analyses employed for this study were: (1) Importance-Performance Analysis to compare
importance and performance levels of green practices, (2) reliability check for consistency of a

50
scale, (3) paired samples t-test to compare the green dimensions as a pair (importance and
performance) , (4) correlation analysis to examine the relationship between organizational
commitment and green practices, (5) Multivariate Analysis of Variance (MANOVA) to examine
whether the population’s green perceptions are different by demographic characteristics, (6)
one-way Analysis of Variance (ANOVA) to follow up test of the MANOVA, and (7) Post-hoc
with Tukey’s HSD to explore the differences between each of the groups already reported
significance in ANOVA. Data analysis procedures and brief discussions for each analysis
follow.
The coded 220 data were copied from SPSS version 17 and transferred to the Microsoft
Excel 2008 program to perform IPA. Respondents rated the importance of 20 attributes of green
practices and then evaluated the level of performance on 5-point scales. To construct the
importance-performance matrix, the mean scores of green dimensions across the sample were
calculated in the Excel program. The calculated mean scores were plotted on a two-dimensional
grid as a pair, importance and performance.
As mentioned, the dimensions of green practices introduced in this research were RC,
CA, EF, and WC. RC indicates waste reduction programs of green practices such as recycling
and using reusable products. CA means activities to improve air quality such as non-smoking
policies, using green cleaners, and maintaining AC units. EF refers to energy efficiency which
involves more structural adjustments of the hotel. Installing high energy efficient lighting and
introducing natural light to the building to reduce consumption of the energy are examples of
this. WC indicates water conservation programs. In fact, activities under this category such as

51
linen reuse programs and using low-flow fixtures are the most visible green attributes used by
hotels.
Reliability of Scale
Measurements used in this research introduced four dimensions (RC, CA, EF, and WC)
of green practices, and each dimension consists of five sub-items. In other words, twenty items
in total were used for each importance and performance scale. In order to examine internal
consistency of the measurements used in this research, a reliability analysis was adopted. Also,
item adjustment for better internal consistency was conducted; items CA2 (place green live
plants on property for the quality of indoor air), EF5 (using sky-lights to maximize natural light
throughout the property), and WC1 (towel and linen reuse program in guest rooms) were
excluded from the list of items in importance. Consequently, importance of CA, EF and WC
remained four items instead of five for analysis, and Cronbach’s alpha was increased by .04, .35,
and .28 for CA, WC, and EF respectively. As the result of it, internal consistency in importance
measurement of green practices was reported .66 for RC, .67 for CA, .81 for EF, and .75 for WC.
Also, Cronbach’s alpha for performance measurement reported .60, .73, .85, and .81 for
RC, CA, EF, and WC respectively. The organizational commitment (OC) measurement
originally consisted of 6 items. However, the first statement, “I find that my values and the
organization’s value are similar,” was removed to increase internal consistency. As a result of
the item adjustments, the internal consistency of OC was improved by .32 from .61 to .93. Table

52
1 summarizes Cronbach’s alpha values of each construct and descriptive statistics of the
constructs. The construct reliability coefficients (Cronbach’s alpha) ranged from .60 to .93
which is acceptable (Hair, Black, Babin, Anderson, & Tatham, 2005).
Table 1: Construct reliability and descriptive statistics
Construct N of Items Cronbach's Alpha Mean S.D
RC - Importance 5 .66 4.07 .62
CA - Importance 4 .67 4.36 .58
EF - Importance 4 .81 4.13 .74
WC - Importance 4 .75 4.05 .76
RC - Performance 5 .60 3.90 .81
CA - Performance 5 .73 3.97 .67
EF- Performance 5 .85 3.69 .88
WC- Performance 5 .81 3.91 .75
Organizational Commitment 5 .93 4.19 .96
For better understanding about internal consistency of a measurement, a brief explanation
is suggested herein. In general, reliability is defined as the degree to which the observed variable
measures the true or error free value (Hair et al., 2005). Poor reliability cannot be seen because
it is embedded in the observed variables; therefore, the process to increase reliability and validity
should be enforced in order to have more accurate results of the variables of interest (Hair et al.,
2005). In general, Cronbach’s Alphas value indicates internal consistency, and values above .6
and .7 may acceptable (Hair et al., 2005).
53
Importance – Performance Analysis (IPA)
The IPA by Martilla and James (1977) employed a five-point scale. Similarly, this study
adopted a five-point scale for the importance and performance attributes of a green hotel. It
should be noted herein that unlike reliability assessment no questionnaire items were eliminated
for IPA because of descriptive nature of IPA: IPA is used to present data and strategic
suggestions not an indicator of validity (Oh, 2001). Significantly, most IPA studies do not
specifically indicate the terms at each point, yet this study presented the terms at each of the five
points of the Likert scale. Also, although they suggested that using median values as a measure
of central tendency is preferable, this study decided to use mean scores to develop the IPA grid
in order to grasp additional information that the data might contain (Martilla & James, 1977). A
brief background discussion regarding IPA follows.
Originally, IPA by Martilla and James (1977) assessed consumer satisfaction by
comparing two points: the important attributes to the consumers and the performance rating of
each feature by consumers. A significant feature of IPA is that because the results can be
graphically displayed on a two-dimensional grid, the results are easily interpreted (Martilla &
James, 1977). Because IPA is used to determine relative value of importance and performance
rather than the absolute level of importance and performance (Leong, 2008; Martilla & James,
1977), the interpretation of quadrant intersections can be determined based on judgment (Leong,
2008). A two-dimensional grid consists of a vertical y-axis depicted as “important” and a
horizontal x-axis depicted as “performance” (Martilla & James, 1977; Vaske, Kiriakos, Cottrell,

54
& Khuong, 2009). Each of the quadrants is represented by the following interpretations
(Guadagnolo, 1985; Martilla & James, 1977):
• Keep up the good work – The upper right-hand quadrant. Features of high level of
importance to respondents and high rank of performance of the company.
Therefore, decision makers need to be certain these attributes remain in this
quadrant.
• Concentrate here – The upper left-hand quadrant. Attributes of high level of
importance to respondents and lower rank of performance of the firm. Therefore,
management needs to pay immediate attention on features that fall into this
category.
• Low priority – The lower left-hand quadrant. Features of low level of importance
and performance. Since the employees perceive these of little importance, decision
makers may pay little or no attention to attributes that fall into this category.
• Possible overkill – The lower right-hand quadrant. Features of low level of
importance and high rank of performance. Limited attentions can be expended on
these attributes because the employees do not perceive these as being important
factors.
To depict each quadrant and its interpretations (explained above), figure 1 shows an IPA grid.

55
Source: Martilla and James (1977)
Figure 1: IPA grid and interpretations
T-tests
The following T- tests were performed: (1) paired sample t-test to identify whether there
was a discrepancy between level of importance and performance on green practices assessed by
the hotel employees and (2) independent samples t-test to examine what differences showed
between hotels that had different levels of green certification. To conduct a paired sample t-test,
each dimension of green practices - importance and performance - was paired to compare them;
for instance, importance of RC and performance of RC were paired to compare what differences
show between the two.
To perform an independent samples t-test, performance of RC and EF were entered for
dependent variables, and hotel classifications based on the level of green certification was
H Concentrate Here Keep Up the Good Work
Importance
L Low Priority Possible Overkill
Performance H L

56
entered for independent variables. Note, level one and level two indicated “Palm certification”
level one and level two. A brief discussion regarding t- tests follows.
A paired samples t-test is a type of t- test used to compare the means in the case of two
samples that are related. It can also be used for measuring the same sample in two different
questions (Pallant, 2007). In statistics, an independent samples t-test is used to test the
probability that the two sets of scores came from the same population. In determining the
appropriateness of t-tests, some assumptions - normal distribution, homogeneity of variance, and
independence of observations- are needed for it to be conducted. (Pallant, 2007). In general, t-
tests are widely applied by researchers because they work with sizes of a small group and are
easy to apply and interpret (Hair et al., 2005). Although there is a wide application of t-tests,
they have limitations: (1) t-tests are only used for two groups and (2) they only assess one
independent variable at a time (Hair et al., 2005).
Correlation Analysis
To investigate the relationship of green practices and organizational commitment (OC),
the correlation analysis was used. Prior to conducting the correlation analysis, general
assumptions were tested, and four green dimensions of importance and performance and OC
were entered simultaneously for the analysis. Among several measures for correlation, this
research took Pearson product-moment correlation coefficient to depict the results of correlation
between green practices and OC. A general overview of correlation analysis follows.
57
Correlation is used to explore the strength and direction of the relationship between
variables. In general, a Person product-moment correlation coefficient (Pearson r) is a common
measure of the correlation between two variables, giving a value from -1(negative correlation) to
+1(positive correlation) (Pallant, 2007). A number of assumptions need to be made for the
correlation analysis: level of measurement, related pairs, independence of observations,
normality, linearity, homoscedasticity, and missing data; in fact, generating scatterplot enables
the researcher to check linearity and homoscedasticity (Pallant, 2007). For appropriate analysis
of the correlation, it should be known that small correlations may produce statistical significance
in large samples (N = 100+) (Pallant, 2007).
Multivariate analysis of variance (MANOVA)
To examine whether the employees’ demographic factors can generalize their green
perception at work, multivariate analysis of variance (MANOVA) was conducted. Eleven
independent variables were - 10 demographic factors and one hotel classification. They were:
(1) gender, (2) generation, (3) marital status, (4) education, (5) ethnicity, (6) annual salary, (7)
years working for the hotel, (8) years working for the hospitality industry, (9) position, (10)
department, and (11) hotel classification based on the level of green certification. As a note,
hotel classification was not on the questionnaire; however, it was used for independent variables
in MANOVA for the purpose of further investigation. The dependent variables were importance

58
and performance of green factors - RC, CA, EF and WC. Procedurally, the dependent variables
were entered simultaneously while 11 independent variables were entered individually.
Some groups of six variables were collapsed to obtain better statistical results in this
study. For generation, since the mature category had only few samples (1.4%), it was combined
with Baby- Boomer (18.6%). It resulted in a total of 3 subgroups for generation variable which
were Generation Y, X, and Mature. For education, some high school (5.9%) and graduate
school (4.1%) were combined with high school graduate and college graduate respectively.
Hence, resulting education variable had three groups – high school graduate, junior college, and
college graduate.
Continually, three groups of annual salary range were combined and resulted in a total of
4 groups: group 4 (salary range from $50,000 to $74,999 (5.5 %)), group 5 (salary range from
$75,000 to $99,000 (3.6%)), and group 6 (over $100,000 (3.2%)) were combined into over the
$50,000 range of annual salary group. For department, in order to properly compare green
perceptions of departments, audio & visual (.5%), other (3.2%), and administration (2.3%) were
excluded from the further analysis due to the small size of their data. Also, HR (3.6%) was
combined with the sales/marketing department. Consequently, 4 groups of department were
analyzed.
For working experiences of the organizations and hospitality industry, years were cut off
by five-years and ten-years respectively. Preliminary assumptions were tested, and some outliers
– five cases (data number 18, 46, 84, 100, and172) in importance and eight cases (data number
16, 40,60,61,67,100,172, and 200) in performance – were found; yet this study decided not to

59
consider transformation because the number of outliers was not considered an extensive amount.
In addition, a brief discussion of MANOVA is followed.
MANOVA is used for more than one dependent variable; therefore, it is used to compare
two or more groups in terms of their means on a group of dependent variables (Hair et al., 2005;
Pallant, 2007). For MANOVA to be valid, three assumptions need to be met (Hair et al., 2005):
(1) observations must be independent – responses in each cell are not made independently of
responses in any other group, (2) variance-covariance matrices must be equal for all treatment
groups – in MANOVA, Box’s Test of Equality of Covariance Matrices shows whether this
assumption is violated or not. Significant value that is larger than, .001 means no violation of
this assumption (Pallant, 2007), and (3) normality – this assumption is that all the variables are
multivariate normal. Although it underlies most multivariate techniques, there is no direct test
available for multivariate normality (Hair et al., 2005). Considering the fact that univariate
normality of each variable is tested, Mahalanobis distance is commonly used (Pallant, 2007).
One-way analysis of variance (ANOVA)
A one-way analysis of variance (ANOVA) was employed as a follow-up test to the
MANOVA. ANOVA was conducted only on the dependent variables that reached statistical
difference in MANOVA. In MANOVA, five variables showing significance were (1) gender,
ethnicity, and department on importance of green practices and (2) generation and hotel

60
classification on performance of green practices. Consequently, ANOVA was conducted only
for these variables. For better understating about ANOVA, it is briefly discussed herein.
One -way analysis of variance (ANOVA) is used to show whether there are significant
differences in the mean scores on the dependent variables across the groups. It involves one
independent variable which has a number of different levels and one dependent continuous
variable (Pallant, 2007). For each group, sample size of 20+ is preferable for the comparison of
mean scores (Hair et al., 2005). In principle, ANOVA can avoid type I error inflation due to
making multiple comparisons of treatment groups and providing more flexibility in testing for
group differences (Hair et al., 2005).
Post hoc tests
As a follow up test of ANOVA, post hoc tests with Tukey’s HSD were conducted to
determine where mean differences occurred which gave them significance across the groups.
The analyzed variables were the ones that reached statistical significance in ANOVA, and they
were (1) ethnicity on importance of RC, (2) department on importance of CA and EF, (3)
generation on performance of RC and EF, and (4) hotel classification on importance of RC and
EF. Overall discussion about post-hoc is followed.
In general, these tests are performed after the statistical tests for main effects have been
performed. It does not use a single contrast, but instead tests for differences among all possible
combinations of groups (Hair et al., 2005). Most common post hoc procedure are Tukey’s

61
honestly significant difference (HSD) method and Scheffe’s method which is the most cautious
method for reducing the risk of a Type I error (Hair et al., 2005; Pallant, 2007;). Because Post-
hoc comparisons are designed to prevent the possibility of Type I error, it is often more difficult
to achieve significance (Pallant, 2007).
Conclusion
This chapter describes research methodology employed to investigate green practices
from perspective of the hotel employees. This research is based on a survey collected from the
employees of hotels implementing green practices in their operations. Also, the areas analyzed
are the level of importance and performance of green practices assessed by the employees of
hotels, the relationship between employees’ commitment and green practices, and the effect of
employees’ demographic factors to predict green perceptions. The brief discussions for each
analysis used in this research - IPA, paired t-tests, MANOVA, ANOVA, and post-hoc tests –
also appear in this chapter.

62
CHAPTER FOUR: RESEARCH RESULTS
Introduction
This chapter presents the results of the data analysis performed to examine green
practices from hotel employees’ perspectives. As noted, all information used in this study was
derived from questionnaire data. Two hundred twenty completed questionnaires were coded,
and the raw data was transferred into Statistical Package of Social Sciences (SPSS) version 17
for analysis at first. IPA was separately performed in Excel 2008 to present the results.
Importantly, to screen data for analysis of the study, descriptive tests for variables were used in
order to check errors of the data. After errors of the data were corrected, tests were repeated to
double-check for occurrence of errors.
Sample Profiles
The majority of participants for this study were female (68.6 %). It consists of a broad
cross-sectional with an age range from 18 to 70 making 35.9 years the mean age. Interestingly,
the percentage of single and married was equally 44.5 %. Over 40 % of the employees were
high school graduates and nearly three-quarters (70%) of the employees had full-time positions
and made less than 35K (67.3%) annually. More white people responded to this survey than
other ethnicities.

63
There was a broad range in the number of years participants had worked for the hotels
and in the hospitality industry - from 1 year to 25 years (mean = 6 years and median = 4 years)
for the hotels and from 1 year to 39 years (mean = 11 years and median = 10 years) for the
hospitality industry. Nearly half of the respondents worked for room departments (48.6 %) such
as the front desk, housekeeping and engineering. Employees’ demographic characteristics were
consistent across the eight hotels. The sample profiles of this study moderately reflect the
current hospitality industry labor trends including following: (1) largest percentage of the middle
aged labor; (2) large portion of female labor; and (3) increasing percentage of minority labor
(Angelo & Vladimir, 2004). Descriptive statistics of respondents are presented in Table 2.

64
Table 2: Demographic profile of respondents (Employees N=220)
Variable
N
%
Variable
N
%
Gender Education
Female 151 68.6% Some high school 13 5.9%
Male 69 31.4% High school graduate 89 40.5%
Age Junior college graduate 27 12.3%
Generation Y (born after 1982) 57 25.9% College graduate 82 37.3%
Generation X (born 1965 ~ 1981) 95 43.2% Graduate school 9 4.1%
Baby Boomer (born 1946 ~ 1964) 41 18.6% Ethnicity
Mature (born before 1946) 3 1.4% African American 30 13.6%
Marital Status Hispanic 71 32.3%
Single 98 44.5% Caucasian 86 39.1%
Married 98 44.5% Other 31 14.1%
Separated 6 2.7% Annual salary range
Divorced 15 6.8% < $20,000 47 21.4%
Widowed 3 1.4% $20,000 ~ $34,999 101 45.9%
Years for organization $35,000 ~ $49,999 40 18.2%
Average 6 $50,000 < 27 12.3%
Years for the hotel industry Department
Average 11 Administration 5 2.3%
Current position F & B 38 1.3%
Full - time employee 153 69.5% Finance 32 14.5%
Manager level 38 17.3% Room 107 48.6%
Senior/Executive level 20 9.1% Sales/Marketing 18 18.2%
Others (seasonal/on-call) 8 3.7% Human Resource 8 3.6%
Others 8 3.7%
Note: Years for the organization and the hotel industry are averaged values (years).
65
Importance – Performance Analysis (IPA)
As an initial analysis of IPA, the mean scores of green attributes were calculated.
Fourteen items of importance measure and five items of performance measure had mean scores
greater than “4.” It indicated that the employees of hotels perceive green practices to be at least
“important” and “fair performance.” The mean scores for the attributes of green practices in
importance measure ranged lowest from 3.54 (EF5, using sky lights to maximize natural light
throughout the property) to highest to 4.64 (CA1, non-smoking policy for indoor air quality).
Similarly, in performance measure, CA1 (non-smoking policies) with a mean of 4.50 was
highest-rated while EF5 had the lowest mean score with 3.33.
The green features of RC1 (recycling), CA1 (non-smoking policy for indoor air quality),
EF3 (using high energy lighting through the property), and WC1 (towel and linen reuse program)
had higher mean scores than other green features in both importance and performance measures.
In addition, EF 5 (using sky-lights to maximize natural light throughout the property) was
lowest-rated in importance and performance. Table 3 presents the mean scores and standard
deviations of 20 attributes of green practices in terms of importance and performance.

66
Table 3: Importance and performance ratings of green practices by the hotel employees
Label Attribute Description Importance
Mean (St.Dev)
Performance Mean
(St.Dev) RC1 Recycling (cardboards, papers, etc) 4.38
(.76) 4.20
(2.14)
RC2 Using reusable utensils rather than disposable ones 3.74 (1.11)
3.56 (1.14)
RC3 Purchasing/using post consumer recyclable products 3.92 (.89)
3.84 (.92)
RC4 Serves proper portion of food to reduce food waste 4.02 (.98)
3.74 (.99)
RC5 Paperless policy including use of electronic software/system 4.29 (.87)
4.01 (.93)
CA1 Non-smoking policy for indoor air quality 4.64 (.72)
4.50 (.80)
CA2 Place green live plants on property for the quality of indoor air 3.80 (1.21)
3.73 (1.19)
CA3 Keeping relative humidity at certain level to prevent the growth of mold 4.21 (.89)
3.79 (.91)
CA4 Using environmentally preferable cleaning products 4.13 (.91)
3.84 (.94)
CA5 Cleaning AC units regularly to prevent bacteria 4.47 (.75)
3.95 (.98)
EF1 Using automatic sensor lighting on property 4.03 (.99)
3.76 (1.14)
EF2 Using Energy Star rated equipments 4.13 (.87)
3.72 (1.01)
EF3 Using high energy efficient lighting through the property 4.22 (.91)
3.85 (1.04)
EF4 Setting appropriate temperature in back of the house 4.16 (.88)
3.78 (1.02)
EF5 Using sky-lights to maximize natural light throughout the property 3.54 (3.46)
3.33 (1.32)
WC1 Towel and linen reuse program 4.48 (3.61)
4.16 (.93)
WC2 Using low-flow fixtures 4.19 (.96)
4.05 (.88)
WC3 Using automatic low-flow fixtures 4.19 (.96)
3.99 (.954)
WC4 Reclaiming water for reuse 3.82 (1.17)
3.58 (1.22)
WC5 Landscaping with native plants to minimize water consumption 3.99 (.95)
3.75 (1.02)
Grand Means
The Grand Means for Importance & Performance 4.11 3.85
*Importance variables measured on a 5-point scale ranging from unimportant to extremely important *Performance variables measured on a 5-point scale ranging from poor to excellent.

67
IPA grid
Activities related to green practices were mostly plotted in the upper right-hand quadrant
– “keep up the good work” and the lower left-hand quadrant – “low priority.” However, a few
attributes such as CA3 (keeping relative humidity at certain level to prevent the growth of mold),
EF2 (using Energy Star rated equipments), and EF4 (setting appropriate temperature in back of
the house) were plotted in the upper left-hand quadrant which means “concentrate here.”
Therefore, these three features need to be improved upon terms of performance by the hotels. As
note on the grid EF2 (using Energy Star rated equipments) was plotted on an interception of
“concentrate here” and “low priority”; however, it was judged for the quadrant of “concentrate
here” because the mean score of EF4 (M = 4.13) is slightly higher than the averaged green
features (M = 4.12).
Also, only two items – CA4 (using environmentally preferable cleaning products) and
RC3 (purchasing/using post consumer recyclable products) – were plotted on quadrant 4 of
“possible overkill.” Based on the results, these two items were viewed as unimportant by the
employees; meanwhile, the hotels performed these features well. According to the results, the
hotels may have limited attentions on these items.
Seven items – EF1 (using automatic sensor lighting on property), EF5 (using sky-lights to
maximize natural light), RC4 (serves proper portion of food), RC2 (using reusable utensils rather
than disposable ones), WC5 (landscaping with native plants to minimize water consumption),
WC4 (reclaiming water for reuse), CA2 (green live plants on property for indoor air quality) -
out of twenty were positioned in the quadrant 3 of “low priority.” These seven items were

68
perceived as relatively unimportant by the employees. From the employees’ viewpoint, the
hotels may pay less attention on these.
Eight items – CA1 (non-smoking policies), CA4 (using environmentally preferable
cleaning products), CA5 (cleaning AC units regularly), RC1 (recycling), RC5 (paperless policy),
WC1 (towel and linen reuse program), WC2 (using low-flow fixtures), WC3 (using automatic
low-flow fixtures), and EF3 (using high energy star rated equipments) - were plotted in the
quadrant 2 of “keep up the good work.” These green features in quadrant 2 were not only
perceived as important by the employees but also well-performed by the hotels. Therefore, it is
predicted that the performance for these should be maintained. The IPA grid is illustrated in
Figure 2.

69
Figure 2: Employee perception on green practices to IPA
Interestingly according to the employees’ importance and performance measure, RC2
(using reusable utensils rather than disposable ones) and EF5 (using sky-light to maximize
natural light throughout the property) were equally ranked at the bottom and CA 1 was ranked on
the top in both importance and performance. Importantly, based on the IPA, overall the
employees perceived that activities related to WC (water conservation) were well-performed by
the hotels; three attributes related to WC – WC1, WC2, and WC3 - out of five were plotted on
the “keep up the good work.” Also, green attributes related to air quality were valued more than
other green features by the hotel employees.
Concentrate Here Keep Up the Good Work
RC1
RC2
RC3
RC4
RC5
CA1
CA2
CA3
CA4
CA5
EF1
EF2
EF3
EF5
WC1
WC2WC3
WC4
WC5
3.30
3.50
3.70
3.90
4.10
4.30
4.50
4.70
3.30 3.50 3.70 3.90 4.10 4.30 4.50
I m po r t a nc e
Performance

70
To aid IPA, figure 3 suggests a line graph to show how the employees perceived green
practices in importance and performance.
4.38
3.74
3.924.02
4.29
4.64
3.80
4.21
4.13
4.47
4.03
4.134.22
4.16
3.54
4.48
4.194.19
3.82
3.99
4.20
3.56
3.843.74
4.01
4.50
3.733.79
3.84
3.95
3.76 3.72
3.85
3.78
3.33
4.16
4.053.99
3.58
3.75
RC1 RC2 RC3 RC4 RC5 CA1 CA2 CA3 CA4 CA5 EF1 EF2 EF3 EF4 EF5 WC1 WC2 WC3 WC4 WC5
Importance Performance
Figure 3: Assessment of each green attribute in importance and performance by employees
Evaluation of Green Dimensions
A paired-samples t-test was conducted to evaluate whether there is difference between
the level of importance and performance in each green dimension as perceived by the employees.
The results showed that the mean scores from the importance to the performance were decreased.
In other words, the employees assessed that the performance level by hotels did not exceed their
importance level about green practices.

71
The decreased mean score for RC was .18 with a 95% confidence interval ranging from
0.80 to .28, t(215) = 3.51, p< .0005 (2-tailed). The results also indicated that the mean score of
CA decrease by .41 from importance to performance with a 95 % confidence interval ranging
from .32 to .51, t(214) = 8.63, p< .0005 (2-tailed). EF was the factor of green practices that
showed the most significant difference on the mean scores. The mean decrease on EF from
importance and performance was .44 with a 95% confidence interval ranging from .33 to .56,
t(206) = 7.75, p<.0005 (2-tailed). WC also decreased the mean score by .15 from importance to
performance with a 95% confidence interval ranging from .05 to .24, t(212) = 3.11, p<.0005 (2-
tailed). By using eta squared values of each, the magnitude of effect between importance and
performance of green practices was small or moderate according to suggestive guidelines
(Pallant, 2007): .05 for RC, .24 for CA, .21 for EF, and .04 for WC.
Based on the difference of the mean scores, the gap on WC (.15) was approximately one
third of EF (.44); this means that the green activities for EF did not perform well in comparison
to other green activities. This emphasized that there was a statistically significant difference
between the level of importance as perceived by the employees and the level of performance
practiced by hotels; performance level on green practices was lower than importance level
regarding green practices. In fact, the energy efficiency area had the lowest performance level
among the green dimensions. Based on the results of paired t-test, hypothesis 1 – there will be a
significant difference between green importance perception and green performance perception –
is supported. The results of paired t-test are shown in Table 4.
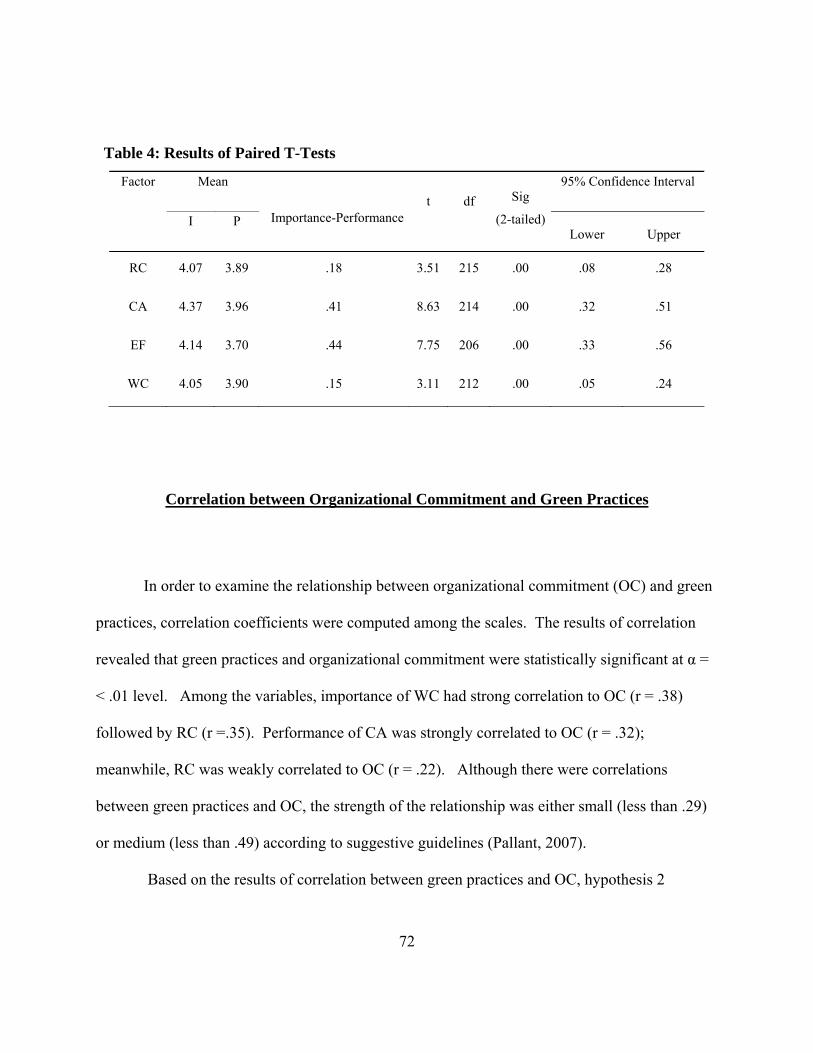
72
Table 4: Results of Paired T-Tests
Factor Mean
Importance-Performancet df Sig
(2-tailed)
95% Confidence Interval
I P Lower Upper
RC 4.07 3.89 .18 3.51 215 .00 .08 .28
CA 4.37 3.96 .41 8.63 214 .00 .32 .51
EF 4.14 3.70 .44 7.75 206 .00 .33 .56
WC 4.05 3.90 .15 3.11 212 .00 .05 .24
Correlation between Organizational Commitment and Green Practices
In order to examine the relationship between organizational commitment (OC) and green
practices, correlation coefficients were computed among the scales. The results of correlation
revealed that green practices and organizational commitment were statistically significant at α =
< .01 level. Among the variables, importance of WC had strong correlation to OC (r = .38)
followed by RC (r =.35). Performance of CA was strongly correlated to OC (r = .32);
meanwhile, RC was weakly correlated to OC (r = .22). Although there were correlations
between green practices and OC, the strength of the relationship was either small (less than .29)
or medium (less than .49) according to suggestive guidelines (Pallant, 2007).
Based on the results of correlation between green practices and OC, hypothesis 2

73
- green practices will be positively correlated with organizational commitment – is supported. It
clearly shows that green practices are positively correlated to organizational commitment. Table
5 and 6 present the results of correlations between green practices and organizational
commitment.
Table 5: Correlations between OC and importance of green practices
Scale 1 2 3 4 5
1. RC – Importance __ .54** .56** .53** .35**
2. CA – Importance __ .71** .46** .27**
3. EF – Importance __ .52** .26**
4. WC – Importance __ .38**
5. Organizational Commitment (OC) __
** p < .001
Table 6: Correlations between OC and performance of green practices
Scale 1 2 3 4 5
1. RC - Performance __ .50** .50** .50** .22**
2. CA - Performance __ .73** .66** .32**
3. EF – Performance __ .70** .28**
4. WC - Performance __ .30**
5. Organizational Commitment (OC) __
** p < .001

74
Demographic Characteristics and Green Perception
Multivariate Analysis of Variance (MANOVA)
A one-way multivariate analysis of variance (MANOVA) was performed to examine the
difference in green perception by demographic variables. The dependent variables were
importance and performance of green practices, and independent variables used were 11 in total
: 10 demographic factors and one hotel classification based on the level of green certification.
Three on importance variables and two on performance variables reached statistical difference.
For importance, gender showed significance: F(4, 215) = 2.94; p =.02; Wilks’ λ = .95;
partial eta squared = .05. Also, ethnicity, F(12, 558) = 1.88; p = .03; Wilks’ λ = .90; partial eta
squared =.03, and department, F(12, 518) = 2.63; p = .00; Wilks’ λ = .86; partial eta squared =
.05 showed a statistical difference.
For performance, two variables showed significance: (1) generation, F(8, 380) = 2.21; p
=.03; Wilks’ λ = .91; partial eta squared = .04, and (2) hotel classification based on certification
level, F(4, 215) = 5.46, p = .00; Wilks’ λ = .91; partial eta squared = .09. Based on the findings
above, the employees’ green perception was not determined by their demographic characteristics
although there are a few variables that showed significance. Therefore, hypothesis 3 – the hotel
employees’ demographic characteristics will not generalize their perception regarding green
practices – is partially supported. Table 7 and 8 show the results of MANOVA

75
Table 7: MANOVA - Importance of green practices by demographic variables
Demographic Variables
Wilks’ λ
F value a
P value Partial Eta Squared
Gender (df = 1) .95 2.94 .02** .05
Age/Generation (df = 2) .94 1.42 .19 .03
Marital Status (df=1) .98 1.06 .38 .02
Education (df = 2) .95 1.35 .22 .03
Ethnicity (df=3) .90 1.88 .03** .03
Annual Salary (df=3) .92 1.48 .13 .03
Work-hotel (df=2) .98 .41 .90 .01
Work-hospitality (df=2) .97 .76 .64 .01
Position (df=1) .99 .31 .81 .01
Department (df = 3) .86 2.63 .00* .05
Hotel classification (df = 1) .97 1.70 .15 .03
* p < .01 and ** p <.05
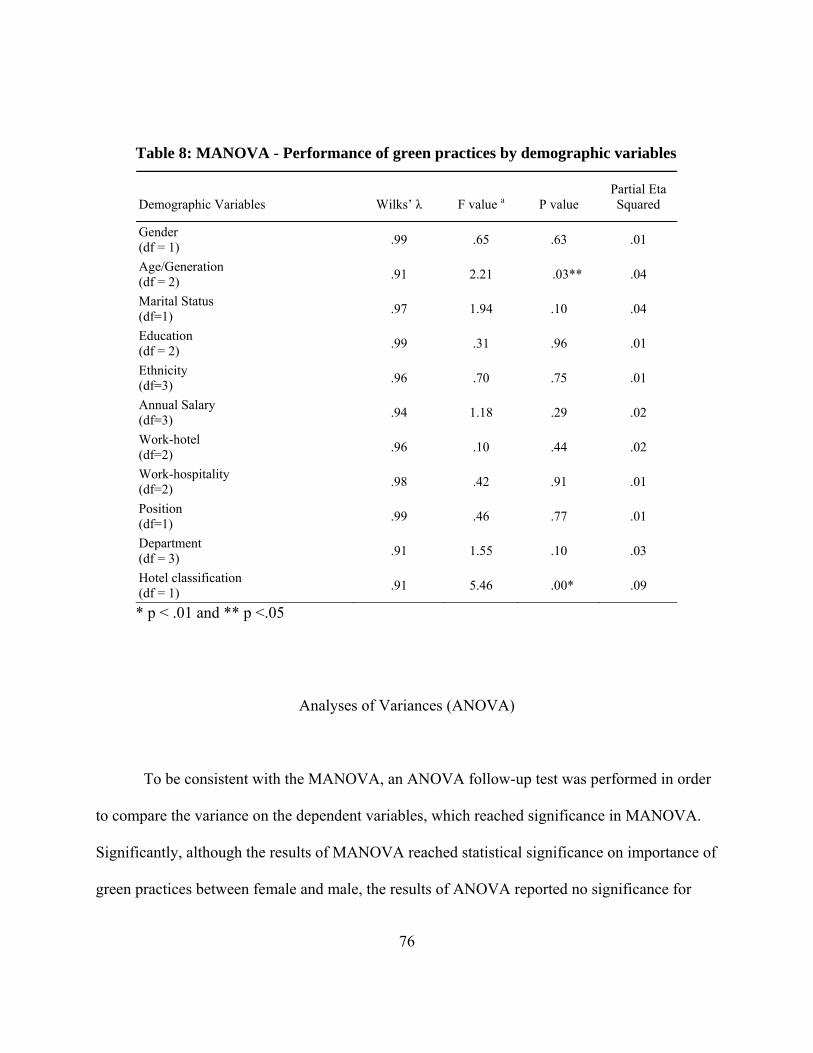
76
Table 8: MANOVA - Performance of green practices by demographic variables
Demographic Variables
Wilks’ λ
F value a
P value Partial Eta Squared
Gender (df = 1) .99 .65 .63 .01
Age/Generation (df = 2) .91 2.21 .03** .04
Marital Status (df=1) .97 1.94 .10 .04
Education (df = 2) .99 .31 .96 .01
Ethnicity (df=3) .96 .70 .75 .01
Annual Salary (df=3) .94 1.18 .29 .02
Work-hotel (df=2) .96 .10 .44 .02
Work-hospitality (df=2) .98 .42 .91 .01
Position (df=1) .99 .46 .77 .01
Department (df = 3) .91 1.55 .10 .03
Hotel classification (df = 1) .91 5.46 .00* .09
* p < .01 and ** p <.05
Analyses of Variances (ANOVA)
To be consistent with the MANOVA, an ANOVA follow-up test was performed in order
to compare the variance on the dependent variables, which reached significance in MANOVA.
Significantly, although the results of MANOVA reached statistical significance on importance of
green practices between female and male, the results of ANOVA reported no significance for

77
gender. This result indicates that the importance level of green practices on gender can be
significant when the four green factors were taken collectively, as a whole concept, rather
individually. Regarding ethnicity, only importance of RC reported a statistical significance,
F(3, 214) = 3.65, p =.01. For department, two factors of green practices reported significance –
CA and EF. Importance of EF was more significant than CA. EF was F(3, 199) = 7.01,
p <.01, and CA was, F(3, 199) = 2.87, p <.05. Among these, importance of EF by department
(.00) was most significant followed by importance of RC by ethnicity (.01).
Generation reported statistical significance on performance of CA and EF. CA was more
significant than EF: CA was, F(2, 193) = 7.34, p <.01 and EF was, F(2, 193) = 4.28, p <.05.
Hotel classification on performance of RC and EF showed statistical difference; yet the
magnitude between RC and EF was not distinctive, .01. CA showed F(2, 218) = 4.52, p < .05,
and EF was F(2, 218) = 3.75, p = .05. Overall, performance of CA by generation was most
significant. Table 9 and 10 shows the results of ANOVA on importance by ethnicity and
department and performance by generation and hotel classification.

78
Table 9: ANOVA - Importance and demographic variables
Variables
Sum of Squares
df
Mean Square
F
Sig.
RC - Importance Ethnicity 4.04 3 1.35 3.65 .01**
CA - Importance Ethnicity .57 3 .19 .55 .65
EF - Importance Ethnicity .92 3 .31 .56 .64
WC - Importance Ethnicity 3.58 3 1.19 2.09 .10
RC - Importance Department 1.55 3 .52 1.33 .27
CA - Importance Department 2.87 3 .96 2.87 .04**
EF - Importance Department 10.14 3 3.38 7.01 .00*
WC - Importance Department 1.41 3 .47 .78 .51
* p < .01 and ** p <.05
Table 10: ANOVA - Performance and demographic variables
Variables
Sum of Squares
df
Mean Square
F
Sig.
RC-Performance Generation 1.62 2 .81 1.21 .30
CA-Performance Generation 6.35 2 3.18 7.74 .00*
EF-Performance Generation 6.24 2 3.12 4.25 .02**
WC-Performance Generation 2.20 2 1.10 2.00 .14
RC-Performance Hotel classification 2.96 1 2.96 4.52 .04**
CA-Performance Hotel classification .00 1 2.84 .01 .94
EF-Performance Hotel classification 2.84 1 .96 2.87 .05**
WC-Performance Hotel classification .54 1 .541 .96 .33
* p < .01 and ** p <.05
79
Post –Hoc Analyses
This study also conducted post hoc analyses using Tukey HSD as follow-up tests to
ANOVA in order to evaluate where the significant differences lie. All independent variables
used for ANOVA had multiple levels of at least three levels. First, the result of multiple
comparisons reported ethnicity on importance of RC was significant; Black/African Americans
differed from Hispanic people and vice versa. The mean score of Hispanics is higher
(M = 4.20, S.D = .57) than other ethnicities, especially Black/African Americans (M = 3.78, S.D
= .60).
Second, Tukey HSD for department on importance of CA reported that room departments
differed from sales/HR. Similarly, room departments on importance of EF also differed from
finance and sales/HR. The mean score of room departments is higher than sales/HR in both
cases. In both cases, the mean score of Food & Beverage (F&B) was not different from others.
The post-hoc HSD reported that generation X (M = 3.79, S.D = .70) on performance of
CA differed from generation Y (M = 4.07, S.D = .63) and mature generation (M = 4.22, S.D =
.51); the mean score of generation X is lower than others. Similarly, generation X on
performance of EF was different than mature generation. The mean score of mature generation
(M = 3.88, S.D = .86) was slightly higher than others. Tables (11, 12, 13, 14, and 15) show the
results of multiple comparisons.

80
Table 11: Multiple comparisons - Importance of RC on ethnicity
Dependent Variable (I) (J) (I-J) Std. Error Sig.
95% Confidence Interval
Lower Bound Upper Bound
RC –
Importance African American
Hispanic -.43 .13 .09 -.77 -.09
Caucasian -.28 .13 .15 -.61 .06
Other -.36 .16 .10 -.76 .04
Hispanic
African American .43 .13 .09 .09 .77
Caucasian .15 .10 .40 -.10 .41
Other .07 .13 .95 -.27 .41
Caucasian
African American .28 .13 .15 -.06 .61
Hispanic -.15 .10 .40 -.40 .10
Other -.09 .13 .91 -.41 .24
Others
African American .36 .16 .10 -.04 .76
Hispanic -.07 .13 .95 -.40 .27
Caucasian .09 .13 .91 -.24 .42
* p <.05

81
Table 12: Multiple comparisons - Importance of CA on department
Dependent Variable (I) (J) (I-J) Std. Error Sig.
95% Confidence Interval
Lower Bound Upper Bound
CA –
Importance f & b
finance .15 .14 .71 -.21 .51
room -.07 .11 .94 -.35 .22
sales/HR .27 .15 .27 -.12 .65
finance f & b -.19 .14 .71 -.51 .21
room -.22 .12 .26 -.51 .09
sales/HR .12 .15 .87 -.28 .51
room f & b .07 .11 .94 -.22 .35
finance .21 .12 .26 -.09 .51
sales/HR .33* .13 .05 .00 .66
sales/HR f & b -.27 .15 .27 -.65 .11
finance -.12 .15 .87 -.51 .28
room -.33* .13 .05 -.66 -.00
* p <.05

82
Table 13: Multiple comparisons - Importance of EF on department
Dependent Variable (I) (J) (I-J) Std. Error
Sig.
95% Confidence Interval
Lower Bound Upper Bound
EF –
Importance f & b
finance .31 .17 .25 -.12 .74
room -.24 .13 .25 -.58 .10
sales/HR .22 .18 .60 -.24 .68
finance
f & b -.31 .17 .25 -.74 .12
room -.55* .14 .00 -.92 -.19
sales/HR -.09 .18 .96 -.57 .38
room
f & b .24 .13 .25 -.10 .58
finance .55* .14 .00 .19 .91
sales/HR .46* .15 .01 .07 .85
sales/HR
f & b -.22 .18 .60 -.68 .23
finance .09 .18 .96 -.38 .57
room -.46* .15 .01 -.86 -.07
* p <.05

83
* p <.05
Table 15:Multiple comparisons - Performance of EF on generation
Dependent Variable (I) (J) (I-J) Std. Error Sig.
95% Confidence Interval
Lower Bound Upper Bound
EF-
Performance
Gen Y
Gen X .31 .14 .08 -.03 .65
Mature -.10 .17 .84 -.50 .31
Gen X
Gen Y -.31 .14 .08 -.65 .03
Mature -.40* .16 .03 -.77 -.04
Mature
Gen X .10 .17 .84 -.31 .50
Gen Y .40* .16 .03 .04 .77
* p <.05
Independent samples t-test
For hotel classification, post-hoc was not feasible because it had less than three levels;
hence, independent samples t-test was performed to examine the differences of the mean scores
Table 14: Multiple comparisons - Performance of CA on generation
Dependent Variable (I) (J) (I-J) Std. Error
Sig.
95% Confidence Interval
Lower Bound Upper Bound
CA-
Performance
Gen Y Gen X .28* .11 .03 .02 .53
Mature -.15 .13 .47 -.45 .15
Gen X Gen Y -.28* .11 .03 -.53 -.02
Mature -.43* .12 .00 -.70 -.15
Mature
Gen X .15 .13 .47 -.15 .45
Gen Y .43* .12 .00 .15 .70

84
between hotels based on the level of green certification. Although the magnitude of the mean
difference among hotels - level “one” and “two” green certification - were not extreme,
interestingly, the mean scores of level “one” green certified hotels were higher than level “two”
green certified hotels on both - performance of RC and EF in the amount of .23. The results of
independent-sample t-test are presented in Table 16.
Table 16: Independent sample t-test - Performance of RC and EF by hotel classification
Hotel Classification Mean SD F Sig. (2-tailed)
RC-Performance
Level 1 4.00 .83 .575 .04
Level 2 3.77 .77
EF-Performance
Level 1 3.79 .79 6.52 .05
Level 2 3.56 .96
In order to better understanding of post-hoc analysis, the mean scores of the groups were
used for post-hoc HSD is presented in Table 17.

85
Table 17: Mean scores of groups – generation, ethnicity, and department
Dependent Variable
Independent Variables - groups
Mean
Std. Deviation
CA – Performance
Generation Y 4.07 .63
Generation X 3.79 .70
Mature 4.22 .51
EF - Performance
Generation Y 3.79 .81
Generation X 3.48 .88
Mature 3.88 .86
RC – Importance
Black /African American 3.78 .60
Hispanic 4.20 .57
White/Caucasian 4.05 .60
Other 4.14 .70
EF – Importance
F & B 4.09 .73
Finance 3.78 .67
Room 4.33 .66
Sales/HR 3.87 .79
CA - Importance
F & B 3.96 .53
Finance 3.77 .73
Room 4.02 .74
Sales/HR 4.03 .59

86
Conclusion
Overall, performance level of green practices embraced by hotels was lower than
importance level as assessed by the hotel employees. The IPA grid presents that there are some
areas of green practices that need to be improved, are already well-performed or are not
necessary to be concerned. Importantly, data analysis show that overall (1) there are significant
difference between importance perception and performance perception regarding green practices
as assessed by the hotel employees, and (2) green practices positively correlate to organizational
commitment.
Although most demographic variables did not yield significant difference in green
perceptions, a series of statistical analysis suggest that (1) Hispanic people perceived recycling
was important more than other ethnicities, (2) the department, such as housekeeping or
engineering, showed more green concerns than others, specifically in the area of clean air and
energy efficiency, (3) generation X was more critical than other generations on the performance
by the hotels, and (4) performance levels as evaluated by the hotel employees differed by the
levels of green hotel certification. Further discussions are followed in Chapter Five.

87
CHAPTER FIVE: DISCUSSIONS & CONCLUSION
Introduction
The goal of this study was to examine green practices of the hotel industry from the
perspective of hotel employees. This chapter is designed to provide further insight on the results
of this research as they relate to the findings of the existing literature. First, a summary of the
finding is presented to provide an idea of how this research was conducted and the significant
results are that this study has produced. Second, employees’ perceptions of green practices in
terms of green practices and the hotels’ performance level are discussed and compared to the
previous relevant literature. Third, findings on the correlation between organizational
commitment and implementation of green practices are compared to previous research in the
area of the subject. Fourth, demographic characteristics as a predictor of green perceptions at
work are discussed. Lastly, implications and limitations of the study are presented.
Summary of Study Results
This research utilized a survey design to generate the necessary data to answer the
proposed research questions. After the dimensions of green practices were identified from the
previous literature on the topic, this study identified how the employees in the hospitality
industry perceived green practices. Through the pilot test, the questionnaire was clarified to

88
survey the hotel employee population. Finally, 220 usable questionnaires were used for data
analysis.
The first research point that guided this study was whether a gap exists between the
employees’ perception of the degree of importance of green practices and the overall
performance level of those practices. IPA and the paired t-test indicated that the population
perceived that green practices were important in showing a mean score of 4.12. Although the
performance level was assessed at the “fair” level with the mean score of 3.86, the population
viewed that the performance level of green practices by the hotels did not exceed its expectation
on green practices. Therefore, it was concluded that there was a gap between perceived
importance of green practices and actual performance levels.
Overall, the population agreed that green practices exhibited an important relevance to its
health issues: the findings revealed that, to the population, “non-smoking policies” were the most
important as well as the best-performed green activity. Conversely, energy efficiency was
ranked at the lowest performing activity among the four green dimensions, and due to the low
performance level energy efficiency dimension had the largest score gap of .44 between
importance and performance.
The second point led this research was whether a hotel’s green practices were related to
its organizational commitment. The results of the correlation analysis indicated that a positive
relationship existed between organizational commitment (OC) and implementations of green
practices. Although the strength of correlation between OC and green practices was at the
moderate level, the positive correlation of two variables was consistent across the green

89
dimensions in both importance and performance. Furthermore, in the area of water conservation
(r =.38) and air quality (r =.32) importance and performance showed the strongest correlation to
the OC. Performance level of waste reduction (r =22) and importance of energy efficiency (r
=.26) depicted the weakest correlation to the OC.
The third point that guided this study was whether the demographic characteristics of the
workforce served as a predictor of their green perception. According to the results of
MANOVA, the employees’ demographic characteristics exhibited very little variance in their
green perception at work. The majority of the demographic characteristics reached insignificant
results; the exception were ethnicity in regard to RC in importance, the department in which the
employee worked relative to CA and EF in importance, generation on CA and EF in
performance, and the hotel classifications on RC and EF in performance.
Additionally, in regards to the variables that reached significance, ANOVA and multiple
comparisons were conducted. It was revealed that: (1) Hispanics more than other ethnic groups
perceived that recycling was of most importance (2) overall, hotel departments such as
housekeeping and engineering showed more green concerns towards environmental issues than
others, specifically in the areas of clean air and energy efficiency, and (3) generation X was more
critical of the performance by the hotels than other generations. Interestingly, independent
sample t-test showed that the performance level of two “Palm” certified hotels was lower than
the hotels that had level one “Palm” certification. The following section discusses the findings
related to the research questions that were examined in this study.

90
Discussion
Comparison of Importance and Performance
The analysis comparing the importance and performance of green practices suggest
employees acknowledged and approved of green practices in the workplace. In accordance with
previous studies, several issues are brought to light. First, it was assumed that the perceptions of
non-management employees towards green practices might be different than those at the
managerial level. However, based on the research findings of this study, industry wide, the
perceptions of the hotel employees do not differ based on the level of their position within the
company. The findings of Bohdanowicz (2005) and Kirk (1998) suggested that hoteliers
positively perceived green practices. Similarly, the hotel employees that participated in this
study also had a positive perception of green practices with the high mean score. It can be
implied and safe to say that individuals in the hotel industry viewed green practices should be
implemented.
Second, Shanklin (1993) and Suttell (2005) indicated that the most prominent focus of
green practices in the hospitality industry was non-smoking policies. Similarly, their findings
have not changed within this study. “Non-smoking policies” are ranked at the highest level in
both importance and performance measures; it clearly suggests that they are the most visible
green activity in the hotel industry.
When investigating the possible reasons as to why employees perceive “non-smoking
policies” at the forefront of green programs, this study suspects it comes from two possible

91
sources. Based on Repace’s (2004) claim that eliminating smoking in the workplace improves
comfort level of the workers, it is logically assumed that there exists a cleaner and more
favorable working environment in hotels that embraced and implemented a no-smoking policy.
In addition, employees have seriously responded to health concerns, and the attention to those
concerns has carried over to the hotel industry generally (“no-smoking”, 2006). This can be
related to Cascardo’s (2007) finding that claims awareness of air quality in the hospitality
industry has increased.
However, conflicting findings were found by the empirical evidence of Shopland,
Anderson, Burns, and Gerlach (2004) who examined and reported that workers in the service
industry were not protected by no-smoking policy. The phenomenon might have dramatically
changed in the last few years, yet their findings appear to be isolated from other studies on this
subject.
Also, showing the lowest mean score of 3.70, energy efficiency is shown to need
improvement according to the population surveyed: the same finding was revealed by AH & LA
(2008). In the Green Assessment Survey, 217 hoteliers agreed that energy efficiency remains a
challenging area for the hotel industry. Notably, the employees who participated in this study
share the same opinion with the hoteliers on this issue. Additionally, Bohdanowicz (2006)
claimed that energy efficiency was the prevalent area of concern by hoteliers. The cost factor of
the new technologies at first glance might be a reasonable argument to support it. However, as
suggested by Iwanowski and Rushmore (1994) and Claver-Cortés et al. (2007) the initial costs to

92
improve energy efficiency should be evaluated with consideration to the return on the investment
that such improvements would provide.
Presently, there exists a low priority among hotel employees to engage in green practices
to reduce food waste. These findings may be instrumental to explaining why they have not yet
been successfully implemented. This is supported by the findings of Okazaki et al. (2008) and
the report of Alexander (2002) and includes Green Assessment Survey by AH & LA (2008) and
statistics by California Integrated Waste Management Board ([CIWMV], 2009). It is true that
there are several factors inhibiting the efforts to reduce food waste (Bohdanowicz, 2006), yet this
study revealed that employees’ perception about the importance of activities to reduce food
waste can be an underlying reason as to why it has not been significantly reduced.
The reasons that the employees perceive activities to reduce food waste are less important
than other green activities will be arguable because perception of green issues is complex and is
influenced by several factors (Kollmuss & Agyeman, 2002). Yet, this research tries to find logic
to explain this phenomenon under McKenzie-Mohr’s sustainable behavior (2000). Activities to
reduce food waste may take time and extra efforts which require behavior changes among
employees. Behavior changes include revising their present comfort level by participating in
these activities (McKenzie-Mohr, 2000), thus creating the impression that accomplishing food
waste reduction may be a more difficult things to do.
An assumption this study suggests may explain anther phenomenon: Gustin and Weaver
(1996) demonstrated in their research which found that travelers supported green practices
overall yet selectively. In the study, travelers who wanted to stay at a green facility supported

93
water conservation, but they did not want to use a low-flow showerhead which, to them, may
have meant compromising their comfort level.
Overall, this study found that green practices are well-received by the employees and
widely embraced by hotel organizations. This finding is also parallel with Bohdanowicz’s
(2006) findings, Alexander’s (2002) report, and the survey results of AH & LA (2008) which
commonly indicate that green practices are not unusual within the hotel industry. However, the
findings above differed from the claim of Butler (2008) who addressed the notion that the
hospitality industry has been holding back on the implementation of green practices until
consumer demands dramatically increase.
Although Butler’s claim is respectable, it does not seem to lend the same interpretation as
other numerous researches, which suggested that hotel guests welcomed and were ready for
green practices of the hotel industry (Gustin &Weaver, 1996; J. D. Powder Associates, 2007;
Manaktola & Jauhari, 2007). In fact, research about guests’ attitudes toward green practices
commonly indicates that guests prefer to stay at a green hotel. Heung et al. (2006) found that
travelers in China were willing to stay at a green hotel despite being unclear about the
determining factors of how the property is so designed. Also, Gustin and Weaver (1996), and
Manaktola and Jauari (2007), and revealed that travelers/guests support hotels’ green practices.
It is true that there are differences between the concepts “demand” and “support or willingness,”;
however, a widely considered view is that guests/travelers approve of green practices of the hotel
industry.

94
Ironically, this study found that the performance level by level two green certified hotels
was lower than those certified level one as observed by the employees, specifically in the areas
of recycling and energy efficiency. Logical principles behind it are unclear; however, this study
assumes two possibilities. First, employees’ expectations might shape their perception of what
the performance level should be. In other words, employees perceive the performance of green
activities as the difference between actual performance and their expectation. Therefore, the
employees of the hotels that had “level two” green certification might have higher expectations
than the employees of the “level one” green certified hotels. Consequently, their (the employees
at the level two certified hotels) assessment on the performance might be more critical.
Second, once a hotel obtains the entry level of green certification, its motivation level for
higher certification may begin to decline which can interpreted as reluctance and may lead to a
more critical assessment from the employees. Furthermore, governmental regulation
recommends that hotels strive to obtain a higher certification, yet they are not required to do so.
It is true that a higher level of green certification has more requirements to fulfill; however, these
requirements are not much different than ones at the introductory level of green certification.
The higher level of green certification should have higher green performance level, yet the
employees do not assess it that way.

95
Organizational Commitment and Green Practices
Simply, stating the relationship between organizational commitment (OC) and green
practices, the discussions of this study can be narrowed down to only one conclusion: there is a
positive correlation between OC and green practices. The previous literature also showed
consistent findings on this subject this study is not exempt. Accordingly, the finding of this
study leads to discussions below:
Insync (2008) surveyed 14,000 employees and concluded that there was a strong
correlation between employees’ perception about their company being green and their
commitment to the organization’s efforts. Similarly, this study has reported a positive
relationship between green practices and organizational commitment. However, a difference on
the findings of Insync’s survey (2008) and this study would be that the former survey found a
strong correlation between OC and green practices; meanwhile, the latter one showed a modest
correlation between the two. The findings of this research are also related to the suggestion of
Brammer et al. (2007) found that positive relationship existed between CSR and organizational
commitment.
This study cautiously suggests that organizational commitment may be a positive benefit
of green practices (Burke & Logsdon, 1996; SHRM, 2007; Maignan et al., 1999). In fact, the
similar discussion was elaborated in the investigation of Bohdanowicz et al. (2005) revealed that
employees of several Swedish Scandinavian hotels were more committed to the hotels
implemented green practices.

96
Demographic Factors and Green Perception of the Employees at Work
The findings of the study suggest, as did Van Liere and Dunlap (1980), that demographic
characteristics have very limited affect on people’s green perceptions. Although four
demographic variables reached statistical differences in this study, majority of demographic
variables used in this study showed non-significance of green perceptions. Hence, the
discussions followed will be proceeding based on the variables reached in statistical differences.
Ethnicity and green perception
This research found that minority groups, especially Hispanics, showed a stronger green
tendency than other ethnicities. This finding is similar to the empirical evidence of Kahn (2002)
which concluded minorities such as Hispanic people more supported environmental regulations.
However, it differs from the finding of Greenberg (2005) which showed that Hispanic people
had a lower green tendency than Caucasians or African Americans. The finding from Mohai &
Bryant (1998) revealed African Americans were more green conscious than Caucasians did not
appear in this study. Rather, African Americans were less so than other races which is consistent
with the findings of Howenstine (1993) and Newell and Green’s (1997) investigation.
The finding of this study might be critical due to the fact that the hotel industry is rapidly
diversifying. In fact, minorities are comprising more of the labor force in the U.S. due to
immigration (U.S. Department of Labor, 2009); especially, 21.5 % of Hispanic population in the
U.S was employed by hospitality firms as of 2008 (U.S. Department Labor, 2009). These figures

97
clearly show that the hotel industry needs shift more focus on minorities when planning green
practices.
Department and green perception
The findings in regards to department: each department seems to have varying interests
towards green practices. Primarily, green concerns are more obvious phenomena among the
employees in operational departments such as housekeeping or engineering although the
underlying principles are unclear. In all probability these employees have more exposure to
green related activities compared to employees in other departments. In general, the employees
in operational departments are directly involved and have more opportunities to observe green
practices in several ways. For instance, when a housekeeper cleans a hotel room, he or she will
be required to turn off the lights or water. Requiring these energy conserving actions may
increase green consciousness as well as the importance of these activities. Meanwhile, the
employees from some departments such as finance may not have as frequent opportunities to
engage in these practices that operational staffs do. While they are good habits they are not part
of their day to day job requirement resulting in less concern.
Age and green perception
The majority of the previous studies to identify green perception in age employed two
categories, young and old. It is difficult for the findings of the study to be evaluated against the
previous studies, since this study encompassed three generations including an “in between
98
generation,” - generation X. In this study, generation X, is defined as an age range from 28 to
44: they were the most critical about their hotels performance of green practices by giving lower
credits. The findings of this study are similar to Insync’s (2008) survey which revealed that
employees whose age ranged from 24 to 34 were most critical of their employer’s green
performance. In helping these findings, it seems that generation X workers hold their company
to a higher standard of green performance. This finding of the study can be important because a
workforce dominated by this age group seems to demand improved green performance which in
turn might increase their commitment possibly resulting in a higher success rate in the
competitive market.
Practical Implications of Study
This study provides new insights into the practice of green activities in the hotel industry.
It outlines how its employees perceive green practices and takes an initial step in identifying the
relationship between green practices and employees perceptions of their company’s commitment
to them. Also, based on the author’s best knowledge this study might be the first research that
investigates employees’ perception of green practices within the hotel industry.
This study can be an instrument to motivate employees’ participation in green practices;
it can be used as a tool to develop training programs for these activities and serve a guideline for
management to introduce and set policies. These managerial implications result in the following
principal recommendations for hotels to progress in their green practices.

99
First, the benefits of green practices should be frequently communicated with employees
to encourage their green participation. This study indicates that employees who focused on
green activities saw the benefits relative to their personal health issues. Therefore, the positive
results of green practices should be promoted as an employee benefits to maximize its effects.
For instance, it will be better that a company promotes its green practices by not focusing
“saving the earth” but “saving the company” and “a benefit to the employees as well.” This can
serve as a strong motivation for employees to participate in their company’s green practices.
Furthermore, communication should provide clear goals to employees and clarify their
role in improving green practices. Despite the fact that communication is essential in reinforcing
green practices, it is not being utilized to its potential in the hotel industry (Madesn & Ulhoi,
2001; Zilahy, 2004). For communication, a team-based style is suggested, especially at the onset
of green initiatives. Team-based communication methods will develop confidence in new
schemes and policies among the employees because it gives them opportunities to share their
ideas and concerns (Eby, Adams, Russell, & Gaby, 2000) about green practices. In the team-
based communication environment, employees are clearly informed as to what their employer
prospects from them as well as long and short term goals that are expected to be achieved.
Recognition of outstanding actions towards achieving green initiatives should be an
integral part of the program and can be given as monetary or verbal acknowledgement.
Monetary rewards can be given for certain achievements of green practices and can certainly act
as a strong motivator for employees to participate. Verbal acknowledgement, especially in the
presence of coworkers can be just as motivating.

100
Second, hotels should do their best to facilitate employees’ participation in green
practices so that the employees do not feel that doing so is an inconvenience. For example,
recycle bins should be visible and easily accessible so that paper can be properly collected for
reuse. Hence, employees should not be made to perceive that barriers exist when they participate
in their company’s green programs.
Third, hotels should offer various green training programs based on the employees’
needs and interests, and these should be job-specific: (1) educating minorities in their native
languages during green training will reinforce their green participation: Greenberg (2005)
showed that Hispanics who had information given to them in their languages were more inclined
to participate than Hispanic people who were informed in English, and (2) green goals should be
department specific focusing on their interests that the department possesses: this will encourage
and their participation during the green training. It would be more realistic for a finance
department to place emphasis on paper recycling rather than use of an environmentally friendly
cleaner. Also, creative promotions would be a great tool to motivate green participation should
be used during the green training because employees who are reluctant to embrace green
practices need to be inspired.
Fourth, the management should generate feedback from the employees on a regular basis
to keep them informed about their property’s green practices. In doing so, not only can the
results of these activities be evaluated but sharing results can actuate ideas for improvement and
well as increase commitment. Regular assessment of green performance by the employees will
foster a positive attitude and encourage the thinking that green practices are not just a short-term

101
initiative to increase business but their company’s permanent philosophy that will contribute to
the community too.
Conclusions
For last few decades, green practices have been commonly embraced by hotels. Besides
to the fact that there are several motivations to push the industry for going green, such practices
are becoming a matter of policy not option. Based on a survey of 220 hotel employees in
Orlando, this study has established the fact that the major stakeholder of the hotel industry, its
employees, has perceived green practices in a positive light and attached a high level of
importance to them. It is important to note that employees recognize the quality of their
employers’ performance in green related activities and agree that industry wide improvement is
needed.
It is apparent that the link between green practices and organizational commitment is still
its formative stages in academia since the relationship between the two more likely requires
additional investigation. However, this study supports a newly thriving positive relationship and
should be recognized throughout the hotel industry as a stepping stone for future goals and
commitments to green strategies. Furthermore, this positive correlation between green practices
and organizational commitment may serve as a training tool for HR strategy as well as act to
communicate a positive corporate image to employees.
Employees’ perception of green initiatives in workplace was not influenced by their
demographic characteristics; however, it should not be said that those characteristics are invalid
102
to examine the employees’ green perception. This study detects a few noticeable facts about the
employees’ importance and performance perception. Also, it suspects that if the demographic
factors are used in combination of circumstances, the results may be more consistent and
significant. Worth nothing is this study suggests that in order for improvement in the
implementation and practices of green initiatives, hotels should take into consideration not only
compliance to suggested guidelines but also the degree to which employees embrace those
initiatives. The root of commitment should be cultivated by the employees to realize success.
Limitations and Future Research
This study has several limitations that should be noted. First, as a matter of convenient
sampling, the data was collected from certified hotels in Orlando only: the results of this study
may not be applicable to hotels in all areas. Second, this study measured a narrow range of green
factors: recycling, clean air, energy efficiency, and water conservation, some other relevant
factors of green practices may be shown to be more valuable among employees in the hotel
industry. Third, there was a lack of reference material for each green dimension which may be
one reason for the general lack of research of green practices in the hotel industry. Also, this
study included a number of items asking for organizational commitment. However, because
organizational commitment is affected by various factors, the relationship between green
practices and organizational commitment in this study is considered oversimplified. The results
of IPA should not be considered as an absolute level. Lastly, there were some items such as

103
reclaiming water or cleaning AC units that posed a challenge to assess performance levels
because there are a limited number of employees involved in these activities.
Further research would be appropriate better formulate the relationship of green practices
and employee involvement and perception including motivational tools to enhance participation
and strategies for the design of ongoing green training and communication. Clearly, research
remains to be conducted in the area of green practices and employees issues in the hotel industry.

104
APPENDIX A: SURVEY INSTRUMENT

105
Green Practice SurveyThis survey includes FOUR different sections, Please answer all of them. Thank You
1 2 3 4 5
1 2 3 4 5
1 2 3 4 5
1 2 3 4 5
1 2 3 4 5
1 2 3 4 5
1 2 3 4 5
1 2 3 4 5
1 2 3 4 5
1 2 3 4 5
1 2 3 4 5
1 2 3 4 5
1 2 3 4 5
1 2 3 4 5
1 2 3 4 5
1 2 3 4 5
1 2 3 4 5
1 2 3 4 5
1 2 3 4 5
1 2 3 4 5
1 2 3 4 5
PLEASE CONTINUE TO THE BACK PAGE
Using high energy efficient lighting (compact fluorescents) throughout the property
Setting temperature appropriately in back of the house (office, kitchen, etc)
Towel and linen reuse program in guest rooms
Keeping relative humidity at certain level to prevent the growth of mold (e.g 35‐60% in FL)
Using sky‐lights to maximize natural light throughout the property
Using environmentally preferable cleaning products (e.g.Green Seal certified products, etc)
Cleaning AC units regularly to prevent bacteria
Using automatic sensor lighting on property
Using Energy Star rated equipments (referigerator, copier, etc)
Using low‐flow fixtures (toilet, sink, etc)
Recycling ( cardboards, papers, cans, plastics, bottles, etc.)
Using reusable utensils rather than disposable ones
Purchasing / using post consumer recyclable products (office supplies,hand towels,etc)
Serves proper portion of food to reduce food waste
Paperless policy including use of electronic softwares or system (E‐copy, email, etc)
Non‐smoking policy (non‐smoking throughout property) for indoor air quality
Place green live plants on property for the quality of indoor air
Using automatic low‐flow fixtures (toilet, sink,etc)
Reclaiming water for reuse ( e.g. irrigation)
Landscaping with native plants to minimize water consumption
How important is it ?
Uni
mpo
rtant
Littl
e im
porta
nt
Mod
erat
ly Im
porta
nt
Very
Impo
rtant
Extre
mel
y im
porta
nt
Section 1 HOW IMPORTANT IS EACH ATTRIBUTE TO YOUR HOTEL !
The following is a list of green practices. Please indicate your level of agreement to each of the following items regarding the
importance level of green practices to your hotel 1 = Unimportant , and 5 = extremely important

106
1 2 3 4 5
1 2 3 4 5
1 2 3 4 5
1 2 3 4 5
1 2 3 4 5
1 2 3 4 5
1 2 3 4 5
1 2 3 4 5
1 2 3 4 5
1 2 3 4 5
1 2 3 4 5
1 2 3 4 5
1 2 3 4 5
1 2 3 4 5
1 2 3 4 5
1 2 3 4 5
1 2 3 4 5
1 2 3 4 5
1 2 3 4 5
1 2 3 4 5
1 2 3 4 5
PLEASE CONTINUE TO THE NEXT PAGE
Landscaping with native plants to minimize water consumption
Section 2 HOW WELL DOES YOUR HOTEL PERFORM GREEN PRACTICES?
The following is list of green pracices. Please indicate your level of agreement to each of the following items about the performance level of your hotel on green practices.
1 = poor, and 5 = excellent
How well does your hotel ?
Poor
Fair
Goo
d
Very
goo
d
Exce
llent
Recycling (cardboards, papers, cans, plastics, bottles, etc.)
Using reusable utensils rather than disposable ones
Purchasing/using post consumer recyclable products (office supplies, hand towels, etc)
Serves proper portion of food to reduce food waste
Paperless policy including use of electronic softwares or system (E‐copy, email, etc)
Non‐smoking policy (non‐smoking throughout property) for indoor air quality
Reclaiming water for reuse (e.g. irrigation)
Using automatic sensor lighting on property
Using Energy Star rated equipments (referigerator, copier, etc)
Using high energy efficient lighting (compact fluorescents) throughout the property
Setting temperature appropriately in back of the house (office, kitchen, etc)
Using environmentally preferable cleaning products (e.g.Green Seal certified products, etc)
Cleaning AC units regularly to prevent bacteria
Using sky‐lights to maximize natural light throughout the property
Towel and linen reuse program in guest rooms
Place green live plants on property for the quality of indoor air
Keeping relative humidity at certain level to prevent the growth of mold (e.g 35‐60% in FL)
Using low‐flow fixtures (toilet, sink, showerheads)
Using automatic low‐flow fixtures (toilet,sink,etc)

107
1 2 3 4 5
1 2 3 4 5
1 2 3 4 5
1 2 3 4 5
1 2 3 4 5
1 2 3 4 5
1 2 3 4 5
Section 4
Please check ( √ ) one of each the following demographic information
1 What is your gender?
Female
Male
2
3
Single
Married
Separated
Divorced
Widowed
4 What is your highest level of education?
Some High School
High School Graduate
Junior College Graduate
College Graduate
Master's Degree
5 What is your authenticity?
Black / African American
Hispanic
White / Caucausion
Others (please specify) ______________________________________
PLEASE CONTINUE TO THE BACK PAGE ( LAST PAGE )
What is your age? ______________ Years
What is your marital status?
I talk up this company to my friends as a great company to work for
I am extremely glad that I chose this organization to work for
I really care about the fate of this organization
For me, this is the best of all possible companies to work for
I am proud to tell others that I am part of this organization
I find that my values and the organization's value are similar
Section 3 Please indicate the your level of agreement to each of the following statements
1 = strongly disagree, and 5 = strongly agree
stro
ngly
di
sagr
ee
disa
gree
neut
ral
agre
e
stro
ngly
ag
ree
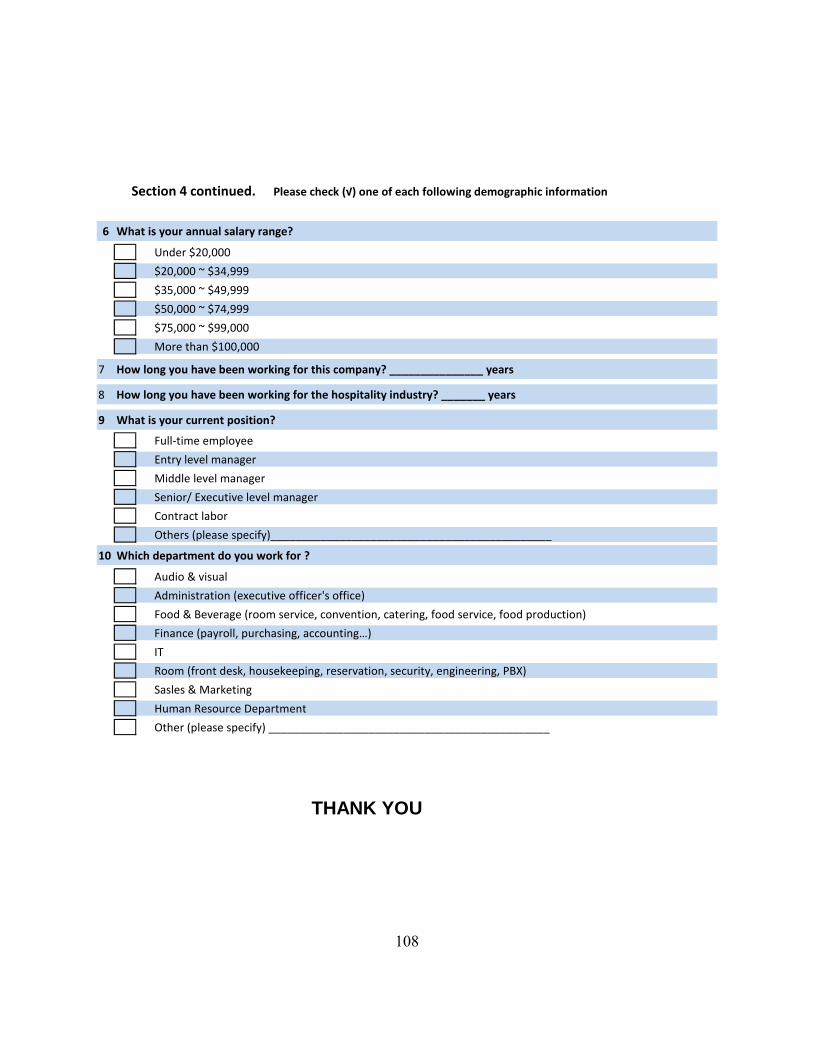
108
Section 4 continued. Please check (√) one of each following demographic information
6 What is your annual salary range?
Under $20,000
$20,000 ~ $34,999
$35,000 ~ $49,999
$50,000 ~ $74,999
$75,000 ~ $99,000
More than $100,000
7 How long you have been working for this company? _______________ years
8 How long you have been working for the hospitality industry? _______ years
9 What is your current position?
Full‐time employee
Entry level manager
Middle level manager
Senior/ Executive level manager
Contract labor
Others (please specify)_____________________________________________
10 Which department do you work for ?
Audio & visual
Administration (executive officer's office)
Food & Beverage (room service, convention, catering, food service, food production)
Finance (payroll, purchasing, accounting…)
IT
Room (front desk, housekeeping, reservation, security, engineering, PBX)
Sasles & Marketing
Human Resource Department
Other (please specify) _____________________________________________
THANK YOU

109
APPENDIX B: UCF IRB NOTICE OF EXEMPTION

110

111
APPENDIX C: INFORMED CONSENT FORM

112
Informed Consent
Researchers at the University of Central Florida (UCF) study many topics. To do this we need the help of people who agree to take part in a research study. You are being invited to take part in a research study which will include about 200 people. You can ask questions about the research. You can read this form and agree to take part right now, or take the form home with you to study before you decide. You will be told if any new information is learned which may affect your willingness to continue taking part in this study. You have been asked to take part in this research study because you are a employee in the hospitality industry (hotels). You must be 18 years of age or older to be included in the research study and sign this form. The person doing this research is Sun-Hwa Kim, an master program student at the Rosen College of Hospitality Management, University of Central Florida (UCF). Because the researcher is a master student, Sun-Hwa Kim is being guided by Dr. Fevzi Okumus , a UCF faculty supervisor in Hospitality Service Department Study title: Employee Perceptions on Green Practices in the Hotel Industry Purpose of the research study: The purpose of this study is to investigate how the hotel employees perceive green practices in the hotels What you will be asked to do in the study: You will be asked to participate in answering survey questions of forty items and ten demographic information questions Voluntary participation: You should take part in this study only because you want to. There is no penalty for not taking part, and you will not lose any benefits. You have the right to stop at any time. Just tell the researcher or a member of the research team that you want to stop. You will be told if any new information is learned which may affect your willingness to continue taking part in this study. Location: The researcher will deliver survey to the hotels that want to participate this survey. The survey will be collected at a designated place of the hotels for the employees’ conveniences drop it off. Time required: You are required to participate in the survey only once and there is no further process relating to this survey. It is expected to 5 to 7 minutes to finish this survey.
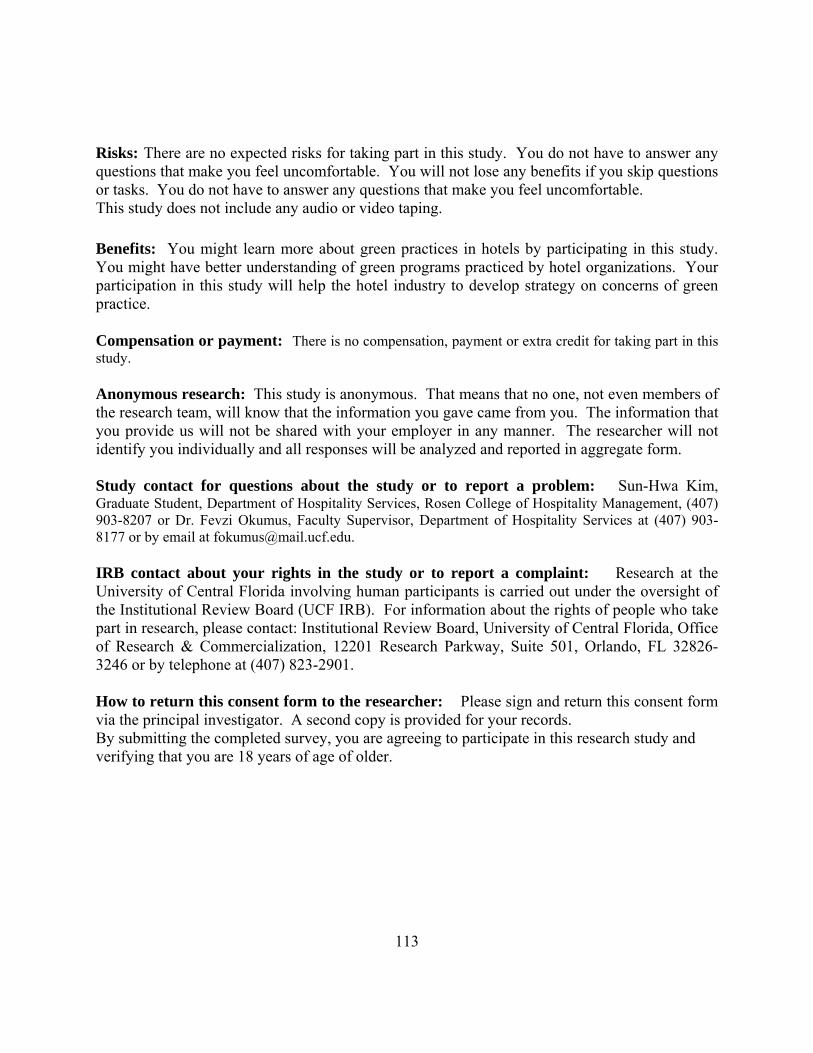
113
Risks: There are no expected risks for taking part in this study. You do not have to answer any questions that make you feel uncomfortable. You will not lose any benefits if you skip questions or tasks. You do not have to answer any questions that make you feel uncomfortable. This study does not include any audio or video taping. Benefits: You might learn more about green practices in hotels by participating in this study. You might have better understanding of green programs practiced by hotel organizations. Your participation in this study will help the hotel industry to develop strategy on concerns of green practice. Compensation or payment: There is no compensation, payment or extra credit for taking part in this study. Anonymous research: This study is anonymous. That means that no one, not even members of the research team, will know that the information you gave came from you. The information that you provide us will not be shared with your employer in any manner. The researcher will not identify you individually and all responses will be analyzed and reported in aggregate form. Study contact for questions about the study or to report a problem: Sun-Hwa Kim, Graduate Student, Department of Hospitality Services, Rosen College of Hospitality Management, (407) 903-8207 or Dr. Fevzi Okumus, Faculty Supervisor, Department of Hospitality Services at (407) 903-8177 or by email at [email protected]. IRB contact about your rights in the study or to report a complaint: Research at the University of Central Florida involving human participants is carried out under the oversight of the Institutional Review Board (UCF IRB). For information about the rights of people who take part in research, please contact: Institutional Review Board, University of Central Florida, Office of Research & Commercialization, 12201 Research Parkway, Suite 501, Orlando, FL 32826-3246 or by telephone at (407) 823-2901. How to return this consent form to the researcher: Please sign and return this consent form via the principal investigator. A second copy is provided for your records. By submitting the completed survey, you are agreeing to participate in this research study and verifying that you are 18 years of age of older.

114
APPENDIX D: SURVEY PARTICIPATION LETTER

115
Employee perceptions on green practices in the hotel industry
Dear Participant,
My name is Sun-Hwa Kim, a master program student at the Rosen Hospitality Management, University of Central Florida (UCF). I am inviting you to participate in a voluntary survey. You participation and answers are crucial for assessing green practices in the hospitality industry more specifically the hotel industry.
• The following questions ask about your perceptions on green practices at workplace.
• This survey is completely voluntary. You may choose not to participate or not to answer any specific questions. You may skip any question you are not comfortable answering. You can decline to participate in this survey. There are no anticipated risks.
• Do not take this survey if you are under age of 18.
• The survey is anonymous. You can be assured that your responses will never be matched with your name from the survey when it is submitted.
• This study examines the perceptions of green practices. The information will be used to improve the knowledge of green practices in the hospitality industry specifically the hotel industry as well as to improve green practices strategy of service organizations.
• Your privacy and research records will be kept confidential to the extent of the law. Authorized
research personnel, the UCF Institutional Review Board and its staff, and other individuals, acting on behalf of UCF, may inspect the records from this research project. The results of this study may be published. However, the published results will not include your name or any other information that would personally identify you in any way
• If you have any questions about this survey, please contact Sun-Hwa Kim, the principal
investigator of this study, at 407-903-8207 or Dr. Fevzi Okumus, a UCF faculty supervisor of this study, at 407-903-8177.
• Research at the University of Central Florida involving human participants is carried out under
the oversight of the Institutional Review Board (IRB). Questions or concerns about research participants’ rights may be directed to UCF Institutional Review Board Office at the University of Central Florida, Office of Research and Commercialization,12201 Research Parkway, Suite 501, Orlando, FL 32826-3246. The phone numbers are 407-823-2901 or 407-882-2276.
• The survey will take approximately five minutes to complete.
• Thank you for taking the time and thought to complete this survey. We sincerely appreciate your participation. Your time and effort in helping us gather information is greatly appreciated. Sincerely Sun-Hwa Kim

116
LIST OF REFERENCE
Aguilera, R.V., Rupp, D.E., Williams, C.A., & Ganapathi, J. (2007). Putting the S back in corporate social responsibility: a multilevel theory of social change in organizations. Academy of management review, 32(3), 836-863.
Albinger, H.S., & Freeman, S.J. (2000). Corporate social performance and attractiveness as an employer to different job seeking populations. Journal of Business Ethics, 28(3), 243-253.
Alexander, S. (2002). Green hotels: Opportunities and resources for success. Zero Waste
Alliance. Retrieved June 20, 2008 from http:// www. zerowaste.org/publications/Green_ Ho.PDF
American Hotel and Lodging Association. (2008). American hotel and lodging association survey identifies hotels’ top green initiatives and challenges. Retrieved May 17, 2008 from http:// www. Ahla.com/pressrelease.aspx?id=21700&terms=green
Angelo, R.M., & Vladimir, A.N. (2004). Hospitality today. Managing human resource
(pp. 377- 404). Lansing, MI: Educational Institute of the American Hotel & Lodging Association.
Arcury, T.A. & Christianson, E.H. (1990). Environmental worldview in response to environmental problems: Kentucky 1984 and 1988 compared. Environment Behavior, 22 (3), 387-407.
Arthur D. Little (2003). The business case for corporate responsibility. Retrieved March 10,2009 from http://www.bitc.org.uk/doucment.rm?id=5253.
Ashforth, B.E., & Mael, F. (1989). Social identity theory and the organization, Academy of Management Review, 14(1), 20-29. Backhaus, K.B., Stone, B.A., & Heiner, K.(2002). Exploring the relationship between corporate
social performance and employer attractiveness. Business and Society, 41(3), 292-318.
Becker, H.S. (1960). Notes on the concept of commitment. American Journal of Sociology, 66(1), 32-40.
Bhate, S., & Lawler, K. (1997). Environmentally friendly products: factors influence their adoption. Technovation, 17(8),457-465.

117
Biener, L., & Fitzgerald, G. (1999). Smoky bars and restaurants: Who avoids them and why?.
Journal of Public Health Management & Practice, 5(1), 74-78.
Blank, D. (1999). Seeing green: energy-saving efforts help hotels reduce maintenance and expenses. Hotel and Motel Management, 214(19), 68.
Bohdanowicz, P., Churie-Kalhauge, A.C., & Martinac, I. (2001). Energy-efficiency and conservation in hotels-Towards sustainable tourism. 4TH International Symposium on Asia Pacific Architecture. April, Hawaii.
Bohdanowicz, P. (2005). European hoteliers’ environmental attitudes: Greening the business. Cornell Hotel and Restaurant Administration Quarterly, 46(May), 188-204.
Bohdanowicz, P., Simanic, B., & Martinac, I. (2005). Environmental training and measures at Scandic hotel, Sweden. Tourism Review International, 9(1), 7-19.
Bohdanowicz, P. (2006). Environmental awareness and initiatives in the Swedish and Polish hotel industries-survey results. Hospitality Management, 25(4), 662-682.
Bohdanowicz, P., & Martinac, I. (2007). Determinants and benchmarking of resource consumption in hotels – Case study in Hilton International and Scandic in Europe. Energy and Buildings, 39(1),82-95.
Brammer, S., Millington, A., & Rayton, B. (2007). The contribution of corporate social
responsibility to organizational commitment. Human Resource Management 18(10),1701-1719.
Buysse, K., & Verbeke, A. (2003). Proactive environmental strategies: A stakeholder management perspective. Strategic Management Journal, 24(5), 453-470.
Burke, L., & Logsdon, J.M. (1996). How corporate social responsibility pays off. Long Range Planning, 29(4), 495-502.
Butler, J. (2008). The compelling “hard case” for “green” hotel development. Cornell Hotel and Restaurant Administration Quarterly, 49(3), 234-244.
California Integrated Waste Management Board. (2009). California green Lodging program. Retrieved February 2, 2009 from http”//www.ciwmb.ca.gov/EPP/greenlodging/
Cascardo, A. (2007). Indoor air pollution: an ever-growing threat to our society. Executive Housekeeping Today, October 9-13.

118
Chan, S.W., & Wong, C.K. (2006). Motivations for ISO 14001 in the hotel industry. Tourism
Management, 27(3), 481-492.
Chung, L.H., & Parker, L.D. (2008). Integrating hotel environmental strategies with management control: a structuration approach. Business Strategy and the Environment, 17(4), 272-286.
Claver-Cortés, E., Molina-Azorín, J.F., Pereira-Moliner, J., & López-Gamero, M.D. (2007). Environmental strategies and their impact on hotel performance. Journal of Sustainable Tourism, 15(6), 663-679.
Clark, C.F., Kotchen, M.J., & Moore, M.R. (2003). Internal and external influences on pro-
environmental behavior: Participation in a green electricity program. Journal of Environmental Psychology, 23(3), 237-246.
Coalition for Environmentally Responsible Economics (2001). Green hotel initiative: Best practice survey. Retrieved May 20, 2008 from http://www.ceres.org//page.aspx?pid=761
Collier, J., & Esteban, R. (2007), Corporate social responsibility and employee commitment. Business Ethics: A European Review, 16(1), 19-33.
Creswell, J. W. (2003). Research design (2nd ed.). California: Sage Publication. Cutter, S.L. (1995). Race, class and environmental justice. Progress in Human Geography,
19(1), 111-122.
Dagmar, W. (1994). Greening housekeeping. VOICE, July, 14-15. Dalton, G.J., Lockington, D.A., & Baldock, T.E. (2008). A survey of tourist attitudes to
renewable energy supply in Australian hotel accommodation. Renewable Energy, 33(10), 2174-2185.
Daily, B., & Huang, S. (2001). Achieving sustainability through attention to human resource factors in environmental management. International Journal of Operations & Production, 21(12), 1539-1552.
Daily, B., & Steiner, R. (2001). An empirical analysis of environmental performance: examining
the impact of human resource factors on the implementation of ISO 14001. Proceeding of National Decision Science Institute Meeting, San Francisco.
Davidson, D.J., & Freudenburg, W.R. (1996). Gender and environmental risk concerns: a review
and analysis of available research. Environment and Behavior, 28(3), 302-339.

119
Davis, K. (1973). The case for and against business assumption of social responsibilities.
Academy of Management Journal, 16(2), 312-323.
Davis, J.J. (1991). A blueprint for green marketing. Journal of Business Strategy, 12(4), 14-17. Department of Environment Protection of Florida. (2009). Become a designated property.
Retrieved May 20, 2009 from http://www.dep.state.fl.us/greenlodging/designation.htm
Department of Environmental Protection of Florida. (2009). Florida green lodging program reaches 400 milestone. Retrieved October 13, 2009 from http:// www.dep.state.fl.us/secretary/news/2009/01/files/0126_03.pdf
Department of Environmental Protection of Pennsylvania. (2008). Greener accommodations. Retrieved November 3, 2008 from http://www.dep.state.pa.us/dep/deputate/pollprev/industry/hotels/Green Accom.pdf
Diamantopoulos, A., Schlegelmilch, B.B., Sinkovics, R.R., & Bohlen, G.M. (2003). Can socio- demographics still play a role in profiling green consumers? a review of the evidence and an empirical investigation. Journal of Business Research, 56(6), 465-480.
Eby, L.T., Adams, D.M., Russell, J.E., & Gaby, S.H. (2000). Perceptions of organizational readiness for change: factors related to employees’ reactions to the implementation of team-based selling, 53(3), 419-442.
Eisenberger,R., Fasolo,P., & Davis-LaMastro V. (1990). Perveived organizational support and
employee diligence, commitment and innovation. Journal of Applied Psychology, 75(1), 51-99.
Enz, C.A., & Siquaw,J.A. (1999). Best hotel environmental practices. Cornell Hotel and
Restaurant Administration Quarterly, 40(5), 72-77. Fineman,S. (1996). Emotional subtexts in corporate greening. Organization Studies, 17(3), 479-
500. Fisher, K. (2003). Green hotels. Leisure Management, 23(3), 34-35. Florida Green Lodging Conference (2008, November). Being green, saving green and
making green. Retrieved November 8,2008 from University of Florida, Division of Continuing of Education TREEO center Web site: http://www.treeo.ufl.edu/conferences/GreenLodging/default.aspx?page=486

120
Foster, S.T., Sampson, S.E., & Dunn. S.C. (2000). The impact of customer contact on
environmental initiatives for service firms. International Journal of Operations and Production Management, 20(2), 187-203.
Fransson. N., & Gärling, T. (1999). Environmental concern: conceptual definitions,
measurement methods, and research findings. Journal of Environmental psychology, 19(4), 369-382.
Gago, R.F., & Antolín, M.N. (2004). Environmental management and strategic positioning of
Spanish manufacturing industries. Business Strategy and the Environment, 13(1), 33-42. Garrison, K. (2009). Green and clean. Fitness Business Pro, January 51-55. Glanzrock, P. (1995). Green hotels cut waste and woo guests. Facilities Design & Management,
14(1), 33. Goldstein, N.J.,Cialdini, R.B., & Griskevicius, V. (2008). A room with a viewpoint: Using social
norms to motivate environmental conservation in hotels. Journal of Consumer Research, 35(3), 472-482.
Gonzaléz, M., & León, C.J. (2001). The adoption of environmental innovations in the hotel
industry of Gran Canaria. Tourism Management, 7(2), 199-190. Govindarajula, N., & Daily, B.F. (2004). Motivating employees for environmental improvement.
Industrial Management & Data Systems, 104(4), 364-372. Graham, A. (2009, January). Florida green lodging program reaches 400 milestones. Retrieved
October 15, 2009 from http:// www.dep.state.fl.us/secretary/news/2009/01/files/0126_ 03.pdf
Greenberg, M. R. (2005). Concern about environmental pollution: how much difference do race
and ethnicity make? A new Jersey case study. Environmental Health Perspectives, 113(4), 369-374.
Green Hotel Association. (2009). What are green hotels. Retrieved February 3, 2009 from
http://www.greenhtotels.com/ Greening, D.W., & Turban, D.B. (2000). Corporate social performance as a competitive
advantage in attracting as quality workforce. Business and Society, 39(3), 254-280.
121
Grove, S.J., Fisk, R.P., Pickett, G.M., & Kangun, N. (1996). Going green in the service sector
Social responsibility issues, implications and implementation. European Journal of Marketing, 30 (5), 56-66.
Gradagnolo, F. (1985). The importance – performance analysis: an evaluation and marketing
tool. Journal of Park and Recreation Administration, 3(2), 13-22. Gupta, M. (1995). Environmental management and its impact on the operations function.
Internal Journal of Operation & Production Management. 15(8), 34-52. Gupta, M., & Sharma, K. (1996). Environmental operations management: an opportunity for
improvement. Production and Inventory Management Journal, 37(3), 40-47. Gustin, M.E., & Weaver, P.A. (1996). Are hotels prepared for the environmental consumer?.
Hospitality Research Journal, 20(2), 1-13.
Hair, J.F., Black, W.C., Babin, B.J., Anderson, R.E., & Tatham, R.L. (2005). Multivariate date analysis (6th ed.). New Jersey: Prentice Hall.
Hankinson, M.G. (1992). The greening of food and beverage operations: management practice
and the law. Hospitality and Tourism Educator, 4(4), 9-14. Harris, L.C., & Crane, A. (2002). The greening of organizational culture: Management views on
the depth, degree and diffusion of change. Journal of Organizational Change Management, 15(3), 214-232.
Hass, J. (1996). Environmental (‘green’) management typologies: an evaluation,
operationalization and empirical development. Business Strategy and the Environment, 5 (2), 59-68.
Hayward, P. (2008). Bright ideas, special edition of Lodging, July, 18-20. Henriques, I., & Sadorsky, P. (1999). The relationship between environmental commitment and
managerial perceptions of stakeholders importance. Academy of Management Journal, 42(1), 87-99.
Heung, V., Fei, C., & Hu, C.(2006). Customer and employee perception of green hotel-The case
of five-star hotels in China. China Tourism Research, 2(3), 270-297. Houdré, H. (2008). Sustainable hospitality: Sustainable development in the hotel industry. Cornell Industry Perspectives, 2 (August),4-20.

122
Howenstine, E. (1993). Market segmentation for recycling. Environment and Behavior, 25(1),86-
102. Hunt, C.B., & Auster, E.R. (1990). Proactive environmental management: Avoiding the toxic
trap. Sloan Management Review, 21(2), 7-18. Hussain, S.S. (1999). The Ethics of ‘going green’: the corporate social responsibility debate.
Business Strategy and the Environment, 8(4), 203-210. Iles, P., Mabey, C., & Robertson, I. (1990). HRM practices and employee commitment:
possibilities, pitfalls and paradoxes. British Journal of Management, 1(3),147-157. Insync (2008). How green are we anyway?. Insync survey, Retrieved March 11,2009 from
http://www.insycnsurvey.com.au/content/articles/how-green-are-we-anyway.pdf Iwanowski, K., & Rushmore, C. (1994). Introducing the eco-friendly hotel. Cornell Hotel and
Restaurant Administrant Quarterly, 35(1), 34-38.
J.D.Power & Associates. (2007). J.D. Power and Associates Press Release for 200 North America Hotel Guests Satisfaction Study. Retrieved May 17,2008 from http://www.jdpower.com/corporate/news/releases/pressrelease.aspx?id=2007116 Jesitus, J. (1992). Green business in now everybody’s business. Hotel & Motel Management,
19(2), 133. Retrieved March 18.2008, http://find.galegroup.com/itx/retrieve.do?contentS et=IAC-Documents
Kahn, M.E. (2002). Demographic change and the demand for environmental regulation. Journal
of Policy Analysis and Management, 21(1), 45-62. Kalafatis, S.P., Pollard, M., East, R., & Tsogas, M.H. (1999). Green marketing and Ajen’s theory
of planned behavior: a cross-market examination. Journal of consumer Marketing, 16(5), 441-460.
Kirk, D. (1998). Attitudes to environmental management held by a group of hotel managers in
Edinburgh. Hospitality Management, 17(1), 33-47. Kirk, D. (1995). Environmental management in hotels. International Journal of Contemporary
Hospitality Management, 7(6), 3-8.

123
Klineberg, S.L., McKeever, M., & Rothenbach, B. (1998). Demographic predictors of environmental concern: it does make a difference how it’s measured. Social Science Quarterly, 79(4), 734-753.
Kollmuss, A., & Agyeman, J. (2002). Mind the gap: why do people act environmentally and what are the barriers to pro-environmental behavior. Environmental Education Research, 8(3), 239-260.
Laroche, M., Bergeron,J., & Barbaro-Forleo. (2001). Targeting consumers who are willing to
pay more for environmentally friendly products. Journal of Consumer Marketing, 18(6), 503-520.
Leong, C.C.(2008). An importance-performance analysis to evaluate airline service quality: the
case study of a budget airline in Asia. Journal of Quality Assurance in Hospitality & Tourism, 8(3), 39-59.
Lynn, C. (2008). Review of hospitality ethics research in 2007. Retrieved March 10,2009 from
Northern Arizona University website: http://www2nau.edu/~cl5/ethics/2007%20paper. pdf
Macey, S.M., & Brown, G.M. (1983). Residential energy conservation: the role of past experience in repetitive household behavior. Environment and Behaviors, 15(2), 123-141
Madsen, H., & Ulhoi, J.P. (2001). Integrating environmental and stockholder management.
Business Strategy and Environment, 10(2), 77-88. Maignan, I., Ferrell. O.C., & Hult, G.T.M. (1999). Corporate citizenship: cultural antecedents
and business benefits. Journal of the Academy of Marketing Science, 27(4), 455-469. Mainieri, T., Barnett, E.G., Valdero, T.R., Unipan,J.B., & Oskamp,S. (1997). Green buying: The
influence of environmental concern on consumer behavior. The Journal of Social Psychology, 137(2), 189-204.
Manaktola, K., & Jauhari,V.(2007). Exploring consumer attitude and behavior towards green
practices in the lodging industry in India. International Journal of Contemporary Hospitality, 19(5), 364-377.
Martilla, J.A., & James, J.C.(1977). Importance-performance analysis. The Journal of Marketing,
41(1), 77-79.

124
Maxwell, J., Rothenberg, S., Briscoe, F., & Marcus, A. (1997). Green schemes: corporate environmental strategies and their implementation. California Management Review, 39(3), 118-134.
Mckenzie-Mohr, D. (2000). Fostering sustainable behavior through community-based social
marketing. American Psychologist, 55(5), 531-537.
Meade, B., & Pringle, J. (2001). Environmental management systems for Caribbean Hotels and Resorts: a case study of five properties in Jamaica. Journal of Quality Assurance in Hospitality & Tourism, 2(3), 149-159.
Meyer, J. P., & Herscovitch, L. (2001). Commitment in the workplace toward a general model.
Human Resource Management Review. 11(3), 299-326. Menon, A., & Menon, A. (1997). Enviropreneurial marketing strategy: The emergence of
corporate environmentalism as market strategy. Journal of Marketing, 61(1), 51-67. Mensah, I. (2004). Environmental management practices in US hotels special report (White
paper, electronic version). Retrieved March 12,2008, from hotel oneline website:// http.hotelonline.com /news/PR2004_2nd/May04_environmentalpractice.html
Mohai, P. (1990). Black environmentalism. Social Science Quarterly, 71(4), 744-765. Mohai, P., & Bryant, B. (1998). Is there a “race” effect on concern for environmental quality.
The Public Opinion Quarterly, 62(4), 475-505. Mottaz, C.J. (1989). An analysis of the relationship between attitudinal commitment and
behavioral commitment. The Sociological Quarterly, 30(1), 143-158. Mowday., R.T., Steers, R.M., & Porter, L.W. (1979). The measurement of organizational
commitment. Journal of Vocational Behavior, 14(2), 224-247. Murillo-Luna, J.L., Garcés-Ayerbe, C., & Rivers-Torres, P. (2007). What prevents firms from
advancing in their environmental strategy?. International Advances in Economic Research, 13(1), 35-46.
Newell, S. J., & Green, C.L. (1997). Racial differences in consumer environmental concern. The
Journal of Consumer Affairs, 31(1), 53-69. Newton, T., & Harte, G. (1997). Green business: technicist Kitsch. Journal of Management
Studies, 34(1), 75-98.

125
No-smoking zones expand in U.S. hotels. (2006, July 21). USA Today. Retrieved March 21, 2009, from http:// www.usatodya.com/travel/hotels/2006-07-21-nonsmoking- hotles_x.htm
Oh, H. (2001). Revisiting importance-performance analysis. Tourism Management, 22 (6),617- 627. Okazaki,W.K.,Turn, S.Q.,& Flachsbart, P.G.(2008). Characterization of food waste generators:
A Hawaii case study. Waste Management, 28(12), 2483-2494. Olli, E., Grendstad, G., & Wollebaek, D. (2001). Correlates of environmental behaviors brings
back social context. Environment and Behavior, 33(3), 181 -208. Osland, G.E., & Mackoy, R. (2004). Ecolodge performance goals and evaluations. Journal of
Ecotourism, 3(2), 109-128. Pallant, J. (2007). SPSS survival manual (3rd ed.). New York: McGraw-Hill. Peattie, K. (2001). Golden goose or wild goose? The hunt for the green consumer. Business
Strategy and the Environment. 10(4), 187-199. Perron, G., Côte. R.P., & Duffy, J.F (2006). Improving environmental awareness training in
business. Journal of Cleaner Production. 14 (6-7), 551-562. Peterson, D.K. (2004). The relationship between perceptions of corporate citizenship and
organizational commitment. Business Society, 43(3), 296-319. Phillips, L.E. (1999). Green attitude. American Demographics, 24(4), 46-47. Post, J.E., & Altmanm, B.W. (1994). Managing the environmental change process: Barriers and
opportunities. Journal of Organizational Change Management, 7(4), 64-81.
Ramus, C.A., & Steger, U. (2000). The roles of supervisory support behaviors and environmental policy in employee “ecoinitiatives” at leading-edge European companies. Academy of Management Journal, 43(4), 605-626.
Repace, J. (2004). Respirable particles and carcinogens in the air of Delaware hospitality venues
before and after smoking ban. Journal of Occupational and Environmental Medicine, 46(9), 887-905.

126
Riordan, C.M., Gatewood, R.D., & Bill, J,B. (1997). Corporate image: employee reactions and implications for managing corporate social performance. Journal of Business Ethics, 16(4), 401-412.
Roberts, J.A. (1996). Green consumers in the 1990s: Profile and implications for advertising.
Journal of Business Research, 36(3), 217-231. Roome, N. (1992). Developing environmental management strategies. Business Strategy and the
Environment, 1(1),11-24.
Russell, D., Bottrill, C., & Meredith, G. (1995) Introduction: International ecolodge survey. In D.E. Hawkins, M.E. Wood & S. Bittman (Eds), The Ecolodge Sourcebook for Planners and Developers (pp. ix–xvii). North Bennington, VT: The Ecotourism Society.
Samdahl, D.M., & Robertson, R. (1989). Social determinants of environmental concern:
specification and test of the model. Environment and Behavior, 21(1), 57-81. Scanlon, N.L. (2007). An analysis and assessment of environmental operating practices in hotel
and resort properties. International Journal of Hospitality Management, 26(3),711-723. Scollo,M., Lai A., Hyland, A., & Glantz, S. (2003). Review of the quality of studies on the
economic effects of smoke-free policies on the hospitality industry. Tobacco Control, 12(1), 13-20.
Shanklin, C. W. (1993). Ecology age: implications for the hospitality and tourism industry.
Hospitality Research Journal, 17(1), 221-229. Shanklin, C.W., Petrillose, M.J., & Pettay, A. (1991). Solid waste management practices in
selected hotel chains and individual properties. Hospitality Research Journal, 15(1),59-74.
Shopland, D.R., Anderson, C. M., Burns, D. M., & Gerlach, K.K. (2004). Disparities in smoke-
free workplace policies among food service workers. Journal of Occupational and Environmental Medicine, 46(4), 347-346.
Shrivastava,P. (1995). The role of corporation in achieving ecological sustainability. Academy of
Management Review, 20(4), 936-960. Shrum, L.J., McCarty, J.A., & Lowrey, T.M. (1995). Buyer characteristics of the green consumer
and their implications for advertising strategy. Journal of Advertising, 24(2), 72-82.

127
Society for Human Resource Management (2007). Green workplace. Retrieved March 9,2009 fromhttp://www.shrm.org/reserach/surveyfindings/articles/documents/shrm%20green%workplace%20survey%20brief.pdf.
Stabler, M.J., & Goodall, B. (1997). Environmental awareness, action and performance in the
Guernsey hospitality sector. Tourism Management, 18(1), 19-33. Stipanuk,D.M. (1996). The U.S. lodging industry and the environment. Cornell Hotel and
Restaurant Administration Quarterly, 37(5), 39-45. Straughan, R.D., & Roberts, J.A. (1999). Environmental segmentation alternatives: a look at
green consumer behavior in the new millennium. Journal of Consumer Marketing, 16(6), 558-575.
Sustainable Travel International. (2009). Travelgreen-Carbon Neutral Accommodations.
Retrieved January 29, 2009 from http: travel-green.org/carbonneutralhotel.html Suttell,R. (2005). Hospitality and IAQ. Buildings, November, 62-74. Trung, D.N., & Kumar, S. (2005). Resource use and waste management in Vietnam hotel
industry. Journal of Cleaner Production, 13(2),109-116. Turban, D.B.,& Greening, D.W. (1997). Corporate social performance and organizational
attractiveness to prospective employees. The Academy of Management Journal, 40(3), 658-672.
Tzschentke, N., Kirk, D., & Lynch, P.A. (2004). Reasons for going green in serviced
accommodation establishments. International Journal of Contemporary Hospitality Management, 16(2), 116-124.
U.S. Department of Labor. (2009, March). Foreign-born workers: Labor force characteristics in
2008. Retrieved October 14, 2009, from Bureau of Labor Statistics Online: http:// www.bls.gov/news.release/pdf/forbrn.pdf
U.S. Department of Labor. (2009). Household Data Annual Average. Retrieved October
14,2009, from http: www.bls.gov/cps/cpsaat18.pdf U.S Environmental Protection Agency. (2007). Energy Star Building manual, facility type:
hotels and motels. Retrieved December 30,2008 from http://www.energystar.gov/ia/business/EPA_BUM_CH12_HotelsMotels.pdf

128
U.S Environmental Protection Agency (2009). Green indoor environments. Retrieved January 15, 2009 from http://www.epa.gov/iaq/greenbuilding/index.html
U.S Environmental Protection Agency (2009). Reducing air pollution from: The hospitality
industry(lodging sector). Retrieved February 9,2009 from http://www.epa.gov/air/toxicair/commnity/guide/hospitality_00_sheet.pdf
U.S. Geological Survey.(2008). Water availability-the connection between water use and quality.
Retrieved January 3,2009 from: http:// pubs.usgs.gov/fs/2008/3015/fs2008_3015_water_availabiliyt_v3.pdf
Zilahy,G. (2004). Organizational factors determining the implementation of cleaner production
in the corporate sector. Journal of Cleaner Production, 12(4), 311-319. Van Liere, K.D., & Dunlap, R.E. (1980). The social bases of environmental concern: a review of
hypotheses, explanations and empirical evidence. The Public Opinion Quarterly, 44(2), 181-197.
Van Liere, K.D., & Dunlap, R.E. (1981). Environmental concern: does it make a difference how
it’s measured. Environment and Behavior, 31(6), 651-676/ Vaske, J.J., Donnelly, M.P., Williams, D.R., & Jonker, S.A. (2001). Demographic influences on
environmental value orientations and normative beliefs about national forest management. Society and Natural Resources, 14(9), 761-776.
Vaske, J,J., Kiriakos, R., Cottrell, S.P., & Khuong, M.N.(2009). Importance-performance and
segmentation: an application at a biosphere reserve in Vietnam, Journal of Travel & Tourism Marketing, 26(1), 30-41.
Vastag, G., Kerekes,S., & Rondinelli, D.A. (1996). Evaluation of corporate environmental
management approaches: A framework and application. International Journal of Production Economics. 43(2/3), 193-211.
Vaughan, E., & Nordenstam. (1991). The perception of environmental risks among ethnically
diverse groups. Journal of Cross-Cultural Psychology, 22(1), 29-60. Vermillion, L. (2008). The meaning of green. Lodging, 33(6),26-30. Vermillion, L. (2008). Freshening up. Lodging, 33(6),56-57.
129
Waggett, R., & Arotsky,C. (2006). Water key performance indicator and benchmarks for offices and hotels. CIRIA report. Retrieved Jan 27,2009 from http://ciria.org.uk/acatalog/c657.pdf
Weaver, D. B., & Lawton, L.J. (2002). Overnight ecotourist market segmentation in the Gold
Coast Hinterland of Australia. Journal of Travel Research, 40(3), 270-280. Welford, R., Ytterhus, B., & Eligh, J. (1999). Tourism and sustainable development: an analysis
of policy and guidelines for managing provision and consumption. Sustainable Development, 7(4), 167-177.
Wight, P.A. (1997). Ecotourism accommodation spectrum: does supply match the demand.
Tourism Management, 18(4), 209-220. Withiam, G. (1993). “Green” hotels. The Cornell Hotel and Restaurant Administration Quarterly, 34, 21.


![EMPLOYEES’ PERCEPTION ON THE POSSIBILITY OF …eprints.covenantuniversity.edu.ng/1317/1/corruption era 1[1] new.pdf · EMPLOYEES’ PERCEPTION ON THE POSSIBILITY OF ... as the best](https://img.pdfslide.net/doc/110x75/5b2414427f8b9a5f458b6637/employees-perception-on-the-possibility-of-era-11-newpdf-employees.jpg)