Embed Size (px)
Citation preview
Division of IT, Engineering and the Environment
An Investigation into the Tolerance and Sensitivity of the Adelaide Parklands’ Landscape Plants to the Glenelg Recycled Wastewater
ISBN: 978-1922046-00-0
Associate Professor Ali Morad Hassanli (Chief investigator)
Doctor Fatemeh Kazemi

Disclaimer
The Participants advise that the information contained in this
publication comprises general statements based on scientific
research and does not warrant or represent the completeness
of any information or material in this publication.
© University of South Australia 2012
This work is copyright. You may download, display, print and
reproduce this material in unaltered form only (retaining this
notice) for your personal, non-commercial use or use within
your organisation. Apart from any use as permitted under the
Copyright Act 1968, all other rights are reserved. Requests and
inquiries concerning reproduction and rights should be addressed
to SA Water Centre for Water Management and Reuse.
Published by University of South Australia
Title An Investigation into the Tolerance and Sensitivity
of the Adelaide Parklands’ Landscape Plants to the
Glenelg Recycled Wastewater
Authors Ali Morad Hassanli1 (Chief investigator)
Fatemeh Kazemi2
1 Adjunct Associate Professor of University of South Australia (CWMR)
and Associate Professor of University of Shiraz, Iran
2 Research Fellow of University of South Australia (CWMR) and
Associate Member of Ferdowsi University of Mashhad, Iran
CRICOS Provider Number 00121B
An Investigation into the Tolerance and Sensitivity of Adelaide Parklands’ Landscape Plants to Glenelg Recycled Wastewater
An Investigation into the Tolerance and Sensitivity of Adelaide Parklands’ Landscape Plants to Glenelg Recycled Wastewater
University of South Australia Division of IT, Engineering and the Environment, (ITEE) School of Natural and Built Environments (NBE) Centre for Water Management and Reuse (CWMR)
SA Water Adelaide, Australia

4
Associate Professor Ali Morad Hassanli (Chief investigator)
Doctor Fatemeh Kazemi
Acknowledgment
We wish kindly to acknowledge David Pezzaniti and
Professor Simon Beecham as collaborators in the initial
stages and planning of this project. We wish also to
acknowledge those who have provided inputs to this
document.
In particular we acknowledge Alison Fairlamb for her
great contribution to the literature review. Thanks also go
to Hamideh Nouri for her assistance in investigation for
the Park Land plants’ tolerance to salinity and toxicity. We
appreciate Greg Ingleton, Senior EIA Advisor -Recycled
Water in SA Water Corporation and Kent Williams, Senior
Consultant, Parks, Water and Environment in Adelaide City
Council for providing discussions.
We would also like to thank Professor Dennis Mulcahy for
his editorial comments and Professor Christopher Saint,
Director of the Centre for Water Management and reuse
(CWMR) for his collaboration to publish this book.
This research was funded by SA Water Corporation for
which we are indeed grateful.
Authors, 2012
5
Executive Summary
Urban green spaces impact on the microclimate (moderate temperature), hydrological cycle (increased water infiltration rate
and evapotranspiration, slow down runoff), biodiversity (source of habitat for many fauna species), improve water quality and
reduce air pollution, remove significant amounts of pollutants such as nitrogen, phosphorus and fine sediments and in general
have environmental, social and economic benefits. Adelaide Park Lands, with an area of 720 ha around the City of Adelaide
bring environmental, social, cultural and financial benefits for the people of Adelaide. The Adelaide Park Lands provide habitat
and green space connectivity for a diverse range of flora and fauna species. Although these green spaces are of great benefit
to the community and environment, they require substantial amounts of water to maintain their health and beauty. The use of
water for irrigation is often problematic in Australia, particularly in South Australia which is the driest state in Australia. Securing
Australia’s water requires a diversity of water sources to ensure the country will be prepared for future water scarcity (droughts)
as the population grows. Recycled water is one of the main water resources which can make a substantial contribution to
increasing the security of future water supplies. Scientific and technical studies are required to maximize this contribution through
developing water recycling opportunities and reuses, particularly for green space irrigation, to provide environmentally, socially
and economically sustainable environments.
The use of municipal recycled water for green space plants is a valuable attempt to use the easily available water resources but
it requires a monitoring system to mitigate the possible adverse impacts on the soil, plants and groundwater. Variables such
as climate, weather, irrigation methods and frequency, plant genetic variations and plant species, soil health and soil physical
and chemical characteristics can have a profound effect on the sensitivities of plants to salts and various toxic elements. Soil
drainage, irrigation application rate, irrigation water quality, rainfall characteristics (volume, intensity and frequency), and
plant canopy shade can influence the long-term effects of salinity, and toxic effects of chemical compounds on the vegetation
health. It is, therefore, important to have information specific to each individual plant species, as well as information on all
the above-variables, specific to each locality, in order to properly plan and manage water requirements of specific landscapes.
There is currently a lack of adequate information specific to the Adelaide Park Lands vegetation, their tolerance to salinity and
toxicity and their threshold levels. There has been little research to investigate water requirements of mixed vegetation in urban
landscapes such as plantings in the parkland systems. In addition, research is required to examine the methods to remove
pollutants from the recycled water.
This report is part of a larger investigation of the response and sensitivity of landscape plants within the Adelaide Park Lands to
the use of Glenelg recycled water for irrigation. The scope of this report includes: a review of the current literature on possible
impacts of the use of treated wastewater on native plants in the Adelaide Park Lands, detailing potential toxic effects of salinity,
sodium, chloride and boron; an introduction to the major plant species reported in the Adelaide Park Lands as well as their
characteristics and functions within the Australian landscape; a summary of water logging, salinity, sodium, chloride and boron
tolerance of the selected species (provided in Appendix 2); recommendations for the planting design within the parklands and
watering methods and regimes for the same area and also the research gaps that are required to be investigated for a more
sustainable use of Glenelg recycled water for Adelaide Park Land irrigation.
This study uses plant species found on the lists reported (Long, 2003), with the main focus on plants available in the largest
number of parks within the parklands. The major aim was to provide specific information on their botanical characteristics and
tolerance to salinity and to certain toxic elements, focussing on sodium, chloride and boron.

6
The annual average salt concentration in the Glenelg recycled wastewater is 1190-1200 mg/l or 1.8dS/m. Although the
salinity variation in usual irrigation water is expected to vary up to 3 dS/m, irrigation with Glenelg recycled wastewater with
an irrigation application rate of 4.5ML/year-ha would cause annual accumulation of nearly 9 tonne/ha salts to the soil. In the
absence of an efficient irrigation management strategy, salinity build up hazard would be problematic in the long term.
The average sodium and chloride level in the Glenelg recycled wastewater is 231 and 389 mg/l, respectively. However the
sodium and chloride concentration levels in usual irrigation water are expected to be 0-920 and 0-1065 mg/l , respectively.
This shows that the sodium and chloride concentration in the Glenelg recycled wastewater is below the maximum allowable
level. However, it does not mean that accumulation of these two toxic ions in the long term, without considerable attention
to sustainable irrigation management, would not be a hazard for the Adelaide Park Land plants particularly those that are
sensitive to toxicity of these elements.
The findings suggest that further research would be needed to clarify the benefits of the irrigation of urban green spaces by
recycled water and improve irrigation management to mitigate the possible inverse impacts of recycled water for a sustainable
environment to ensure having a healthy plant, soil and water system across the Adelaide Park Lands.
7
Contents
1. Introduction ..............................................................................................................................................12
1.1 Possible environmental impacts of recycled wastewater on native vegetation in the Adelaide Park Lands ..................13
2. Problem statement ...................................................................................................................................15
3. Scope of this work ....................................................................................................................................15
4. The study area ...........................................................................................................................................15
5. Vegetation in the Adelaide Parklands .....................................................................................................16
5.1 Botanical characteristics of the dominant, locally endemic species in the Adelaide Park Lands ...................................17
5.1.1 Eucalyptus camaldulensis (river red gum) ........................................................................................................17
5.1.2 Callitris gracilis (slender cypress-pine) (Dept. of primary industries Victoria, 2009) .............................................17
5.1.3 Acacia pycnantha (golden wattle) (Australian Native Plant Society (Australia), Florabank) .................................18
5.1.4 Eucalyptus leucoxylon ssp.leucoxylon (South Australian blue gum) (Holiday, 2005) ...........................................18
5.1.5 Allocasuarina verticillata (drooping she-oak) (Holiday 2005; Florabank) ............................................................19
5.1.6 Chloris truncata (windmill grass) (Bennett & Mitchell 2006; Dept of Primary industries) ....................................19
5.1.7 Acacia ligulata (sandhill wattle/”umbrella bush”) (Holiday 2005; Florabank) .....................................................20
5.1.8 Atriplex semibaccata (berry saltbush) (AWI & CRC Salinity 2006; Botanic Gardens Trust) ..................................20
5.1.9 Austrodanthonia sp. (wallaby grass) (Native Seeds Pty. Ltd.; Dept. of Primary Industries Victoria) ......................21
5.1.10 Callistemon sp. (bottlebrush) (Australian Native Plants Society (Australia); Australian National Botanic Gardens
Herbarium; FloraOnline; Holiday, I 2005) .............................................................................................................21
5.1.11 Maireana enchylaenoides (wingless bluebush) (Victorian Flora; PlantNET, FloraOnline) ....................................22
5.1.12 Oxalis perennans (native sorrel) (Hardin 1991; vonRichter; Botanic Gardens Trust; PlantNET) ..........................22
5.1.13 Typha domingensis (narrow-leaf Cumbungi)(Botanic Gardens Trust) ...............................................................23
5.2 Characteristics of turf grasses ...................................................................................................................................24
5.2.1 Characteristics of Pennisetum clandestinum (Kikuyu grass) ..............................................................................24
5.2.2 Characteristics of Cynodon spp. (Couch grass) .................................................................................................25
5.2.3 Characteristics of Agrostis palustris syn. A. stolonifera (Creeping bentgrass) .....................................................25
8
6. Key potential environmental effects of using glenelg recycled water in the Adelaide park lands ....26
6.1. Recycled wastewater ...............................................................................................................................................27
6.2 General toxic effects of salinity on plants ..................................................................................................................29
6.3 Toxic effects of sodium on plants ..............................................................................................................................30
6.4 Toxic effects of chloride on plants .............................................................................................................................30
6.5 Toxic effects of boron on plants ................................................................................................................................31
6.6 Effects of water logging on plants ............................................................................................................................32
7. Management measures of salinity ...........................................................................................................32
7.1 Characteristics and physiology of salt-tolerant plants ................................................................................................32
7.2 Salinity control and management measures ..............................................................................................................34
7.3 Salinity control by leaching .......................................................................................................................................34
8. Toxicity problems and management measures .......................................................................................35
8.1 Sodium toxicity ........................................................................................................................................................35
8.1.1 Characteristics and physiology of sodium-tolerant plants .................................................................................35
8.1.2 Sodium toxicity management ..........................................................................................................................36
8.2 Chloride toxicity .......................................................................................................................................................36
8.2.1 Characteristics and physiology of chloride-tolerant plants ................................................................................36
8.2.2 Chloride toxicity management .........................................................................................................................37
8.3 Boron toxicity ...........................................................................................................................................................37
8.3.1 Characteristics and physiology of boron-tolerant plants ...................................................................................37
8.3.2 Boron toxicity management .............................................................................................................................37
8.4 Leaching as a practical way to reduce toxic ions .......................................................................................................38
9. Conclusions and recommendations .........................................................................................................39
9.1 Conclusions .............................................................................................................................................................39
9.2 Recommendations and research gaps .......................................................................................................................39
Bibliography ...................................................................................................................................................41
References ......................................................................................................................................................42
9
List of Figures
Figure 1: Aerial view of the Adelaide Park Lands (Google - Imagery, 2011) ...........................................................................14
Figure 2: Eucalyptus camaldulensis A, B, C: Australian National Botanic Gardens. Photographer: Murray Fagg......................17
Figure 3: Callitris gracilis (State Flora; Australian National Botanical Gardens) ........................................................................17
Figure 4: Acacia pycnantha (PlantNET and the Royal Botanic Gardens and Domain Trust, photographer: M. Fagg) ................18
Figure 5: Eucalyptus leucoxylon (Australian Native Plant Society; Photo: Brian Walters) ..........................................................18
Figure 6: Allocasuarina verticillata (Photos: Kazemi, F., 2012) ................................................................................................19
Figure 7: Windmill Grass - Chloris truncata (© Geoff Sanity) ..................................................................................................19
Figure 8: Acacia ligulata (PlantNET and the Royal Botanic Gardens and Domain Trust, photographer: T. M. Tame) ................20
Figure 9: Atriplex semibaccata (A & B: Lotte Von Richter, The Australian Botanic Garden, Mount Annan) .............................20
Figure 10: Austrodanthonia sp. (A & B: © State of Victoria, Dept. of Primary Industries, Victorian Resources online:
www.dpi.vic.gov.au/vro, photographer A.J. Brown. Reproduced with permission; C: © FloraPhoto) ...................21
Figure 11: Callistemon sp. (A & B: photographer: Fatemah Kazemi, 2012; C & D: Australian National Botanic Gardens,
photographer: Murray Fagg) ................................................................................................................................21
Figure 12: Maireana enchylaenoides (PlantNET and the Royal Botanic Gardens and Domain Trust) ........................................22
Figure 13: Oxalis perennans (Hardin 1991; L. vonRichter; PlantNET and Royal Botanic Gardens and Domain Trust) ...............22
Figure 14: Typha domingensis (L. von Richter, PlantNET and Royal Botanic Gardens and Domain Trust) .................................23
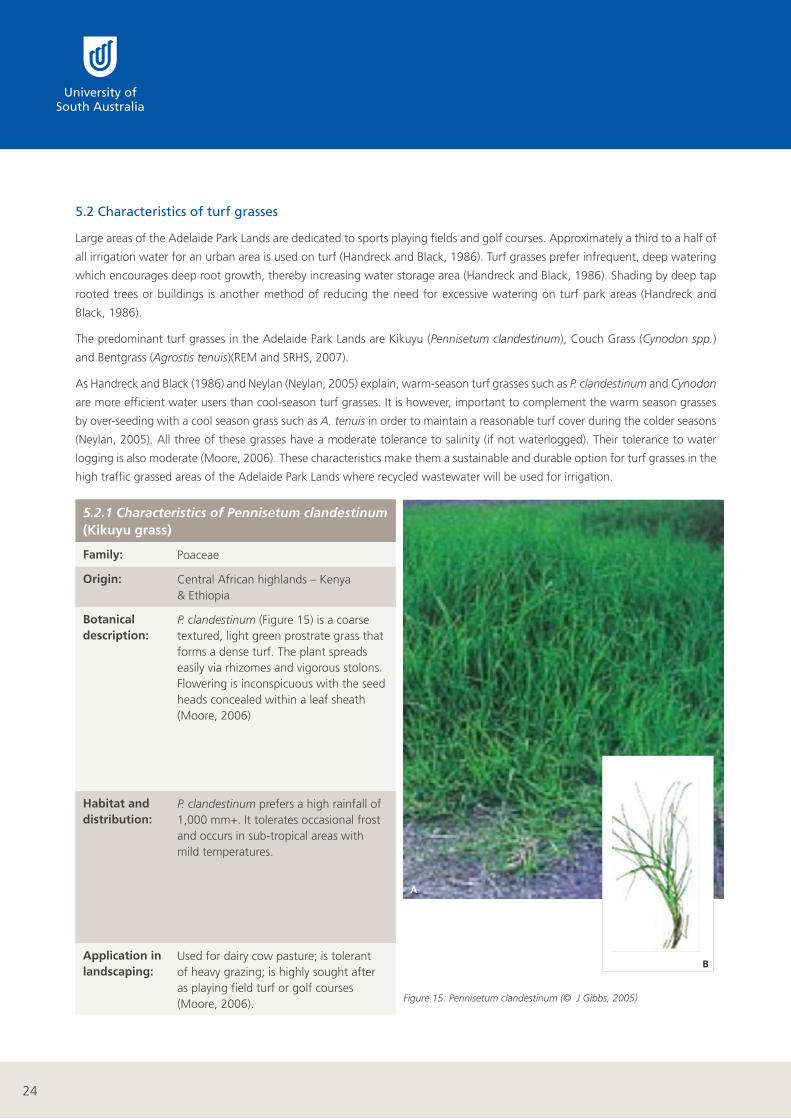
Figure 15: Pennisetum clandestinum (© J Gibbs, 2005) ........................................................................................................24
Figure 16: Cynodon dactylon (PlantNET, Royal Botanic Gardens and Domain Trust) ...............................................................25
Figure 17: Agrostis stolonifera (Farmer, 2002, Lamp, 1990) ..................................................................................................25
Figure 18: Adaptive management framework for Adelaide Park Lands (REM et al., 2008) .....................................................26
Figure 19: Salt toxicity symptoms include leaf chlorosis and necrosis of tips and margins in Celtis Australis
(Costello et al., 2003) ...........................................................................................................................................29
Figure 20: Toxic effects of salinity on leaves (Las Pilitas Nursery, n.d.) Used with permission of Laspilitas.com
http://www.laspilitas.com/advanced/advsoils.htm .................................................................................................30
Figure 21: Necrotic patches caused by sodium toxicity on a grape vine (PIRSA, n.d.) Photo supplied by Joanne Pech, South
Australian Research and Development Institute (SARDI) ........................................................................................30
Figure 22: Evidence of chloride toxicity in an aspen (Goodrich and Jacobi, 2007/2008) .........................................................31
Figure 23: Boron toxicity causes dark, necrotic areas along the leaf margins in white mulbury (morus alba)
(Costello et al., 2003) .........................................................................................................................................31
10
List of TablesTable 1: Summary of Glenelg water quality data 2005 (REM and SRHS, 2007) ......................................................................27
Table 2: Laboratory determinations used to evaluate common irrigation water quality problems (Pedrero et al., 2010) .........28
Table 3: Annual average concentration of some main elements in Glenelg recycled wastewater (REM et al., 2008)...............29
Table 4: Irrigation water quality guidelines (Ayers and Westcot, 1994) ..................................................................................33
List of AppendicesAppendix 1: Key potential negative environmental effects of wastewater use for irrigation (REM et al., 2008)
Appendix 2: Salinity and water logging tolerance of plant species within the Adelaide Park Lands and their tolerance to toxic
levels of Cloride, Born and Sodium elements (adapted from REM et al., 2008)

11
To authors
I have read the report and have sent it to our research, development and innovation manager (Mike Burch), and we have the
following comments:
• The report was excllent, well written, informative and sets the scene for the next steps
• We felt there was nothing in the report which could be viewed as being detrimental to SA Water, Adelaide City Council
and the operation of this irrigation scheme
• SA Water does have the copyright permission for the two REM reports that you mentioned below, and hereby give you
permission to reproduce these in your report
We look forward to continuing to work with you on these parkland related projects, and appreciate the quality of the work
produced by your team.
Thanks,
Greg Ingleton
Principal EIA Advisor - Recycled Water
SA Water Corporation
Friday March 02, 2012
12
1. Introduction
Adelaide is recorded as one of the best planned cities in the world. One of the reasons behind this statement is its distinctive
design of a central business and commerce core surrounded by parklands (Williams, 1966). The parklands were set aside for
public recreation and relaxation. Designed in 1837, Adelaide has a metropolitan open space system (MOSS) connecting the
city, suburbs, coast and hills of Adelaide and adding unique value in open space planning for the metropolitan area (Williams,
1966). The Adelaide Park Lands, with an area of 720 ha around the Adelaide CBD, are a core component of MOSS. MOSS
brings environmental, social, cultural and financial benefits for the people of Adelaide.
Although the Adelaide Park Lands have been altered considerably since settlement, they are still considered a valuable natural
asset for Adelaide (Long, 2003). Despite little of the original pre-settlement biodiversity remaining, the Park Lands continue to
provide habitat and connectivity of green space for a diverse range of flora and fauna species. Some of these species are rare
or endangered (species of conservation significance) and rely on the uninterrupted nature of the Park Lands to provide for their
habitat requirements. The Park Lands are also used frequently throughout the year by the community to host cultural events
and on a daily basis for relaxation and recreation. These aspects are some of the unique characteristics of this network of green
spaces that add more value to this environment.
Although these green spaces are of great benefit to the community and environment, they also require substantial amounts
of water to maintain their health and beauty. The use of water for irrigation is often problematic in Australia which has the
distinction of being one of the driest countries on earth (Stevens, 2006). Australian soils are also very old and depleted, with
little organic matter to trap runoff and maintain soil moisture (Stevens, 2006). In South Australia, large-scale water abstraction
from the Murray has proven to be unsustainable and this potable water has been prioritised to fulfil domestic requirements and
maintain the health of the river system (Girardet, 2003).
With the increased focus on ‘waterproofing’ Adelaide and initiating sustainable practices, it has been suggested (Girardet,
2003) that the use of recycled wastewater and storm water become the centrepiece of a proposed water policy in Adelaide.
South Australia is seen as a national leader in recycled water use. This water is primarily used for the irrigation of crops and
town parklands (Allen and Cunliffe, 2007).
Commissioned in 1999, the Virginia Pipeline Scheme (VPS) began supplying Class A recycled water (the highest quality
recycled wastewater) to several commercial food growers on the Northern Adelaide Plains (Laurenson et al., 2010).
This successful example of the use of recycled wastewater prompted other recycled water schemes such as Mawson Lakes,
the Willunga Basin Pipeline and the Adelaide Airport pipeline (Allen and Cunliffe, 2007). In line with these successful
schemes, the Glenelg to Adelaide Parklands recycled water project, commissioned in 2008 and completed in 2010,
also became part of the Waterproofing Adelaide initiative (South Australian Water Corporation, 2009).
Monitoring and ensuring the safety of recycled water for the public and the environment falls to the water departments within
local government, which include SA Department of Health, the EPA and SA Water. In order to understand and monitor the
impacts of recycled wastewater on the public and the environment, several reports have been commissioned over the years.
These reports have investigated the possible environmental impacts of treated wastewater on the specific plants found in the
Adelaide Park Lands.
13
1.1 Possible environmental impacts of recycled wastewater on native vegetation in the Adelaide Park Lands
Literature on the effects of salinity on various crops and American landscape plants is extensive, as shown by the lengthy bibliography
in this report; it is not however helpful in determining possible impacts on specific native South Australian landscape plant species.
Alan Blaylock (1994), from the University of Wyoming’s College of Agriculture, investigated the effects of salt tolerance on a number
of Wyoming native landscape plants as well as various fruit trees and vegetables; Wu, et al. (1998) carried out experiments on
Californian landscape plants; and Kotuby-Amacher et al, (2000) explored the salinity tolerance of various crops such as barley, corn
and sunflowers. Some of the data currently available on the effects of specific salts, such as sodium, chloride and boron,
on various landscape plants has been obtained under controlled testing (van der Moezel et al., 1991) which does not present
the wide gambit of difficulties associated with field testing (Niknam and McComb, 2000). Variables such as climate (Niu
and Rodriguez, 2006), weather, genetic variation; soil health (Stevens et al., 2008), soil physical and chemical characteristics
(Hassanli et al., 2007), soil texture and soil structure; irrigation methods (Hassanli et al., 2009, Hassanli et al., 2010) and
frequency (Wu et al., 2001), can have a profound effect on the sensitivities of plants to various salts. It is therefore important to
have information specific to each individual plant species, as well as information on all the above-mentioned variables, specific
to each locality, in order to properly plan and manage specific landscapes (Pedrero et al., 2010). Hassanli and Javan (2005a)
evaluated the impacts of the quality of municipal secondary recycled water on the green space plants grown in the arid and
semi-arid regions. They believe the use of municipal recycled water for green space plants is a good attempt to use the easily
available waters within the park lands area but it requires a monitoring system to mitigate the possible inverse impacts on
the soil and groundwater. As Pedrero and Kalavrouziotis et al. (2010), Hassanli et al. (2008) and Hassanli, et al. (2007) further
explain, soils, drainage, irrigation methods and the amount of shade all influence the long-term effects of salinity and toxicity
of chemical compounds on vegetation. It is also important to note that the effects of excess salts continue long after the source
of that excess is removed (Handreck and Black, 2002).There is currently a paucity of information specific to the Adelaide Park
Lands vegetation, soil types and drainage characteristics.
A wide range of results were found in various studies (Wu et al., 2001, Sun and Dickinson, 1993, Dunn et al., 1994), highlighting
the importance of specific study for all plant species of concern as well as the influence of many other factors as mentioned
above. Field studies of the effects of treated wastewater on plant growth other than crops are rarely carried out (Pedrero et al.,
2010). The use of wastewater for irrigation requires good management and planning with the understanding that not all local
situations can be predicted when preparing guidelines (Pedrero et al., 2010). The use of a large variety of plant species is not
widely practiced (Niu and Rodriguez, 2006) and presents unique challenges when irrigating landscaped areas. There is currently
limited information on the salt tolerance of ornamental plants and the small number of studies that have been conducted show
substantial differences in tolerance to various salts between species. Different species also exhibit a variety of methods to counter
high salt concentrations, further complicating the management and planning of irrigation (Niu and Rodriguez, 2006). This lack of
information suggests extensive and specific further study is required on the tolerance of various native Australian landscape plants
to increased salt levels and toxicity levels in recycled waste water used for irrigation.
14
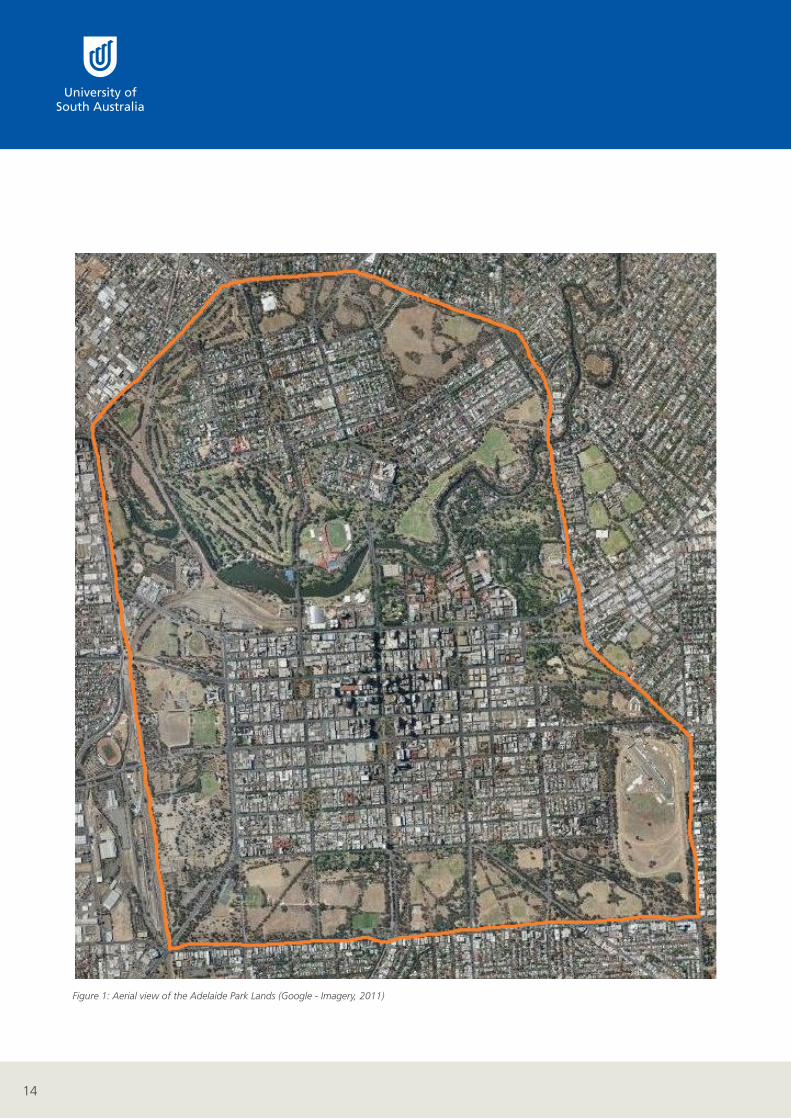
Figure 1: Aerial view of the Adelaide Park Lands (Google - Imagery, 2011)
15
C
2. Problem Statement
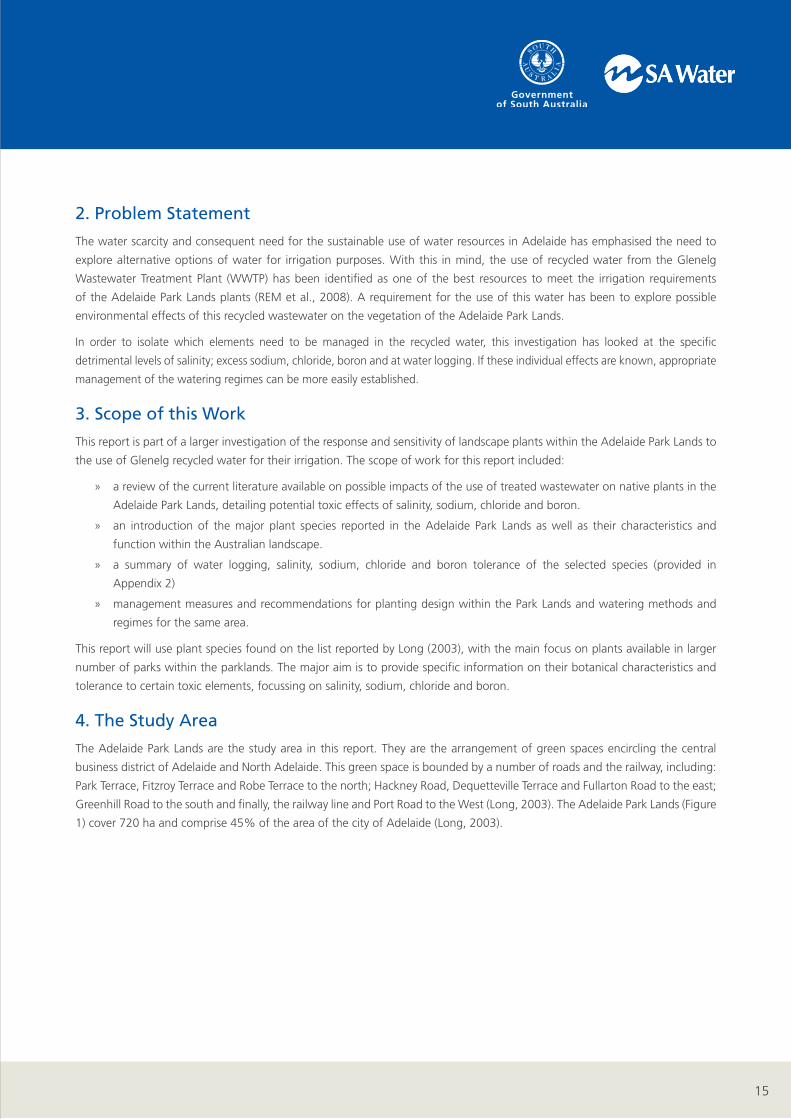
The water scarcity and consequent need for the sustainable use of water resources in Adelaide has emphasised the need to
explore alternative options of water for irrigation purposes. With this in mind, the use of recycled water from the Glenelg
Wastewater Treatment Plant (WWTP) has been identified as one of the best resources to meet the irrigation requirements
of the Adelaide Park Lands plants (REM et al., 2008). A requirement for the use of this water has been to explore possible
environmental effects of this recycled wastewater on the vegetation of the Adelaide Park Lands.
In order to isolate which elements need to be managed in the recycled water, this investigation has looked at the specific
detrimental levels of salinity; excess sodium, chloride, boron and at water logging. If these individual effects are known, appropriate
management of the watering regimes can be more easily established.
3. Scope of this Work
This report is part of a larger investigation of the response and sensitivity of landscape plants within the Adelaide Park Lands to
the use of Glenelg recycled water for their irrigation. The scope of work for this report included:
» a review of the current literature available on possible impacts of the use of treated wastewater on native plants in the
Adelaide Park Lands, detailing potential toxic effects of salinity, sodium, chloride and boron.
» an introduction of the major plant species reported in the Adelaide Park Lands as well as their characteristics and
function within the Australian landscape.
» a summary of water logging, salinity, sodium, chloride and boron tolerance of the selected species (provided in
Appendix 2)
» management measures and recommendations for planting design within the Park Lands and watering methods and
regimes for the same area.
This report will use plant species found on the list reported by Long (2003), with the main focus on plants available in larger
number of parks within the parklands. The major aim is to provide specific information on their botanical characteristics and
tolerance to certain toxic elements, focussing on salinity, sodium, chloride and boron.
4. The Study Area
The Adelaide Park Lands are the study area in this report. They are the arrangement of green spaces encircling the central
business district of Adelaide and North Adelaide. This green space is bounded by a number of roads and the railway, including:
Park Terrace, Fitzroy Terrace and Robe Terrace to the north; Hackney Road, Dequetteville Terrace and Fullarton Road to the east;
Greenhill Road to the south and finally, the railway line and Port Road to the West (Long, 2003). The Adelaide Park Lands (Figure
1) cover 720 ha and comprise 45% of the area of the city of Adelaide (Long, 2003).

16
5. Vegetation in the Adelaide Park Lands
During 2002 and 2003 a biodiversity survey of the flora and fauna within the Adelaide Park Lands
was undertaken. At this time, Long (2003) compiled a comprehensive list of the vascular plant species
found in each of the 27 parks. Our current information is limited to those plants on Long’s (2003) list.
A brief summary of this information is as follows:
1. 514 plant taxa were recorded of which 60% (309 species) are introduced and non-locally indigenous; 183 species are
indigenous to the area (Long, 2003); at the time of the survey, 22 grass species remained unidentified.
2. There is no comprehensive record of the spatial arrangement of each listed species. The information lists the presence
of each species within each park area. The complete list of these plant species and their presence within each park is
available in Appendix 2.
3. The available vegetation information does not indicate the abundance of each species. Therefore, this data can only
provide an indication of the richness of the plant species’ within the Park Lands area.
4. Of the plant species indigenous to the locality (species that naturally occur in the area) the families
listed in decreasing order of richness are: Gramineae (42 taxa); Leguminosae (22 taxa); Myrtaceae and
Compositae (20 taxa each); Liliaceae, Cyperaceae, Chenopodiaceae (13 taxa each); Juncaceae (8 taxa)
and Pittosporaceae (5 taxa).
5. The major plant species are identified as grasses, eucalypts and acacias. The dominant understorey species are chenopods,
lilies and daisies.The dominant water course species are sedges and rushes.
6. Opportunistic surveys of specific areas within parks 6, 16, 17, 21 and 22 are shown in Long, (2003). This information
may be less representative of the vegetation of the whole Adelaide Park Lands.
Priority has been given to plant species present in the greatest number of parks. Characteristics of the locally endemic species
found in most of the parks in the Adelaide Park Lands are outlined in Sections 5.1 and 5.2.
17
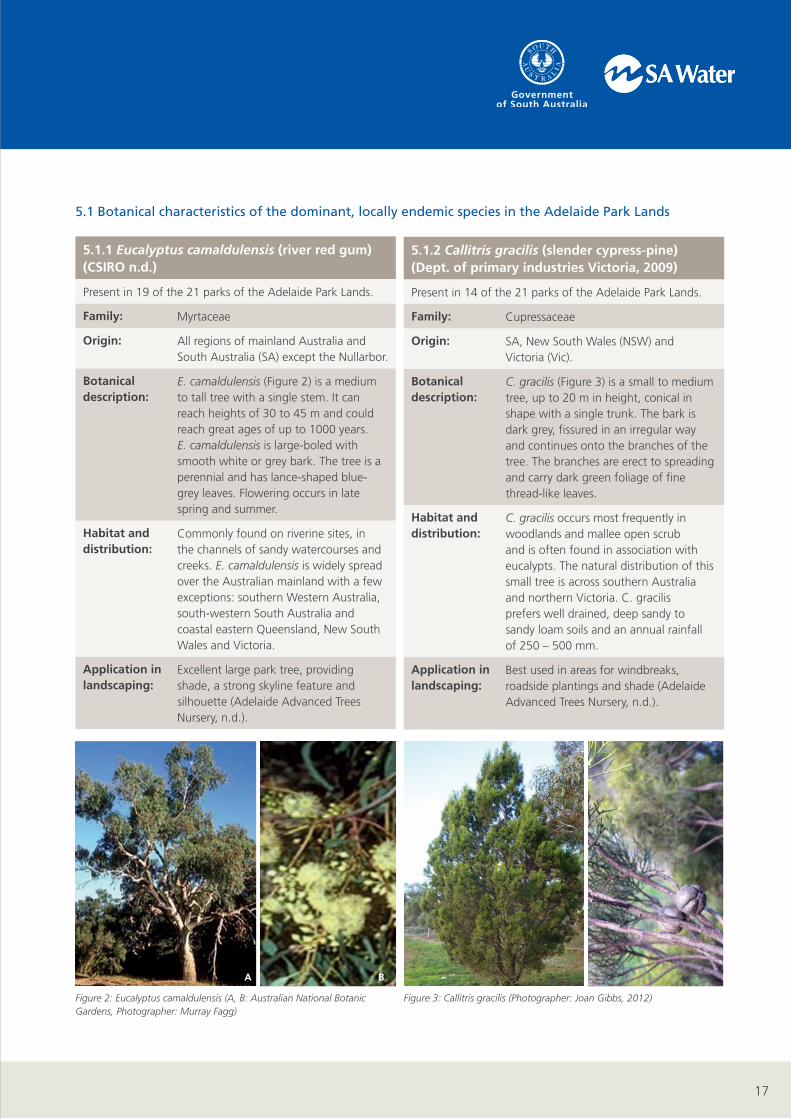
Figure 3: Callitris gracilis (Photographer: Joan Gibbs, 2012)Figure 2: Eucalyptus camaldulensis (A, B: Australian National Botanic Gardens, Photographer: Murray Fagg)
A
5.1 Botanical characteristics of the dominant, locally endemic species in the Adelaide Park Lands
5.1.1 Eucalyptus camaldulensis (river red gum) (CSIRO n.d.)
Present in 19 of the 21 parks of the Adelaide Park Lands.
Family: Myrtaceae
Origin: All regions of mainland Australia and South Australia (SA) except the Nullarbor.
Botanical description:
E. camaldulensis (Figure 2) is a medium to tall tree with a single stem. It can reach heights of 30 to 45 m and could reach great ages of up to 1000 years. E. camaldulensis is large-boled with smooth white or grey bark. The tree is a perennial and has lance-shaped blue-grey leaves. Flowering occurs in late spring and summer.
Habitat and distribution:
Commonly found on riverine sites, in the channels of sandy watercourses and creeks. E. camaldulensis is widely spread over the Australian mainland with a few exceptions: southern Western Australia, south-western South Australia and coastal eastern Queensland, New South Wales and Victoria.
Application in landscaping:
Excellent large park tree, providing shade, a strong skyline feature and silhouette (Adelaide Advanced Trees Nursery, n.d.).
5.1.2 Callitris gracilis (slender cypress-pine) (Dept. of primary industries Victoria, 2009)
Present in 14 of the 21 parks of the Adelaide Park Lands.
Family: Cupressaceae
Origin: SA, New South Wales (NSW) and Victoria (Vic).
Botanical description:
C. gracilis (Figure 3) is a small to medium tree, up to 20 m in height, conical in shape with a single trunk. The bark is dark grey, fissured in an irregular way and continues onto the branches of the tree. The branches are erect to spreading and carry dark green foliage of fine thread-like leaves.
Habitat and distribution:
C. gracilis occurs most frequently in woodlands and mallee open scrub and is often found in association with eucalypts. The natural distribution of this small tree is across southern Australia and northern Victoria. C. gracilis prefers well drained, deep sandy to sandy loam soils and an annual rainfall of 250 – 500 mm.
Application in landscaping:
Best used in areas for windbreaks, roadside plantings and shade (Adelaide Advanced Trees Nursery, n.d.).
B
18
Figure 5: Eucalyptus leucoxylon (Australian Native Plant Society;
Photographer: Brian Walters)
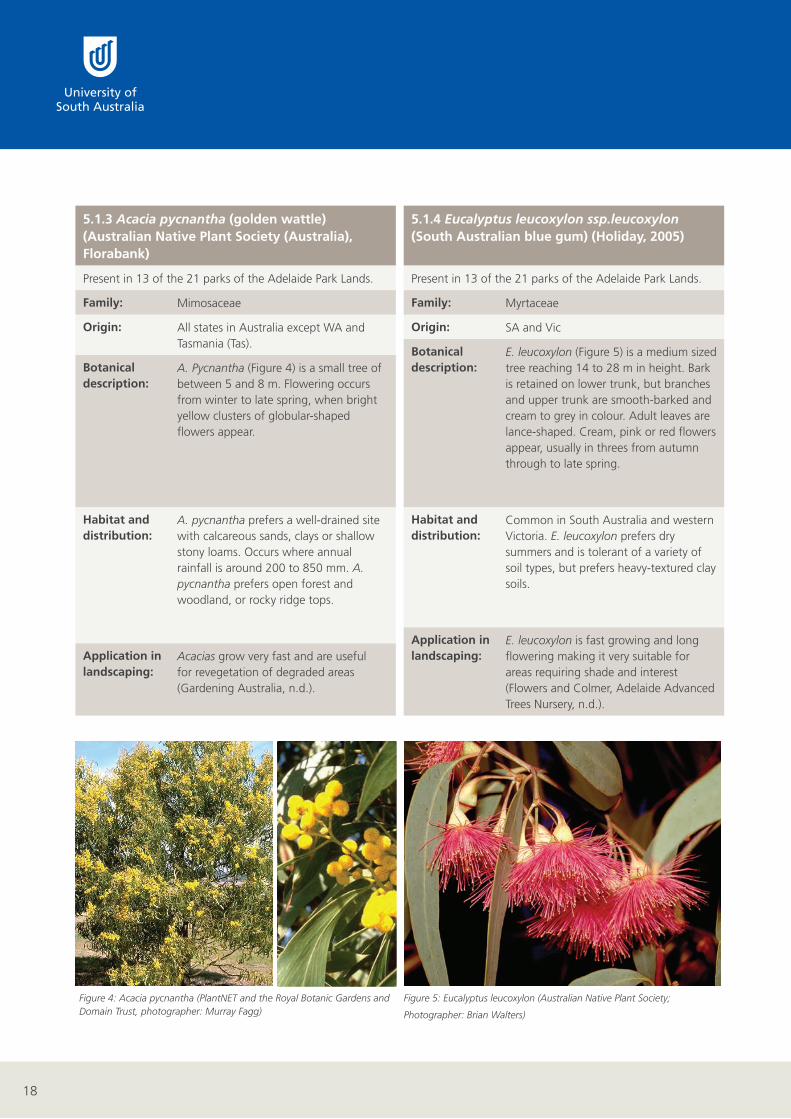
5.1.3 Acacia pycnantha (golden wattle) (Australian Native Plant Society (Australia), Florabank)
Present in 13 of the 21 parks of the Adelaide Park Lands.
Family: Mimosaceae
Origin: All states in Australia except WA and Tasmania (Tas).
Botanical description:
A. Pycnantha (Figure 4) is a small tree of between 5 and 8 m. Flowering occurs from winter to late spring, when bright yellow clusters of globular-shaped flowers appear.
Habitat and distribution:
A. pycnantha prefers a well-drained site with calcareous sands, clays or shallow stony loams. Occurs where annual rainfall is around 200 to 850 mm. A. pycnantha prefers open forest and woodland, or rocky ridge tops.
Application in landscaping:
Acacias grow very fast and are useful for revegetation of degraded areas (Gardening Australia, n.d.).
Figure 4: Acacia pycnantha (PlantNET and the Royal Botanic Gardens and Domain Trust, photographer: Murray Fagg)
5.1.4 Eucalyptus leucoxylon ssp.leucoxylon (South Australian blue gum) (Holiday, 2005)
Present in 13 of the 21 parks of the Adelaide Park Lands.
Family: Myrtaceae
Origin: SA and Vic
Botanical description:
E. leucoxylon (Figure 5) is a medium sized tree reaching 14 to 28 m in height. Bark is retained on lower trunk, but branches and upper trunk are smooth-barked and cream to grey in colour. Adult leaves are lance-shaped. Cream, pink or red flowers appear, usually in threes from autumn through to late spring.
Habitat and distribution:
Common in South Australia and western Victoria. E. leucoxylon prefers dry summers and is tolerant of a variety of soil types, but prefers heavy-textured clay soils.
Application in landscaping:
E. leucoxylon is fast growing and long flowering making it very suitable for areas requiring shade and interest (Flowers and Colmer, Adelaide Advanced Trees Nursery, n.d.).
19
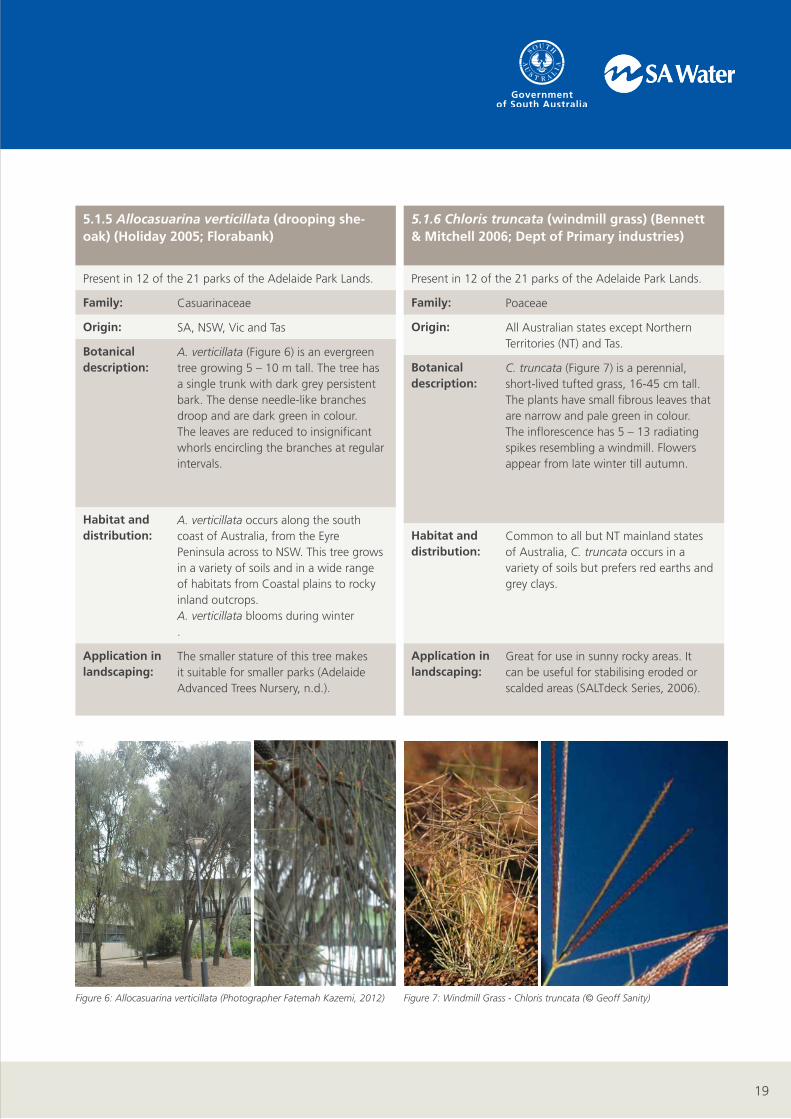
5.1.5 Allocasuarina verticillata (drooping she-oak) (Holiday 2005; Florabank)
Present in 12 of the 21 parks of the Adelaide Park Lands.
Family: Casuarinaceae
Origin: SA, NSW, Vic and Tas
Botanical description:
A. verticillata (Figure 6) is an evergreen tree growing 5 – 10 m tall. The tree has a single trunk with dark grey persistent bark. The dense needle-like branches droop and are dark green in colour. The leaves are reduced to insignificant whorls encircling the branches at regular intervals.
Habitat and distribution:
A. verticillata occurs along the south coast of Australia, from the Eyre Peninsula across to NSW. This tree grows in a variety of soils and in a wide range of habitats from Coastal plains to rocky inland outcrops. A. verticillata blooms during winter .
Application in landscaping:
The smaller stature of this tree makes it suitable for smaller parks (Adelaide Advanced Trees Nursery, n.d.).
Figure 7: Windmill Grass - Chloris truncata (© Geoff Sanity)Figure 6: Allocasuarina verticillata (Photographer Fatemah Kazemi, 2012)
5.1.6 Chloris truncata (windmill grass) (Bennett & Mitchell 2006; Dept of Primary industries)
Present in 12 of the 21 parks of the Adelaide Park Lands.
Family: Poaceae
Origin: All Australian states except Northern Territories (NT) and Tas.
Botanical description:
C. truncata (Figure 7) is a perennial, short-lived tufted grass, 16-45 cm tall. The plants have small fibrous leaves that are narrow and pale green in colour. The inflorescence has 5 – 13 radiating spikes resembling a windmill. Flowers appear from late winter till autumn.
Habitat and distribution:
Common to all but NT mainland states of Australia, C. truncata occurs in a variety of soils but prefers red earths and grey clays.
Application in landscaping:
Great for use in sunny rocky areas. It can be useful for stabilising eroded or scalded areas (SALTdeck Series, 2006).
20
Figure 9: Atriplex semibaccata (A & B: Lotte Von Richter, The Australian Botanic
Garden, Mount Annan)
A B
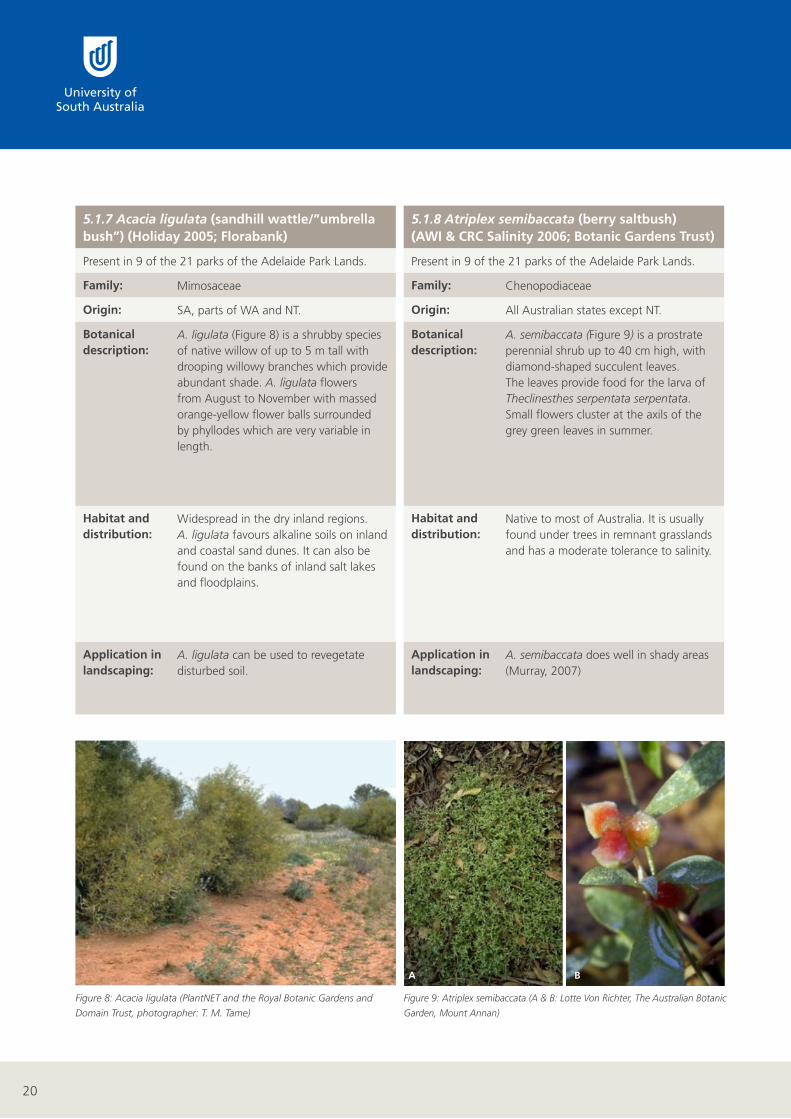
5.1.7 Acacia ligulata (sandhill wattle/”umbrella bush”) (Holiday 2005; Florabank)
Present in 9 of the 21 parks of the Adelaide Park Lands.
Family: Mimosaceae
Origin: SA, parts of WA and NT.
Botanical description:
A. ligulata (Figure 8) is a shrubby species of native willow of up to 5 m tall with drooping willowy branches which provide abundant shade. A. ligulata flowers from August to November with massed orange-yellow flower balls surrounded by phyllodes which are very variable in length.
Habitat and distribution:
Widespread in the dry inland regions. A. ligulata favours alkaline soils on inland and coastal sand dunes. It can also be found on the banks of inland salt lakes and floodplains.
Application in landscaping:
A. ligulata can be used to revegetate disturbed soil.
Figure 8: Acacia ligulata (PlantNET and the Royal Botanic Gardens and
Domain Trust, photographer: T. M. Tame)
5.1.8 Atriplex semibaccata (berry saltbush) (AWI & CRC Salinity 2006; Botanic Gardens Trust)
Present in 9 of the 21 parks of the Adelaide Park Lands.
Family: Chenopodiaceae
Origin: All Australian states except NT.
Botanical description:
A. semibaccata (Figure 9) is a prostrate perennial shrub up to 40 cm high, with diamond-shaped succulent leaves. The leaves provide food for the larva of Theclinesthes serpentata serpentata. Small flowers cluster at the axils of the grey green leaves in summer.
Habitat and distribution:
Native to most of Australia. It is usually found under trees in remnant grasslands and has a moderate tolerance to salinity.
Application in landscaping:
A. semibaccata does well in shady areas (Murray, 2007)
21
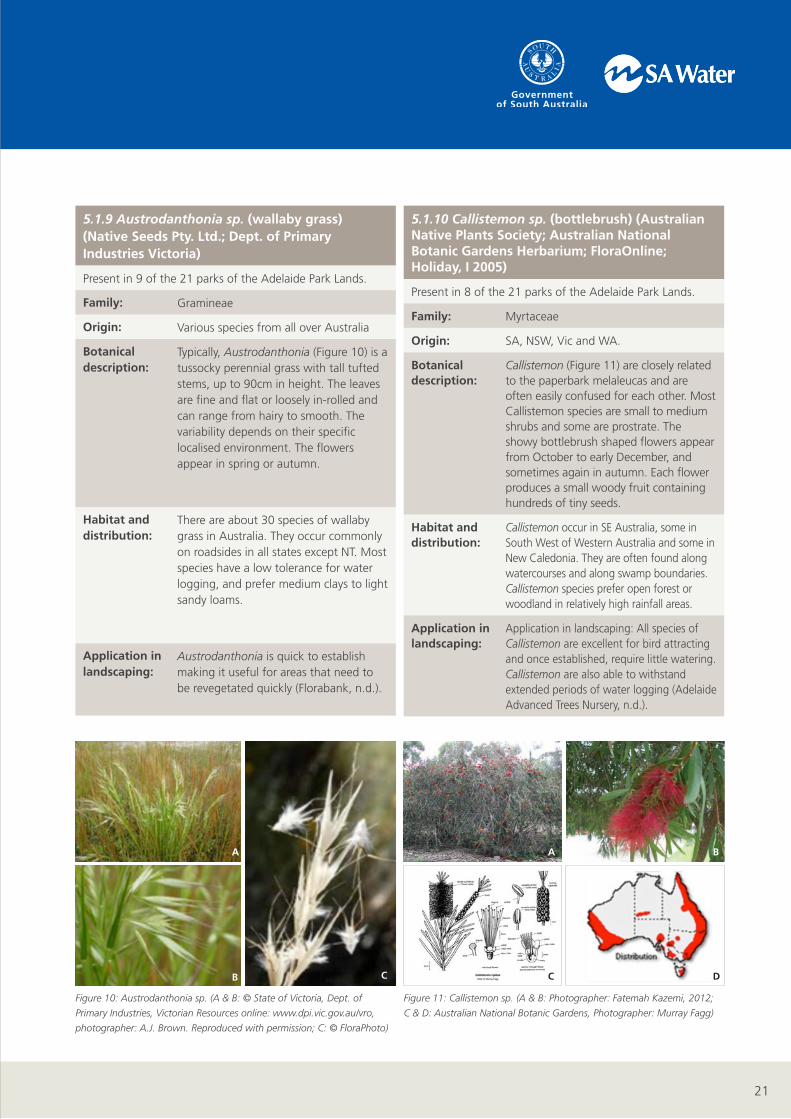
5.1.9 Austrodanthonia sp. (wallaby grass) (Native Seeds Pty. Ltd.; Dept. of Primary Industries Victoria)
Present in 9 of the 21 parks of the Adelaide Park Lands.
Family: Gramineae
Origin: Various species from all over Australia
Botanical description:
Typically, Austrodanthonia (Figure 10) is a tussocky perennial grass with tall tufted stems, up to 90cm in height. The leaves are fine and flat or loosely in-rolled and can range from hairy to smooth. The variability depends on their specific localised environment. The flowers appear in spring or autumn.
Habitat and distribution:
There are about 30 species of wallaby grass in Australia. They occur commonly on roadsides in all states except NT. Most species have a low tolerance for water logging, and prefer medium clays to light sandy loams.
Application in landscaping:
Austrodanthonia is quick to establish making it useful for areas that need to be revegetated quickly (Florabank, n.d.).
Figure 10: Austrodanthonia sp. (A & B: © State of Victoria, Dept. of
Primary Industries, Victorian Resources online: www.dpi.vic.gov.au/vro,
photographer: A.J. Brown. Reproduced with permission; C: © FloraPhoto)
A
B
Figure 11: Callistemon sp. (A & B: Photographer: Fatemah Kazemi, 2012;
C & D: Australian National Botanic Gardens, Photographer: Murray Fagg)
A B
C D
5.1.10 Callistemon sp. (bottlebrush) (Australian Native Plants Society; Australian National Botanic Gardens Herbarium; FloraOnline; Holiday, I 2005)
Present in 8 of the 21 parks of the Adelaide Park Lands.
Family: Myrtaceae
Origin: SA, NSW, Vic and WA.
Botanical description:
Callistemon (Figure 11) are closely related to the paperbark melaleucas and are often easily confused for each other. Most Callistemon species are small to medium shrubs and some are prostrate. The showy bottlebrush shaped flowers appear from October to early December, and sometimes again in autumn. Each flower produces a small woody fruit containing hundreds of tiny seeds.
Habitat and distribution:
Callistemon occur in SE Australia, some in South West of Western Australia and some in New Caledonia. They are often found along watercourses and along swamp boundaries. Callistemon species prefer open forest or woodland in relatively high rainfall areas.
Application in landscaping:
Application in landscaping: All species of Callistemon are excellent for bird attracting and once established, require little watering. Callistemon are also able to withstand extended periods of water logging (Adelaide Advanced Trees Nursery, n.d.).
C
22
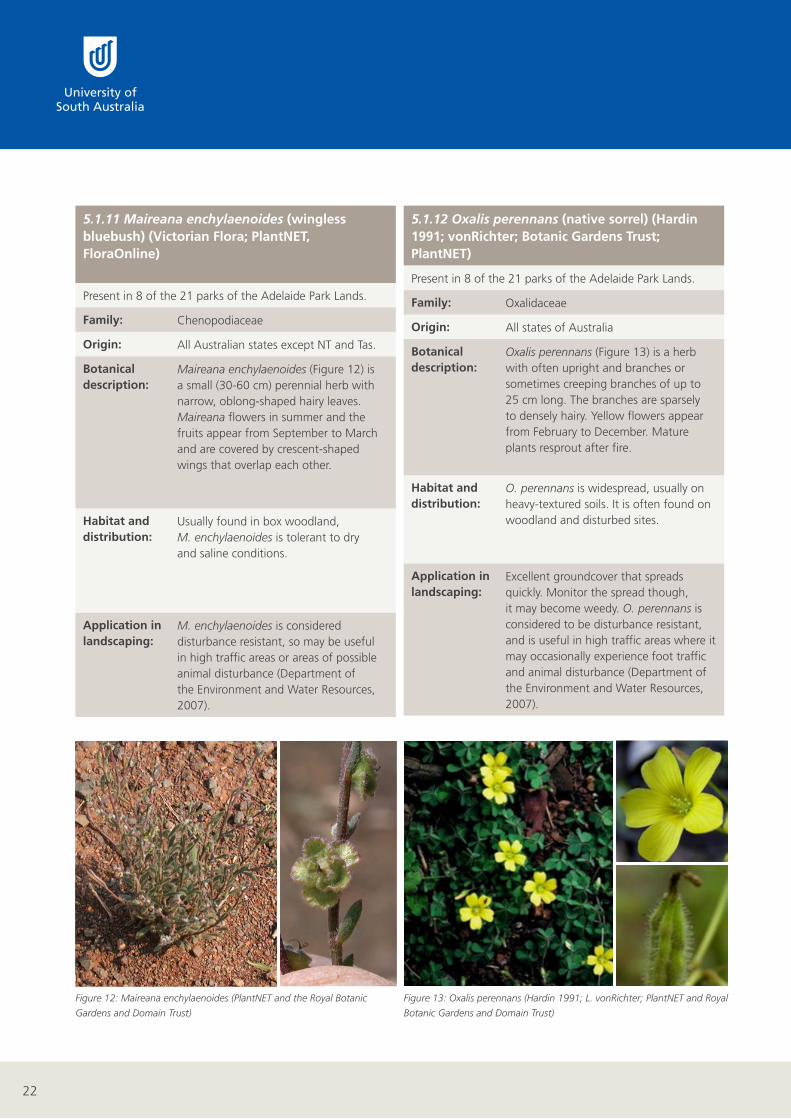
Figure 13: Oxalis perennans (Hardin 1991; L. vonRichter; PlantNET and Royal
Botanic Gardens and Domain Trust)
5.1.11 Maireana enchylaenoides (wingless bluebush) (Victorian Flora; PlantNET, FloraOnline)
Present in 8 of the 21 parks of the Adelaide Park Lands.
Family: Chenopodiaceae
Origin: All Australian states except NT and Tas.
Botanical description:
Maireana enchylaenoides (Figure 12) is a small (30-60 cm) perennial herb with narrow, oblong-shaped hairy leaves. Maireana flowers in summer and the fruits appear from September to March and are covered by crescent-shaped wings that overlap each other.
Habitat and distribution:
Usually found in box woodland, M. enchylaenoides is tolerant to dry and saline conditions.
Application in landscaping:
M. enchylaenoides is considered disturbance resistant, so may be useful in high traffic areas or areas of possible animal disturbance (Department of the Environment and Water Resources, 2007).
Figure 12: Maireana enchylaenoides (PlantNET and the Royal Botanic
Gardens and Domain Trust)
5.1.12 Oxalis perennans (native sorrel) (Hardin 1991; vonRichter; Botanic Gardens Trust; PlantNET)
Present in 8 of the 21 parks of the Adelaide Park Lands.
Family: Oxalidaceae
Origin: All states of Australia
Botanical description:
Oxalis perennans (Figure 13) is a herb with often upright and branches or sometimes creeping branches of up to 25 cm long. The branches are sparsely to densely hairy. Yellow flowers appear from February to December. Mature plants resprout after fire.
Habitat and distribution:
O. perennans is widespread, usually on heavy-textured soils. It is often found on woodland and disturbed sites.
Application in landscaping:
Excellent groundcover that spreads quickly. Monitor the spread though, it may become weedy. O. perennans is considered to be disturbance resistant, and is useful in high traffic areas where it may occasionally experience foot traffic and animal disturbance (Department of the Environment and Water Resources, 2007).
23
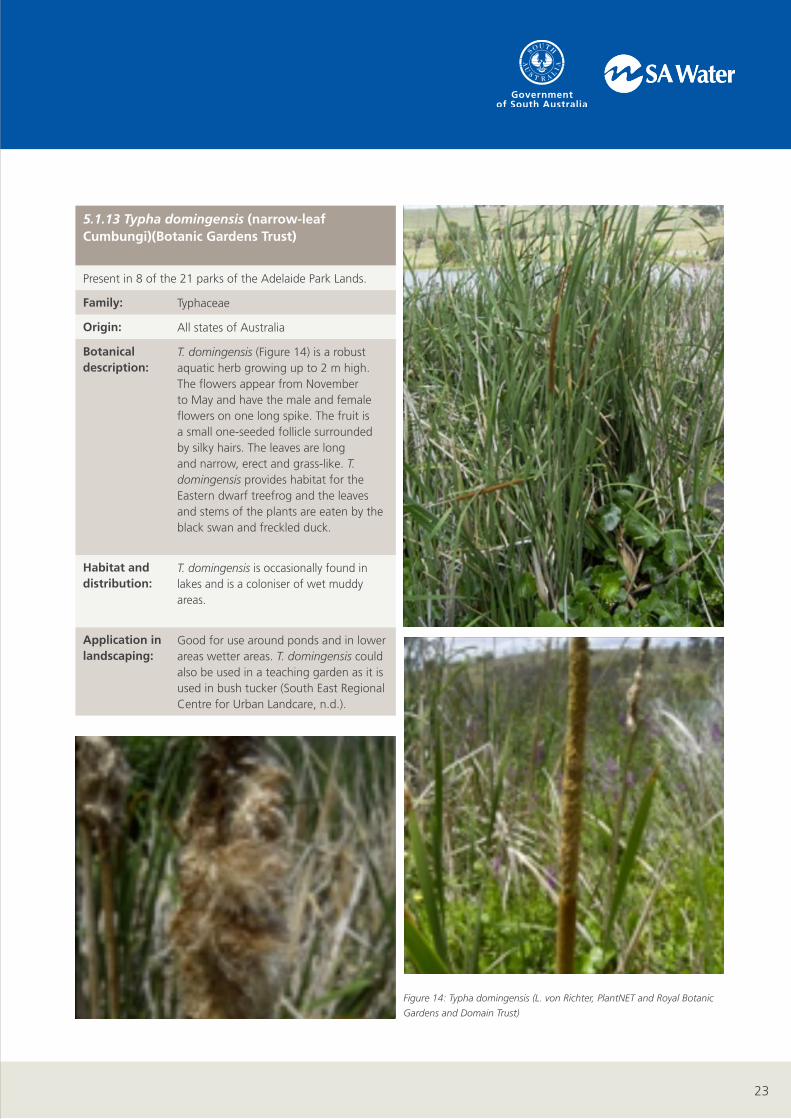
Figure 14: Typha domingensis (L. von Richter, PlantNET and Royal Botanic
Gardens and Domain Trust)
5.1.13 Typha domingensis (narrow-leaf Cumbungi)(Botanic Gardens Trust)
Present in 8 of the 21 parks of the Adelaide Park Lands.
Family: Typhaceae
Origin: All states of Australia
Botanical description:
T. domingensis (Figure 14) is a robust aquatic herb growing up to 2 m high. The flowers appear from November to May and have the male and female flowers on one long spike. The fruit is a small one-seeded follicle surrounded by silky hairs. The leaves are long and narrow, erect and grass-like. T. domingensis provides habitat for the Eastern dwarf treefrog and the leaves and stems of the plants are eaten by the black swan and freckled duck.
Habitat and distribution:
T. domingensis is occasionally found in lakes and is a coloniser of wet muddy areas.
Application in landscaping:
Good for use around ponds and in lower areas wetter areas. T. domingensis could also be used in a teaching garden as it is used in bush tucker (South East Regional Centre for Urban Landcare, n.d.).
24
5.2 Characteristics of turf grasses
Large areas of the Adelaide Park Lands are dedicated to sports playing fields and golf courses. Approximately a third to a half of
all irrigation water for an urban area is used on turf (Handreck and Black, 1986). Turf grasses prefer infrequent, deep watering
which encourages deep root growth, thereby increasing water storage area (Handreck and Black, 1986). Shading by deep tap
rooted trees or buildings is another method of reducing the need for excessive watering on turf park areas (Handreck and
Black, 1986).
The predominant turf grasses in the Adelaide Park Lands are Kikuyu (Pennisetum clandestinum), Couch Grass (Cynodon spp.)
and Bentgrass (Agrostis tenuis)(REM and SRHS, 2007).
As Handreck and Black (1986) and Neylan (Neylan, 2005) explain, warm-season turf grasses such as P. clandestinum and Cynodon
are more efficient water users than cool-season turf grasses. It is however, important to complement the warm season grasses
by over-seeding with a cool season grass such as A. tenuis in order to maintain a reasonable turf cover during the colder seasons
(Neylan, 2005). All three of these grasses have a moderate tolerance to salinity (if not waterlogged). Their tolerance to water
logging is also moderate (Moore, 2006). These characteristics make them a sustainable and durable option for turf grasses in the
high traffic grassed areas of the Adelaide Park Lands where recycled wastewater will be used for irrigation.
Figure 15: Pennisetum clandestinum (© J Gibbs, 2005)
A
B
5.2.1 Characteristics of Pennisetum clandestinum (Kikuyu grass)
Family: Poaceae
Origin: Central African highlands – Kenya & Ethiopia
Botanical description:
P. clandestinum (Figure 15) is a coarse textured, light green prostrate grass that forms a dense turf. The plant spreads easily via rhizomes and vigorous stolons. Flowering is inconspicuous with the seed heads concealed within a leaf sheath (Moore, 2006)
Habitat and distribution:
P. clandestinum prefers a high rainfall of 1,000 mm+. It tolerates occasional frost and occurs in sub-tropical areas with mild temperatures.
Application in landscaping:
Used for dairy cow pasture; is tolerant of heavy grazing; is highly sought after as playing field turf or golf courses (Moore, 2006).
25
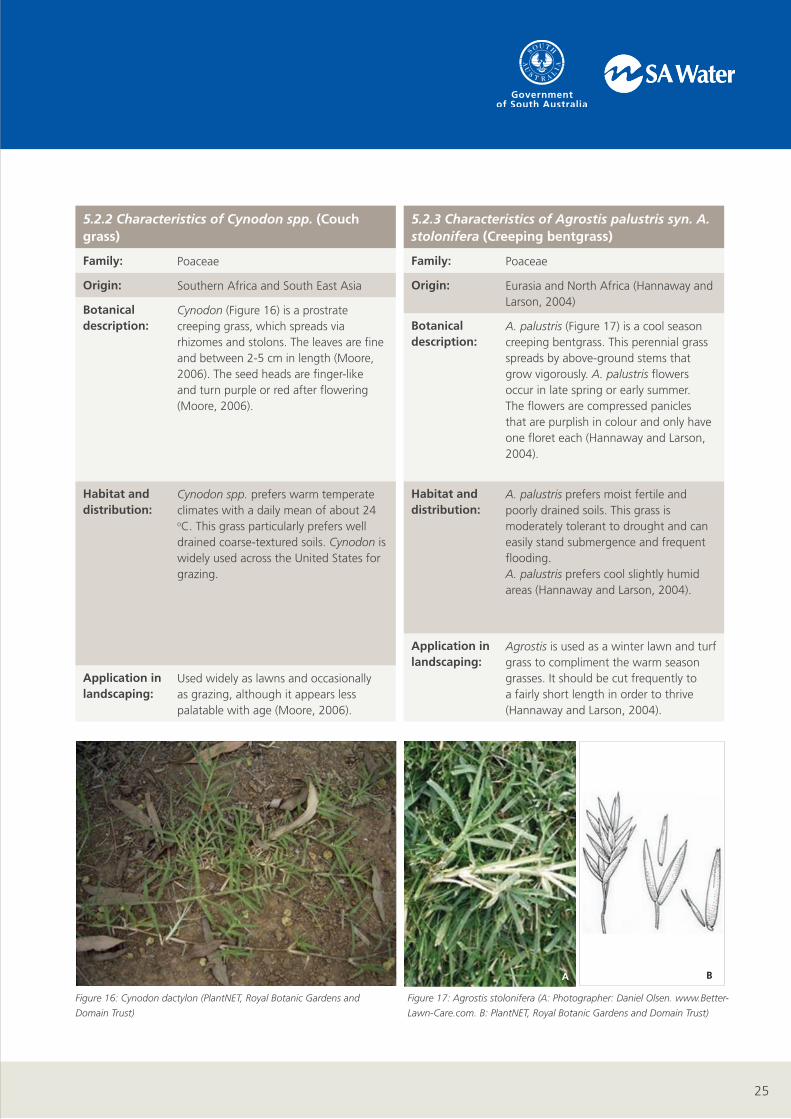
Figure 16: Cynodon dactylon (PlantNET, Royal Botanic Gardens and
Domain Trust)
Figure 17: Agrostis stolonifera (A: Photographer: Daniel Olsen. www.Better-
Lawn-Care.com. B: PlantNET, Royal Botanic Gardens and Domain Trust)
A
5.2.2 Characteristics of Cynodon spp. (Couch grass)
Family: Poaceae
Origin: Southern Africa and South East Asia
Botanical description:
Cynodon (Figure 16) is a prostrate creeping grass, which spreads via rhizomes and stolons. The leaves are fine and between 2-5 cm in length (Moore, 2006). The seed heads are finger-like and turn purple or red after flowering (Moore, 2006).
Habitat and distribution:
Cynodon spp. prefers warm temperate climates with a daily mean of about 24 oC. This grass particularly prefers well drained coarse-textured soils. Cynodon is widely used across the United States for grazing.
Application in landscaping:
Used widely as lawns and occasionally as grazing, although it appears less palatable with age (Moore, 2006).
5.2.3 Characteristics of Agrostis palustris syn. A. stolonifera (Creeping bentgrass)
Family: Poaceae
Origin: Eurasia and North Africa (Hannaway and Larson, 2004)
Botanical description:
A. palustris (Figure 17) is a cool season creeping bentgrass. This perennial grass spreads by above-ground stems that grow vigorously. A. palustris flowers occur in late spring or early summer. The flowers are compressed panicles that are purplish in colour and only have one floret each (Hannaway and Larson, 2004).
Habitat and distribution:
A. palustris prefers moist fertile and poorly drained soils. This grass is moderately tolerant to drought and can easily stand submergence and frequent flooding. A. palustris prefers cool slightly humid areas (Hannaway and Larson, 2004).
Application in landscaping:
Agrostis is used as a winter lawn and turf grass to compliment the warm season grasses. It should be cut frequently to a fairly short length in order to thrive (Hannaway and Larson, 2004).
B
26
Irrigation Management Plan
Impact and bevefits
assessment
Assessment of plant sensitivity
to salts and nutrients
Water and salt balance
Irrigation management approaches
Management strategy review
Framework for management of environmental
effects associated with treated wastewater irrigation of
Adelaide’s Parklands
Sustainable irrigation practices
ImplementationMonitoring and
evaluation
Core Components Process and Facilitation
Evolving knowledge system Community stewardship
Stakeholders
Learning
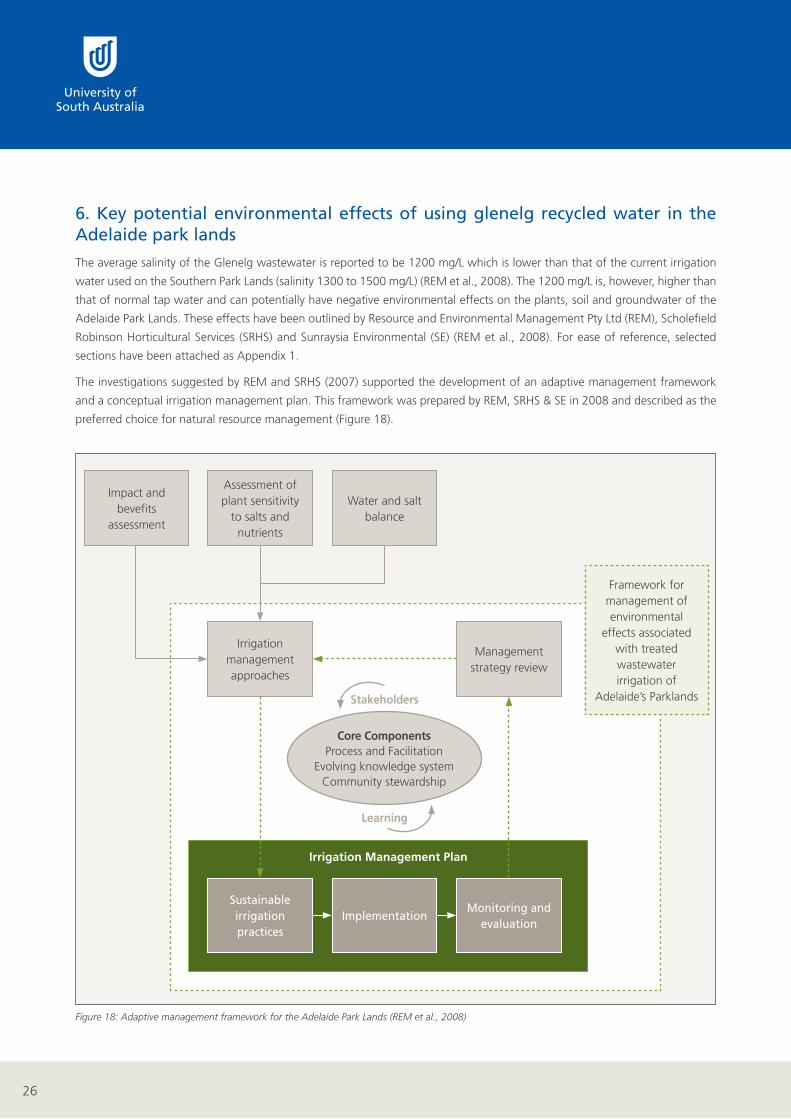
Figure 18: Adaptive management framework for the Adelaide Park Lands (REM et al., 2008)
6. Key potential environmental effects of using glenelg recycled water in the Adelaide park lands
The average salinity of the Glenelg wastewater is reported to be 1200 mg/L which is lower than that of the current irrigation
water used on the Southern Park Lands (salinity 1300 to 1500 mg/L) (REM et al., 2008). The 1200 mg/L is, however, higher than
that of normal tap water and can potentially have negative environmental effects on the plants, soil and groundwater of the
Adelaide Park Lands. These effects have been outlined by Resource and Environmental Management Pty Ltd (REM), Scholefield
Robinson Horticultural Services (SRHS) and Sunraysia Environmental (SE) (REM et al., 2008). For ease of reference, selected
sections have been attached as Appendix 1.
The investigations suggested by REM and SRHS (2007) supported the development of an adaptive management framework
and a conceptual irrigation management plan. This framework was prepared by REM, SRHS & SE in 2008 and described as the
preferred choice for natural resource management (Figure 18).
27
A requirement of the adaptive management framework laid out above, is an assessment of the current available knowledge on
the sensitivity and responses of the Adelaide Park Lands plant species to specific salts and nutrients in the treated wastewater.
An informed understanding of any limitations should allow for the development of a sustainable irrigation management plan
that will increase the probability of the survival and healthy development of the plants used in revegetation. The use of recycled
wastewater has been identified as a potential sustainable irrigation practice, one of the management approaches identified in
Figure 18.
6.1. Recycled wastewater
Recycled wastewater may potentially contain levels of chemicals deleterious to vegetation and the environment. It is important
to set chemical parameters when preparing guidelines for the use of recycled water for irrigation purposes (Salgot et al., 2006).
The South Australian Department of Health has approved treated wastewater from the Glenelg Waste Water Treatment Plant
for unrestricted irrigation use (REM et al., 2008).
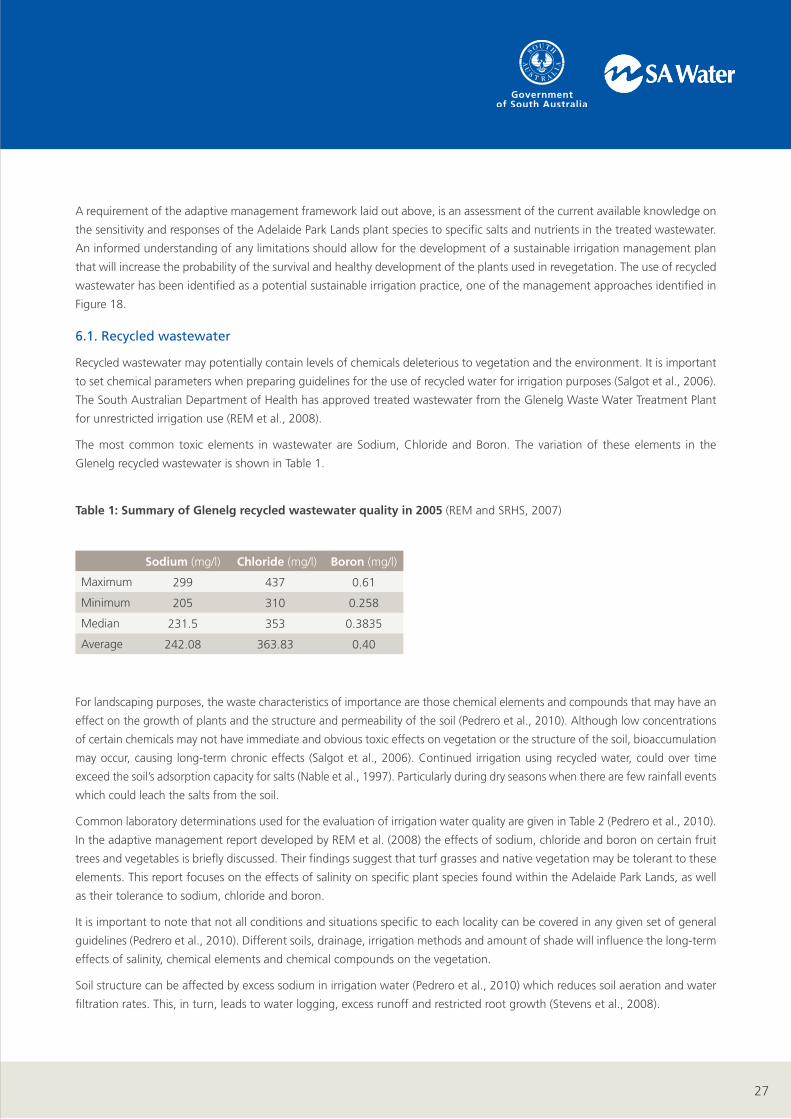
The most common toxic elements in wastewater are Sodium, Chloride and Boron. The variation of these elements in the
Glenelg recycled wastewater is shown in Table 1.
Table 1: Summary of Glenelg recycled wastewater quality in 2005 (REM and SRHS, 2007)
Sodium (mg/l) Chloride (mg/l) Boron (mg/l)
Maximum 299 437 0.61
Minimum 205 310 0.258
Median 231.5 353 0.3835
Average 242.08 363.83 0.40
For landscaping purposes, the waste characteristics of importance are those chemical elements and compounds that may have an
effect on the growth of plants and the structure and permeability of the soil (Pedrero et al., 2010). Although low concentrations
of certain chemicals may not have immediate and obvious toxic effects on vegetation or the structure of the soil, bioaccumulation
may occur, causing long-term chronic effects (Salgot et al., 2006). Continued irrigation using recycled water, could over time
exceed the soil’s adsorption capacity for salts (Nable et al., 1997). Particularly during dry seasons when there are few rainfall events
which could leach the salts from the soil.
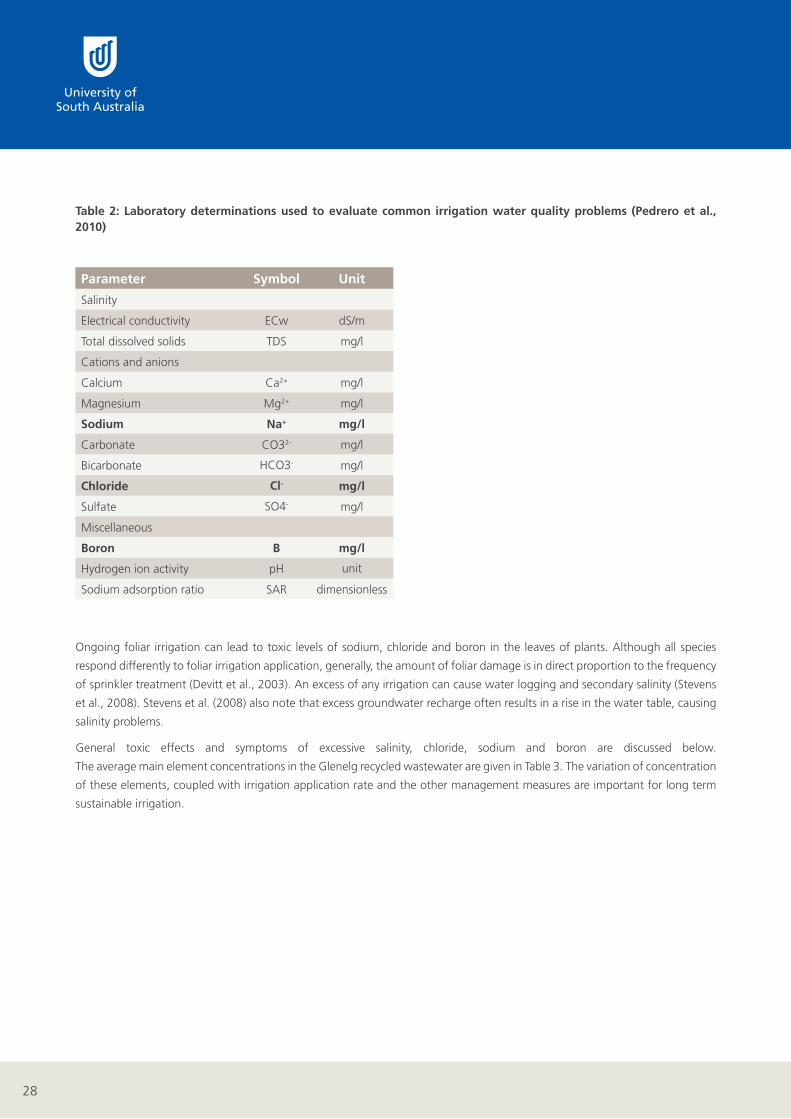
Common laboratory determinations used for the evaluation of irrigation water quality are given in Table 2 (Pedrero et al., 2010).
In the adaptive management report developed by REM et al. (2008) the effects of sodium, chloride and boron on certain fruit
trees and vegetables is briefly discussed. Their findings suggest that turf grasses and native vegetation may be tolerant to these
elements. This report focuses on the effects of salinity on specific plant species found within the Adelaide Park Lands, as well
as their tolerance to sodium, chloride and boron.
It is important to note that not all conditions and situations specific to each locality can be covered in any given set of general
guidelines (Pedrero et al., 2010). Different soils, drainage, irrigation methods and amount of shade will influence the long-term
effects of salinity, chemical elements and chemical compounds on the vegetation.
Soil structure can be affected by excess sodium in irrigation water (Pedrero et al., 2010) which reduces soil aeration and water
filtration rates. This, in turn, leads to water logging, excess runoff and restricted root growth (Stevens et al., 2008).
28
Table 2: Laboratory determinations used to evaluate common irrigation water quality problems (Pedrero et al., 2010)
Parameter Symbol Unit
Salinity
Electrical conductivity ECw dS/m
Total dissolved solids TDS mg/l
Cations and anions
Calcium Ca2+ mg/l
Magnesium Mg2+ mg/l
Sodium Na+ mg/l
Carbonate CO32- mg/l
Bicarbonate HCO3- mg/l
Chloride Cl- mg/l
Sulfate SO4- mg/l
Miscellaneous
Boron B mg/l
Hydrogen ion activity pH unit
Sodium adsorption ratio SAR dimensionless
Ongoing foliar irrigation can lead to toxic levels of sodium, chloride and boron in the leaves of plants. Although all species
respond differently to foliar irrigation application, generally, the amount of foliar damage is in direct proportion to the frequency
of sprinkler treatment (Devitt et al., 2003). An excess of any irrigation can cause water logging and secondary salinity (Stevens
et al., 2008). Stevens et al. (2008) also note that excess groundwater recharge often results in a rise in the water table, causing
salinity problems.
General toxic effects and symptoms of excessive salinity, chloride, sodium and boron are discussed below.
The average main element concentrations in the Glenelg recycled wastewater are given in Table 3. The variation of concentration
of these elements, coupled with irrigation application rate and the other management measures are important for long term
sustainable irrigation.
29
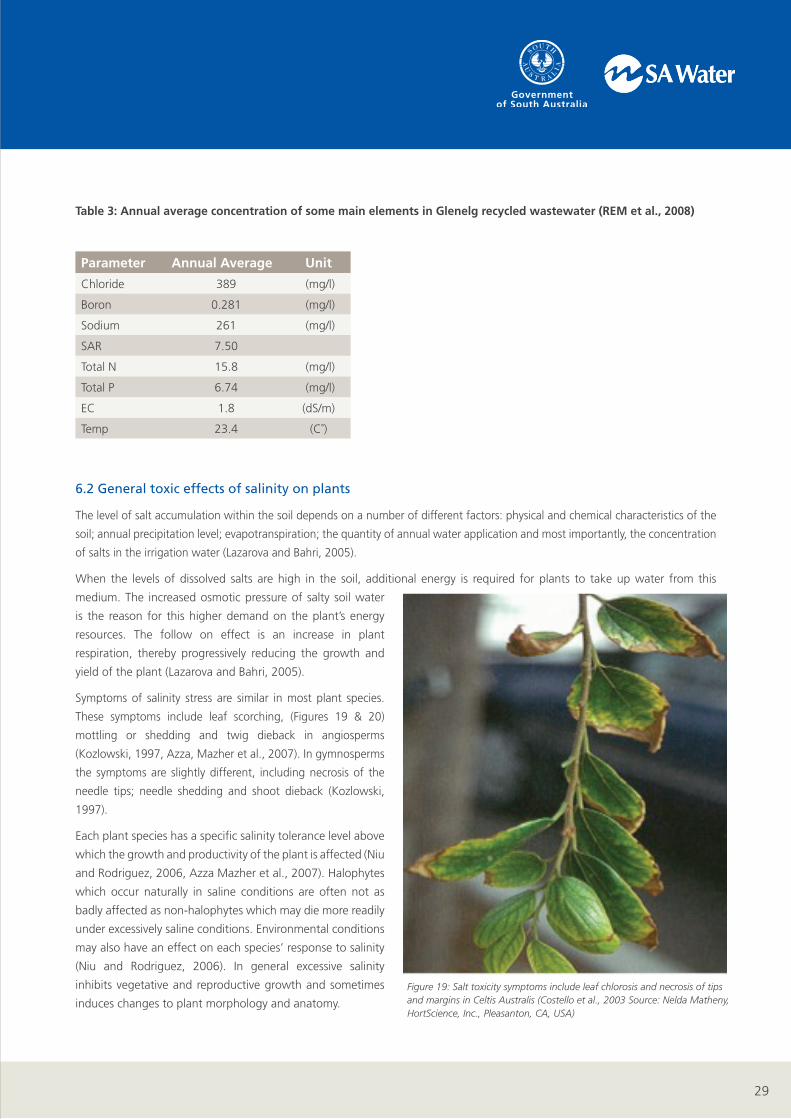
Table 3: Annual average concentration of some main elements in Glenelg recycled wastewater (REM et al., 2008)
Parameter Annual Average Unit
Chloride 389 (mg/l)
Boron 0.281 (mg/l)
Sodium 261 (mg/l)
SAR 7.50
Total N 15.8 (mg/l)
Total P 6.74 (mg/l)
EC 1.8 (dS/m)
Temp 23.4 (C˚)
6.2 General toxic effects of salinity on plants
The level of salt accumulation within the soil depends on a number of different factors: physical and chemical characteristics of the
soil; annual precipitation level; evapotranspiration; the quantity of annual water application and most importantly, the concentration
of salts in the irrigation water (Lazarova and Bahri, 2005).
When the levels of dissolved salts are high in the soil, additional energy is required for plants to take up water from this
medium. The increased osmotic pressure of salty soil water
is the reason for this higher demand on the plant’s energy
resources. The follow on effect is an increase in plant
respiration, thereby progressively reducing the growth and
yield of the plant (Lazarova and Bahri, 2005).
Symptoms of salinity stress are similar in most plant species.
These symptoms include leaf scorching, (Figures 19 & 20)
mottling or shedding and twig dieback in angiosperms
(Kozlowski, 1997, Azza, Mazher et al., 2007). In gymnosperms
the symptoms are slightly different, including necrosis of the
needle tips; needle shedding and shoot dieback (Kozlowski,
1997).
Each plant species has a specific salinity tolerance level above
which the growth and productivity of the plant is affected (Niu
and Rodriguez, 2006, Azza Mazher et al., 2007). Halophytes
which occur naturally in saline conditions are often not as
badly affected as non-halophytes which may die more readily
under excessively saline conditions. Environmental conditions
may also have an effect on each species’ response to salinity
(Niu and Rodriguez, 2006). In general excessive salinity
inhibits vegetative and reproductive growth and sometimes
induces changes to plant morphology and anatomy.
Figure 19: Salt toxicity symptoms include leaf chlorosis and necrosis of tips and margins in Celtis Australis (Costello et al., 2003 Source: Nelda Matheny, HortScience, Inc., Pleasanton, CA, USA)
30
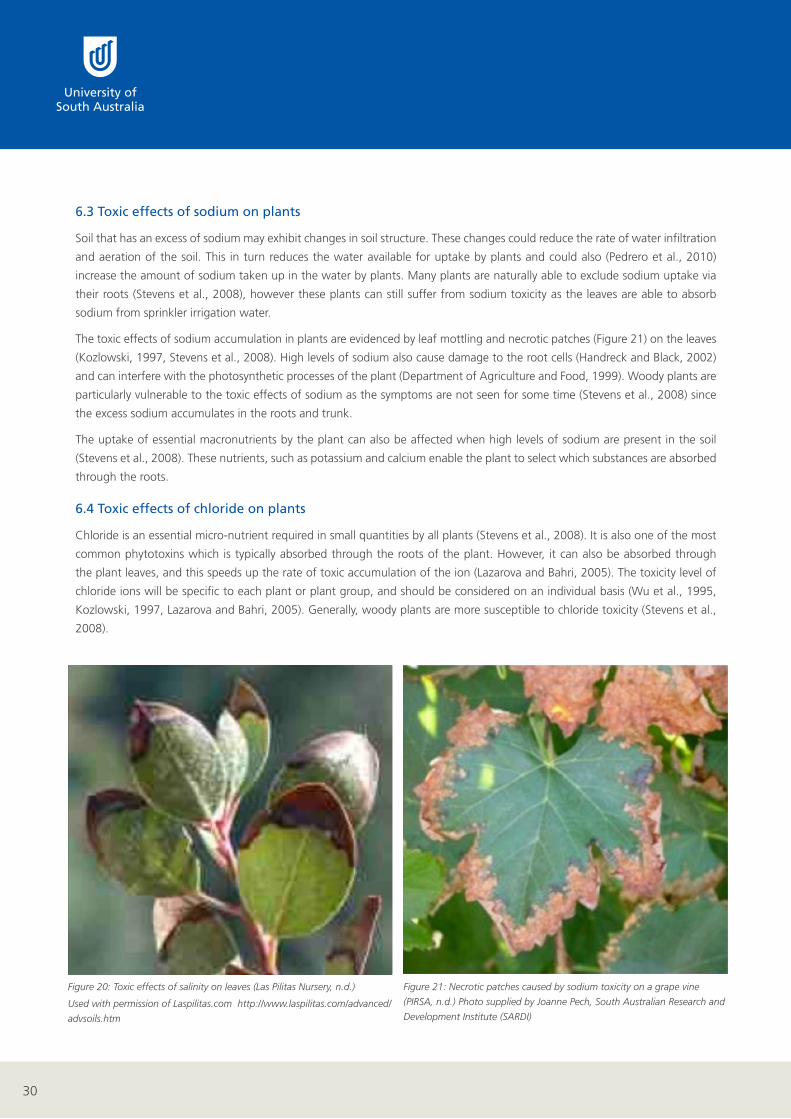
Figure 20: Toxic effects of salinity on leaves (Las Pilitas Nursery, n.d.)
Used with permission of Laspilitas.com http://www.laspilitas.com/advanced/
advsoils.htm
Figure 21: Necrotic patches caused by sodium toxicity on a grape vine
(PIRSA, n.d.) Photo supplied by Joanne Pech, South Australian Research and
Development Institute (SARDI)
6.3 Toxic effects of sodium on plants
Soil that has an excess of sodium may exhibit changes in soil structure. These changes could reduce the rate of water infiltration
and aeration of the soil. This in turn reduces the water available for uptake by plants and could also (Pedrero et al., 2010)
increase the amount of sodium taken up in the water by plants. Many plants are naturally able to exclude sodium uptake via
their roots (Stevens et al., 2008), however these plants can still suffer from sodium toxicity as the leaves are able to absorb
sodium from sprinkler irrigation water.
The toxic effects of sodium accumulation in plants are evidenced by leaf mottling and necrotic patches (Figure 21) on the leaves
(Kozlowski, 1997, Stevens et al., 2008). High levels of sodium also cause damage to the root cells (Handreck and Black, 2002)
and can interfere with the photosynthetic processes of the plant (Department of Agriculture and Food, 1999). Woody plants are
particularly vulnerable to the toxic effects of sodium as the symptoms are not seen for some time (Stevens et al., 2008) since
the excess sodium accumulates in the roots and trunk.
The uptake of essential macronutrients by the plant can also be affected when high levels of sodium are present in the soil
(Stevens et al., 2008). These nutrients, such as potassium and calcium enable the plant to select which substances are absorbed
through the roots.
6.4 Toxic effects of chloride on plants
Chloride is an essential micro-nutrient required in small quantities by all plants (Stevens et al., 2008). It is also one of the most
common phytotoxins which is typically absorbed through the roots of the plant. However, it can also be absorbed through
the plant leaves, and this speeds up the rate of toxic accumulation of the ion (Lazarova and Bahri, 2005). The toxicity level of
chloride ions will be specific to each plant or plant group, and should be considered on an individual basis (Wu et al., 1995,
Kozlowski, 1997, Lazarova and Bahri, 2005). Generally, woody plants are more susceptible to chloride toxicity (Stevens et al.,
2008).
31
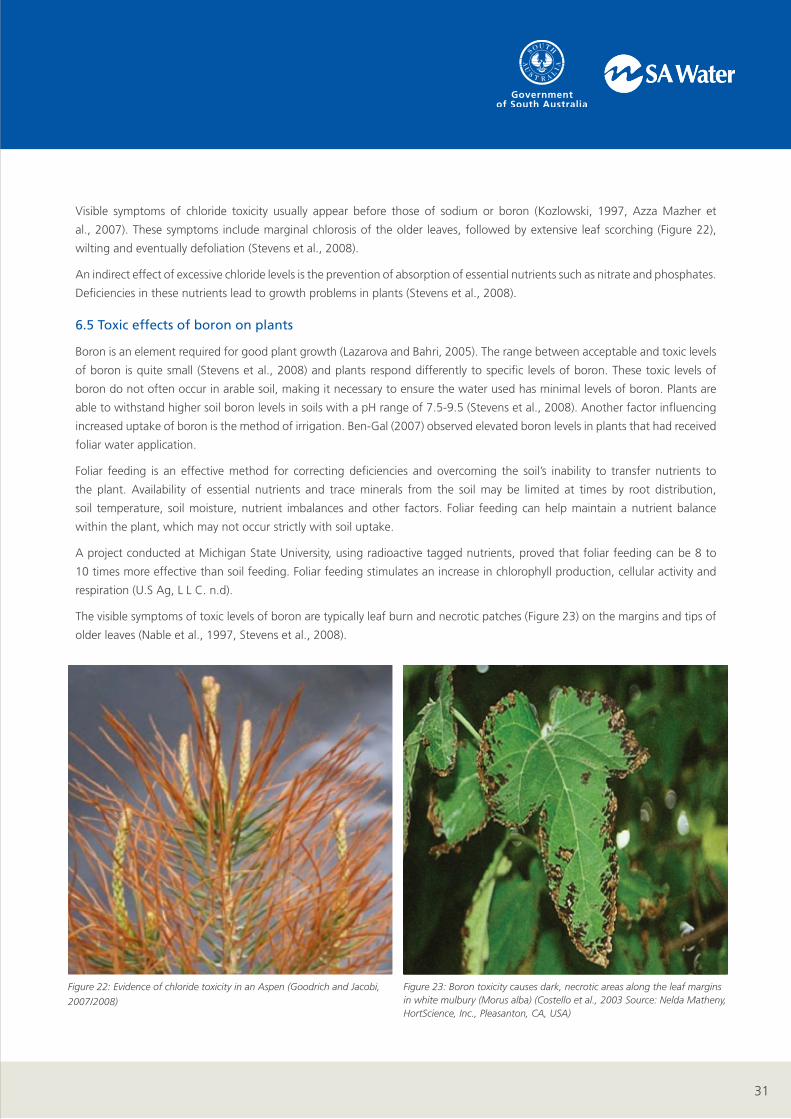
Visible symptoms of chloride toxicity usually appear before those of sodium or boron (Kozlowski, 1997, Azza Mazher et
al., 2007). These symptoms include marginal chlorosis of the older leaves, followed by extensive leaf scorching (Figure 22),
wilting and eventually defoliation (Stevens et al., 2008).
An indirect effect of excessive chloride levels is the prevention of absorption of essential nutrients such as nitrate and phosphates.
Deficiencies in these nutrients lead to growth problems in plants (Stevens et al., 2008).
6.5 Toxic effects of boron on plants
Boron is an element required for good plant growth (Lazarova and Bahri, 2005). The range between acceptable and toxic levels
of boron is quite small (Stevens et al., 2008) and plants respond differently to specific levels of boron. These toxic levels of
boron do not often occur in arable soil, making it necessary to ensure the water used has minimal levels of boron. Plants are
able to withstand higher soil boron levels in soils with a pH range of 7.5-9.5 (Stevens et al., 2008). Another factor influencing
increased uptake of boron is the method of irrigation. Ben-Gal (2007) observed elevated boron levels in plants that had received
foliar water application.
Foliar feeding is an effective method for correcting deficiencies and overcoming the soil’s inability to transfer nutrients to
the plant. Availability of essential nutrients and trace minerals from the soil may be limited at times by root distribution,
soil temperature, soil moisture, nutrient imbalances and other factors. Foliar feeding can help maintain a nutrient balance
within the plant, which may not occur strictly with soil uptake.
A project conducted at Michigan State University, using radioactive tagged nutrients, proved that foliar feeding can be 8 to
10 times more effective than soil feeding. Foliar feeding stimulates an increase in chlorophyll production, cellular activity and
respiration (U.S Ag, L L C. n.d).
The visible symptoms of toxic levels of boron are typically leaf burn and necrotic patches (Figure 23) on the margins and tips of
older leaves (Nable et al., 1997, Stevens et al., 2008).
Figure 22: Evidence of chloride toxicity in an Aspen (Goodrich and Jacobi,
2007/2008)
Figure 23: Boron toxicity causes dark, necrotic areas along the leaf margins in white mulbury (Morus alba) (Costello et al., 2003 Source: Nelda Matheny, HortScience, Inc., Pleasanton, CA, USA)
32
Other less typical symptoms are yield reductions (Stevens et al., 2008) bark necrosis and fruit disorders (Nable et al., 1997).
6.6 Effects of water logging on plants
Water logging has different effects on different plant species. The effects also vary depending on the salinity of the soil and
water surrounding the plant. Kozlowski (1997) explains in great detail multiple physical and physiological effects of water
logging on woody plants. Succinctly put, plant growth, reproduction and photosynthetic capabilities are all adversely affected
by water logging. In addition, plants that have experienced water logging become more prone to drought because of their
shallow and small roots (Kozlowski, 1997).
As Barrett-Lennard (2003) pointed out, the increased water uptake under waterlogged conditions also increases the salt
ion uptake in the plant. These higher concentrations of ions have adverse effects on plant growth and reproduction,
as discussed in the paragraphs above. Yet other plants suffer from leaf or needle dehydration as the stomata are closed
in response to elevated water pressure on the root systems (Lewty, 1990). Water logging also affects plant aeration, root
penetration and root distribution.
Visual evidence of water logging can be leaf tip burn, severe wilting and evidence of mildew. This discussion is evidence of the
range of responses to water logging by different plant species. Once again, it is important to have information specific to the
species found within the Adelaide Park Lands. The soils of most of the Park Lands are drained relatively freely, with the exception
of a few areas where ponding occurs in low depressions and swales during severe storm events (REM and SRHS, 2007).
7. Management measures of salinity
7.1 Characteristics and physiology of salt-tolerant plants
Plants that naturally grow in salty conditions are known as halophytes. This group of plants have physical characteristics that
allow them to thrive in saline conditions. These characteristics manifest themselves in a number of different ways (Seaman, Van
Sengbusch 2003) depending on the genetics and physiology of the species. However, a few generalisations can be made. Most
halophytes are succulents and often have vacuoles (Flowers and Colmer, 2008) or salt glands which are able to store sodium,
isolating it from vital cellular functions (Hannink, 2005). These vacuoles then secrete the salt when it reaches unacceptable
levels within the plant tissue. Leaf succulence allows the plant to store larger volumes of water, in order to dilute the salt
concentrations within the plasma (Van Sengbusch, 2003). Other plants have very efficient root filtering mechanics, preventing
the sodium from entering the vascular system of the plant (Flowers and Colmer, 2008). Examples of efficient root filtering plants
are types of grasses (Van Sengbusch, 2003). One of the essentials required by a salt tolerant plant is the ability to maintain low
cytosolic (fluid component of cytoplasm) sodium concentrations (Seaman, n.d.). In summary, homeostasis, detoxification and
growth control are the three interconnected physiological mechanisms that facilitate salt tolerance in plants (Seaman, n.d.).
Bernstein and Hayward (1958) also suggest that deeper-rooted species as well as those that use water efficiently during dry
periods are more salt tolerant. Succulence is one of the few visible characteristic of salt tolerance, making it difficult to make
suitable plant selections without a full understanding of the preferred habitat of all plant species available.
33
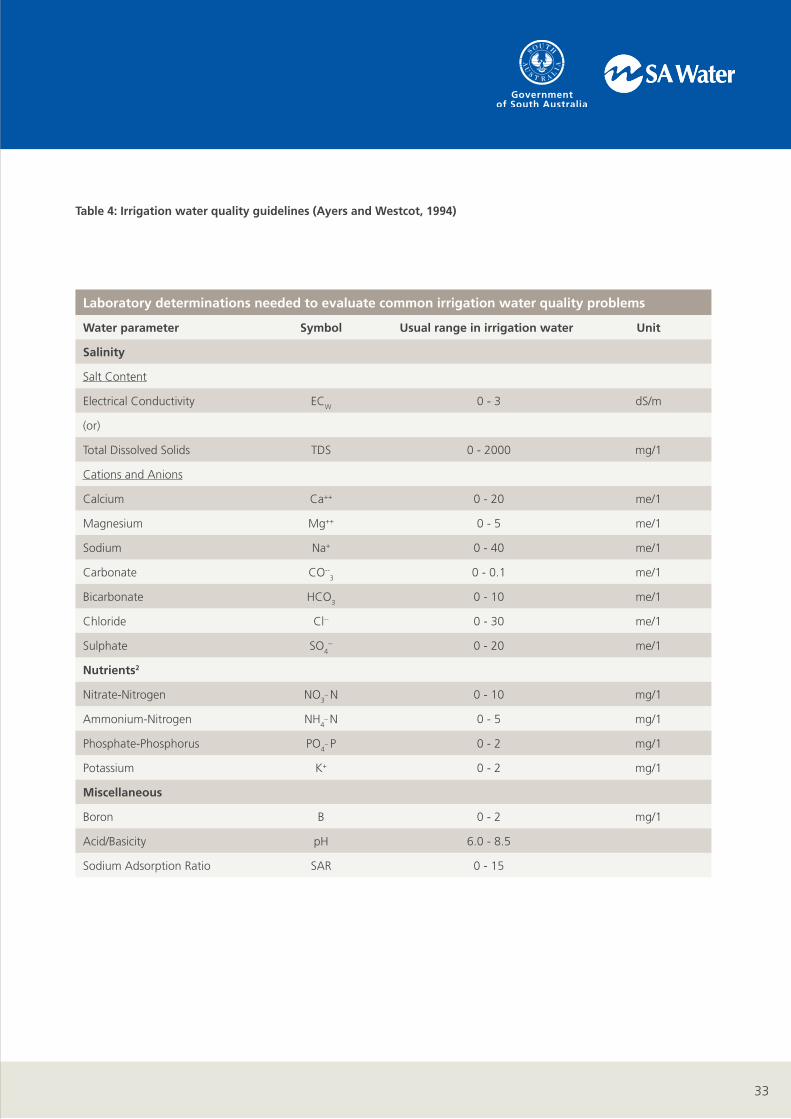
Laboratory determinations needed to evaluate common irrigation water quality problems
Water parameter Symbol Usual range in irrigation water Unit
Salinity
Salt Content
Electrical Conductivity ECW
0 - 3 dS/m
(or)
Total Dissolved Solids TDS 0 - 2000 mg/1
Cations and Anions
Calcium Ca++ 0 - 20 me/1
Magnesium Mg++ 0 - 5 me/1
Sodium Na+ 0 - 40 me/1
Carbonate CO--3
0 - 0.1 me/1
Bicarbonate HCO3
0 - 10 me/1
Chloride Cl-- 0 - 30 me/1
Sulphate SO4
-- 0 - 20 me/1
Nutrients2
Nitrate-Nitrogen NO3
_ N 0 - 10 mg/1
Ammonium-Nitrogen NH4
_ N 0 - 5 mg/1
Phosphate-Phosphorus PO4
_ P 0 - 2 mg/1
Potassium K+ 0 - 2 mg/1
Miscellaneous
Boron B 0 - 2 mg/1
Acid/Basicity pH 6.0 - 8.5
Sodium Adsorption Ratio SAR 0 - 15
Table 4: Irrigation water quality guidelines (Ayers and Westcot, 1994)
34
7.2 Salinity control and management measures
The objective of salinity control is to maintain an acceptable crop yield or plant growth. Several management options are
available for salinity control but in practice a combination may be used to solve the problem. Leaching salts out of the root zone
before they build up to the levels that might affect yields, and maintaining adequate soil-water availability at all times are the
two main solutions to overcome salinity problems. If drainage is adequate, the depth of water required for leaching depends
on the salt sensitivity of the crop and the salinity level of the irrigated water. When salinity is high, the depth of the required
leaching water may be too great, making it necessary to change planting to a more salt tolerant crop. Leaching is a basic step
in production even for water of the best quality and must be practised when necessary to avoid salt accumulation that could
ultimately affect plant growth. Leaching can only be done, however, if the drainage below the crop root zone is sufficient to
prevent a rise in the water table so that it is not a source of salt by itself (Ayers and Westcot, 1994).
Drainage, leaching and changes to more salt tolerant crops are used to avoid the impact of long-term salinity build-up but other
cultural practices may also be needed to deal with possible short-term or temporary increases in salinity which may be equally
detrimental to crop yield and plant growth.
Many agricultural practices such as more frequent irrigation, land grading, timing of fertilization and methods of seeding make
salinity management easier (Ayers and Westcot, 1994). In a few cases, an alternative water supply may be available for periodic
use or can be blended with a poorer water supply to diminish a quality-related hazard. These alternatives, and drainage,
leaching, cropping changes and other agricultural practices, are discussed in more detail in Ayers and Westcot (1994).
In most soils with a shallow water table, water rises into the active root zone by capillarity, and if the water table contains
salts, it becomes a continual source of salts to the root zone as water is used by the plant or evaporates at the soil surface.
The rate of soil salinity accumulation from an uncontrolled shallow water table will depend upon irrigation management, salt
concentration and depth of the groundwater, soil type, and climatic conditions.
In arid and semi-arid climates, a salinity problem caused or complicated by poor drainage cannot be adequately controlled until
the water table is stabilized and maintained at a safe depth, usually at least two metres. This requires open or tile drains or
drainage wells to remove a part of the salty subsurface water and transport it to an acceptable salt-sink for safe disposal. When
drainage is adequate, salinity related directly to water quality and irrigation management becomes a problem only if the salts
applied with the irrigation water are allowed to accumulate to a concentration which reduces yield and plant growth. Effective
salinity control, therefore, must include adequate drainage to control and stabilize the water table and leaching as needed to
reduce the accumulated salts. A net downward flux of surface applied water to achieve the required leaching will then control
the salinity (Ayers and Westcot, 1994). The annual average salt concentration in the Glenelg recycled wastewater is almost
1190-1200 mg/l or 1.8 dS/m. Although the salinity in normal irrigation water is expected to vary up to 3 dS/m, irrigation with
Glenelg recycled wastewater with an irrigation application rate of 4.5ML/year-ha would cause annual accumulation of nearly
9 tonne/ha salts to the soil. In the absence of efficient irrigation management a salinity build up hazard would be problematic
in the long term.
7.3 Salinity control by leaching
When the build-up of soluble salts in the soil is expected to become excessive, the salts can be leached by applying more water than
that needed by the crop during the growing season. This extra water moves at least a portion of the salts below the root zone by
deep percolation. Leaching is the key factor in controlling soluble salts brought in by the irrigation water. Over time, salt removal
by leaching must equal or exceed the salt additions from the applied water or salts will build up and eventually reach damaging
concentrations. The questions that arise are how much water should be used for leaching and when should leaching be applied?
35
To estimate the leaching requirement, both the irrigation water salinity (ECw) and the plant tolerance to soil salinity (ECe) must be
known. The ECe or plant threshold should be estimated from appropriate plant tolerance data. For most agricultural plants the
threshold data is identified but for most of the Park Land plants this has not yet been identified and more research work is needed.
The minimum leaching requirement needed to control salts within the tolerance (threshold level) of any particular plant is
shown in Equation 1:
Where LR is the minimum leaching requirement; ECw is the irrigation water salinity and ECe is the average soil salinity tolerated
by the plant as measured on a soil saturation paste extract.
8. Toxicity problems and management measures
A toxicity problem is different from a salinity problem. It occurs within the plant itself and is not caused by a water shortage.
Toxicity normally results when certain ions are taken up with the soil-water and accumulated in the leaves during water
transpiration to an extent that results in damage to the plant. The degree of damage depends upon time, concentration, crop
sensitivity and crop water use. The usual toxic ions in irrigation water are sodium, chloride, and boron. Damage can be caused
by each, individually or in combination. Toxicity often accompanies or complicates a salinity or infiltration problem although it
may appear even when salinity is low. The toxic ions sodium and chloride can also be absorbed directly into the plant through
the leaves moistened during sprinkler irrigation. This occurs typically during periods of high temperature and low humidity.
The leaf absorption speeds the rate of accumulation of a toxic ion and may be a primary source of the toxicity. Many trace
elements, in addition to sodium, chloride and boron, are toxic to plants at very low concentrations (Ayers and Westcot, 1994).
Absorption and toxicity occur mostly during periods of high temperature and low humidity (< 30 %), frequently aggravated
by windy conditions. Obviously, the most effective method to prevent occurrence of a toxicity problem is to choose irrigation
water that has no potential to develop a toxicity. Irrigation water quality guidelines are shown in Table 4. However, if such
water is not available, or recycled wastewater is to be used for irrigation, there are often management options that can be
adopted to reduce toxicity and improve yields. The potentially toxic ions sodium, chloride and boron can each be reduced by
leaching in a manner similar to that for salinity, but the depth of water required varies with the toxic ion and may in some
cases become excessive. Increasing the leaching or changing crops in an attempt to live with the higher levels of toxic ions may
require extensive changes in the farming system. In cases where the toxicity problem is not too severe, relatively minor changes
in cultural practices can minimize the impact. An alternative water supply may be available to blend with a poorer supply to
lower the hazard from the low quality water (Ayers and Westcot, 1994).
8.1 Sodium toxicity
8.1.1 Characteristics and physiology of sodium-tolerant plants
Literature suggests no standard physiology or set of characteristics for sodium-tolerant plants. However, some features
requiring laboratory analysis can be found in a number of plants that exhibit a tolerance to sodium. Although these
features may be used as the possible suggestion of sodium-tolerance, plant-specific information should be obtained.
Some of these features are described in the following paragraph.
LR = Ecw5ECe - Ecw (1)
36
A higher proportion of root biomass could indicate higher sodium-tolerance in plants (Adrover et al., 2008). Plants exhibiting
sodium tolerance are able to exclude ions at the point of uptake and/or reduce ion translocation to shoot apices (Adrover et
al., 2008). Androver and Forss et al. (2008) cite further examples (T. africana) which have specialised ion excretion mechanisms,
specifically selecting sodium for excretion.
A good indicator of sodium tolerance would be the presence of low sodium content in the plant leaves, in combination with
high potassium content in the roots, stems and leaves (Adrover et al., 2008). Plant species that have high tissue calcium content
in their leaves and stems would also be sodium-tolerant as calcium has been shown to neutralise the deleterious effects of
various salts (Kozlowski, 1997).
8.1.2 Sodium toxicity management
Sodium toxicity is not as easily diagnosed as chloride toxicity, but clear cases of the former have been recorded as a result of
relatively high sodium concentrations in the water (high Na or SAR). Typical toxicity symptoms are leaf burn, scorch and dead
tissue along the outside edges of leaves in contrast to symptoms of chloride toxicity which normally occur initially at the extreme
leaf tip. An extended period of time (many days or weeks) is normally required before accumulation reaches toxic concentrations.
Symptoms appear first on the older leaves, starting at the outer edges and, as the severity increases, move progressively inward
between the veins toward the leaf centre. Sensitive crops include deciduous fruits, nuts, citrus, avocados and beans, but there
are many others. For tree crops, sodium in the leaf tissue in excess of 0.25 to 0.50 % (dry weight basis) is often associated with
sodium toxicity. Leaf tissue analysis is commonly used to confirm or monitor sodium toxicity but a combination of soil, water
and plant tissue analyses greatly increases the probability of a correct diagnosis. When using only leaf blade analysis to diagnose
sodium toxicity, it is advisable to include analyses of leaf blades from damaged trees as well as separate analyses from nearby
undamaged ones for comparative purposes. Sodium toxicity is often modified or reduced if sufficient calcium is available in the
soil. Whether indicated sodium toxicity is a simple one or is more complicated involving a possible calcium deficiency or other
interaction is presently being researched. Preliminary results indicate that for at least a few annual crops, calcium deficiency
rather than sodium toxicity may be occurring. If confirmed, these crops should respond to calcium fertilization using material
such as gypsum or calcium nitrate. Many crops do show sodium toxicity. The toxicity guidelines use SAR as the indicator of the
potential for a sodium toxicity problem which is expected to develop following surface irrigation with a particular quality of water
(Ayers and Westcot, 1994). The average sodium level in the Glenelg recycled wastewater is 261 mg/l and the amount of SAR is 7
(REM and SRHS, 2007). However, the sodium concentration in normal irrigation water is expected to be 0-920 mg/l. This shows
that the sodium concentration in the Glenelg recycled wastewater is considerably below the maximum allowable level. However,
it does not mean that accumulation of this toxic ion in the long term without considerable attention to sustainable irrigation
management would not be a hazard for Adelaide Park Land plants, especially for those that are sensitive to sodium.
8.2 Chloride toxicity
8.2.1 Characteristics and physiology of chloride-tolerant plants
As with sodium-tolerance, there is no specific plant physiology that is typically chloride-tolerant. Rather, a number of
characteristics have been found in plants exhibiting tolerance to chloride. Wu and Chen et al. (1995) gathered experimental
evidence from a number of landscape plants in an attempt to discover differences in chloride tolerance and the reasons for
these differences. Evidence of this testing on various landscape plants, suggests that plants with high concentrations of tissue
calcium exhibit tolerance to chloride. Therefore, chloride-tolerance is positively correlated with tissue calcium percentages (Wu
et al., 1995). The structural and functional integrity of plant and cell membranes depends in large part on the tissue calcium
content of the plant (Wu et al., 1995).
37
Little research has been done on Australian landscape plants and it is important to have knowledge specific to each plant
species, before assuming chloride tolerance.
8.2.2 Chloride toxicity management
The most common toxicity is from chloride in the irrigation water. Chloride is not adsorbed or held back by soils, therefore it
moves readily with the soil-water, is taken up by the crop, moves in the transpiration stream, and accumulates in the leaves.
If the chloride concentration in the leaves exceeds the tolerance of the crop, injury symptoms develop such as leaf burn or
drying of leaf tissue. Normally, plant injury occurs first at the leaf tips (which is common for chloride toxicity), and progresses
from the tip back along the edges as severity increases. Excessive necrosis (dead tissue) is often accompanied by early leaf drop
or defoliation. With sensitive crops, these symptoms occur when leaves accumulate from 0.3 to 1.0 percent chloride on a dry
weight basis. Many tree crops, for example, begin to show injury above 0.3 percent chloride (dry weight).Chemical analysis
of plant tissue is commonly used to confirm a chloride toxicity. For irrigated areas, the chloride uptake depends not only on
the water quality but also on the soil chloride, controlled by the amount of leaching that has taken place and the ability of
the crop to exclude chloride. Crop tolerances to chloride are not nearly so well documented as crop tolerances to salinity. A
chloride toxicity can occur by direct leaf absorption through leaves wet during overhead sprinkler irrigation. This occurs most
frequently with the rotating type sprinkler heads (Ayers and Westcot, 1994). The average chloride level in the Glenelg recycled
wastewater is 339 mg/l (REM and SRHS, 2007). While the chloride concentration in normal irrigation water is expected to
be 0-1065 mg/l. This shows that the chloride concentration in the Glenelg recycled wastewater is considerably below the
maximum allowable level. However, it does not mean that accumulation of this toxic ion in the long term without considerable
attention to sustainable irrigation management would not be a hazard for the Adelaide Park Land plants, especially for those
that are particularly sensitive to chloride.
8.3 Boron toxicity
8.3.1 Characteristics and physiology of boron-tolerant plants
Boron is seldom found in excess in most arable soils. Toxic levels of boron are usually related to soil types associated with low
rainfall areas, amongst which are the dry lands of South Australia (Nable et al., 1997) as well as marine sediment soils (Muntean,
Nable et al., 1997). The difference between required quantities and toxic quantities of boron for plants is very small. As with
sodium and chloride, boron-tolerance is specific to individual species and to the water application method. A few predictors
exist such as higher boron measurements in plant leaves as a result of foliar water application (Ben-Gal, 2007).
Research suggests that boron tolerance is at a genetic and cellular level (Nable et al., 1997). For example, differences in phloem
mobility result in different accumulations of boron in the leaves, fruit and cambial tissue of a plant (Nable et al., 1997). It is
therefore difficult to identify boron-tolerant plants from any physiological attribute.
8.3.2 Boron toxicity management
Boron, unlike sodium, is an essential element for plant growth. Chloride is also essential but in such small quantities that it is
frequently classed non-essential. Boron is needed in relatively small amounts, however, and if present in amounts appreciably
greater than needed, it becomes toxic. For some crops, if 0.2 mg/l boron in water is essential, 1 to 2 mg/l may be toxic. Surface
water rarely contains enough boron to be toxic but well water or springs occasionally contain toxic amounts, especially near
geothermal areas and earthquake faults. Boron problems originating from the water are probably more frequent than those
originating in the soil. Boron toxicity can affect nearly all crops but, like salinity, there is a wide range of tolerance among crops.
Boron toxicity symptoms normally show first on older leaves as a yellowing, spotting, or drying of leaf tissue at the tips and edges.

38
Drying and chlorosis often progresses toward the centre between the veins (interveinal) as more and more boron accumulates with
time. On seriously affected trees, such as almonds and other tree crops which do not show typical leaf symptoms, a gum or exudate
on limbs or trunk is often noticeable. Most crop toxicity symptoms occur after boron concentrations in leaf blades exceed 250–300
mg/kg (dry weight) but not all sensitive crops accumulate boron in leaf blades. For example, stone fruits (peaches, plums, almonds,
etc.), and pome fruits (apples, pears and others) are easily damaged by boron but they do not accumulate sufficient boron in the
leaf tissue for leaf analysis to be a reliable diagnostic test. With these crops, boron excess must be confirmed from soil and water
analyses, tree symptoms and growth characteristics (Ayers and Westcot, 1994). According to Table 4 the allowable level of boron in
the irrigation water is between 0-2 mg/l. The level of boron in the class A Glenelg recycled wastewater is 0.4 mg/l (REM and SRHS,
2007). Boron therefore is not a concern in the Glenelg recycled wastewater at least in the short term.
8.4 Leaching as a practical way to reduce toxic ions
A parallel can be drawn between salinity and toxicity. The toxic ions (chloride, sodium and to a lesser extent boron) are an
appreciable part of the normal salinity accumulation in the root zone and, as with salinity, leaching is the only practical way to
reduce and control these toxic ions in the crop root zone. A toxicity can develop within a few irrigations or within one or more
growing seasons, depending upon the toxic ion concentrations in the irrigation water and the leaching fraction accomplished
(Ayers and Westcot, 1994).
Leaching can be used either to prevent a problem or to correct the problem after it has been recognized from plant
symptoms or damage to the crop. Plant symptoms along with soil, plant and water analyses are very useful for monitoring
for potential toxicity and the adequacy of present leaching practices and crop management. If the toxic ion is coming from
the irrigation water, emphasis should be placed on prevention through adequate leaching. Chloride ions move readily in
the applied irrigation water and make up an important part of water and soil salinity. Chloride can be leached and the
leaching requirement equation is appropriate for calculating the leaching requirement for chloride if the chloride tolerance
(Cle in saturation extract) and the chloride in the irrigation water (Clw) are known. The leaching requirement (LRCl) equation
for chloride then becomes:
Where LRCl = the minimum leaching requirement needed to control chloride with normal surface irrigation method
Clw = Chloride concentration in the applied water in me/l
Cle = Chloride concentration tolerated by plant as determined in the soil saturation extract in me/L.
Sodium ions cause toxicities to sodium sensitive crops (mostly tree crops and woody ornamentals) at a lower SAR value than
would be expected to cause a permeability problem. The sodium ions move less readily with the soil-water than do chlorides.
However, research indicates that high leaching fractions (LF) can be effective to maintain a low soil SAR but for SAR values in the
water in excess of 9, without added amendments, a leaching fraction of 0.30 or greater may be required. Deliberately adding
such large quantities of water in an attempt to control sodium toxicity may not be practical because this may cause problems
with soil aeration and drainage. A preferred solution is to add moderate amounts of gypsum or calcium supplying fertilizer
materials. If leaching plus amendments cannot control the sodium toxicity problem, a change to a more tolerant plant may be
advisable (Ayers and Westcot, 1994).
Boron is much more difficult to leach than are chloride and sodium. Boron moves slowly with the soil-water and requires
about three times as much leaching water as would be needed to reduce an equivalent amount of chloride or salinity. With
CLw5CLe - CLw
LRCl = (2)
39
good irrigation management, it should be possible to reduce and maintain the upper root zone soil at nearly the same boron
concentration as in the applied water.
9. Conclusions and recommendations
9.1 Conclusions
The Adelaide Park Lands can potentially be developed as an example of sustainability by presenting a holistic approach to the
management of the parklands (Pitman, 2006). It has become increasingly important to design and plant parklands and gardens
that do not require extensive irrigation over and above the natural rainfall of the area. Varying rainfall and regular increases and
unpredictability of temperatures require a change in the management strategy in order to adapt successfully to these changes
(Pitman, 2006).
A wide variety of plants are used in the Adelaide Park Lands, each with a specific tolerance for high levels of salinity, sodium,
chloride and boron. This further complicates the task of providing the correct amount of water without causing toxic levels of
any of the abovementioned elements. It is important, therefore, to provide irrigation water that has salt concentrations suitable
to a large number of plant species (Wu et al., 2001).
Using recycled wastewater is a sustainable option for irrigation of the Adelaide Park Lands. It is however important to maintain
a healthy and diverse collection of plants within the parklands in order to achieve one of the goals of creating habitat for native
fauna. To this end, it is important to understand the nutrient requirements and characteristics for each species found within
the Park Lands and to manage their care accordingly. The amount of nutrient loadings using recycled water should be taken
into consideration by monitoring the amount of nutrients that are loaded by recycled water and are taken up by the plants.
Previous reports have developed adaptive management frameworks designed to address the potential impacts of using recycled
wastewater from Glenelg Wastewater Treatment Plant. This book has identified the physiological impacts of toxic levels
of sodium, chloride, boron and salt, on some plants in the Park Lands and outlined the management measures. These sensitivities
have been added to the spreadsheet (Appendix 2) originally complied by REM, SRHS & SE. It is still important to bear in mind that
a lot of this data has been obtained under controlled testing conditions. A plant’s salt tolerance is also variable depending on the
climate, weather, genetic variation, soil health, texture and structure and irrigations methods and frequency (Wu et al., 2001).
Investigations undertaken in this study indicates that the average level of three main plant toxic elements, sodium, chloride and
boron is lower than the maximum allowable level recommended in the guidelines in Water Quality for Agriculture developed by
the Food and Agriculture Organisation of the United Nations (FAO 29) (Ayers and Westcot, 1994) as shown in Table 4.
9.2 Recommendations and research gaps
It would be beneficial to Adelaide Park Lands irrigation with recycled wastewater and upkeep of the parklands to consider the
following strategies::
1. Subsurface drip irrigation and onsite collection and reuse of water are the optimal practices in the parkland area;
2. Plantings should be grouped according to the sensitivities and watering requirements of the selected species (Pitman,
2006);
3. Water requirements of most Park Land plants are not known. Determining different plant water requirements would be
essential to reduce over-irrigation and enhance the optimum plant growth.
4. Determining the mixed plant water requirement is another gap that is important for an efficient management practice
in the Adelaide Park Lands.

40
5. Fertilizer application needs to be reconsidered based on the parkland plant nutrient uptake (required) and nutrient
loading by Glenelg recycled water irrigation.
6. Foliar feeding is an effective method for correcting deficiencies and overcoming the soil’s inability to transfer nutrients
to the plant. This needs to be investigated for some park land plants.
7. Native Australian plants from more arid regions of South Australia should be considered as potential plantings (Pitman,
2006), it is important however, to ensure that there is no risk of these plants becoming invasive.
8. Maintenance of soil moisture should be ensured through mulching (Pitman, 2006) and natural shade provision.
9. If the management plan includes irrigation of all turf grass areas, replacement of the current areas covered by Bentgrass
(Agrostis tenuis) with a more salt tolerant turf grass species such as a mix of Redgrass (Bothriochloa macra) and Wallaby
grass (Austrodanthonia spp.) should be considered. Bothriochloa macra is a summer grass and has moderate tolerance
to salinity and it is highly drought tolerant. Austrodanthonia spp. are winter grasses and several species are moderately
tolerant to salinity.
10. Provision of a more precise irrigation framework for the Adelaide Park Lands, based on the correct grouping of plants,
as mentioned in item 2 of these recommendations, is an approach for optimum irrigation in the Adelaide Park Lands.
41
BibliographyBlaylock, AD (1994), Soil salinity, salt tolerance and growth potential of horticultural and landscape plants, Cooperative extension services,
Department of plant, soil and insect sciences, College of agriculture, University of Wyoming, United States of America.
Casler, MD & Duncan, RR (2003), Turfgrass biology, genetics, and breeding, John Wiley and Sons.
Centre for Groundwater Studies (1997). Towards environmentally sustainable irrigation with effluent Proceedings of the 16th Australian groundwater school Workshop B, , December 1997, Sydney, Australia.
Dunn, GM, Taylor, DW, Nester, MR & Beetson, TB. (1994), Performance of twelve selected Australian tree species on a saline site in southeast Queensland, Forest Ecology and Management, vol. 70, pp. 255-264.
Foulis, L, Meynert, M, Rogers, D, Peker, J, Etherington, K, Jackson, H (2003), The plant book, an encyclopedia of worldwide flora 3800 species in 2100 genera, James Mills-Hicks.
Gori, R, Ferrini, F, Nicese, FP & Lubello, C. (2000). Effect of reclaimed wastewater on the growth and nutrient content of three landscape shrubs, Journal of Environmental Horticulture, vol. 18, no. 2, pp. 108-114.
Johnson, CM, Stout, PR, Broyer, TC & Carlton, AB (1957). Comparative chlorine requirements of different plant species, Plant and Soil, vol. 8, no. 4. pp. 337-353.
Jarwal, S, Boland, AM, Stevens, D & Faggian, R. (2006). Using recycled water in horticulture, Department of Primary Industries, Melbourne, Victoria, Australia.
Kotuby-Amacher, J, Koenig, R & Kitchen, B. (2000). Salinity and Plant Tolerance, Cooperative extension, Utah State University, United States of America.
Lenntech water treatment and purification holding (2009). Toxic chemicals hazard of irrigation water.
Lubello, C, Gori, R, Nicese, FP & Ferrini, F. (2004). Municipal-treated wastewater reuse for plant nurseries irrigation, Water Research, vol. 38, pp. 2939-2947.
Marcum, KB. (2000). Salt tolerance varies in modern creeping bentgrass varieties, Golf Course Management.
Martin, PM. (2004). The potential of native grasses for use as managed turf’, in Proceedings of the 4th International Crop Science Congress.
Muntean, DW (n.d.), ‘Boron, the overlooked essential element’, Soil and Plant Laboratory Inc, Bellevue, WA.
Pessarakli, M. (1999). Handbook of plant and crop stress, CRC Press.
Qian, YL & Mecham, B. (2005). Long-term effects of recycled wastewater irrigation on soil chemical properties on golf course fairways’, Agronomy Journal, reproduced online by the American Society of Agronomy.
Smith, CJ, Hopmans, P & Cook, FJ. (1996). Accumulation of Cr, Pb, Cu, Ni, Zn and Cd in soil following irrigation with treated urban effluent in Australia, Environmental Pollution, vol. 94, no. 3, pp. 317-323.
Szal, GM, Nolan, PM, Kennedy, LE, Barr, CP & Bilger, MD. (1991). The toxicity of chlorinated wastewater: instream and laboratory case studies’, Research Journal of the Water Pollution Control Federation, vol. 63, no. 6, pp. 910-920.
Walker, C & Lin, HS. (2008). Soil property changes after four decades of wastewater irrigation: A landscape perspective, Catena, vol. 73, pp. 63-74.
U.S. Ag, L L C, http://unitedstatesag.org/foliar_feeding.html, viewed 24 March 2011.
Wu, L, Guo, X, Harivandi, A, Water, R & Brown, J. (1998). Study of California native grass and landscape plant species for recycled water irrigation in California landscapes and gardens, Slosson Report 1998-1999.
Wu, L, Guo, X, Hunter, K, Zagory, E, Waters, R & Brown, J. (2000). Studies of salt tolerance of landscape plant species and California native grasses for recycled water irrigation, Slosson Report 2000-2001.
42
ReferencesAYERS, R.S. AND WESTCOT, D.W. (1994). Water Quality for Agriculture, Food and Agriculture Organization of the United Nations, FAO, Paper
No.29, Rome
ADELAIDE ADVANCED TREES NURSERY. n.d. Landscape architects tree guide [Online]. Available: http://www.natives.net.au/docs/docs/AATlandscapeguide09.pdf.
ADROVER, M., FORSS, A., RAMON, G., VADELL, J., MOYA, G. & TABERNER, A. (2008). Selection of woody species for wastewater enhancement and restoration of riparian woodlands. Journal of Environmental Biology, 29, 357-361.
ALLEN, N. & CUNLIFFE, D. (2007). Water recycling in South Australia: Overview from a public health perspective. In: HEALTH, D. O. (ed.). Government of South Australia.
AUSTRALIAN NATIVE PLANT SOCIETY (AUSTRALIA). (2007). Available: http://anpsa.org.au [Accessed 28 January 2011].
AYERS, R. S. & WESTCOT, D. W. (1994). Water Quality for Agriculture, Food and Agriculture Organization of the United Nations. FAO, Paper No.29,. Rome.
AZZA MAZHER, A., FATMA EL-QUESNI, E. & FARAHAT, M. (2007). Responses of ornamental plants and woody trees to salinity. World Journal of Agricultural Sciences, 3, 386-395.
BARRETT-LENNARD, E. (2003). The interaction between waterlogging and salinity in higher plants: causes, consequences and implications. Plant and Soil, 253, 35054.
BEN-GAL, A. (2007). The contribution of foliar exposure to boron toxicity. Journal of Plant Nutrition, 30, 1705-1716.
BERNSTEIN, L. & HAYWARD, H. (1958). Physiology of salt tolerance. Annual Review of Plant Physiology, 9, 25-46.
BOTANIC GARDENS TRUST. Ecology of Cumberland Plain Woodland [Online]. Available: http://www.rbgsyd.nsw.gov.au/science/Evolutionary_Ecology_Research/Ecology_of_Cumberland_Plain_Woodland/woodland_plants/ [Accessed 10 February 2011].
CSIRO. n.d. Water for a Healthy Country [Online]. Available: http://www.anbg.gov.au/cpbr/WfHC/Eucalyptus-camaldulensis/index.html [Accessed 26 January 2011].
DEPARTMENT OF AGRICULTURE AND FOOD (1999). Tolerance of plants to salty water. Farmnote. Government of Western Australia.
DEPARTMENT OF THE ENVIRONMENT AND WATER RESOURCES (2007). Peppermint Box (Eucalyptus odorata) Grassy Woodland of South Australia and Iron-grass Natural Temperate Grassland of South Australia. In: RESOURCES, D. O. T. E. A. W. (ed.). Australian Government.
DEVITT, D., MORRIS, R. & NEUMAN, D. (2003). Impact of water treatment on foliar damage of landscape trees sprinkle irrigated with reuse water. Journal of Environmental Horticulture, 21, 82-88.
DUNN, G. M., TAYLOR, D. W., NESTER, M. R. & BEETSON, T. B. (1994). Performance of twelve selected Australian tree species on a saline site in southeast Queensland. Forest Ecology and Management, 70, 255-264.
FARMER, C. (2002). West highland flora, Agrostis stolonifera [Online]. Available: http://www.plant-identification.co.uk/skye/gramineae/agrostis-stolonifera.htm [Accessed 31 March 2011].
FLORABANK. n.d. Florabank - various plants [Online]. Available: http://www.florabank.org.au/.
FLOWERS, T. & COLMER, T. (2008). Salinity tolerance in halophytes. New Phytologist, 179, 945-963.
GARDENING AUSTRALIA. n.d. Plant Profile:Acacia. Available: http://www.abc.net.au/gardening/stories/s1866599.htm.
GIBBS, J. 2005. Grass identification manual - for everyone: a pictorial guide to recognition of native and exotic grasses in the northern and southern Lofty botanical regions of South Australia, Mawson Lakes, S. A, University of South Australia.
GIRARDET, H. (2003). Creating a sustainable Adelaide. In: DEPARTMENT OF THE PREMIER AND CABINET (ed.). Adelaide: Government of South Australia.
GOODRICH, B. & JACOBI, W. (2007/2008). Magnesium chloride toxicity in Trees. Gardening series: Trees and shrubs.
GOOGLE - IMAGERY. (2011). DigitalGlobe Cnes/Spot Image, GeoEye, TerraMetrics, Map Data 2011, Google, Whereis(R), Sensis Pty Ltd. Available: http://maps.google.com.au [Accessed 22 February 2011].
43
HANDRECK, K. & BLACK, N. (1986). Growing media for ornamental plants and turf, New South Wales University Press.
HANDRECK, K. & BLACK, N. (2002). Salinity: a growing problem. Growing media for ornamental plants and turf. 3rd ed. Sydney: University of NSW Press Ltd.
HANNAWAY, D. B. & LARSON, C. (2004). Creeping Bentgrass (Agrostis stolonifera L.). Available: http://forages.oregonstate.edu/php/fact_sheet_print_grass.php?SpecID=69&use= [Accessed 25th March 2011].
HANNINK, N. (2005). Salt of the earth - how do plants cope? Society of Experimental Biology Bulletin [Online], July 2005. Available: http://www.sebiology.org/publication/Bulletin/July05/salinity.html [Accessed 2 February 2011].
HASSANLI, A. M., AHMADIRAD, S. & BEECHAM, S. (2010). Evaluation of the influence of irrigation methods and water quality on sugar beet yield and water use ffficiency. Agricultural Water Management, 97, 357-396.
HASSANLI, A. M., AHMADIRAD, S., MAFTOON, M. & MASOUDI, M. (2007). The effect of municipal effluent using pressure and surface irrigation methods on selected soil chemical poroperties in an aid rgion. Journal of Agrochimica, 51, 329-337.
HASSANLI, A. M., EBRAHIMIZADEH, M. A. & BEECHAM, S. (2009). The effects of irrigation methods with effluent and irrigation scheduling on water use efficiency and corn yields in an arid region. Agricultural Water Management, 96, 93-99.
HASSANLI, A. M. & JAVAN, M. (2005). Evaluation of municipal effluent quality as an appropriate alternative for green space development and mitigating the environmental effects, Tehran University. Journal of Environment, 38 (in Persian).
HASSANLI, A. M., JAVAN, M. & SAADAT, Y. (2008). Reuse of municipal effluent with drip irrigation and evaluation the effect on soil properties in a semi arid area. Journal of Environmental Monitoring and Assessement, 144, 151-158, DOI 10.1007/s 10661-007-9953-2.
HOLIDAY, I. (2005). A Field Guide to Australian Trees, Sydney, Reed New Holland.
KOZLOWSKI, T. T. (1997). Responses of woody plants to flooding and salinity, Tree Physiology Monograph No. 1, Heron Publishing, Victoria, Canada.
LAMP, C. (1990). Grasses of temperate Australia: a field guide, Melbourne, Inkata Press.
LAS PILITAS NURSERY n.d. Effect of salinity on leaves.
LAURENSON, S., KUNHIKRISHNAN, A., BOLAN, N., NAIDU, R., MCKAY, J. & KEREMANE, G. (2010). Management of recycled water for sustainable production and environmental protection: A case study with Northern Adelaide Plains recycling scheme. International Journal of Environmental Science and Development, 1, 176-180.
LAZAROVA, V. & BAHRI, A. (2005). Water reuse for irrigation: agriculture, landscapes and turf grass, Florida, CRC Press.
LEWTY, M. (1990). Effects of waterlogging on the growth and water relations of three Pinus taxa. Forest Ecology and Management, 30, 189-201.
LONG, M. (2003). A biodiversity survey of the Adelaide Park Lands South Australia, Adelaide, Adelaide City Council.
MANITOBA AGRICULTURE FOOD AND RURAL INITIATIVES n.d.
MOORE, G., SANFORD, P & WILEY (2006). Perennial pastures for Western Australia, Couch grass (Cynodon dactylon). Department of Agriculture and Food Western Australia, Bulletin 4690, Perth.
MUNTEAN, D. Boron, the overlooked essential element. Bellevue: Soil and Plant Laboratory Inc.
MURRAY, L. (2007). Under Umbrellas. Australian plants online [Online]. Available: http://anpsa.org.au/APOL2007/aug07-2.html.
NABLE, R., BAÑUELOS, B. & PAULL, J. (1997). Boron Toxicity. Plant and Soil, 193, 181-198.
NEYLAN, J. Australian turf grass management.
NEYLAN, J. (2005). Australian turf grass management. AGCSATech. 2005 ed.: Australian Turfgrass Management.
NIKNAM, S. R. & MCCOMB, J. (2000). Salt tolerance screening of selected Australian woody species -- a review. Forest Ecology and Management, 139, 1-19.
NIU, G. & RODRIGUEZ, D. (2006). Relative salt tolerance of selected herbaceous perennials and groundcovers. Scientia Horticulturae, 110, 352-358.
44
PEDRERO, F., KALAVROUZIOTIS, I., ALARCÓN, J., KOUKOULAKIS, P. & ASANO, T. (2010). Use of treated municipal wastewater in irrigated agriculture—Review of some practices in Spain and Greece. Agricultural Water Management, 97, 1233-1241.
PIRSA n.d. Evidence of sodium toxicity on a grape vine. Government of South Australia.
PITMAN, S. Sustainable landscapes: working with our semi-arid land in changing times. The Adelaide Parklands Symposium. A balancing act: past-present-futre, 2006 University of South Australia, Adelaide.
PLANTNET. FloraOnline [Online]. Available: http://www.plantnet.rbgsyd.nsw.gov.au 2011].
REM & SRHS (2007). Environmental assessment of potential reuse of treated wastewater from the Glenelg WWTP within the Adelaide park lands.
REM, SRHS & SE (2008). An adaptive management framework for the reuse of treated wastewater from the Glenelg WWTP within the Adelaide Park Lands.
SALGOT, M., HUERTASA, E., WEBERB, S., DOTTB, W. & HOLLENDERB, J. (2006). Wastewater reuse and risk: definition of key objectives. Desalination, 187, 29-40.
SALTDECK SERIES (2006). Windmill Grass Chloris truncata. AWI &CRC Salinity.
SEAMAN, J. n.d. Mechanisms of salt tolerance in halophytes: can crop plants’ resistance to salintity be improved?, University of Sheffield.
SOUTH AUSTRALIAN WATER CORPORATION (2009). Annual Report. Government of South Australia.
SOUTH EAST REGIONAL CENTRE FOR URBAN LANDCARE n.d. Bush Tucker plants for your garden. Perth: South Eastern Regional Centre for Urban Landcare.
STEVENS, D. (2006). Growing crops with reclaimed wastewater. CSIRO Publishing.
STEVENS, D., SMOLENAARS, S. & KELLY, J. (2008). Irrigation of amenity horticulture with recycled water.
SUN, D. & DICKINSON, G. (1993). Responses to salt stress of 16 Eucalyptus species, Grevillea robusta, Lophostemon confertus and Pinus caribea var. hondurensis. Forest Ecology and Management, 60, 1-14.
VAN DER MOEZEL, P. G., PEARCE-PINTO, G. V. N. & BELL, D. T. (1991). Screening for salt and waterlogging tolerance in Eucalyptus and Melaleuca species. Forest Ecology and Management, 40, 27-37.
VAN SENGBUSCH, P. (2003). Characteristics of habitats and vegetation - halophytes [Online]. Hamburg: University of Hamburg. Available: http://www.biologie.uni-hamburg.de/b-online/e56/56d.htm [Accessed 3 February 2011].
VICTORIAN FLORA. Victorian Flora [Online]. Available: http://www.victorianflora.com/Victorian-Flora/Plants/ [Accessed 13 February 2011].
WILLIAMS, M. (1966). The parkland towns of Australia and New Zealand, New York, American Geographical Society.
WU, L., CHEN, J., LIN, H., VAN MANTGEM, P., HARIVANDIS, M. & HARDING, J. A. (1995). Effects of regenerant wastewater irrigation on growth and ion uptake of landscape plants. Journal of Environmental Horticulture, 13, 92-96.
WU, L., GUO, X. & HARIVANDI, M. (2001). Salt tolerance and salt accumulation of landscape plants irrigated by sprinkler and drip irrigation systems. Journal of Plant Nutrition, 24, 1473-1490.
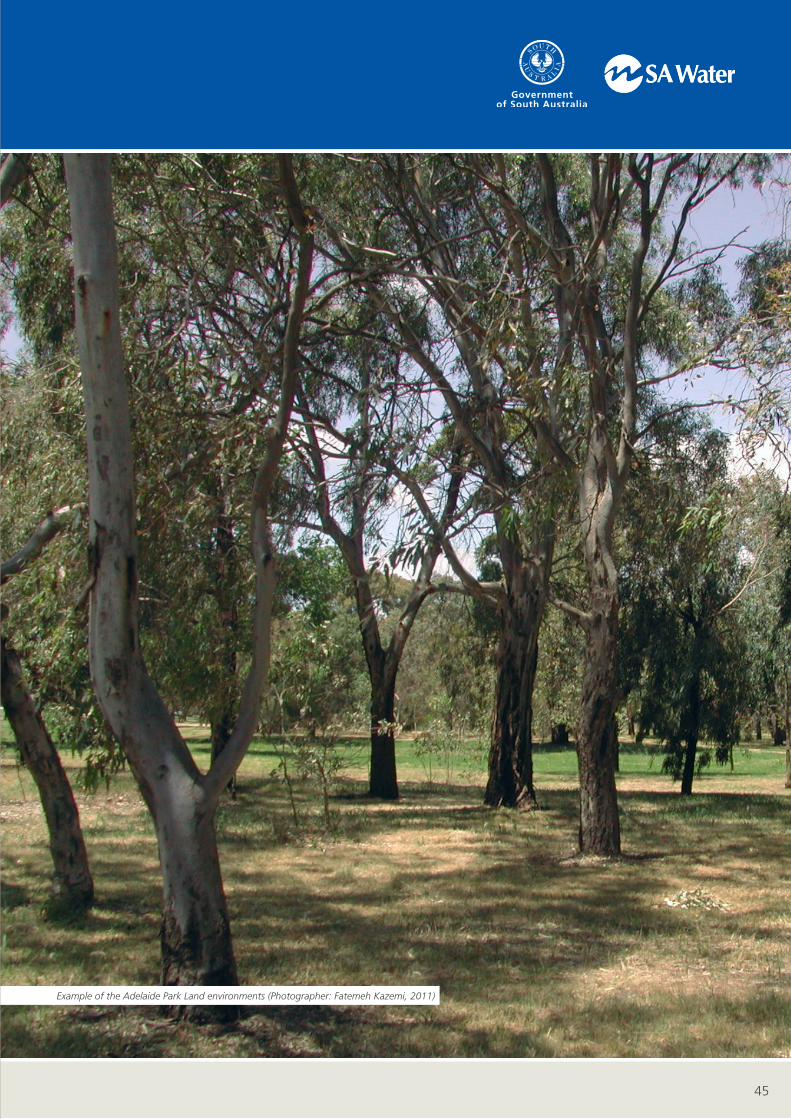
45
Example of the Adelaide Park Land environments (Photographer: Fatemeh Kazemi, 2011)
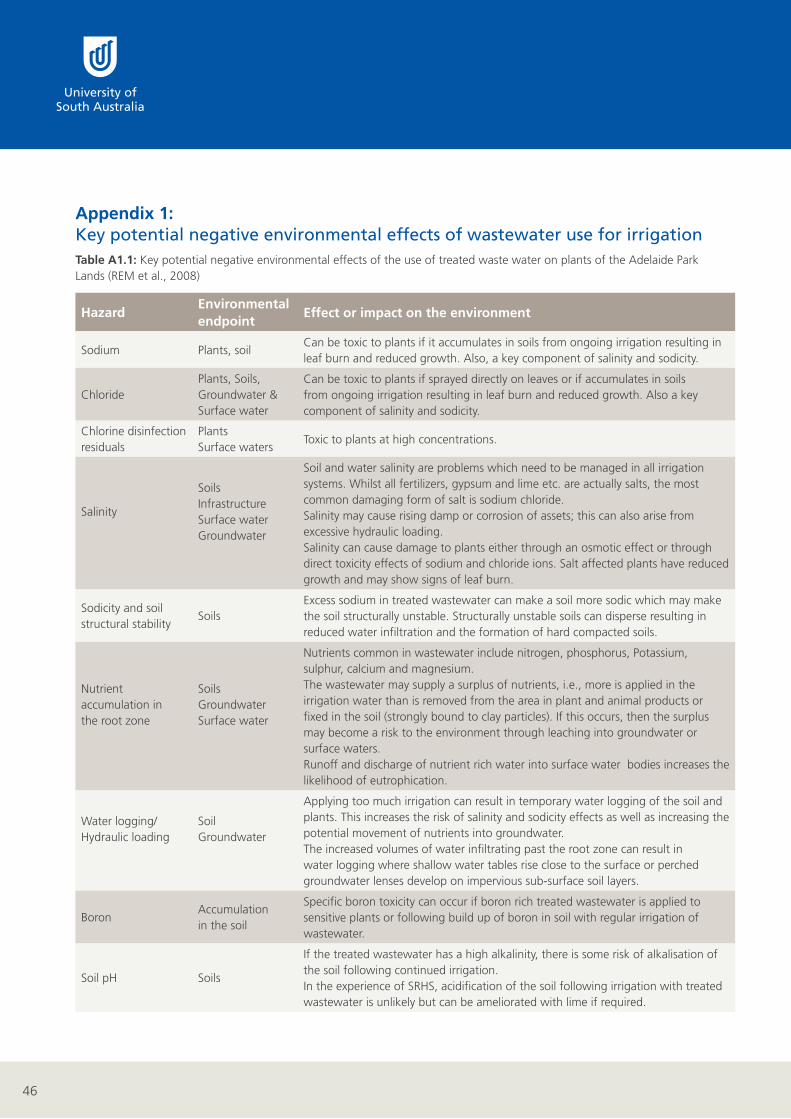
46
Appendix 1: Key potential negative environmental effects of wastewater use for irrigationTable A1.1: Key potential negative environmental effects of the use of treated waste water on plants of the Adelaide Park Lands (REM et al., 2008)
HazardEnvironmental endpoint
Effect or impact on the environment
Sodium Plants, soilCan be toxic to plants if it accumulates in soils from ongoing irrigation resulting in leaf burn and reduced growth. Also, a key component of salinity and sodicity.
ChloridePlants, Soils, Groundwater & Surface water
Can be toxic to plants if sprayed directly on leaves or if accumulates in soils from ongoing irrigation resulting in leaf burn and reduced growth. Also a key component of salinity and sodicity.
Chlorine disinfection residuals
Plants Surface waters
Toxic to plants at high concentrations.
Salinity
Soils Infrastructure Surface water Groundwater
Soil and water salinity are problems which need to be managed in all irrigation systems. Whilst all fertilizers, gypsum and lime etc. are actually salts, the most common damaging form of salt is sodium chloride. Salinity may cause rising damp or corrosion of assets; this can also arise from excessive hydraulic loading. Salinity can cause damage to plants either through an osmotic effect or through direct toxicity effects of sodium and chloride ions. Salt affected plants have reduced growth and may show signs of leaf burn.
Sodicity and soil structural stability
SoilsExcess sodium in treated wastewater can make a soil more sodic which may make the soil structurally unstable. Structurally unstable soils can disperse resulting in reduced water infiltration and the formation of hard compacted soils.
Nutrient accumulation in the root zone
Soils Groundwater Surface water
Nutrients common in wastewater include nitrogen, phosphorus, Potassium, sulphur, calcium and magnesium. The wastewater may supply a surplus of nutrients, i.e., more is applied in the irrigation water than is removed from the area in plant and animal products or fixed in the soil (strongly bound to clay particles). If this occurs, then the surplus may become a risk to the environment through leaching into groundwater or surface waters. Runoff and discharge of nutrient rich water into surface water bodies increases the likelihood of eutrophication.
Water logging/ Hydraulic loading
Soil Groundwater
Applying too much irrigation can result in temporary water logging of the soil and plants. This increases the risk of salinity and sodicity effects as well as increasing the potential movement of nutrients into groundwater. The increased volumes of water infiltrating past the root zone can result in water logging where shallow water tables rise close to the surface or perched groundwater lenses develop on impervious sub-surface soil layers.
Boron Accumulation in the soil
Specific boron toxicity can occur if boron rich treated wastewater is applied to sensitive plants or following build up of boron in soil with regular irrigation of wastewater.
Soil pH Soils
If the treated wastewater has a high alkalinity, there is some risk of alkalisation of the soil following continued irrigation. In the experience of SRHS, acidification of the soil following irrigation with treated wastewater is unlikely but can be ameliorated with lime if required.
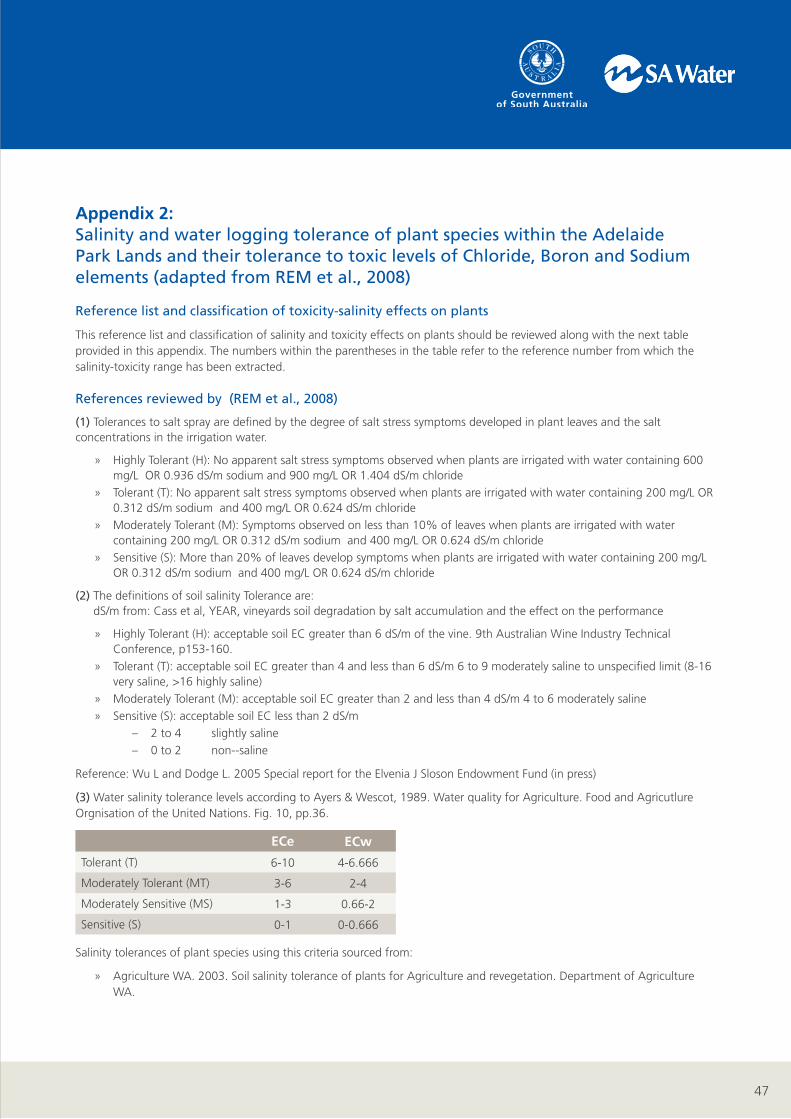
47
Appendix 2: Salinity and water logging tolerance of plant species within the Adelaide Park Lands and their tolerance to toxic levels of Chloride, Boron and Sodium elements (adapted from REM et al., 2008)
Reference list and classification of toxicity-salinity effects on plants
This reference list and classification of salinity and toxicity effects on plants should be reviewed along with the next table provided in this appendix. The numbers within the parentheses in the table refer to the reference number from which the salinity-toxicity range has been extracted.
References reviewed by (REM et al., 2008)
(1) Tolerances to salt spray are defined by the degree of salt stress symptoms developed in plant leaves and the salt concentrations in the irrigation water.
» Highly Tolerant (H): No apparent salt stress symptoms observed when plants are irrigated with water containing 600 mg/L OR 0.936 dS/m sodium and 900 mg/L OR 1.404 dS/m chloride
» Tolerant (T): No apparent salt stress symptoms observed when plants are irrigated with water containing 200 mg/L OR 0.312 dS/m sodium and 400 mg/L OR 0.624 dS/m chloride
» Moderately Tolerant (M): Symptoms observed on less than 10% of leaves when plants are irrigated with water containing 200 mg/L OR 0.312 dS/m sodium and 400 mg/L OR 0.624 dS/m chloride
» Sensitive (S): More than 20% of leaves develop symptoms when plants are irrigated with water containing 200 mg/L OR 0.312 dS/m sodium and 400 mg/L OR 0.624 dS/m chloride
(2) The definitions of soil salinity Tolerance are: dS/m from: Cass et al, YEAR, vineyards soil degradation by salt accumulation and the effect on the performance
» Highly Tolerant (H): acceptable soil EC greater than 6 dS/m of the vine. 9th Australian Wine Industry Technical Conference, p153-160.
» Tolerant (T): acceptable soil EC greater than 4 and less than 6 dS/m 6 to 9 moderately saline to unspecified limit (8-16 very saline, >16 highly saline)
» Moderately Tolerant (M): acceptable soil EC greater than 2 and less than 4 dS/m 4 to 6 moderately saline
» Sensitive (S): acceptable soil EC less than 2 dS/m
– 2 to 4 slightly saline
– 0 to 2 non--saline
Reference: Wu L and Dodge L. 2005 Special report for the Elvenia J Sloson Endowment Fund (in press)
(3) Water salinity tolerance levels according to Ayers & Wescot, 1989. Water quality for Agriculture. Food and Agricutlure Orgnisation of the United Nations. Fig. 10, pp.36.
ECe ECw
Tolerant (T) 6-10 4-6.666
Moderately Tolerant (MT) 3-6 2-4
Moderately Sensitive (MS) 1-3 0.66-2
Sensitive (S) 0-1 0-0.666
Salinity tolerances of plant species using this criteria sourced from:
» Agriculture WA. 2003. Soil salinity tolerance of plants for Agriculture and revegetation. Department of Agriculture WA.
48
» Anon. 2006. Australian Guidelines for Water Recycling: Managing Health and Environmental Risks (Phase 1). National Water Quality Management Strategy Document No. 21.
» Bonney, N. 2004. Common plants of the Coorong Region. Australian Plants Society (SA Region) Inc.
» Bulman, P. 1995. Farmtree$ for the Mt Lofty Ranges: A regional Agroforestry Handbook. PIRSA
» Elliot, R. 2003. Australian Plants for Mediterranean climate gardens. Rosenburg Publishing Pty Ltd.
» Marcar, N.E. and Crawford, D.F. 1995. Trees for salt land: a guide to selecting native species for Australia. CSIRO publishing
» Pettygrove, S. & Asano, T. 1985. Irrigation with reclaimed municipal wastewater = a guidence manual. Lewis publishers Inc.
» Wrigley & Fagg. 1983. Australian Native Plants 2nd Ed. Collins Press.
(3a) Soil Salinity tolerance from selected references listed above; Anon 2006, Agriculture WA, 2003; units mS/m
(4) Soil salinity tolerance levels according to Handreck, K. and Black, N. 1984. Growing media for ornamental plants and turf. NSW University Press.
» Very tolerant (VT): ECse of medium between 8 and 13dS/m
» Tolerant (T): ECse of medium between 5-6 and 8dS/m
» Moderately tolerant (MT): ECse of medium between 3-4 and 5-6dS/m
» Sensitive (S): ECse of medium between 1.8 and 3-4dS/m
» Very Sensitive (VS): ECse of medium below 1.8dS/m
(5) Suitability of plants for different sites according to Boomsma, C.D. 1983. Tree Planting Guide for South Australia. Woods and Forests Department, South Australia.
Wa = Plants for waterlogged sites Ss = Plants for swampy and salty sites Ds = Plants for dry, salty sites
According to Brief, the average salinity of the Class B effluent water is 1178mg/L OR 1.84dS/m. As such, this water would only be suitable for irrigating moderately tolerant ot tolerant plant species.
References reviewed in this report (Hassanli, Kazemi, 2011)
(6) Department of Agriculture (2005) Soil salinity tolerance of plants for agriculture and revegetation: moderately saline sites, Western Australia.
(7) Miyamoto, S, et al., Landscape Plant Lists for Salt Tolerance Assessment. 2004, Texas Agricultural Experimental Station.
» Sensitive: S (< 1 dS/m, Na and Cl < 150 ppm OR < 0.234 dS/m),
» Moderately sensitive: MS (1 – 2 dS/m, Na < 280 ppm OR < 0.4368 dS/m, Cl < 360 ppm OR < 0.5616 dS/m),
» Moderately tolerant: MT (2 – 3 dS/m, Na < 425 ppm OR < 0.663 dS/m, Cl < 590 ppm OR < 0.9204 dS/m),
» Tolerant: T (> 3 dS/m).
(8) Blaylock, AD (1994). Soil Salinity, Salt Tolerance, and Growth Potential of Horticultural and Landscape Plants, Department of Plant, Soil and Insect Sciences, College of Agriculture, University of Wyoming.
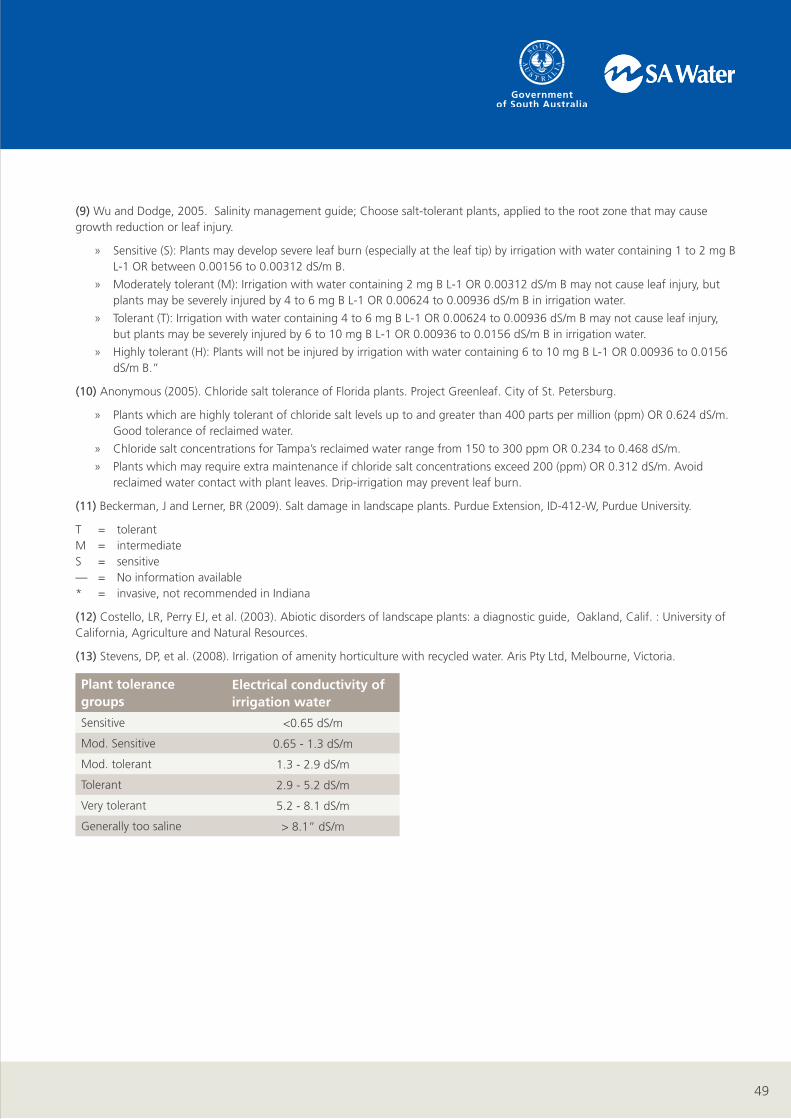
49
(9) Wu and Dodge, 2005. Salinity management guide; Choose salt-tolerant plants, applied to the root zone that may cause growth reduction or leaf injury.
» Sensitive (S): Plants may develop severe leaf burn (especially at the leaf tip) by irrigation with water containing 1 to 2 mg B L-1 OR between 0.00156 to 0.00312 dS/m B.
» Moderately tolerant (M): Irrigation with water containing 2 mg B L-1 OR 0.00312 dS/m B may not cause leaf injury, but plants may be severely injured by 4 to 6 mg B L-1 OR 0.00624 to 0.00936 dS/m B in irrigation water.
» Tolerant (T): Irrigation with water containing 4 to 6 mg B L-1 OR 0.00624 to 0.00936 dS/m B may not cause leaf injury, but plants may be severely injured by 6 to 10 mg B L-1 OR 0.00936 to 0.0156 dS/m B in irrigation water.
» Highly tolerant (H): Plants will not be injured by irrigation with water containing 6 to 10 mg B L-1 OR 0.00936 to 0.0156 dS/m B.”
(10) Anonymous (2005). Chloride salt tolerance of Florida plants. Project Greenleaf. City of St. Petersburg.
» Plants which are highly tolerant of chloride salt levels up to and greater than 400 parts per million (ppm) OR 0.624 dS/m. Good tolerance of reclaimed water.
» Chloride salt concentrations for Tampa’s reclaimed water range from 150 to 300 ppm OR 0.234 to 0.468 dS/m.
» Plants which may require extra maintenance if chloride salt concentrations exceed 200 (ppm) OR 0.312 dS/m. Avoid reclaimed water contact with plant leaves. Drip-irrigation may prevent leaf burn.
(11) Beckerman, J and Lerner, BR (2009). Salt damage in landscape plants. Purdue Extension, ID-412-W, Purdue University.
T = tolerant M = intermediate S = sensitive — = No information available * = invasive, not recommended in Indiana
(12) Costello, LR, Perry EJ, et al. (2003). Abiotic disorders of landscape plants: a diagnostic guide, Oakland, Calif. : University of California, Agriculture and Natural Resources.
(13) Stevens, DP, et al. (2008). Irrigation of amenity horticulture with recycled water. Aris Pty Ltd, Melbourne, Victoria.
Plant tolerance groups
Electrical conductivity of irrigation water
Sensitive <0.65 dS/m
Mod. Sensitive 0.65 - 1.3 dS/m
Mod. tolerant 1.3 - 2.9 dS/m
Tolerant 2.9 - 5.2 dS/m
Very tolerant 5.2 - 8.1 dS/m
Generally too saline > 8.1” dS/m
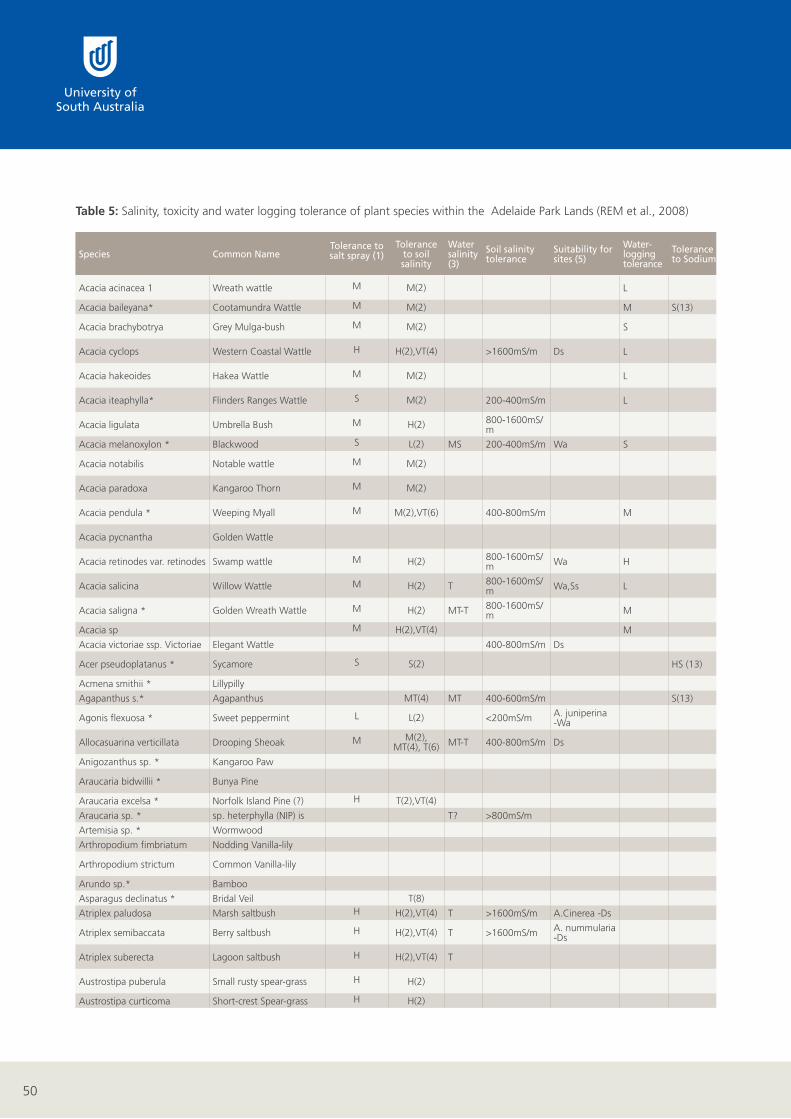
50
Species Common Name Tolerance to salt spray (1)
Tolerance to soil salinity
Water salinity (3)
Soil salinity tolerance
Suitability for sites (5)
Water-logging tolerance
Tolerance to Sodium
Tolerance to Chloride
Tolerance to Boron
Park Number
1 2 3 4 5 6 7 8 9 10 11 12 13 14 15 16 17 18 19 20 21 22 23 24 25 26 27 21w
Acacia acinacea 1 Wreath wattle M M(2) L X
X X X X X X
Acacia baileyana* Cootamundra Wattle M M(2) M S(13) S(13) X
Acacia brachybotrya Grey Mulga-bush M M(2) S X X
Acacia cyclops Western Coastal Wattle H H(2),VT(4) >1600mS/m Ds L X
Acacia hakeoides Hakea Wattle M M(2) L X
Acacia iteaphylla* Flinders Ranges Wattle S M(2) 200-400mS/m L X
X X X X X X X X X X
Acacia ligulata Umbrella Bush M H(2) 800-1600mS/m
X X
X X X X X X
Acacia melanoxylon * Blackwood S L(2) MS 200-400mS/m Wa S M (12) X X
Acacia notabilis Notable wattle M M(2) X
Acacia paradoxa Kangaroo Thorn M M(2) X
X X X X
Acacia pendula * Weeping Myall M M(2),VT(6) 400-800mS/m M X X X X X X X
Acacia pycnantha Golden Wattle X
X
X
X
X X X X X X X X
Acacia retinodes var. retinodes Swamp wattle M H(2) 800-1600mS/m Wa H X X
Acacia salicina Willow Wattle M H(2) T 800-1600mS/m Wa,Ss L X
Acacia saligna * Golden Wreath Wattle M H(2) MT-T 800-1600mS/m M
X X
X X X X X X X X
Acacia sp M H(2),VT(4) M X X
Acacia victoriae ssp. Victoriae Elegant Wattle 400-800mS/m Ds X X
Acer pseudoplatanus * Sycamore S S(2) HS (13) HS (13) S (11) X
X X X
Acmena smithii * Lillypilly X X
Agapanthus s.* Agapanthus MT(4) MT 400-600mS/m S(13) S(13) X X X
Agonis flexuosa * Sweet peppermint L L(2) <200mS/m A. juniperina -Wa
X X X
Allocasuarina verticillata Drooping Sheoak M M(2), MT(4), T(6) MT-T 400-800mS/m Ds
X X X X X X X X X X X
Anigozanthus sp. * Kangaroo Paw X
Araucaria bidwillii * Bunya Pine X X
Araucaria excelsa * Norfolk Island Pine (?) H T(2),VT(4) HT (5) X X
Araucaria sp. * sp. heterphylla (NIP) is T? >800mS/m X X X X
Artemisia sp. * Wormwood X
Arthropodium fimbriatum Nodding Vanilla-lily X X
Arthropodium strictum Common Vanilla-lily X X X
Arundo sp.* Bamboo X
Asparagus declinatus * Bridal Veil T(8) X
Atriplex paludosa Marsh saltbush H H(2),VT(4) T >1600mS/m A.Cinerea -Ds X
Atriplex semibaccata Berry saltbush H H(2),VT(4) T >1600mS/m A. nummularia -Ds
X X X X X X X X
Atriplex suberecta Lagoon saltbush H H(2),VT(4) T X X
Austrostipa puberula Small rusty spear-grass H H(2) X
Austrostipa curticoma Short-crest Spear-grass H H(2) X X
Table 5: Salinity, toxicity and water logging tolerance of plant species within the Adelaide Park Lands (REM et al., 2008)

51
Species Common Name Tolerance to salt spray (1)
Tolerance to soil salinity
Water salinity (3)
Soil salinity tolerance
Suitability for sites (5)
Water-logging tolerance
Tolerance to Sodium
Tolerance to Chloride
Tolerance to Boron
Park Number
1 2 3 4 5 6 7 8 9 10 11 12 13 14 15 16 17 18 19 20 21 22 23 24 25 26 27 21w
Acacia acinacea 1 Wreath wattle M M(2) L X
X X X X X X
Acacia baileyana* Cootamundra Wattle M M(2) M S(13) S(13) X
Acacia brachybotrya Grey Mulga-bush M M(2) S X X
Acacia cyclops Western Coastal Wattle H H(2),VT(4) >1600mS/m Ds L X
Acacia hakeoides Hakea Wattle M M(2) L X
Acacia iteaphylla* Flinders Ranges Wattle S M(2) 200-400mS/m L X
X X X X X X X X X X
Acacia ligulata Umbrella Bush M H(2) 800-1600mS/m
X X
X X X X X X
Acacia melanoxylon * Blackwood S L(2) MS 200-400mS/m Wa S M (12) X X
Acacia notabilis Notable wattle M M(2) X
Acacia paradoxa Kangaroo Thorn M M(2) X
X X X X
Acacia pendula * Weeping Myall M M(2),VT(6) 400-800mS/m M X X X X X X X
Acacia pycnantha Golden Wattle X
X
X
X
X X X X X X X X
Acacia retinodes var. retinodes Swamp wattle M H(2) 800-1600mS/m Wa H X X
Acacia salicina Willow Wattle M H(2) T 800-1600mS/m Wa,Ss L X
Acacia saligna * Golden Wreath Wattle M H(2) MT-T 800-1600mS/m M
X X
X X X X X X X X
Acacia sp M H(2),VT(4) M X X
Acacia victoriae ssp. Victoriae Elegant Wattle 400-800mS/m Ds X X
Acer pseudoplatanus * Sycamore S S(2) HS (13) HS (13) S (11) X
X X X
Acmena smithii * Lillypilly X X
Agapanthus s.* Agapanthus MT(4) MT 400-600mS/m S(13) S(13) X X X
Agonis flexuosa * Sweet peppermint L L(2) <200mS/m A. juniperina -Wa
X X X
Allocasuarina verticillata Drooping Sheoak M M(2), MT(4), T(6) MT-T 400-800mS/m Ds
X X X X X X X X X X X
Anigozanthus sp. * Kangaroo Paw X
Araucaria bidwillii * Bunya Pine X X
Araucaria excelsa * Norfolk Island Pine (?) H T(2),VT(4) HT (5) X X
Araucaria sp. * sp. heterphylla (NIP) is T? >800mS/m X X X X
Artemisia sp. * Wormwood X
Arthropodium fimbriatum Nodding Vanilla-lily X X
Arthropodium strictum Common Vanilla-lily X X X
Arundo sp.* Bamboo X
Asparagus declinatus * Bridal Veil T(8) X
Atriplex paludosa Marsh saltbush H H(2),VT(4) T >1600mS/m A.Cinerea -Ds X
Atriplex semibaccata Berry saltbush H H(2),VT(4) T >1600mS/m A. nummularia -Ds
X X X X X X X X
Atriplex suberecta Lagoon saltbush H H(2),VT(4) T X X
Austrostipa puberula Small rusty spear-grass H H(2) X
Austrostipa curticoma Short-crest Spear-grass H H(2) X X
Table 5: Salinity, toxicity and water logging tolerance of plant species within the Adelaide Park Lands (REM et al., 2008) Table 5: Salinity, toxicity and water logging tolerance of plant species within the Adelaide Park Lands (REM et al., 2008) cont’d
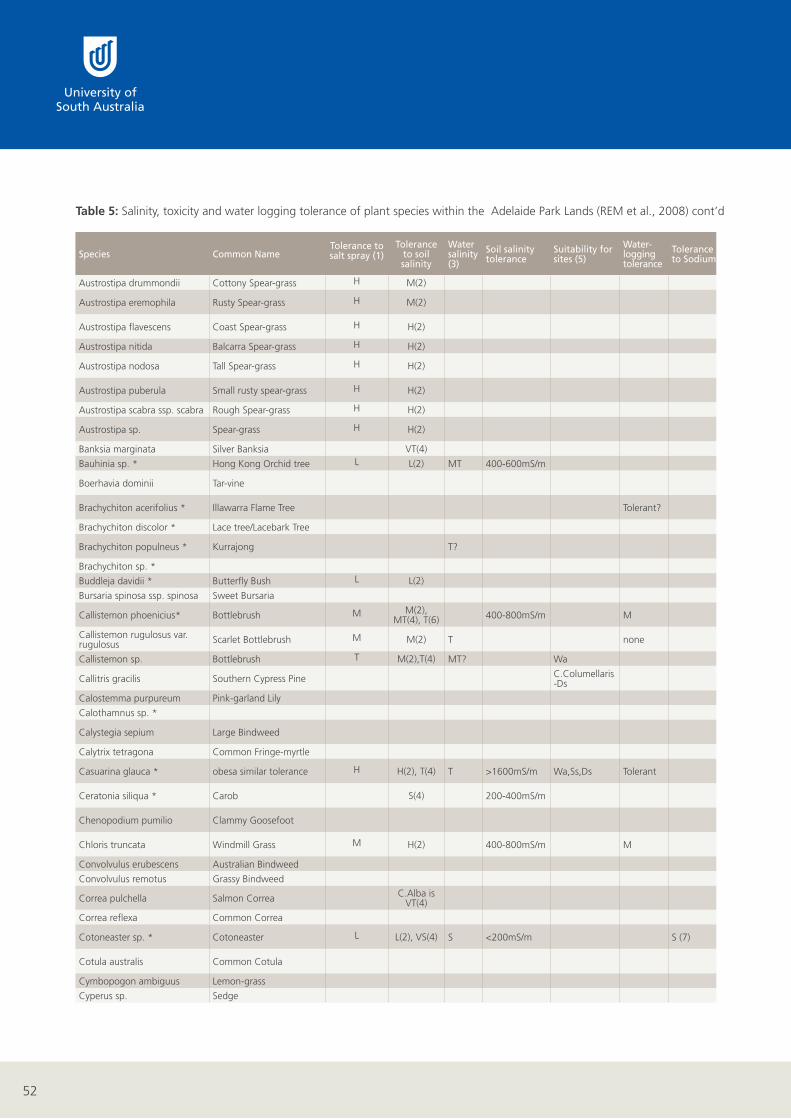
52
Table 5: Salinity, toxicity and water logging tolerance of plant species within the Adelaide Park Lands (REM et al., 2008) cont’d
Species Common Name Tolerance to salt spray (1)
Tolerance to soil salinity
Water salinity (3)
Soil salinity tolerance
Suitability for sites (5)
Water-logging tolerance
Tolerance to Sodium
Tolerance to Chloride
Tolerance to Boron
Park Number
1 2 3 4 5 6 7 8 9 10 11 12 13 14 15 16 17 18 19 20 21 22 23 24 25 26 27 21w
Austrostipa drummondii Cottony Spear-grass H M(2) X
Austrostipa eremophila Rusty Spear-grass H M(2) X
X X
Austrostipa flavescens Coast Spear-grass H H(2) X
X X
Austrostipa nitida Balcarra Spear-grass H H(2) X
Austrostipa nodosa Tall Spear-grass H H(2) X
X X X
Austrostipa puberula Small rusty spear-grass H H(2) X
Austrostipa scabra ssp. scabra Rough Spear-grass H H(2) X
Austrostipa sp. Spear-grass H H(2) X
X X
X
X X X X X X X X
Banksia marginata Silver Banksia VT(4) X
Bauhinia sp. * Hong Kong Orchid tree L L(2) MT 400-600mS/m S(12) X
Boerhavia dominii Tar-vine X X X X
Brachychiton acerifolius * Illawarra Flame Tree Tolerant? X X X X
Brachychiton discolor * Lace tree/Lacebark Tree X
Brachychiton populneus * Kurrajong T? X
X
X
X
X X
X X X X X X X X X X X
Brachychiton sp. * X
Buddleja davidii * Butterfly Bush L L(2) X
Bursaria spinosa ssp. spinosa Sweet Bursaria X X
Callistemon phoenicius* Bottlebrush M M(2), MT(4), T(6) 400-800mS/m M T (4)
X X
Callistemon rugulosus var. rugulosus Scarlet Bottlebrush M M(2) T none
X
Callistemon sp. Bottlebrush T M(2),T(4) MT? Wa X X X X X X
Callitris gracilis Southern Cypress Pine C.Columellaris -Ds
X X
X X X X X X X X X X X X
Calostemma purpureum Pink-garland Lily X X
Calothamnus sp. * X
Calystegia sepium Large Bindweed X X X
Calytrix tetragona Common Fringe-myrtle X
Casuarina glauca * obesa similar tolerance H H(2), T(4) T >1600mS/m Wa,Ss,Ds Tolerant X
X
X
X
X X X X X X X X X X X
Ceratonia siliqua * Carob S(4) 200-400mS/m X
X X X X X X X X X
Chenopodium pumilio Clammy Goosefoot X X X X X
Chloris truncata Windmill Grass M H(2) 400-800mS/m M X
X X
X X X X X X X X X
Convolvulus erubescens Australian Bindweed X
Convolvulus remotus Grassy Bindweed X
Correa pulchella Salmon Correa C.Alba is VT(4) X
Correa reflexa Common Correa X
Cotoneaster sp. * Cotoneaster L L(2), VS(4) S <200mS/m S (7) S (7) X X
Cotula australis Common Cotula X X
Cymbopogon ambiguus Lemon-grass X
Cyperus sp. Sedge X X X
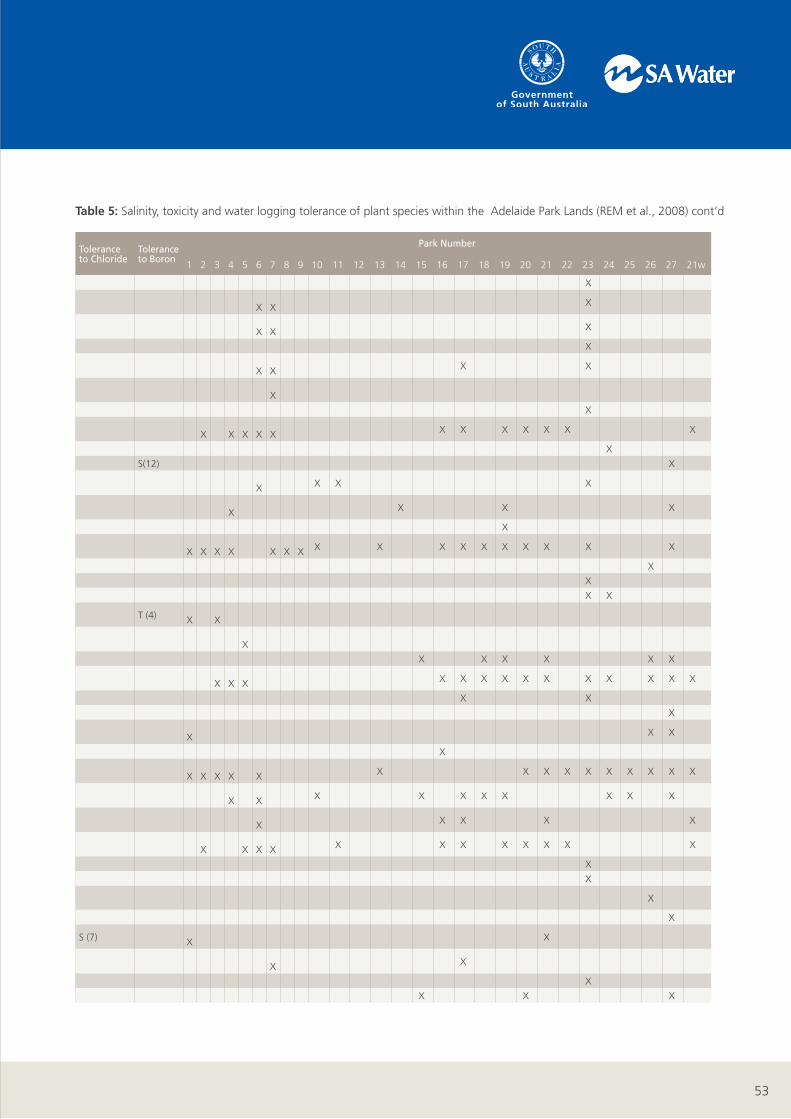
53
Table 5: Salinity, toxicity and water logging tolerance of plant species within the Adelaide Park Lands (REM et al., 2008) cont’d
Species Common Name Tolerance to salt spray (1)
Tolerance to soil salinity
Water salinity (3)
Soil salinity tolerance
Suitability for sites (5)
Water-logging tolerance
Tolerance to Sodium
Tolerance to Chloride
Tolerance to Boron
Park Number
1 2 3 4 5 6 7 8 9 10 11 12 13 14 15 16 17 18 19 20 21 22 23 24 25 26 27 21w
Austrostipa drummondii Cottony Spear-grass H M(2) X
Austrostipa eremophila Rusty Spear-grass H M(2) X
X X
Austrostipa flavescens Coast Spear-grass H H(2) X
X X
Austrostipa nitida Balcarra Spear-grass H H(2) X
Austrostipa nodosa Tall Spear-grass H H(2) X
X X X
Austrostipa puberula Small rusty spear-grass H H(2) X
Austrostipa scabra ssp. scabra Rough Spear-grass H H(2) X
Austrostipa sp. Spear-grass H H(2) X
X X
X
X X X X X X X X
Banksia marginata Silver Banksia VT(4) X
Bauhinia sp. * Hong Kong Orchid tree L L(2) MT 400-600mS/m S(12) X
Boerhavia dominii Tar-vine X X X X
Brachychiton acerifolius * Illawarra Flame Tree Tolerant? X X X X
Brachychiton discolor * Lace tree/Lacebark Tree X
Brachychiton populneus * Kurrajong T? X
X
X
X
X X
X X X X X X X X X X X
Brachychiton sp. * X
Buddleja davidii * Butterfly Bush L L(2) X
Bursaria spinosa ssp. spinosa Sweet Bursaria X X
Callistemon phoenicius* Bottlebrush M M(2), MT(4), T(6) 400-800mS/m M T (4)
X X
Callistemon rugulosus var. rugulosus Scarlet Bottlebrush M M(2) T none
X
Callistemon sp. Bottlebrush T M(2),T(4) MT? Wa X X X X X X
Callitris gracilis Southern Cypress Pine C.Columellaris -Ds
X X
X X X X X X X X X X X X
Calostemma purpureum Pink-garland Lily X X
Calothamnus sp. * X
Calystegia sepium Large Bindweed X X X
Calytrix tetragona Common Fringe-myrtle X
Casuarina glauca * obesa similar tolerance H H(2), T(4) T >1600mS/m Wa,Ss,Ds Tolerant X
X
X
X
X X X X X X X X X X X
Ceratonia siliqua * Carob S(4) 200-400mS/m X
X X X X X X X X X
Chenopodium pumilio Clammy Goosefoot X X X X X
Chloris truncata Windmill Grass M H(2) 400-800mS/m M X
X X
X X X X X X X X X
Convolvulus erubescens Australian Bindweed X
Convolvulus remotus Grassy Bindweed X
Correa pulchella Salmon Correa C.Alba is VT(4) X
Correa reflexa Common Correa X
Cotoneaster sp. * Cotoneaster L L(2), VS(4) S <200mS/m S (7) S (7) X X
Cotula australis Common Cotula X X
Cymbopogon ambiguus Lemon-grass X
Cyperus sp. Sedge X X X
Table 5: Salinity, toxicity and water logging tolerance of plant species within the Adelaide Park Lands (REM et al., 2008) cont’d
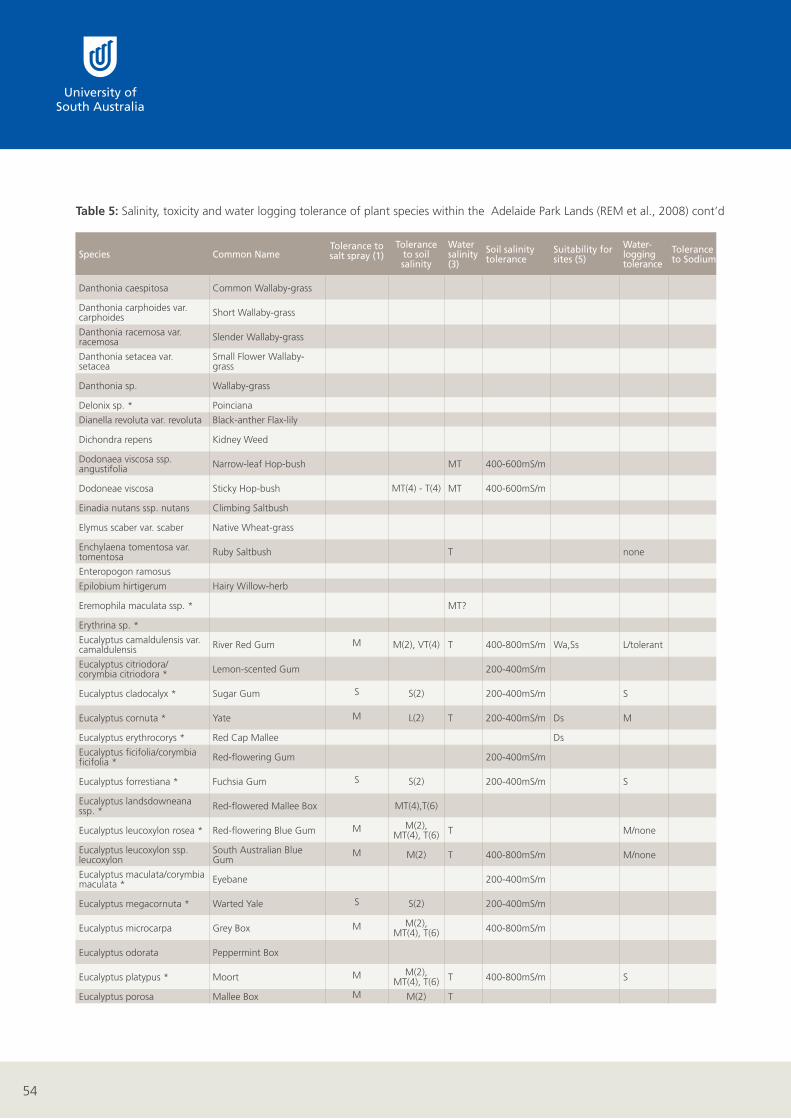
54
Table 5: Salinity, toxicity and water logging tolerance of plant species within the Adelaide Park Lands (REM et al., 2008) cont’d
Species Common Name Tolerance to salt spray (1)
Tolerance to soil salinity
Water salinity (3)
Soil salinity tolerance
Suitability for sites (5)
Water-logging tolerance
Tolerance to Sodium
Tolerance to Chloride
Tolerance to Boron
Park Number
1 2 3 4 5 6 7 8 9 10 11 12 13 14 15 16 17 18 19 20 21 22 23 24 25 26 27 21w
Danthonia caespitosa Common Wallaby-grass X
X X
Danthonia carphoides var. carphoides Short Wallaby-grass X
Danthonia racemosa var. racemosa Slender Wallaby-grass
X X
Danthonia setacea var. setacea
Small Flower Wallaby-grass
X
Danthonia sp. Wallaby-grass X
X X X X X X X
Delonix sp. * Poinciana X X
Dianella revoluta var. revoluta Black-anther Flax-lily X X X X
Dichondra repens Kidney Weed X
X
X X X
Dodonaea viscosa ssp. angustifolia Narrow-leaf Hop-bush MT 400-600mS/m X X X
Dodoneae viscosa Sticky Hop-bush MT(4) - T(4) MT 400-600mS/m X
Einadia nutans ssp. nutans Climbing Saltbush X X
Elymus scaber var. scaber Native Wheat-grass X
X X X X
Enchylaena tomentosa var. tomentosa Ruby Saltbush T none
X X X X X
Enteropogon ramosus X X
Epilobium hirtigerum Hairy Willow-herb X
Eremophila maculata ssp. * MT? X X X
Erythrina sp. * S(12) X X
Eucalyptus camaldulensis var. camaldulensis River Red Gum M M(2), VT(4) T 400-800mS/m Wa,Ss L/tolerant
X X
X
X
X X X X X X X X X X X X X X X
Eucalyptus citriodora/corymbia citriodora * Lemon-scented Gum 200-400mS/m T (12)
X X
X X X X X X X X X X X X X
Eucalyptus cladocalyx * Sugar Gum S S(2) 200-400mS/m S T (12) X
X
X X
X X X X X X X X X X X X X X X X
Eucalyptus cornuta * Yate M L(2) T 200-400mS/m Ds M X
Eucalyptus erythrocorys * Red Cap Mallee Ds X X X X
Eucalyptus ficifolia/corymbia ficifolia * Red-flowering Gum 200-400mS/m M (12)
X X
Eucalyptus forrestiana * Fuchsia Gum S S(2) 200-400mS/m S X X X X
Eucalyptus landsdowneana ssp. * Red-flowered Mallee Box MT(4),T(6) X
Eucalyptus leucoxylon rosea * Red-flowering Blue Gum M M(2), MT(4), T(6) T M/none
X X
X
X X X X X X X
Eucalyptus leucoxylon ssp. leucoxylon
South Australian Blue Gum
M M(2) T 400-800mS/m M/none X
X X X X X X X X X X X
Eucalyptus maculata/corymbia maculata * Eyebane 200-400mS/m X X X X
Eucalyptus megacornuta * Warted Yale S S(2) 200-400mS/m X
Eucalyptus microcarpa Grey Box M M(2), MT(4), T(6) 400-800mS/m
X X X
Eucalyptus odorata Peppermint Box X X
Eucalyptus platypus * Moort M M(2), MT(4), T(6) T 400-800mS/m S
X X X
Eucalyptus porosa Mallee Box M M(2) T X X

55
Table 5: Salinity, toxicity and water logging tolerance of plant species within the Adelaide Park Lands (REM et al., 2008) cont’d
Species Common Name Tolerance to salt spray (1)
Tolerance to soil salinity
Water salinity (3)
Soil salinity tolerance
Suitability for sites (5)
Water-logging tolerance
Tolerance to Sodium
Tolerance to Chloride
Tolerance to Boron
Park Number
1 2 3 4 5 6 7 8 9 10 11 12 13 14 15 16 17 18 19 20 21 22 23 24 25 26 27 21w
Danthonia caespitosa Common Wallaby-grass X
X X
Danthonia carphoides var. carphoides Short Wallaby-grass X
Danthonia racemosa var. racemosa Slender Wallaby-grass
X X
Danthonia setacea var. setacea
Small Flower Wallaby-grass
X
Danthonia sp. Wallaby-grass X
X X X X X X X
Delonix sp. * Poinciana X X
Dianella revoluta var. revoluta Black-anther Flax-lily X X X X
Dichondra repens Kidney Weed X
X
X X X
Dodonaea viscosa ssp. angustifolia Narrow-leaf Hop-bush MT 400-600mS/m X X X
Dodoneae viscosa Sticky Hop-bush MT(4) - T(4) MT 400-600mS/m X
Einadia nutans ssp. nutans Climbing Saltbush X X
Elymus scaber var. scaber Native Wheat-grass X
X X X X
Enchylaena tomentosa var. tomentosa Ruby Saltbush T none
X X X X X
Enteropogon ramosus X X
Epilobium hirtigerum Hairy Willow-herb X
Eremophila maculata ssp. * MT? X X X
Erythrina sp. * S(12) X X
Eucalyptus camaldulensis var. camaldulensis River Red Gum M M(2), VT(4) T 400-800mS/m Wa,Ss L/tolerant
X X
X
X
X X X X X X X X X X X X X X X
Eucalyptus citriodora/corymbia citriodora * Lemon-scented Gum 200-400mS/m T (12)
X X
X X X X X X X X X X X X X
Eucalyptus cladocalyx * Sugar Gum S S(2) 200-400mS/m S T (12) X
X
X X
X X X X X X X X X X X X X X X X
Eucalyptus cornuta * Yate M L(2) T 200-400mS/m Ds M X
Eucalyptus erythrocorys * Red Cap Mallee Ds X X X X
Eucalyptus ficifolia/corymbia ficifolia * Red-flowering Gum 200-400mS/m M (12)
X X
Eucalyptus forrestiana * Fuchsia Gum S S(2) 200-400mS/m S X X X X
Eucalyptus landsdowneana ssp. * Red-flowered Mallee Box MT(4),T(6) X
Eucalyptus leucoxylon rosea * Red-flowering Blue Gum M M(2), MT(4), T(6) T M/none
X X
X
X X X X X X X
Eucalyptus leucoxylon ssp. leucoxylon
South Australian Blue Gum
M M(2) T 400-800mS/m M/none X
X X X X X X X X X X X
Eucalyptus maculata/corymbia maculata * Eyebane 200-400mS/m X X X X
Eucalyptus megacornuta * Warted Yale S S(2) 200-400mS/m X
Eucalyptus microcarpa Grey Box M M(2), MT(4), T(6) 400-800mS/m
X X X
Eucalyptus odorata Peppermint Box X X
Eucalyptus platypus * Moort M M(2), MT(4), T(6) T 400-800mS/m S
X X X
Eucalyptus porosa Mallee Box M M(2) T X X
Table 5: Salinity, toxicity and water logging tolerance of plant species within the Adelaide Park Lands (REM et al., 2008) cont’d
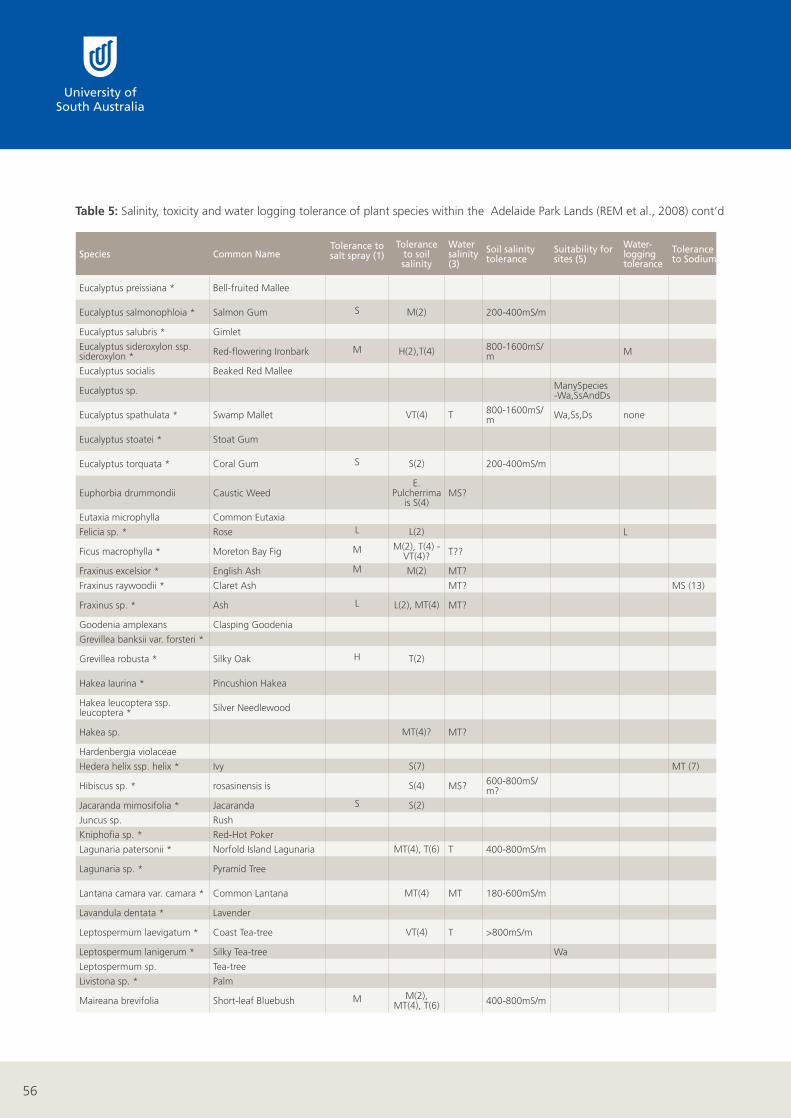
56
Table 5: Salinity, toxicity and water logging tolerance of plant species within the Adelaide Park Lands (REM et al., 2008) cont’d
Species Common Name Tolerance to salt spray (1)
Tolerance to soil salinity
Water salinity (3)
Soil salinity tolerance
Suitability for sites (5)
Water-logging tolerance
Tolerance to Sodium
Tolerance to Chloride
Tolerance to Boron
Park Number
1 2 3 4 5 6 7 8 9 10 11 12 13 14 15 16 17 18 19 20 21 22 23 24 25 26 27 21w
Eucalyptus preissiana * Bell-fruited Mallee X
X X X X X X
Eucalyptus salmonophloia * Salmon Gum S M(2) 200-400mS/m X
X X
Eucalyptus salubris * Gimlet X
Eucalyptus sideroxylon ssp. sideroxylon * Red-flowering Ironbark M H(2),T(4) 800-1600mS/
m M X X X X X X X X X X X
Eucalyptus socialis Beaked Red Mallee X
Eucalyptus sp. ManySpecies -Wa,SsAndDs
X X X X
Eucalyptus spathulata * Swamp Mallet VT(4) T 800-1600mS/m Wa,Ss,Ds none X X
Eucalyptus stoatei * Stoat Gum X X X
Eucalyptus torquata * Coral Gum S S(2) 200-400mS/m X
X X
X X X X
Euphorbia drummondii Caustic Weed E.
Pulcherrima is S(4)
MS? X X X
Eutaxia microphylla Common Eutaxia X
Felicia sp. * Rose L L(2) L X X
Ficus macrophylla * Moreton Bay Fig M M(2), T(4) - VT(4)? T??
X X
X X X X X X X X X X
Fraxinus excelsior * English Ash M M(2) MT? X X X X
Fraxinus raywoodii * Claret Ash MT? MS (13) MS (13) X
Fraxinus sp. * Ash L L(2), MT(4) MT? S (10) X X X X X X X X X
Goodenia amplexans Clasping Goodenia X
Grevillea banksii var. forsteri * X X
Grevillea robusta * Silky Oak H T(2) X X X X X X
Hakea Iaurina * Pincushion Hakea X X
Hakea leucoptera ssp. leucoptera * Silver Needlewood
X
Hakea sp. MT(4)? MT? X
X X
Hardenbergia violaceae X X
Hedera helix ssp. helix * Ivy S(7) MT (7) MT (7) x
Hibiscus sp. * rosasinensis is S(4) MS? 600-800mS/m? MS (13) X
Jacaranda mimosifolia * Jacaranda S S(2) S (10) T (13) X
Juncus sp. Rush X X X X
Kniphofia sp. * Red-Hot Poker X
Lagunaria patersonii * Norfold Island Lagunaria MT(4), T(6) T 400-800mS/m X X X X X X X X X X
Lagunaria sp. * Pyramid Tree X
X
X X
X X X X X
Lantana camara var. camara * Common Lantana MT(4) MT 180-600mS/m S (4);S(13) X X
Lavandula dentata * Lavender X
Leptospermum laevigatum * Coast Tea-tree VT(4) T >800mS/m X
Leptospermum lanigerum * Silky Tea-tree Wa X
Leptospermum sp. Tea-tree X
Livistona sp. * Palm X X X X
Maireana brevifolia Short-leaf Bluebush M M(2), MT(4), T(6) 400-800mS/m
X X X X X
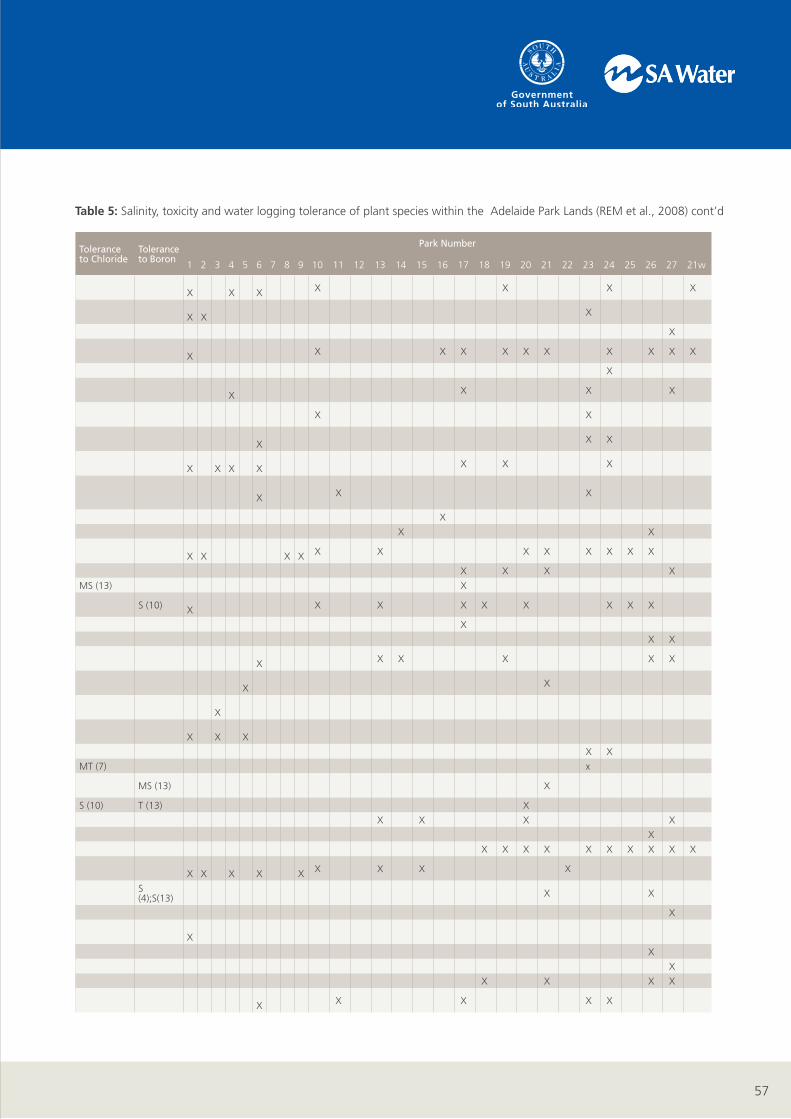
57
Table 5: Salinity, toxicity and water logging tolerance of plant species within the Adelaide Park Lands (REM et al., 2008) cont’d
Species Common Name Tolerance to salt spray (1)
Tolerance to soil salinity
Water salinity (3)
Soil salinity tolerance
Suitability for sites (5)
Water-logging tolerance
Tolerance to Sodium
Tolerance to Chloride
Tolerance to Boron
Park Number
1 2 3 4 5 6 7 8 9 10 11 12 13 14 15 16 17 18 19 20 21 22 23 24 25 26 27 21w
Eucalyptus preissiana * Bell-fruited Mallee X
X X X X X X
Eucalyptus salmonophloia * Salmon Gum S M(2) 200-400mS/m X
X X
Eucalyptus salubris * Gimlet X
Eucalyptus sideroxylon ssp. sideroxylon * Red-flowering Ironbark M H(2),T(4) 800-1600mS/
m M X X X X X X X X X X X
Eucalyptus socialis Beaked Red Mallee X
Eucalyptus sp. ManySpecies -Wa,SsAndDs
X X X X
Eucalyptus spathulata * Swamp Mallet VT(4) T 800-1600mS/m Wa,Ss,Ds none X X
Eucalyptus stoatei * Stoat Gum X X X
Eucalyptus torquata * Coral Gum S S(2) 200-400mS/m X
X X
X X X X
Euphorbia drummondii Caustic Weed E.
Pulcherrima is S(4)
MS? X X X
Eutaxia microphylla Common Eutaxia X
Felicia sp. * Rose L L(2) L X X
Ficus macrophylla * Moreton Bay Fig M M(2), T(4) - VT(4)? T??
X X
X X X X X X X X X X
Fraxinus excelsior * English Ash M M(2) MT? X X X X
Fraxinus raywoodii * Claret Ash MT? MS (13) MS (13) X
Fraxinus sp. * Ash L L(2), MT(4) MT? S (10) X X X X X X X X X
Goodenia amplexans Clasping Goodenia X
Grevillea banksii var. forsteri * X X
Grevillea robusta * Silky Oak H T(2) X X X X X X
Hakea Iaurina * Pincushion Hakea X X
Hakea leucoptera ssp. leucoptera * Silver Needlewood
X
Hakea sp. MT(4)? MT? X
X X
Hardenbergia violaceae X X
Hedera helix ssp. helix * Ivy S(7) MT (7) MT (7) x
Hibiscus sp. * rosasinensis is S(4) MS? 600-800mS/m? MS (13) X
Jacaranda mimosifolia * Jacaranda S S(2) S (10) T (13) X
Juncus sp. Rush X X X X
Kniphofia sp. * Red-Hot Poker X
Lagunaria patersonii * Norfold Island Lagunaria MT(4), T(6) T 400-800mS/m X X X X X X X X X X
Lagunaria sp. * Pyramid Tree X
X
X X
X X X X X
Lantana camara var. camara * Common Lantana MT(4) MT 180-600mS/m S (4);S(13) X X
Lavandula dentata * Lavender X
Leptospermum laevigatum * Coast Tea-tree VT(4) T >800mS/m X
Leptospermum lanigerum * Silky Tea-tree Wa X
Leptospermum sp. Tea-tree X
Livistona sp. * Palm X X X X
Maireana brevifolia Short-leaf Bluebush M M(2), MT(4), T(6) 400-800mS/m
X X X X X
Table 5: Salinity, toxicity and water logging tolerance of plant species within the Adelaide Park Lands (REM et al., 2008) cont’d
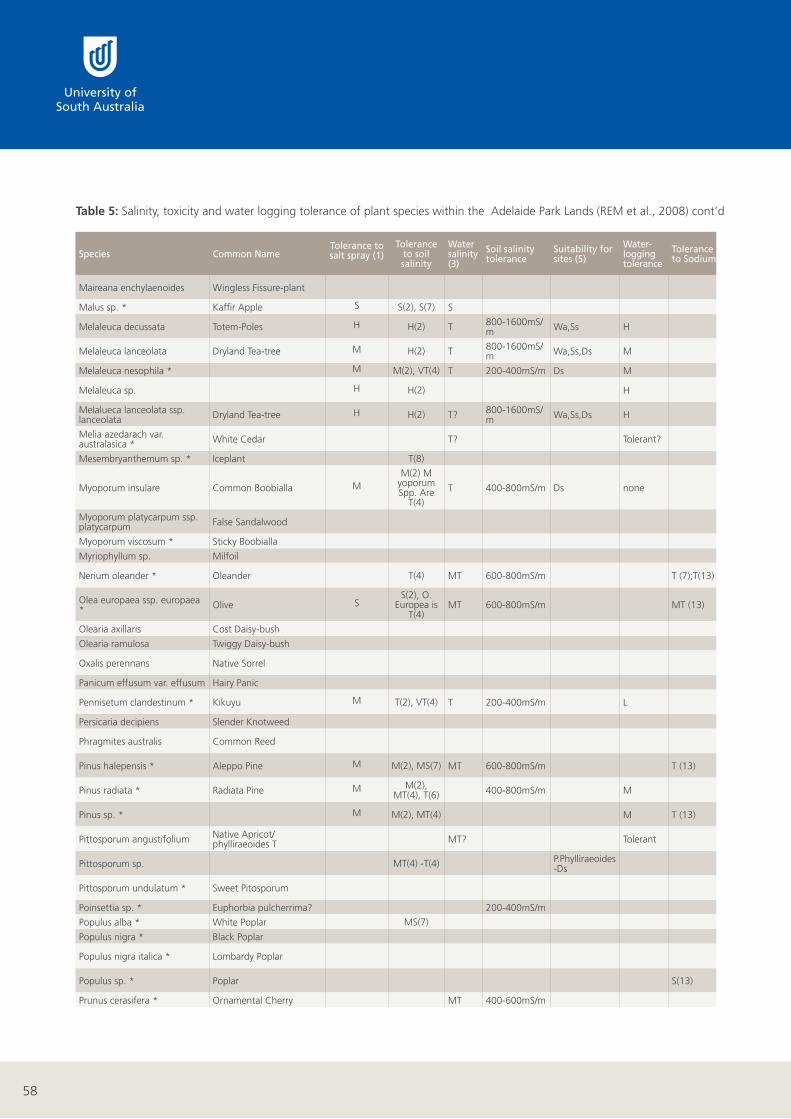
58
Table 5: Salinity, toxicity and water logging tolerance of plant species within the Adelaide Park Lands (REM et al., 2008) cont’d
Species Common Name Tolerance to salt spray (1)
Tolerance to soil salinity
Water salinity (3)
Soil salinity tolerance
Suitability for sites (5)
Water-logging tolerance
Tolerance to Sodium
Tolerance to Chloride
Tolerance to Boron
Park Number
1 2 3 4 5 6 7 8 9 10 11 12 13 14 15 16 17 18 19 20 21 22 23 24 25 26 27 21w
Maireana enchylaenoides Wingless Fissure-plant X
X X X X X X
Malus sp. * Kaffir Apple S S(2), S(7) S X X X X X X
Melaleuca decussata Totem-Poles H H(2) T 800-1600mS/m Wa,Ss H
X
Melaleuca lanceolata Dryland Tea-tree M H(2) T 800-1600mS/m Wa,Ss,Ds M
X X X X X X
Melaleuca nesophila * M M(2), VT(4) T 200-400mS/m Ds M X
Melaleuca sp. H H(2) H X X X
Melalueca lanceolata ssp. lanceolata Dryland Tea-tree H H(2) T? 800-1600mS/
m Wa,Ss,Ds H X
Melia azedarach var. australasica * White Cedar T? Tolerant?
X X X X X X X X
Mesembryanthemum sp. * Iceplant T(8) X
Myoporum insulare Common Boobialla M M(2) M
yoporum Spp. Are
T(4)
T 400-800mS/m Ds none X X
Myoporum platycarpum ssp. platycarpum False Sandalwood X
Myoporum viscosum * Sticky Boobialla X X
Myriophyllum sp. Milfoil X
Nerium oleander * Oleander T(4) MT 600-800mS/m T (7);T(13) T (7);T(13) T (4);T-MT(13)
X X X X
Olea europaea ssp. europaea * Olive S
S(2), O. Europea is
T(4) MT 600-800mS/m MT (13) MT (13)
X X
X
X X X X X X X X X X X
Olearia axillaris Cost Daisy-bush X
Olearia ramulosa Twiggy Daisy-bush X X
Oxalis perennans Native Sorrel X
X X X X X X X
Panicum effusum var. effusum Hairy Panic X
Pennisetum clandestinum * Kikuyu M T(2), VT(4) T 200-400mS/m L X
X
X
X
X
X
X
X
X X X X X X X X X X X X X X X X X X X X
Persicaria decipiens Slender Knotweed X X
Phragmites australis Common Reed X X X
Pinus halepensis * Aleppo Pine M M(2), MS(7) MT 600-800mS/m T (13) T (13) X
X
X X
X X X X X X X X X X X X X
Pinus radiata * Radiata Pine M M(2), MT(4), T(6) 400-800mS/m M
X X
X X X X X X X X X X X X X
Pinus sp. * M M(2), MT(4) M T (13) T (13) X X
Pittosporum angustifolium Native Apricot/phylliraeoides T
MT? Tolerant X X X X
Pittosporum sp. MT(4) -T(4) P.Phylliraeoides -Ds X
Pittosporum undulatum * Sweet Pitosporum X X X X X
Poinsettia sp. * Euphorbia pulcherrima? 200-400mS/m X
Populus alba * White Poplar MS(7) X X X X X
Populus nigra * Black Poplar X X X X
Populus nigra italica * Lombardy Poplar S(11) X X X X X X
Populus sp. * Poplar S(13) S(13) X
X X X X X X X
Prunus cerasifera * Ornamental Cherry MT 400-600mS/m T(11) X X

59
Table 5: Salinity, toxicity and water logging tolerance of plant species within the Adelaide Park Lands (REM et al., 2008) cont’d
Species Common Name Tolerance to salt spray (1)
Tolerance to soil salinity
Water salinity (3)
Soil salinity tolerance
Suitability for sites (5)
Water-logging tolerance
Tolerance to Sodium
Tolerance to Chloride
Tolerance to Boron
Park Number
1 2 3 4 5 6 7 8 9 10 11 12 13 14 15 16 17 18 19 20 21 22 23 24 25 26 27 21w
Maireana enchylaenoides Wingless Fissure-plant X
X X X X X X
Malus sp. * Kaffir Apple S S(2), S(7) S X X X X X X
Melaleuca decussata Totem-Poles H H(2) T 800-1600mS/m Wa,Ss H
X
Melaleuca lanceolata Dryland Tea-tree M H(2) T 800-1600mS/m Wa,Ss,Ds M
X X X X X X
Melaleuca nesophila * M M(2), VT(4) T 200-400mS/m Ds M X
Melaleuca sp. H H(2) H X X X
Melalueca lanceolata ssp. lanceolata Dryland Tea-tree H H(2) T? 800-1600mS/
m Wa,Ss,Ds H X
Melia azedarach var. australasica * White Cedar T? Tolerant?
X X X X X X X X
Mesembryanthemum sp. * Iceplant T(8) X
Myoporum insulare Common Boobialla M M(2) M
yoporum Spp. Are
T(4)
T 400-800mS/m Ds none X X
Myoporum platycarpum ssp. platycarpum False Sandalwood X
Myoporum viscosum * Sticky Boobialla X X
Myriophyllum sp. Milfoil X
Nerium oleander * Oleander T(4) MT 600-800mS/m T (7);T(13) T (7);T(13) T (4);T-MT(13)
X X X X
Olea europaea ssp. europaea * Olive S
S(2), O. Europea is
T(4) MT 600-800mS/m MT (13) MT (13)
X X
X
X X X X X X X X X X X
Olearia axillaris Cost Daisy-bush X
Olearia ramulosa Twiggy Daisy-bush X X
Oxalis perennans Native Sorrel X
X X X X X X X
Panicum effusum var. effusum Hairy Panic X
Pennisetum clandestinum * Kikuyu M T(2), VT(4) T 200-400mS/m L X
X
X
X
X
X
X
X
X X X X X X X X X X X X X X X X X X X X
Persicaria decipiens Slender Knotweed X X
Phragmites australis Common Reed X X X
Pinus halepensis * Aleppo Pine M M(2), MS(7) MT 600-800mS/m T (13) T (13) X
X
X X
X X X X X X X X X X X X X
Pinus radiata * Radiata Pine M M(2), MT(4), T(6) 400-800mS/m M
X X
X X X X X X X X X X X X X
Pinus sp. * M M(2), MT(4) M T (13) T (13) X X
Pittosporum angustifolium Native Apricot/phylliraeoides T
MT? Tolerant X X X X
Pittosporum sp. MT(4) -T(4) P.Phylliraeoides -Ds X
Pittosporum undulatum * Sweet Pitosporum X X X X X
Poinsettia sp. * Euphorbia pulcherrima? 200-400mS/m X
Populus alba * White Poplar MS(7) X X X X X
Populus nigra * Black Poplar X X X X
Populus nigra italica * Lombardy Poplar S(11) X X X X X X
Populus sp. * Poplar S(13) S(13) X
X X X X X X X
Prunus cerasifera * Ornamental Cherry MT 400-600mS/m T(11) X X
Table 5: Salinity, toxicity and water logging tolerance of plant species within the Adelaide Park Lands (REM et al., 2008) cont’d
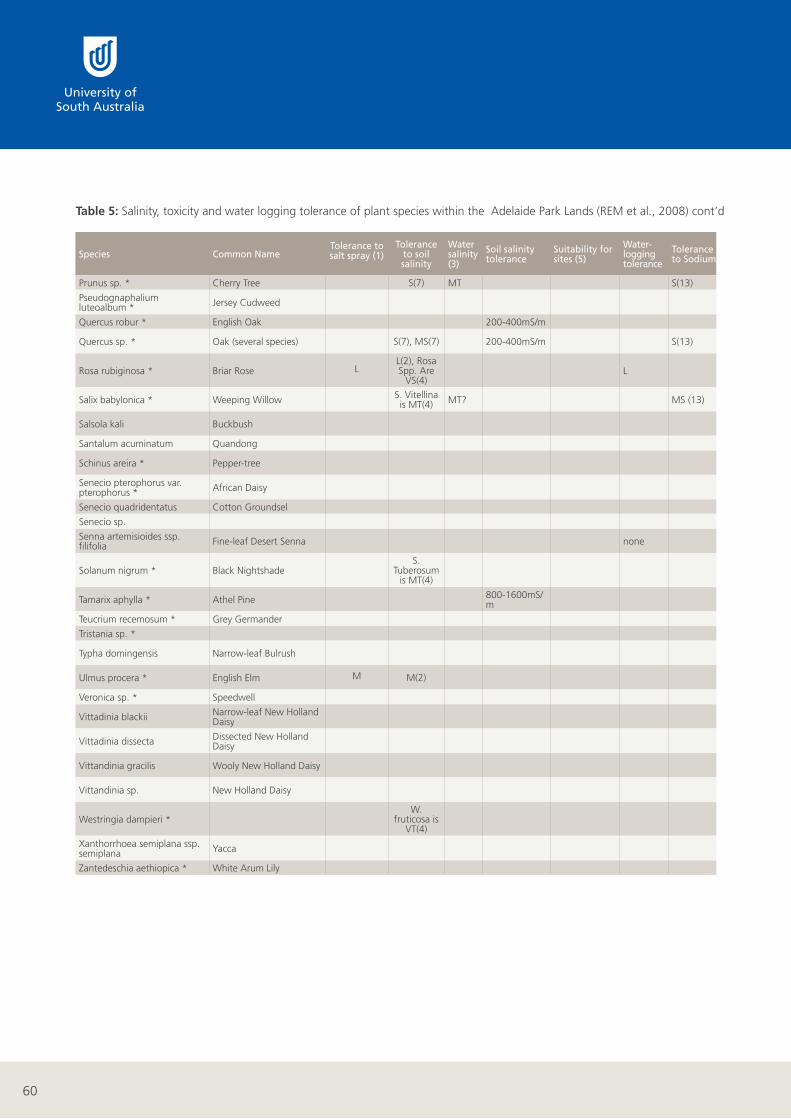
60
Table 5: Salinity, toxicity and water logging tolerance of plant species within the Adelaide Park Lands (REM et al., 2008) cont’d
Species Common Name Tolerance to salt spray (1)
Tolerance to soil salinity
Water salinity (3)
Soil salinity tolerance
Suitability for sites (5)
Water-logging tolerance
Tolerance to Sodium
Tolerance to Chloride
Tolerance to Boron
Park Number
1 2 3 4 5 6 7 8 9 10 11 12 13 14 15 16 17 18 19 20 21 22 23 24 25 26 27 21w
Prunus sp. * Cherry Tree S(7) MT S(13) S(13) X X
Pseudognaphalium luteoalbum * Jersey Cudweed X
Quercus robur * English Oak 200-400mS/m X X
Quercus sp. * Oak (several species) S(7), MS(7) 200-400mS/m S(13) S (7);S(13) T(11) X X X X
Rosa rubiginosa * Briar Rose L L(2), Rosa Spp. Are
VS(4) L X
Salix babylonica * Weeping Willow S. Vitellina is MT(4) MT? MS (13) MS (13) T(11) X X X
Salsola kali Buckbush X X
Santalum acuminatum Quandong X
Schinus areira * Pepper-tree X
X X
X X X X X X X X X X X X X X X X X
Senecio pterophorus var. pterophorus * African Daisy X
Senecio quadridentatus Cotton Groundsel X
Senecio sp. X
Senna artemisioides ssp. filifolia Fine-leaf Desert Senna none X X
Solanum nigrum * Black Nightshade S.
Tuberosum is MT(4)
X
Tamarix aphylla * Athel Pine 800-1600mS/m T(11)
X X
X X X X X X
Teucrium recemosum * Grey Germander X
Tristania sp. * X
Typha domingensis Narrow-leaf Bulrush X X X X X X X X
Ulmus procera * English Elm M M(2) X X X X
Veronica sp. * Speedwell X X
Vittadinia blackii Narrow-leaf New Holland Daisy
X
Vittadinia dissecta Dissected New Holland Daisy
X
Vittandinia gracilis Wooly New Holland Daisy X X
Vittandinia sp. New Holland Daisy X X
Westringia dampieri * W.
fruticosa is VT(4)
X X X
Xanthorrhoea semiplana ssp. semiplana Yacca X X
Zantedeschia aethiopica * White Arum Lily X X
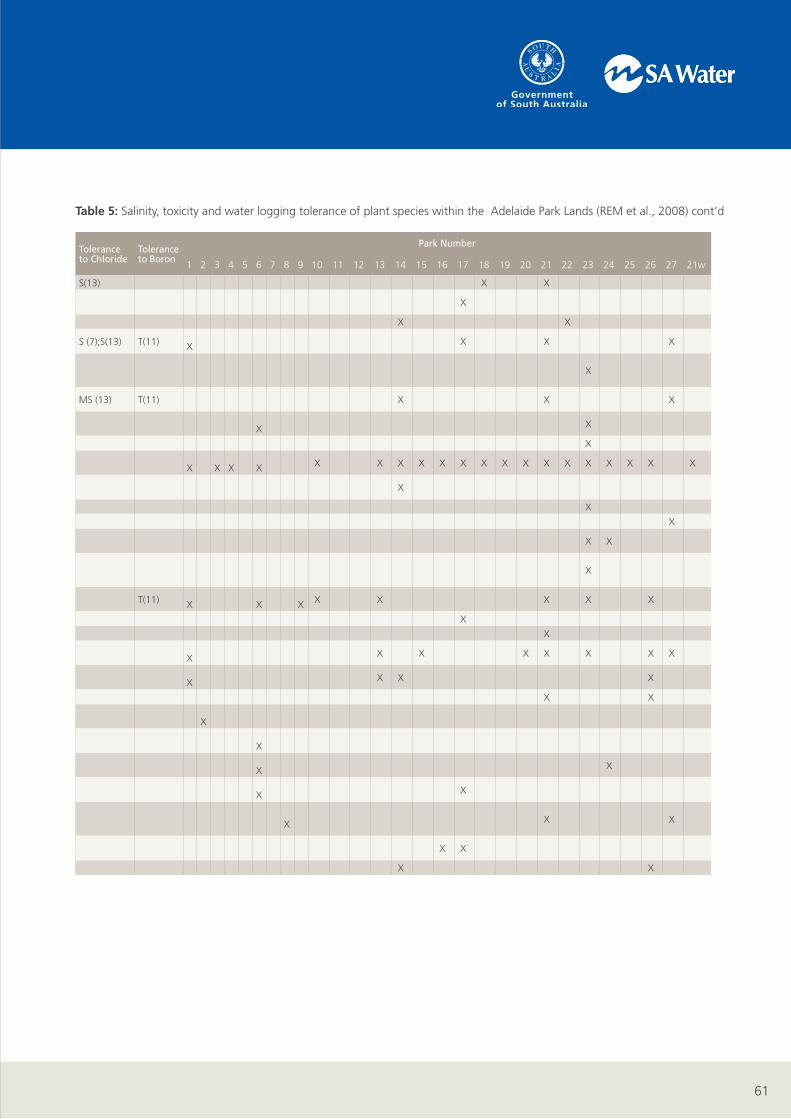
61
Table 5: Salinity, toxicity and water logging tolerance of plant species within the Adelaide Park Lands (REM et al., 2008) cont’d
Species Common Name Tolerance to salt spray (1)
Tolerance to soil salinity
Water salinity (3)
Soil salinity tolerance
Suitability for sites (5)
Water-logging tolerance
Tolerance to Sodium
Tolerance to Chloride
Tolerance to Boron
Park Number
1 2 3 4 5 6 7 8 9 10 11 12 13 14 15 16 17 18 19 20 21 22 23 24 25 26 27 21w
Prunus sp. * Cherry Tree S(7) MT S(13) S(13) X X
Pseudognaphalium luteoalbum * Jersey Cudweed X
Quercus robur * English Oak 200-400mS/m X X
Quercus sp. * Oak (several species) S(7), MS(7) 200-400mS/m S(13) S (7);S(13) T(11) X X X X
Rosa rubiginosa * Briar Rose L L(2), Rosa Spp. Are
VS(4) L X
Salix babylonica * Weeping Willow S. Vitellina is MT(4) MT? MS (13) MS (13) T(11) X X X
Salsola kali Buckbush X X
Santalum acuminatum Quandong X
Schinus areira * Pepper-tree X
X X
X X X X X X X X X X X X X X X X X
Senecio pterophorus var. pterophorus * African Daisy X
Senecio quadridentatus Cotton Groundsel X
Senecio sp. X
Senna artemisioides ssp. filifolia Fine-leaf Desert Senna none X X
Solanum nigrum * Black Nightshade S.
Tuberosum is MT(4)
X
Tamarix aphylla * Athel Pine 800-1600mS/m T(11)
X X
X X X X X X
Teucrium recemosum * Grey Germander X
Tristania sp. * X
Typha domingensis Narrow-leaf Bulrush X X X X X X X X
Ulmus procera * English Elm M M(2) X X X X
Veronica sp. * Speedwell X X
Vittadinia blackii Narrow-leaf New Holland Daisy
X
Vittadinia dissecta Dissected New Holland Daisy
X
Vittandinia gracilis Wooly New Holland Daisy X X
Vittandinia sp. New Holland Daisy X X
Westringia dampieri * W.
fruticosa is VT(4)
X X X
Xanthorrhoea semiplana ssp. semiplana Yacca X X
Zantedeschia aethiopica * White Arum Lily X X
Table 5: Salinity, toxicity and water logging tolerance of plant species within the Adelaide Park Lands (REM et al., 2008) cont’d
62
Example of the Adelaide Park Land environments (photo by Fatemeh Kazemi, 2010)