Embed Size (px)
Citation preview
AN INVESTIGATION OF ENVIRONMENTAL FACTORSASSOCIATED WITH THE CURRENT
PROPOSED JETTY SYSTEMAT
SBELLE PASS, LOUISIAN A(NASACR11312) AN INVESTIGATION OF N75-15253ENVIEONMENTAL FACTORS ASSOCIATED WITH THE
,CURENT AND PROPOSED JETTY SYSTEMS AT BELLE
PASS, LOUISIANA Final Report (Louisiana UnclasStte _Univ.) 44_p HC $3.75 CSCL 08C G3/48 06616
THE DIVISION OF ENGINEERING. RESEARCHLOUISIANA STATE UNIVERSITY
BATON ROUGE, LOUISIANA
NOVEMBER 1974
https://ntrs.nasa.gov/search.jsp?R=19750007181 2018-07-13T07:18:44+00:00Z
AN INVESTIGATION OF ENVIRONMENTAL FACTORS ASSOCIATED WITH THE
CURRENT AND PROPOSED JETTY SYSTEMS, AT BELLE PASS, LOUISIANA
A FINAL REPORT
TO
The Greater Lafourche Port and Harbor Commission
Golden Meadow, Louisiana
and
The National Aeronautics and Space AdministrationWashington, D.C.
by
Elvin J. Dantin Charles A. Whitehurst Warren T. Durbin
Professor of Professor of Associate
Civil Engineering Environmental Engineering
The Division of Engineering Research
Louisiana State University
Baton Rouge, Louisiana
November 6, 1974
"The opinions, findings and conclusions expressed inthis publication are those of the authors and notnecessarily those of the Greater Lafourche Port andHarbor Commission or the National Aeronautics andSpace Administration."
This work was sponsored by NASA through Grant No. NGL19-001-105, by the Lafourche Port and Harbor Commissiongrant for support of graduate students, 1974, and statefunds from the Division of Engineering Research, LSU,Baton Rouge, Louisiana.
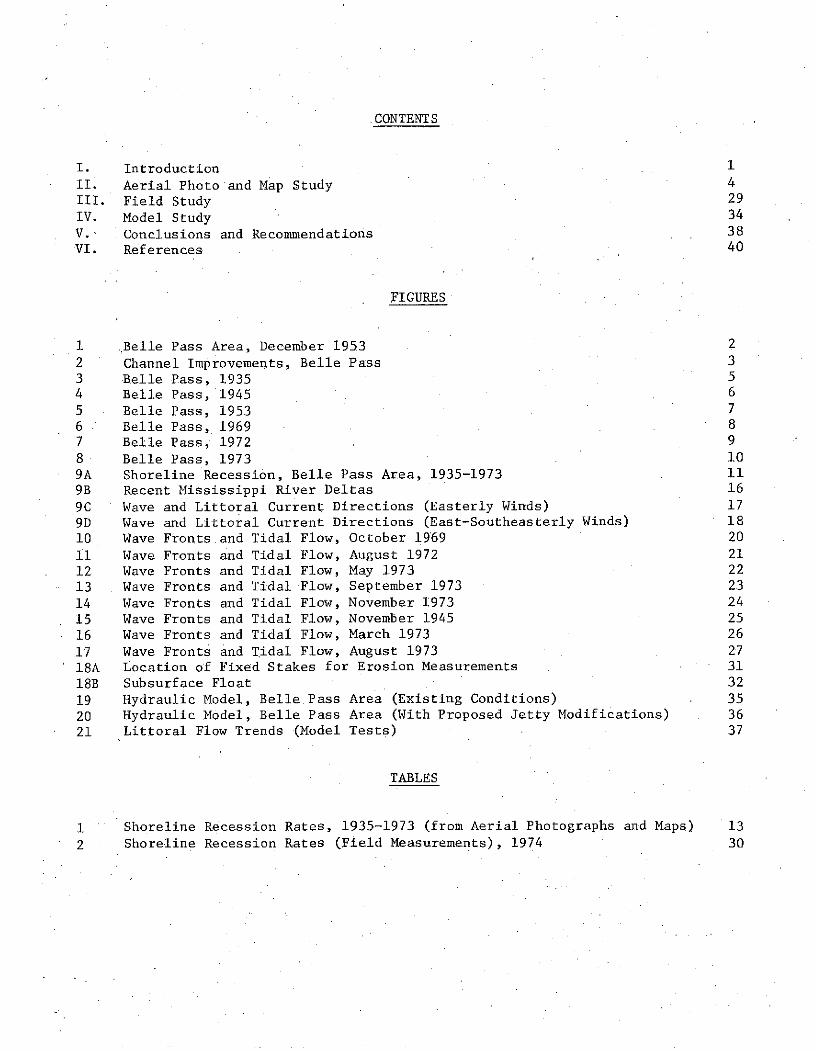
CONTENTS
I. Introduction 1
II. Aerial Photo and Map Study 4
III. Field Study 29
IV. Model Study 34
V., Conclusions and Recommendations 38
VI. References 40
FIGURES
1 ,Belle Pass Area, December 1953 2
2 Channel Improvements, Belle Pass 3
3 Belle Pass, 1935 5
4 Belle Pass, 1945 6
5 Belle Pass, 1953 7
6 Belle Pass, 1969 8
7 Belle Pass, 1972 9
8 Belle Pass, 1973 10
9A Shoreline Recession, Belle Pass Area, 1935-1973 11
9B Recent Mississippi River Deltas 16
9C Wave and Littoral Current Directions (Easterly Winds) 17
9D Wave and Littoral Current Directions (East-Southeasterly Winds) 1810 Wave Fronts and Tidal Flow, October 1969 20
11 Wave Fronts and Tidal Flow, August 1972 21
12 Wave Fronts and Tidal Flow, May 1973 22
13 Wave Fronts and Tidal Flow, September 1973 23
14 Wave Fronts and Tidal Flow, November 1973 24
15 Wave Fronts and Tidal Flow, November 1945 25
16 Wave Fronts and Tidal Flow, March 1973 26
.17 Wave Fronts and Tidal Flow, August 1973 27
18A Location of Fixed Stakes for Erosion Measurements . 31
18B Subsurface Float 32
19 Hydraulic Model, Belle Pass Area (Existing Conditions) 35
20 Hydraulic Model, Belle Pass Area (With Proposed Jetty Modifications) 36
21 Littoral Flow Trends (Model Tests) 37
TABLES
1 Shoreline Recession Rates, 1935-1973 (from Aerial Photographs and Maps) 13
2 Shoreline Recession Rates (Field Measurements), 1974 30
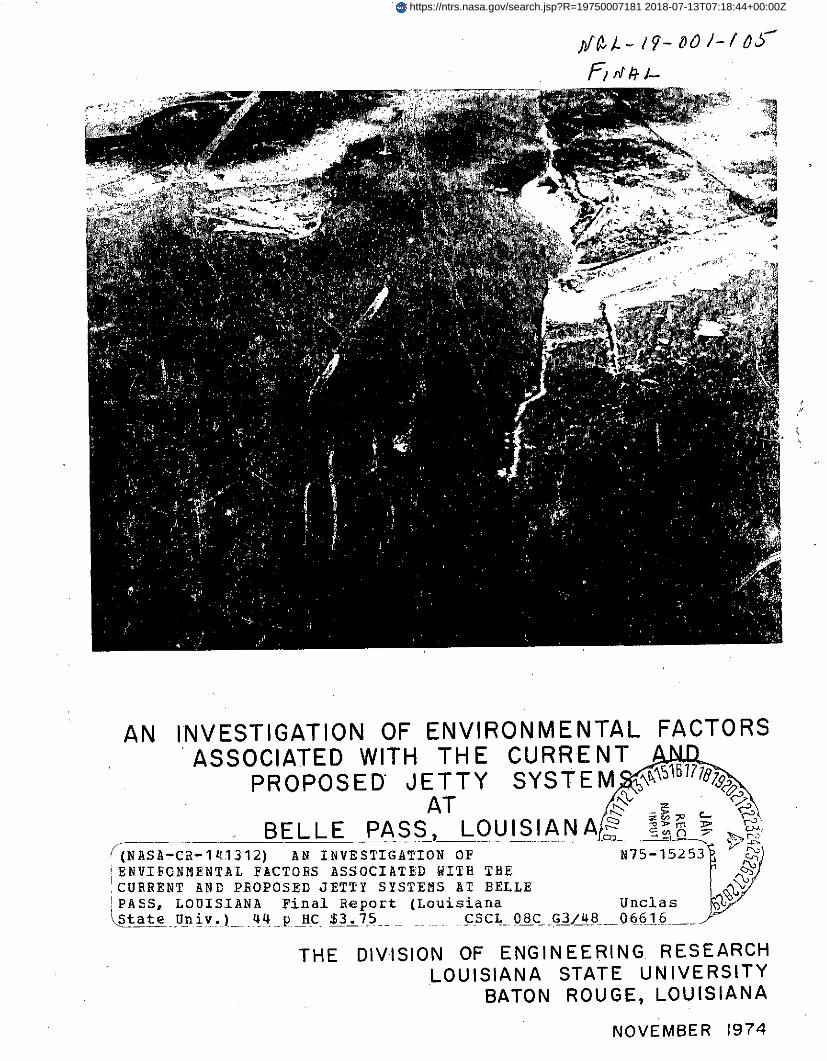
I. INTRODUCTION
The Greater Lafourche Port and Harbor Commission has proposed to improve the
existing jetty system and channel at.Belle Pass, the outlet of Bayou Lafourche,
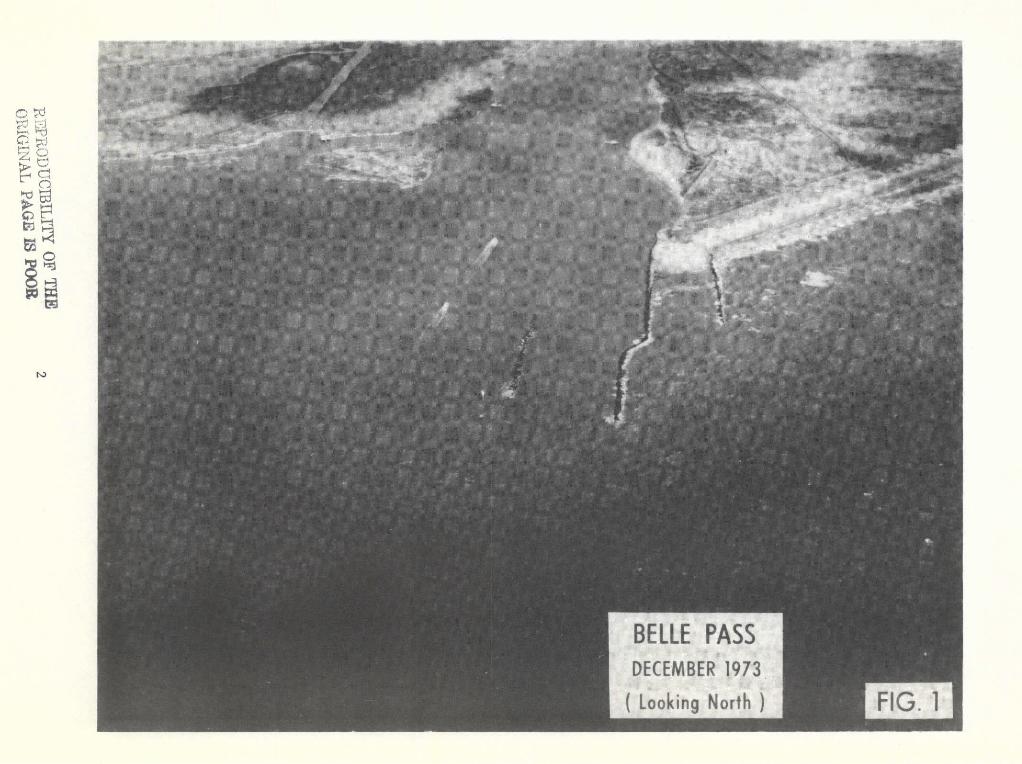
for better navigational access. This outlet (Figure 1) is regularly and heavily
travelled by vessels operated by the petroleum and fishing industries of South
Louisiana. It also serves as an emergency entrance to inland ports when rough
seas, storms, and hurricanes occur in the Gulf of Mexico.
Belle Pass is presently maintained at a depth of 20 feet and protected
by an existing rock jetty on the east side. The proposed improvements consist of
a 1000-foot extension to the existing east jetty, removal of the remnant west
jetty, and construction of a new west jetty to provide a width of 1200 feet.
The channel would also be dredged to a width of 300 feet and a depth of 20 feet
into the Gulf to the 20-foot contour (Figure 2).
The Commission had applied to the U.S. Army Corps of Engineers for the necessary
permit to make the proposed changes to Belle Pass.
Because jetty systems in many cases cause accelerated erosion of the adjoining
shoreline, the Crops of Engineers declined a work permit until the effects of the
proposed changes had been studied.
Jetties and groins disrupt littoral currents, the longshore movement of water
caused by waves breaking at an angle to the shoreline. Beach materials and suspended
sediment from the active surf zone are carried by this current and redeposited on
the shore downdrift. An interruption of longshore transport will generally result
in. accumulation of sand on the updrift side of a jetty or groin and deprivation
of the shore downdrift of the structure. The recession rate on the downdrift side
is determined by the volume of material moved by the littoral current and the pre-
vailing recession rate of the beaches in the same area.
Thus the specific objectives of this study were to:
(1) Determine the history of the existing jetty system, including
its past effect on the littoral currents and beach erosion
(2) Determine the present flow patterns and erosion rates in the
Belle Pass area and the prevailing recession rates of local
beaches not under the influence of the existing jetty systems
(3) Offer alternatives to the proposed jetty design that will reduce
possible detrimental effects
to0
I>3

PROPOSED 20'x 300" CHANNEL
Section Section
IO
Q1
SEast
o z Bank _Bank___
C)
CL West East
0 0
o\,2. 2.5/
I TYPICAL SECTIONa-
120
CHANNEL IMPROVEMENTSPLAN BELLE PASS
0 1000' 2000' LAFOURCHE PARISH, LOUISIANASCALE FIG. 2
3

II. AERIAL PHOTO AND MAP STUDY
Aerial photographs and maps were used in part of the study of the physical
processes in the Belle Pass area. From recent NASA 9 x 9 aerial color photos
and older Corps of Engineer photographs, the direction of littoral drift was
ddtermined by the orientation of the wave trains approaching the shore and from
small visible sediment plumes adjacent to the beach and 'the pass. The photographs
also showed the width of the littoral zone and, to some extent, thevolume of sediment
being transported.
Littoral drift may vary in magnitude and direction as a result of differences
in strength and direction of the wave-generating winds. The photographs were
used to determine variations in littoral currents and beach configuration. They
also demonstrated the effect of ebb tidal flow in the bayou that also deflects
the littoral flow. Because Bayou Lafourche water is characteristically more
turbid and less saline than the gulf water and does not readily mix, its entrance
into the gulf was easily detected on the aerial photographs, particularly in color
and infrared color. Aerial photographs, along with older maps, were used to help
establish the history of the existing jetty system.
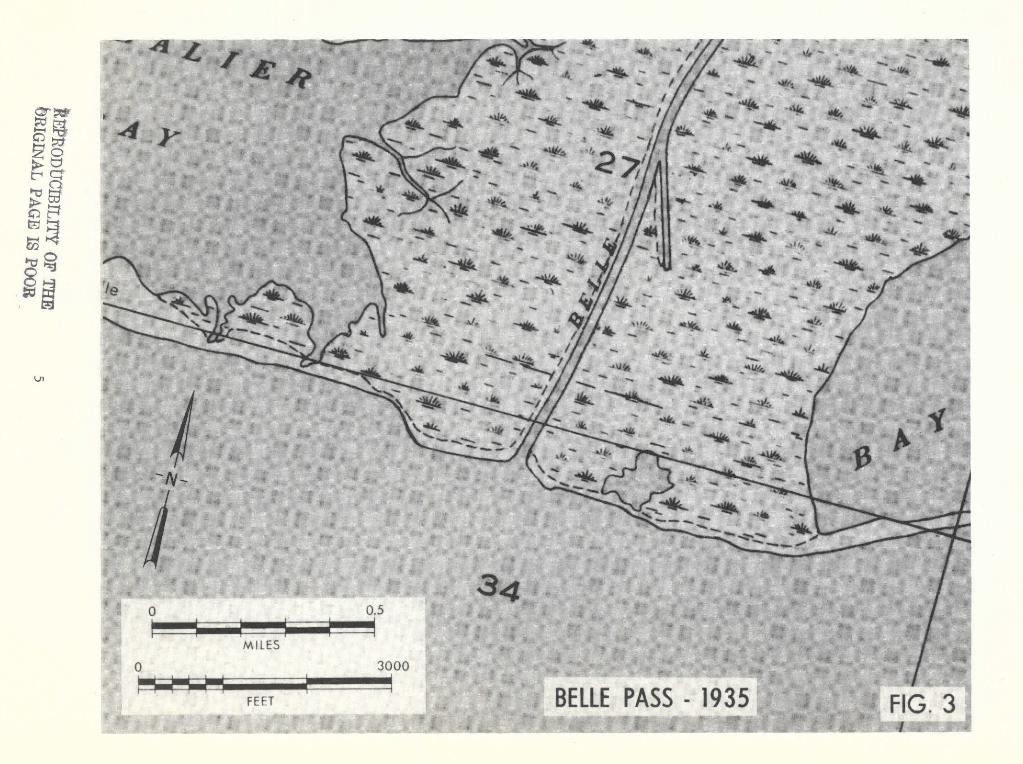
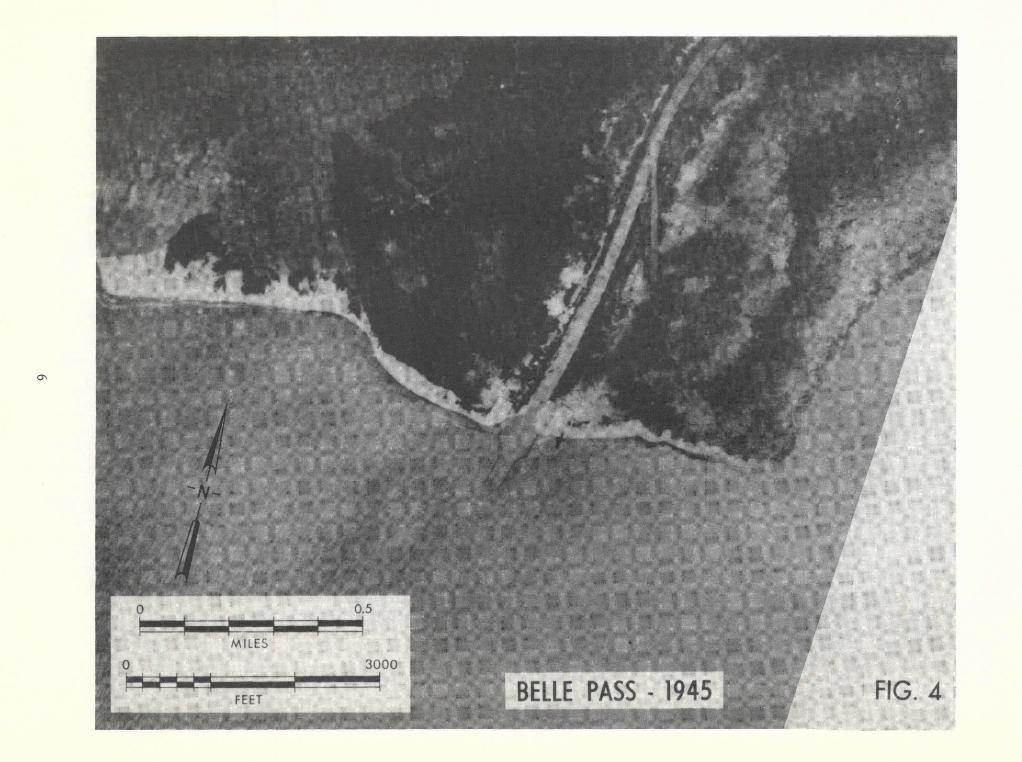
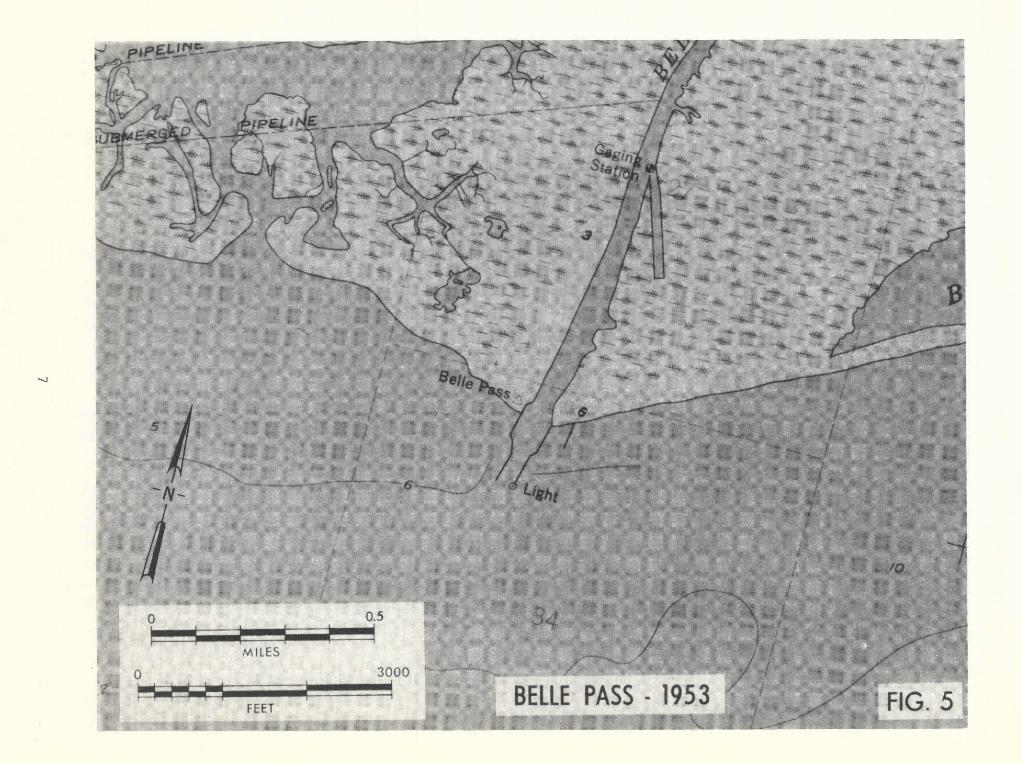
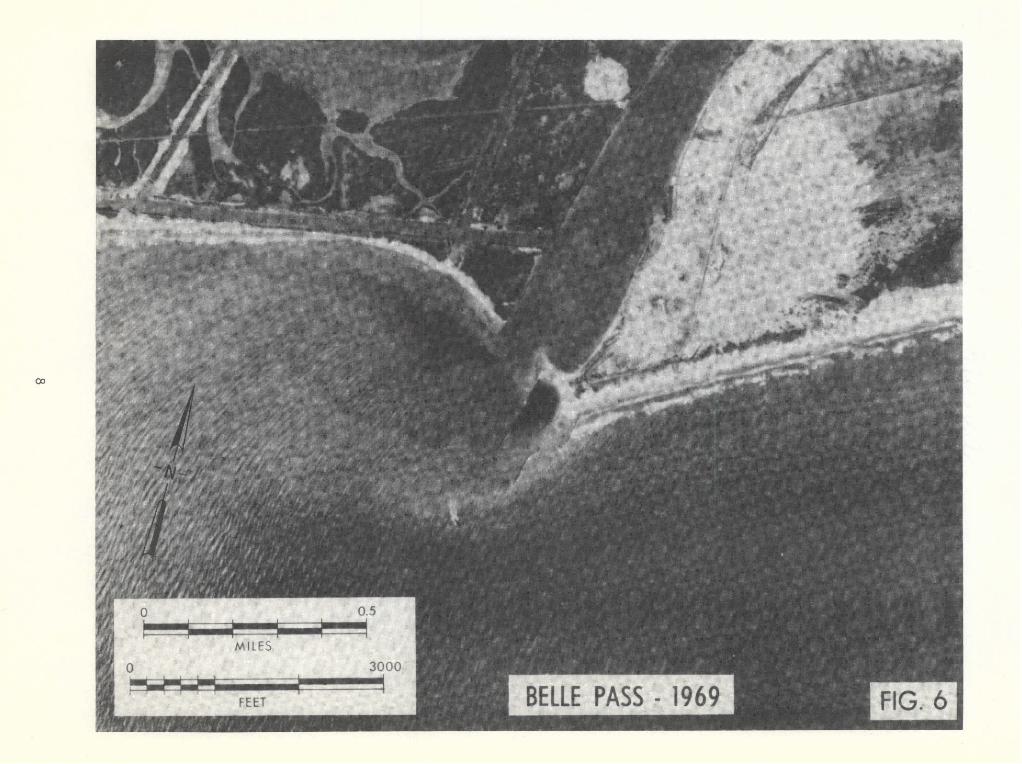
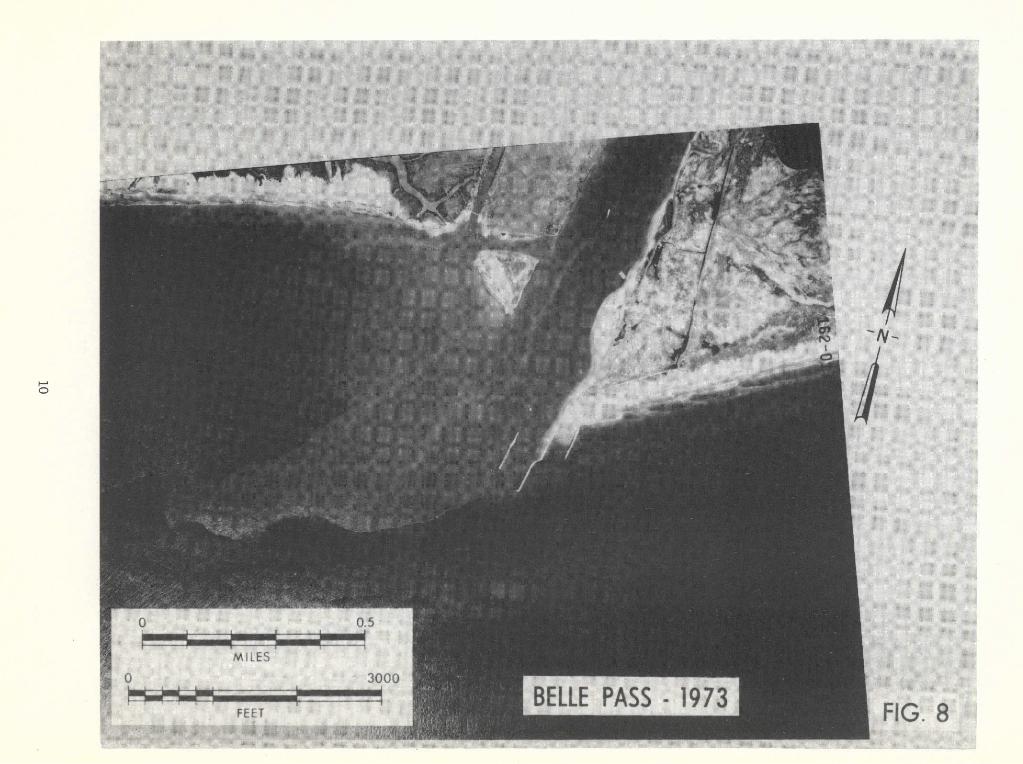
Figures 3 through 8, photographically sized to the same scale, comprise a
pictorial history of the Belle Pass area. Figure 3 (1935) shows the pass before
the installation of the jetties; Figure 4 (1945) shows the jetties after shore-end
extensions; Figure.5 (1953) shows the area after 8 years of beach recession;
Figure 6 (1956) shows the pass after the Corps of Engineers dredged a new channel
west of the old jetty system and an oil company dredged a canal parallel to the
west beach; Figure 7, (1972) and Figure 8 (1973) show the most recent changes.
It is evident from the photographs that the beaches east and west of the jetty
have steadily receded. Later in this section, it will be shown that recession was
occurring before the installation of the jetties and has since occurred at varying
rates, except for the areas immediately adjacent to the channel on the west where
the erosion has apparently been retarded.
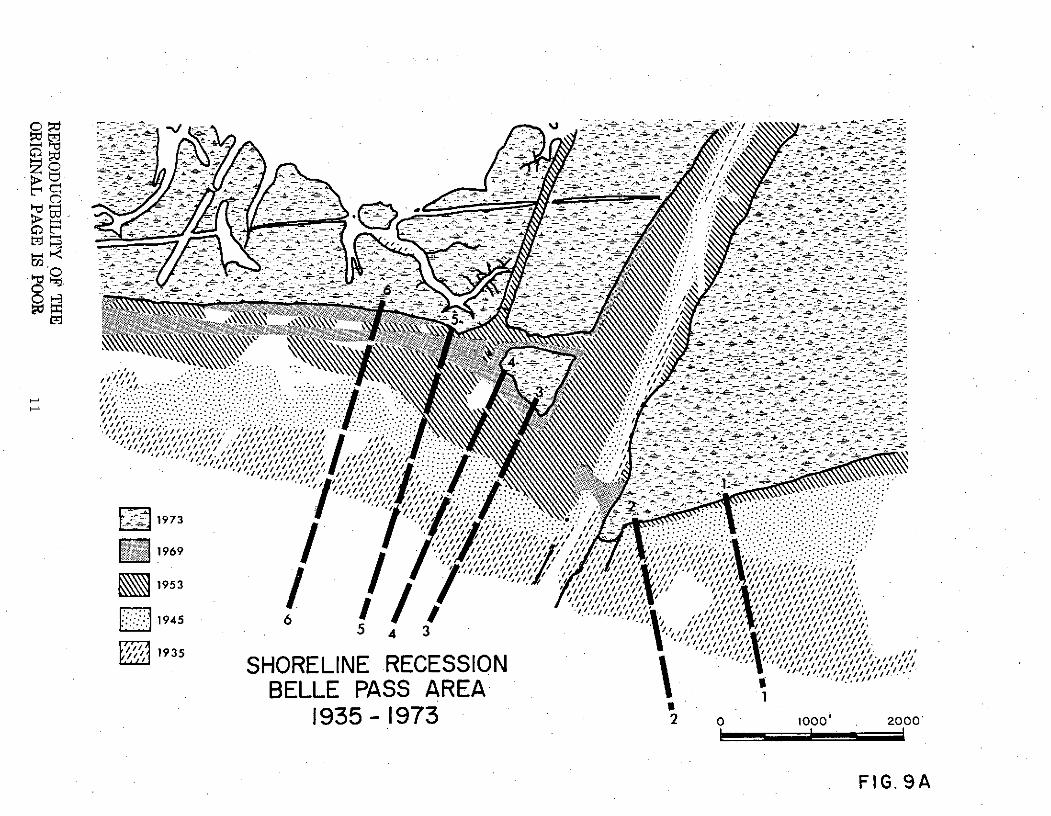
Line tracings from the maps and photographs for 1935, 1945, 1953, 1969, and
September 1973 were drawn to comprise an overlay sequence covering this history
of the jetty. This sequence was then graphically combined (Figure 9A).
The classical effects of a groin or jetty installation are accretion on the
updrift side and recession on the downdrift side. However, accretion has not
occurred at Belle.Pass. Apparently the recession rate has been lessened directly
4
CY)
4k
f lit
Lr)m
41 V
)V
I
LL
Jrv
__jL
LJ
40
At'
to
Ln
Uj
U.J
LL
J
kPRO
DtT
CjB
rLn1,V
- op T
IMbR
IGIN
AL
PAC
E IS po(),j
V.
mg --hook"4
Z iil D .iii~i!li
........... .......... ......
... ..... .. ....... ..
4,iiiiXl! ii~iiiii,,~iii~g ! Tc '!I
AAQ~iii~i~~ 'Y"'~i 'R 'Aniiiliii~iiii~i ! !~
ell
7U
6961 SSVd 11139 Mir,OOK 0
MIMMMMII 0
00
7: W= 11171

EBELLE PASS 1972
MILES3000
BELLE PASS - 1973FEET FIG. 8
~7-'11-- .. . " -... . -- ---- i-. -;.~ :?'-2-2., -2: • --- 4: .
"- i ,7 • -- .- -. 2_ - . - ---- . .:- _
...... ~~~- -- ;- -' L -: -- ££ --- - ' '-
-£ -- -._--
-A
ii' ;..:
'-. I.-,:_-_;
D 1973 f '~,, '
LII1969 /""'' I ~
~'.i 135SHORELINE RECESSION ,,,,,,,-
BELLE PASS AREA:_-
: II
1935-1973 2 1000 2000
FIG. 9A
• -2 __ .-- --£ - _ - . ; % . _& - "2 . -T
'/ ' • " " ... • " : -: *- ' ' -:- --- z -"2- -=: : :- --' ~ ~ / //"" : " """': "" """" . . .. '' -"";";:" ,II/"'J.. "."" ""'...'""'£ '" . '..'Z ".""- ,, : : -.---' " .." " " " : '" " ,;:.:.!; .. '.....- -: - " .... - -: -., ,; : :: ..: :v ''-. ..- .:...; .. ',: :.:': .. ::. .. ... - - - -'- . . . .. ...- --
/,!:"' // :;:--' --:- " .... .. ..-
,,,..,/ //,::: . ,I~ ~ ,,;/ ,"
I, .¢ .. , . , ,;,,_ ,,-. ,-, ,,'.I
L I l llI
I I
,11/FIG gA/111
to the east (Points 1 and 2). There has been much recession on the west side
(Points 3, 4, 5 and 6). If the jetty system had not been installed, it is probable
that the entire shoreline in the area would have been planed back on a line even
with the present west side (Figure 8).
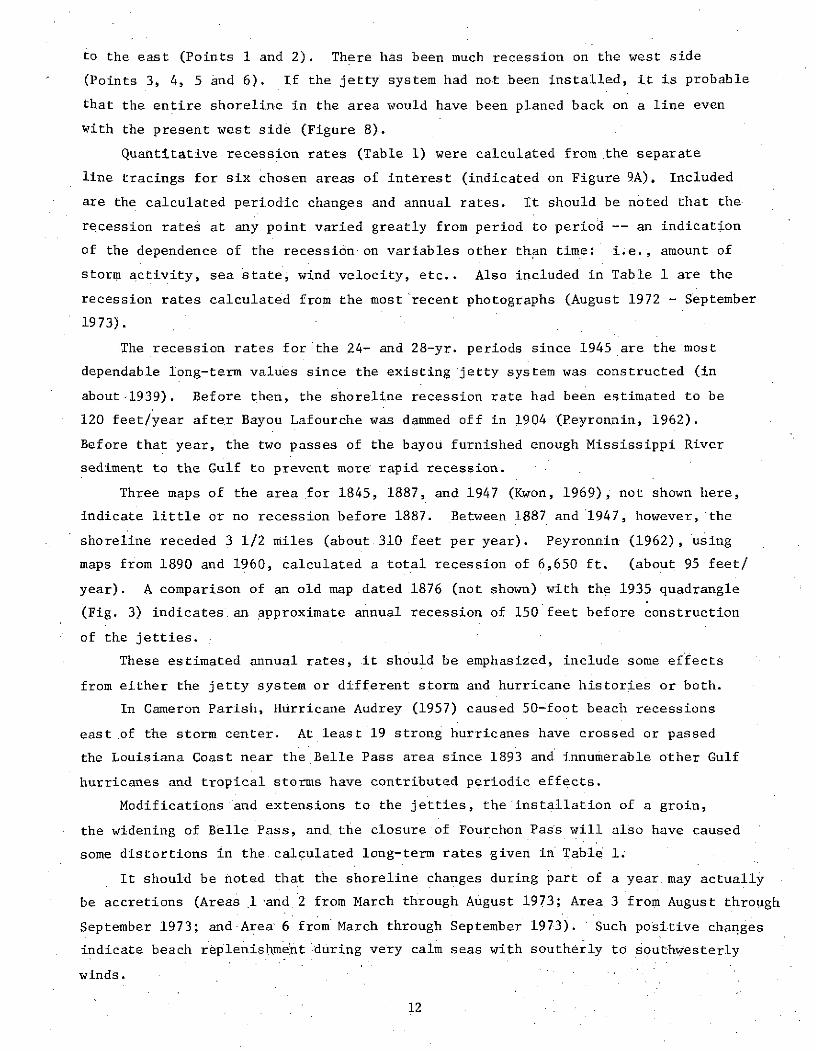
Quantitative recession rates (Table 1) were calculated from the separate
line tracings for six chosen areas of interest (indicated on Figure 9A). Included
are the calculated periodic changes and annual rates. It should be noted that the
recession rates at any point varied greatly from period to period -- an indication
of the dependence of the recession on variables other than time: i.e., amount of
storm activity, sea state, wind velocity, etc.. Also included in Table 1 are the
recession rates calculated from the most recent photographs (August 1972 - September
1973).
The recession rates for the 24- and 28-yr. periods since 1945 are the most
dependable long-term values since the existing jetty system was constructed (in
about-1939). Before then, the shoreline recession rate had been estimated to be
120 feet/year after Bayou Lafourche was dammed off in 1904 (Peyronnin, 1962).
Before that year, the two passes of the bayou furnished enough MississippiRiver
sediment to the.Gulf to prevent more rapid recession.
Three maps of the area for 1845, 1887, and 1947 (Kwon, 1969); not shown here,
indicate little or no recession before 1887. Between 1887 and 1947, however, the
shoreline receded 3 1/2 miles (about 310 feet per year). Peyronnin (1962), using
maps from 1890 and 1960, calculated a total recession of 6,650 ft. (about 95 feet/
year). A comparison of an old map dated 1876 (not shown) with the 1935 quadrangle
(Fig. 3) indicates an approximate annual recession of 150 feet before construction
of the jetties.
These estimated annual rates, it should be emphasized, include some effects
from either the jetty system or different storm and hurricane histories or both.
In Cameron Parish, Hurricane Audrey (1957) caused 50-foot beach recessions
east ,of the storm center. At least 19 strong hurricanes have crossed or passed
the Louisiana Coast near the Belle Pass area since 1893 and innumerable other Gulf
hurricanesand tropical storms have contributed periodic effects.
Modifications and extensions to the jetties, the installation of a groin,
the widening of Belle Pass, and the closure of Fourchon Pass will also have caused
some distortions in the calculated long-term rates given in Table 1.
It should be noted that the shoreline changes during part of a year.may actually
be accretions (Areas 1 land 2 from March through August 1973; Area 3 from August through
September 1973; and Area 6 from March through September 1973). Such positive changes
indicate beach replenishment during very calm seas with southerly to southwesterly
winds.
12
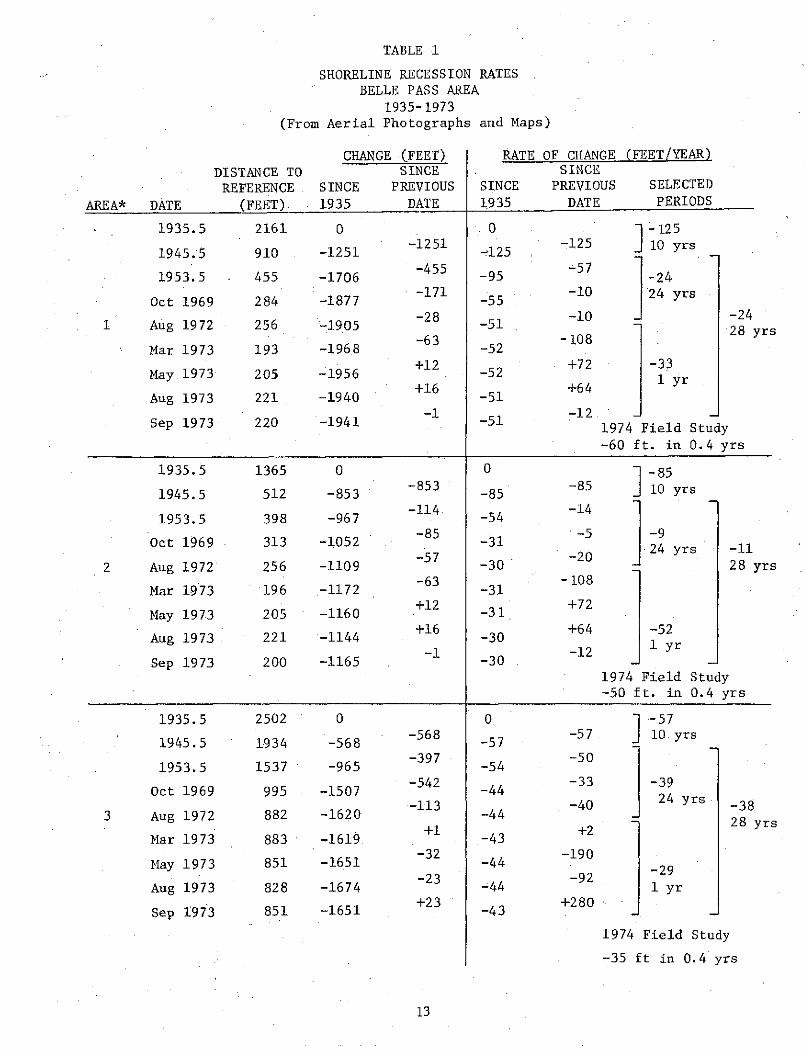
TABLE 1
SHORELINE RECESSION RATES
BELLE PASS AREA
1935-1973
(From Aerial Photographs and Maps)
CHANGE (FEET) RATE OF CHANGE (FEET/YEAR)
DISTANCE TO SINCE SINCE
REFERENCE SINCE PREVIOUS SINCE PREVIOUS SELECTED
AREA* DATE (FEET). 1935 DATE 1935 DATE PERIODS
1935.5 2161 0 0 -125-1251 -125 10 yrs
1945.5 910 --1251 -1255 0 yrs
1953.5 455 -1706 -95 57 -24
Oct 1969 284 -1877 -171 -55 -10 24 yrs
-28 -10 -241 Aug 1972 256 -1905 -51 28 yrs
-63 -108Mar 1973 193 -1968 -52
May 1973 205 -1956 +12 -52 +72 -33
Aug 1973 221 -1940 +16 -51 +64 1 yr
-1 -12Sep 1973 220 -1941 -51 1974 Field Study
-60 ft. in 0.4 yrs
1935.5 1365 0 0 ] -85
1945.5 512 -853 -853 -85 -85 10 yrs
1953.5 398 -967 -114 -54-14
-85 -5 -9Oct 1969 313 -1052 -85 -31 -5 -9
2 Aug 1972 256 -1109 -30 -2028 yrs
Mar 1973 196 -1172 -63 -31 -108
May 1973 205 -1160 -31 +72
Aug 1973 221 -1144 +16 -30 +64 -52
Sep 197.3 200 -1165 -1 -30 -12 1 yr
1974 Field Study
-50 ft. in 0.4 yrs
1935.5 2502 0 0 -57
1945.5 1934 -568 -568 -57 -57 10 yrs
1953.5 1537 -965 -397 -54 -50
-542 -33 -39Oct 1969 995 -1507 -44
-113 -40 24 yrs -383 Aug 1972 882 -1620 -44
- 28 yrs+1 +2Mar 1973 883 -1619 -43
-32 -190May 1973 851 -1651 -44 -29
-23 -92Aug 1973 828 -1674 -44 1 yr
Sep 1973 851 -1651 +23 -43 +280
1974 Field Study
-35 ft in 0.4 yrs
13
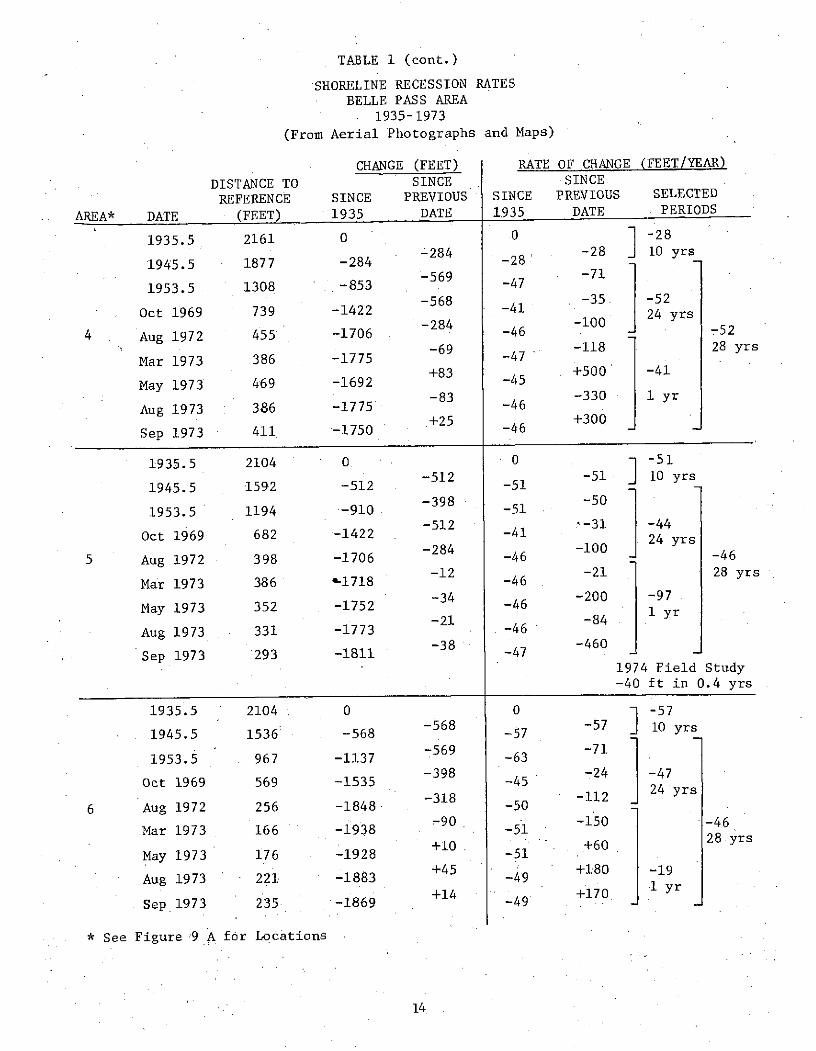
TABLE 1 (cont.)
SHORELINE RECESSION RATESBELLE PASS AREA
1935-1973
(From Aerial Photographs and Maps)
CHANGE (FEET) RATE OF CHANGE (FEET/YEAR)
DISTANCE TO SINCE . SINCE
REFERENCE SINCE PREVIOUS SINCE PREVIOUS SELECTED
AREA* DATE (FEET) 1935 DATE 1.935 DATE PERIODS
1935.5 2161 0 0 1 -28
-284 -28 J 10 yrs1945.5 1877 -284 -28 -
1953.5 1308 -853 -569 -47 -71
-568 -35 -52Oct 1969 739 -1422 -568 -41 24 yrs
4 Aug 1972 455 -1706 -46 -52
Mar 1973 386 -1775 -69 -47 -118 28 yrs
May 1973 469 -1692 +83 -45 +500 -41-83 -330 1 yr
Aug 1973 386 -1775 -46
Sep 1973 411 -1750 +25 46 +300
1935.5 2104 0. 0 -51
-512 -51 10 yrs1945.5 1592 -512 -51
1953.5 1194 -910 -398 -51 -50
Oct 1969 682 -1422 -512 -41 -31 -44
-284 -1005 Aug 1972 398 -1706 -46 -46
-12 -21 28 yrsMar 1973 386 -1718 -46
-34 -200 -97May 1973 352 -1752 -46 -200 1 yr
-21 -84Aug 1973 331 -1773 -46
-38 -460Sep 1973 293 -1811 -47 -460
1974 Field Study
-40 ft in 0.4 yrs
1935.5 2104 0 0 ] -57
1945.5 1536 -568 -568 -57 -57 10 yrs
1953.5 967 -1137 -569 -63 -71
-398 -24 -47Oct 1969 569 -1535 -45-
-318 -112 24 yr
6 Aug 1972 256 -1848 -50yrs
-90 -150 -46Mar 1973 166 -1938 -51
+10 +60 28 yrs
May 1973 176 -1928 -5160 28 yrs
Aug 1973 221 -1883 +45 -49 +180 -19
+14 +170. yrSep 1973 235- -1869 -4970 yr
* See Figure -9 A for Locations
14
It can .be concluded, then, that except for unusual circumstances, the net
changes over periods longer than one year will be recessions varying in magnitude
with wave direction and sea state.
Given the present configuration of the coastline in the Belle Pass area, any
wind-waves approaching the shore from east-northeast to southeast will generate
east-to-west littoral currents (Whitehurst and Self, 1974). Wind and wave statistics
recorded at nearby Grand Isle (Peyronnin, 1962) show that waves from the southeast
are predominant both in height and duration, especially those with heights of 2, 3,
and 4 feet (durations, respectively, of 2200, 1600, and ,540 hrs./yr.). Southeast
winds are predominant also in velocity and duration.
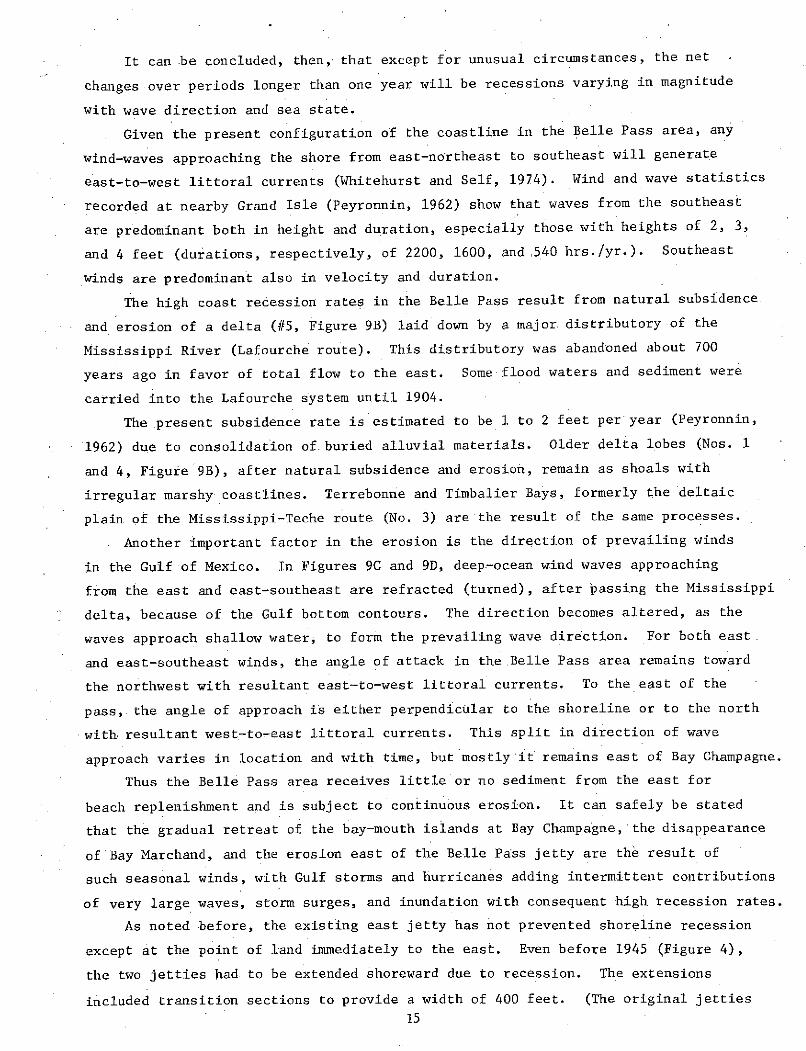
The high coast recession rates in the Belle Pass result from natural subsidence.
and erosion of a delta (#5, Figure 9B) laid down by a major distributory of the
Mississippi River (Lafourche route). This distributory was abandoned about 700
years ago in favor of total flow to the east. Some flood waters and sediment were
carried into the Lafourche system until 1904.
The present subsidence rate is estimated to be 1 to 2 feet per year (Peyronnin,
1962) due to consolidation of.buried alluvial materials. Older delta lobes (Nos. 1
and 4, Figure 9B), after natural subsidence and erosion, remain as shoals with
irregular marshy coastlines. Terrebonne and Timbalier Bays, formerly the deltaic
plain of the Mississippi-Teche route (No. 3) are the result of the same processes.
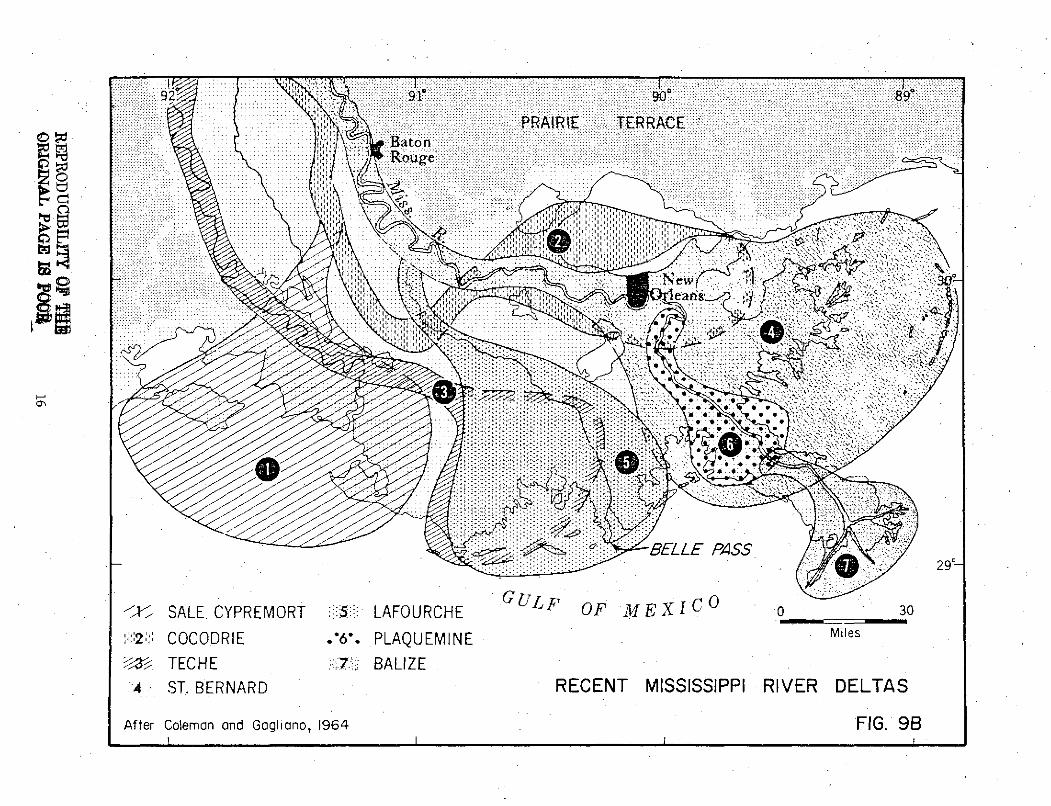
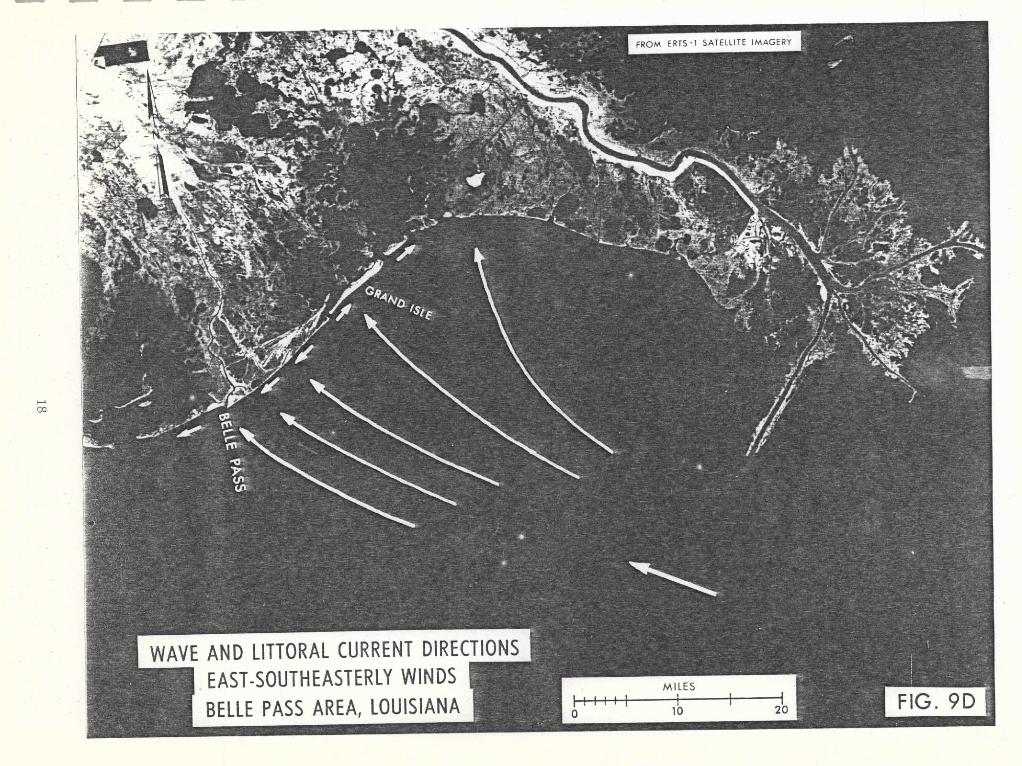
Another important factor in the erosion is the direction of prevailing winds
in the Gulf of Mexico. In Figures 9C and 9D, deep-ocean wind waves approaching
from the east and east-southeast are refracted (turned), after passing the Mississippi
delta, because of the Gulf bottom contours. The direction becomes altered, as the
waves approach shallow water, to form the prevailing wave direction. For both east
and east-southeast winds, the angle of attack in the Belle Pass area remains toward
the northwest with resultant east-to-west littoral currents. To the east of the
pass, the angle of approach is either perpendicular to the shoreline or to the north
with resultant west-to-east littoral currents. This split in direction of wave
approach varies in location and with time, but mostly it remains east of Bay Champagne.
Thus the Belle Pass area receives little or no sediment from the east for
beach replenishment and is subject to continuous erosion. It can safely be stated
that the gradual retreat of the bay-mouth islands at Bay Champagne, the disappearance
of Bay Marchand, and the erosion east of the Belle Pass jetty are the result of
such seasonal winds, with Gulf storms and hurricanes adding intermittent contributions
of very large waves, storm surges, and inundation with consequent high recession rates.
As noted before, the existing east jetty has not prevented shoreline recession
except at the point of land immediately to the east. Even before 1945 (Figure 4),
the two jetties had to be extended shoreward due to recession. The extensions
included transition sections to provide a width of 400 feet. (The original jetties
15
iiiiiiii~ iiiijiixl i ' ' i !' : ' :;i :i :' ' .ii i ':,:::::: :: :::::: :::::, .
.....,,,,,,,, ,, ,,, ,,, ,,,,,. 9 iiiiiill 9 1 ii',', 9 0 - i " .'!='. 'i: , ...PRAIRIE TERRACEBaton
::::::::::::::::::::: I:i:' ~ ~~~~::::i] % , .' .L
Rouge
.~ ~ ~ ~~~ ~~ i:i!::ii:ii::!!::!: 'i::i::i:::ii:ii::i! '..,.... .. ,}i .".' "F.': '
0A
-.:;::i : e :i r iiiiii iii~iiiisii ,.........
i::iii~i:::}: ::::::::::::: ::::: "
• ... !ii:i.i_ i!..ii..::.. BELLE PA SS
• ULF OF M -C 0xSALE CYPREMORT S LAFOURCHE 0oE 30
,,:2: COCODRIE .6. PLAQUEMINE Miles
TECHE 7; "2- BALIZE"4; ST. BERNARD RECENT MISSISSIPPI RIVER DELTAS
After Coleman and Gagliano, 1964 FIG. 9B
, } .,FROM ERTS-1 SATELLITE IMAGERY
EASTERLY WINDSMILESL tBELLE PASS AREA, LOUISIANA Fi
7 10 20
FROM ERTS-1 SATELLITE IMAGERY
MILES
WAVE AND LITTORAL CURRENT DIRECTIONSEAST-SOUTHEASTERLY WINDS MILES
BELLE PASS AREA, LOUISIANA 0 1o 20 FI
were only 200 feet wide.) (Louisiana Dept. of Public Works, 1960)
Between 1945 and 1953, a groin was installed to the east (Figure 5). It
apparently had the desired effect of protecting the shoreward end of the east jetty
(see Figure9A), In 1958, a 500-foot section of.the west jetty was removed and
rebuilt.to provide a width of 320 feet at the Gulf end. Bayou Lafourche was also
dredged and widened.
The east jetty and groin have served as a hinge point for coastline to
the east, with the shore having been planed back from Bayou Moreau to the jetties.
Although the original jetties were constructed perpendicular to the 1939 shoreline
at Belle Pass, at present the east jetty extends into the' Gulf. at an angle of 130
degrees (a 40-degree change in relation to the coastline).. The partial failure
of the jetty to act as a typical accretion structure most probably resulted from
the slow change to an inefficient orientation with respect-to the littoral currents.
Peyronnin (1962) states that the degeneration of the Belle Pass area has been the
main supply of fresh material to the Timbalier Islands and Isles Dermieres.
The lower half of the bayou has been a tidal estuary since 1904, with the
fresh-water from the Donaldsonville pumping station and inflow from Company Canal
and the Intracoastal Waterway having little effect on the flow patterns at Belle
Pass. Suspended sediment is introduced from the Intracoastal Waterway at Larose
and the Southwestern Louisiana Canal at Leeville and from the channel bottom by
boat traffic. Conductivity measurements in 1972 and 1973 also indicated that Gulf
salt water intrudes as far upstream as Larose (Whitehurst, 1974).
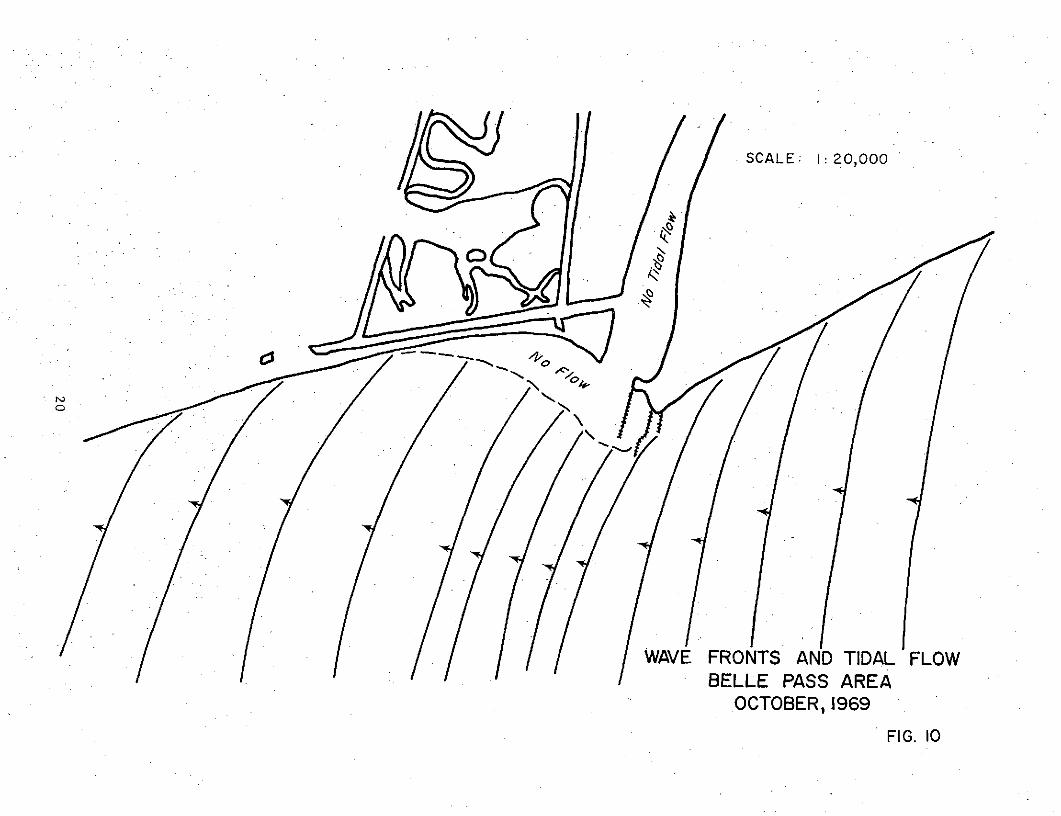
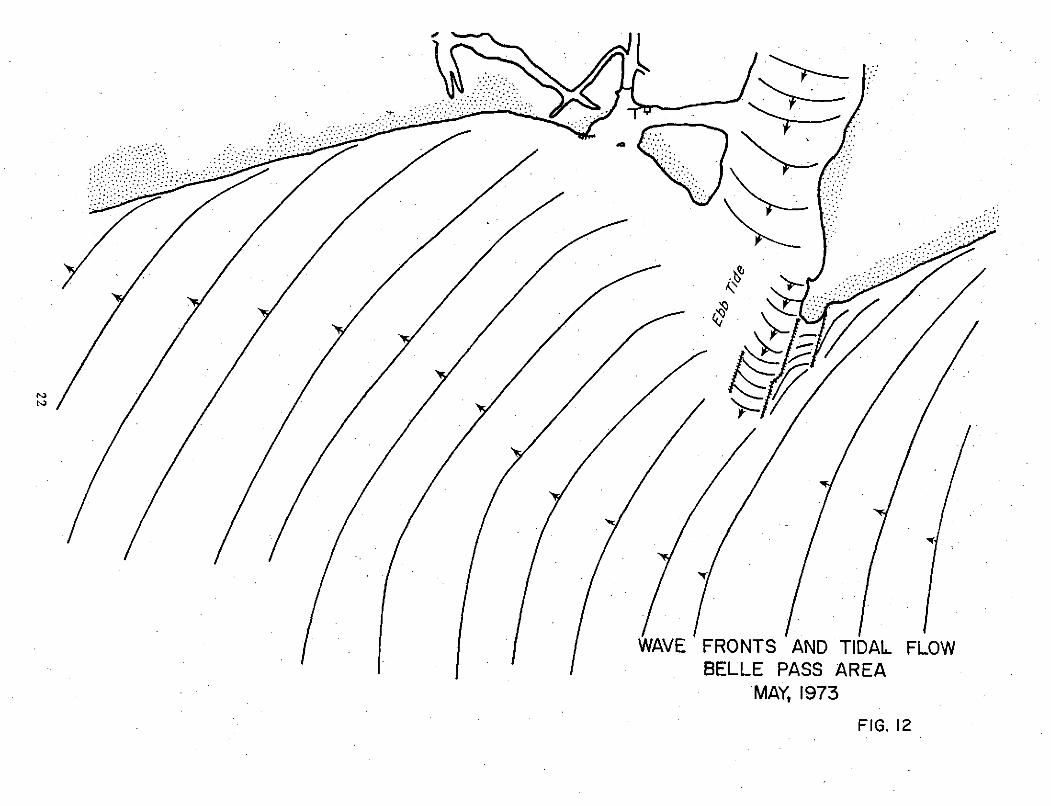
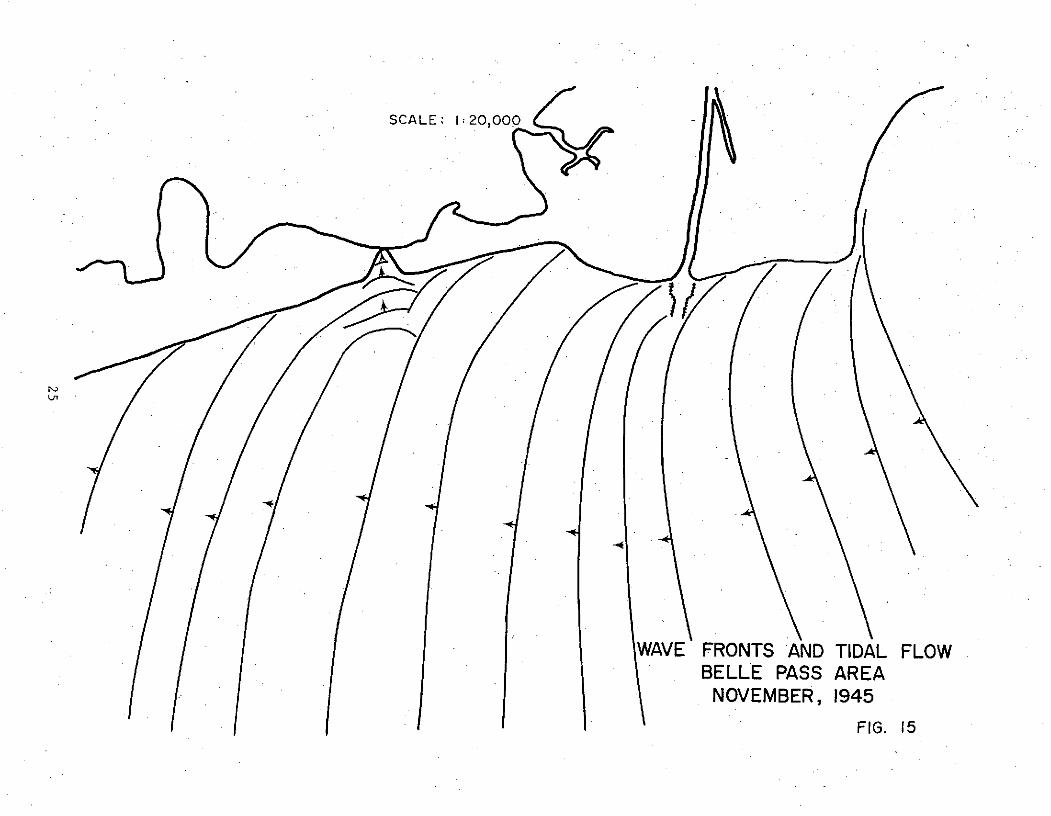
Wave-front and tidal-flow diagrams (Figures 10-17) were traced from the available
aerial photographs. In each photograph, the observable littoral current was moving
from east to west (waves approaching from east-northeast to southeast). However,
each figure demonstrates the variety of conditions resulting from differences in
wave approach, longshore current velocity, and the magnitude and direction of tidal
flow in the pass.
The photographs were also used to study the turbidity patterned by littoral
currents and tidal flows. In October 1969 (Figure 6, Figure 10) the photograph was
taken when there was no tidal flow. This typical case is shown by the indefinite
turbidity in the channel. East-to-west littoral drift is clearly indicated by the.
lines of turbid and clear water along the east shoreline. The turbid water, deflected
around the jetty apparently returns to the nearshore zone at a point just off the
left edge of Figure 6.
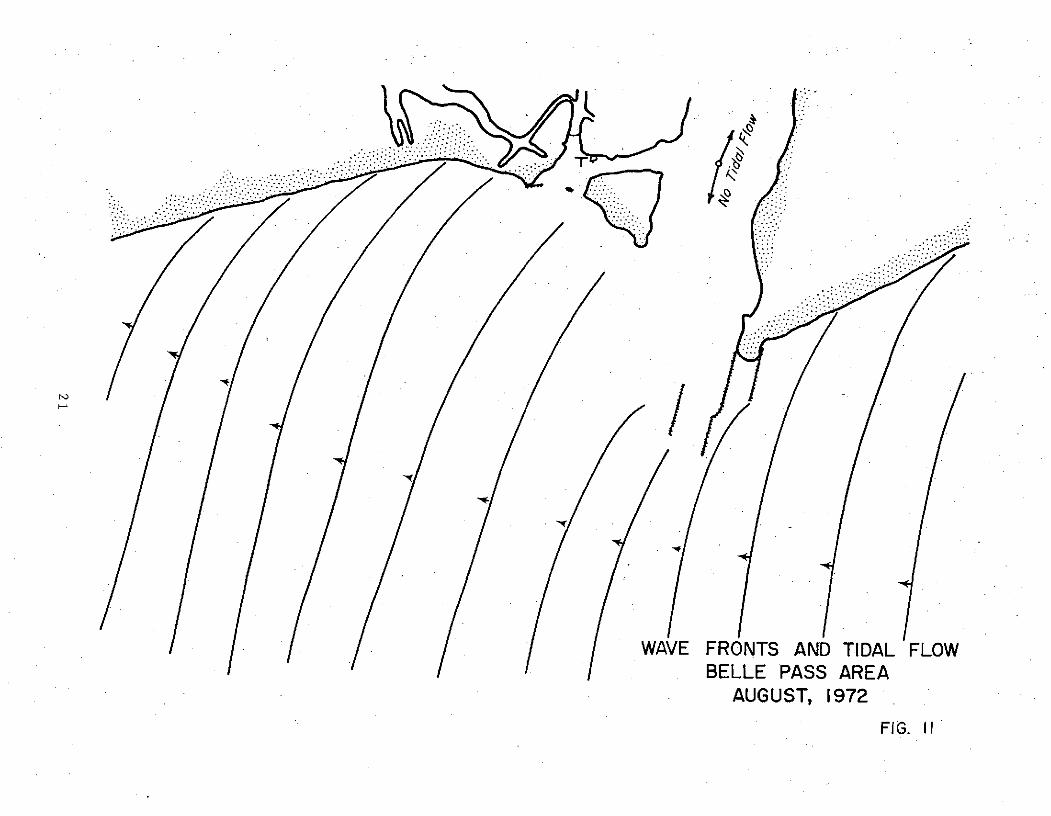
Four other examples show the case of ebb flow with east-to-west littoral drift.
Figure 11 (Also Figure 7) has a distinct zone east of the jetty where sediment is
moving west with the littoral current. Additional sediment is being added west of
19
SCALE: 1: 20,000
WAVE FRONTS AND TIDAL FLOWBELLE PASS AREA
OCTOBER, 1969
FIG. 10
WAVE FRONTS AND TIDAL FLOWBELLE PASS AREA
AUGUST, 1972
FIG. II
WAVE FRONTS AND TIDAL FLOWBELLE PASS AREA
MAY, 1973
FIG. 12
/ 1/7I/ /1/ # / cI .~/~
Wea Fow
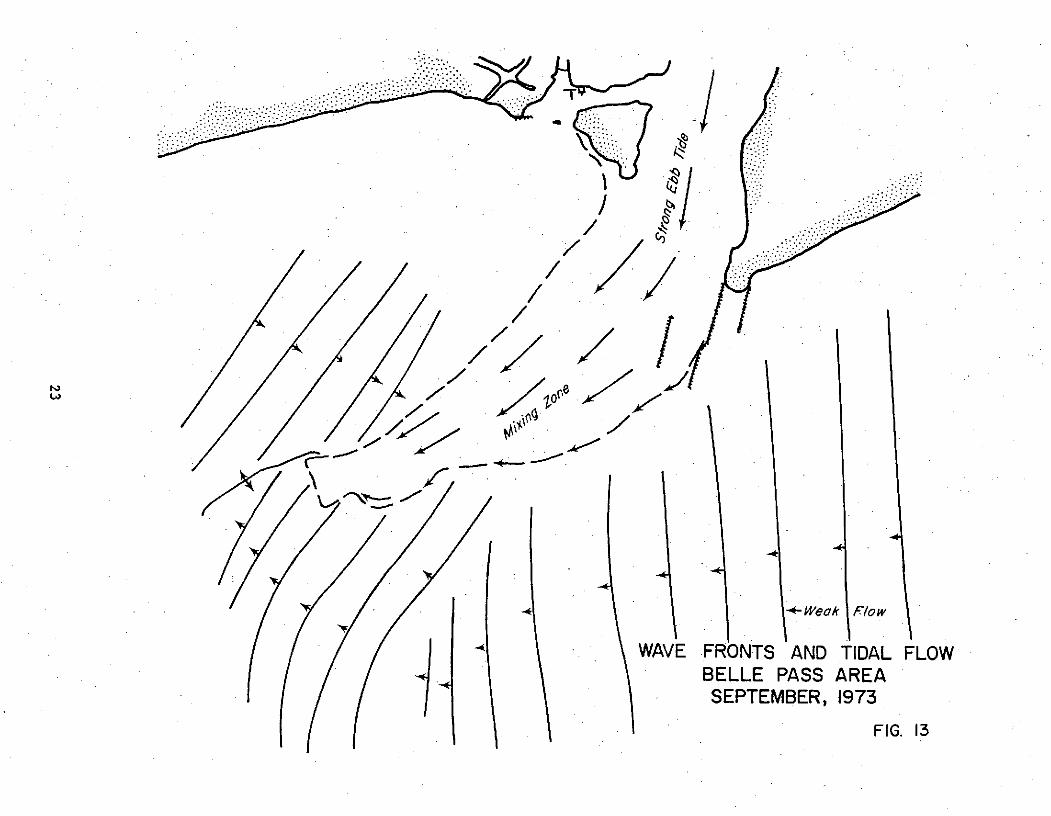
-4 .WAVE .IFRONTS AND TIDAL FLOW
BELLE PASS AREA' SEPTEMBER, 1973
FIG. 13
SEbide SCALE: I= 900'(pprox.)
A
Weok Fow
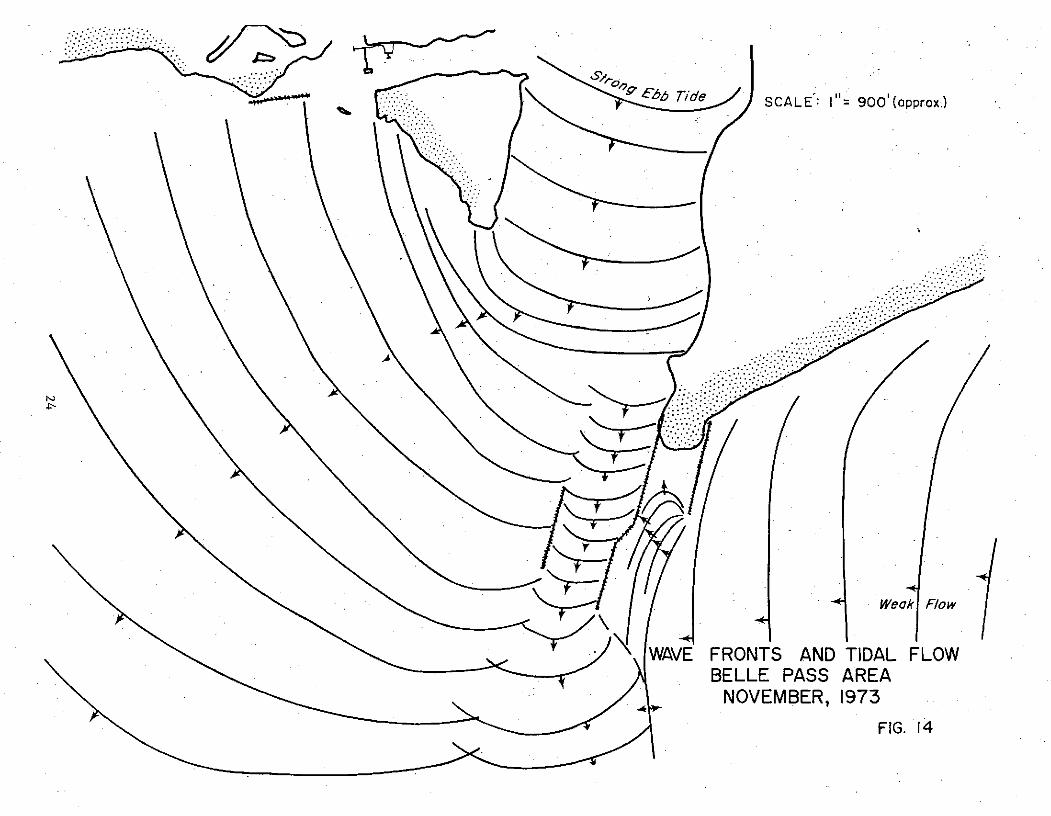
WAVE FRONTS AND TIDAL FLOWBELLE PASS AREA
NOVEMBER, 1973
." FIG. 14..
..-.":-.
NAVE FRONTS AND TIDAL FLOWBELLE PASS AREA
j/ NOVEMBER, 1973
. / FIG. 14
SCALE: 1:20,000
WAVE FRONTS AND TIDAL FLOWBELLE PASS AREA
NOVEMBER, 1945
FIG. 15
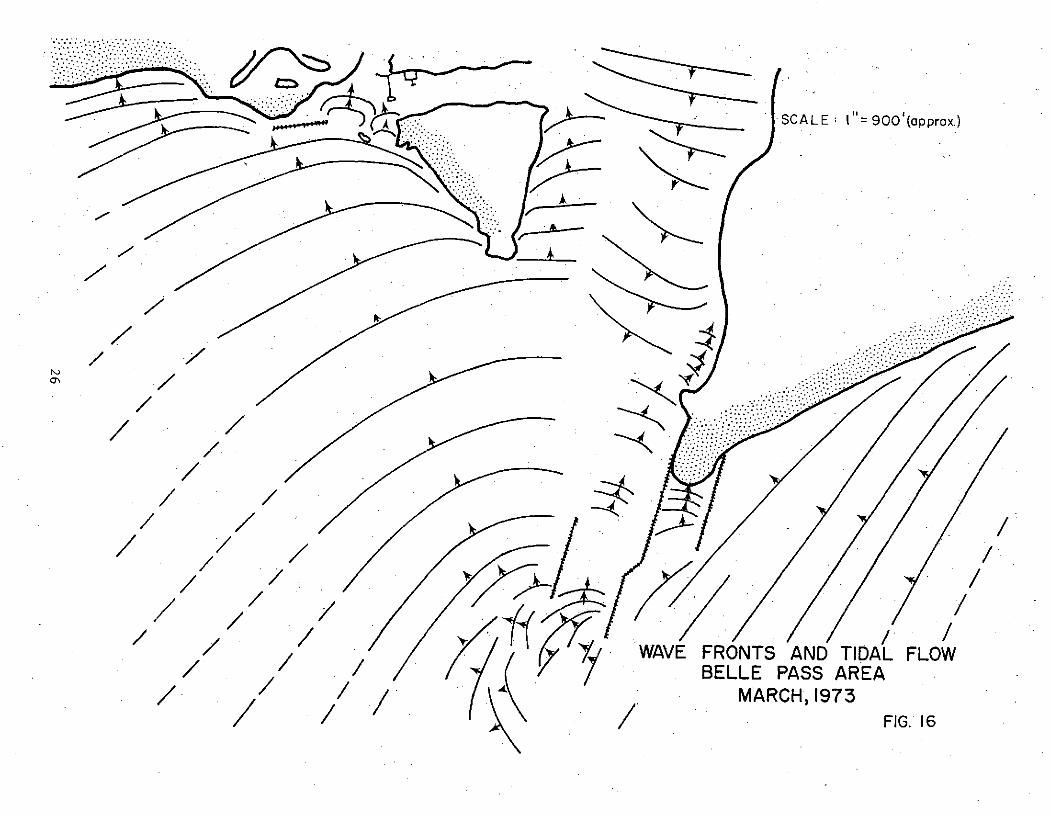
FIG..16
c//
' /
/ MARCH, 1973
/ / / ./ . \ /.FIG. 16
AUGUST 1973
WAVE FRONTS AND TIDAL FLOW \BELLE PASS AREA
AUGUST, 1973. FIG. 17
the jetty by turbid ebb flow from the bayou. Again,. it is also apparent that the
sediment transport zone is returning to shore at a point just off the left limit
of the figure. Figure 12 (May 1973), Figures 8 and 13 (Sept. 1973), and Figure 14
(Nov. 1973) represent the case of strong channel ebb flow with weak or moderate
east-to-west littoral current. When the September photograph was taken, the flow
pattern had not stabilized after reversal of the tide (the ebb flow plume had not
developed fully in the deflected littoral zone).
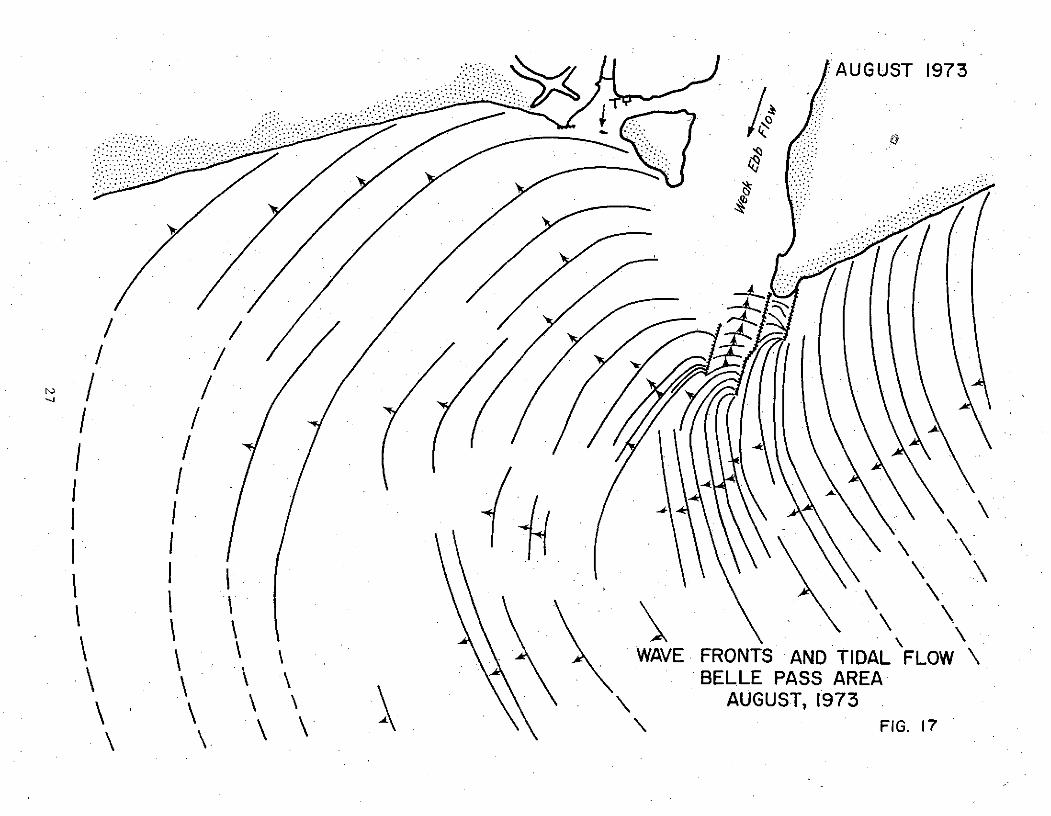
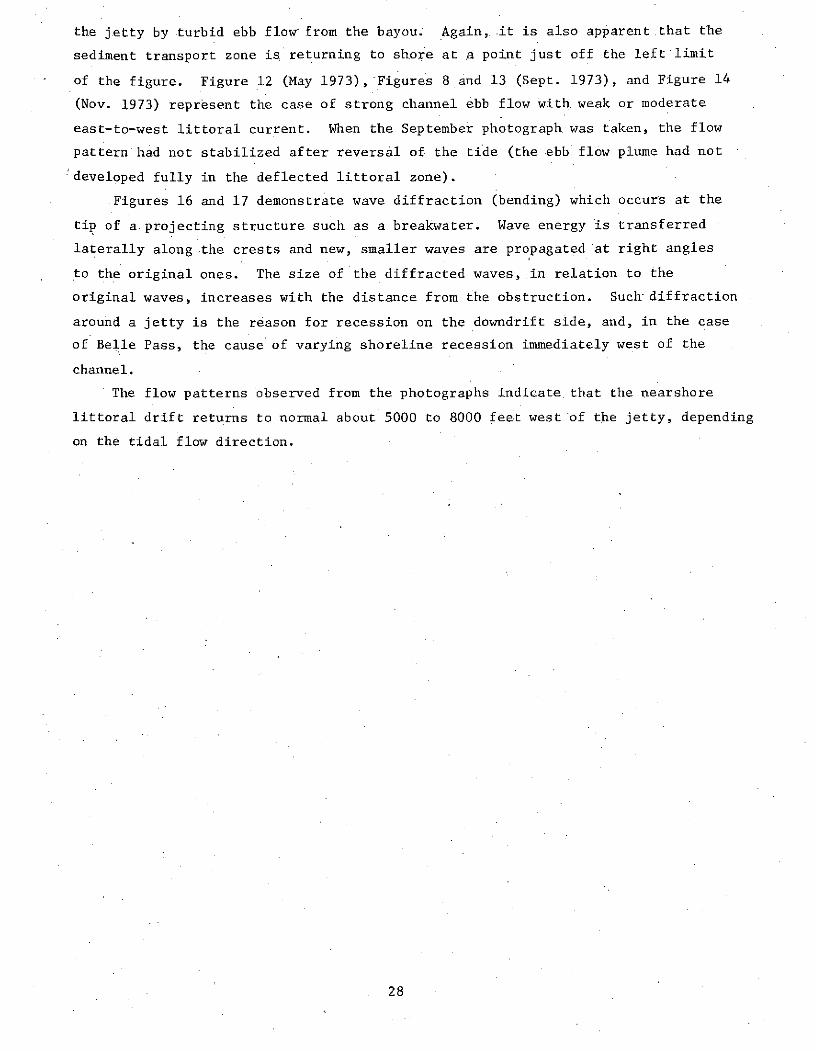
Figures 16 and 17 demonstrate wave diffraction (bending) which occurs at the
tip of a. projecting structure such as a breakwater. Wave energy is transferred
laterally along the crests and new, smaller waves are propagated at right angles
to the original ones. The size of the diffracted waves, in relation to the
original waves, increases with the distance from the obstruction. Such diffraction
around a jetty is the reason for recession on the downdrift side, and, in the case
of Belle Pass, the cause of varying shoreline recession immediately west of the
channel.
The flow patterns observed from the photographs indicate that the nearshore
littoral drift returns to normal about 5000 to 8000 feet west of the jetty, depending
on the tidal flow direction.
28
III. FIELD STUDY
The remote sensing study was supplemented by periodic hydraulic measurements,
ground observations, and physical measurements of beach erosion from January through
June 1974. Littoral flow patterns and velocities were also.observed to verify the
data obtained from the aerial photographs.
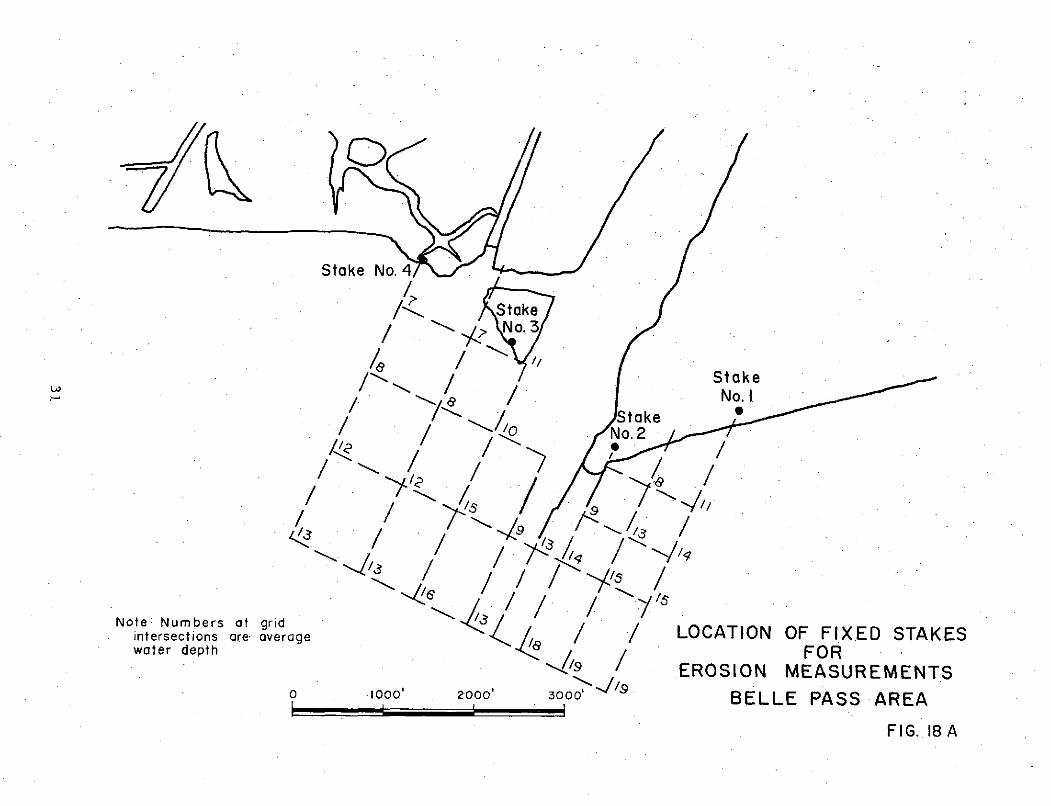
Four reference stakes (1" dia. X 8' steel rods) were.driven into the beaches
both.east and west of the jetty for periodic measurement of shoreline changes.
Stakes No. 1, 3, and 4 were set on January 17, 1974 and Stake No. 2 was driven on
February 2, 1974. (Stake No. 1 had the same approximate location as Area 1 in
Figure 9; No. 2, Area 2; No. 3, Area 3; No. 4, Area 5.) Other natural and man-made
features were also used as guides for measuring or observing changes (Figure 18A).
The erosion data obtained during the field study (Table 2) illustrate seasonal
variations in recession rates. These values are approximate because the location
of the water line at mean sea level had to be estimated. The total.recession for each
stake during the 146-day period, extrapolated to 365.days (third column, bottom) is
large compared to those obtained from the March-September 1973. However, the surf
was unusually rough during the field study period, and on many days, too rough to
obtain data. Probably, the net recessions at the end of 1974 will be less than
those shown and will depend on the weather and seas for the remainder of the year.
Special consideration should be given to the narrow point of land at Stake No. 2
(Figure 18A). Although this area has been in equilibrium since at least 1953, it
was subject to recession during the 1974 field study (-7 feet average, Table 2).
-On August 6, 1974, the distance across the point from shore to channel was only 160
feet. A breach at this point would widen rapidly, with consequent serious shoaling
of the channel at the north end of the existing jetty.
Wave action on the mud spoil banks of the remnant oil company canal and tidal
flow north of the small island at the west side of the pass during the 5-month field
study continued to threaten the oil storage facility and concrete dam in this area.
The dam was undermined and became ineffective. Muddy surf water, overrunning the
beach, entered the backlying marsh streams and ponds and caused many fish to leave
for clearer waters.
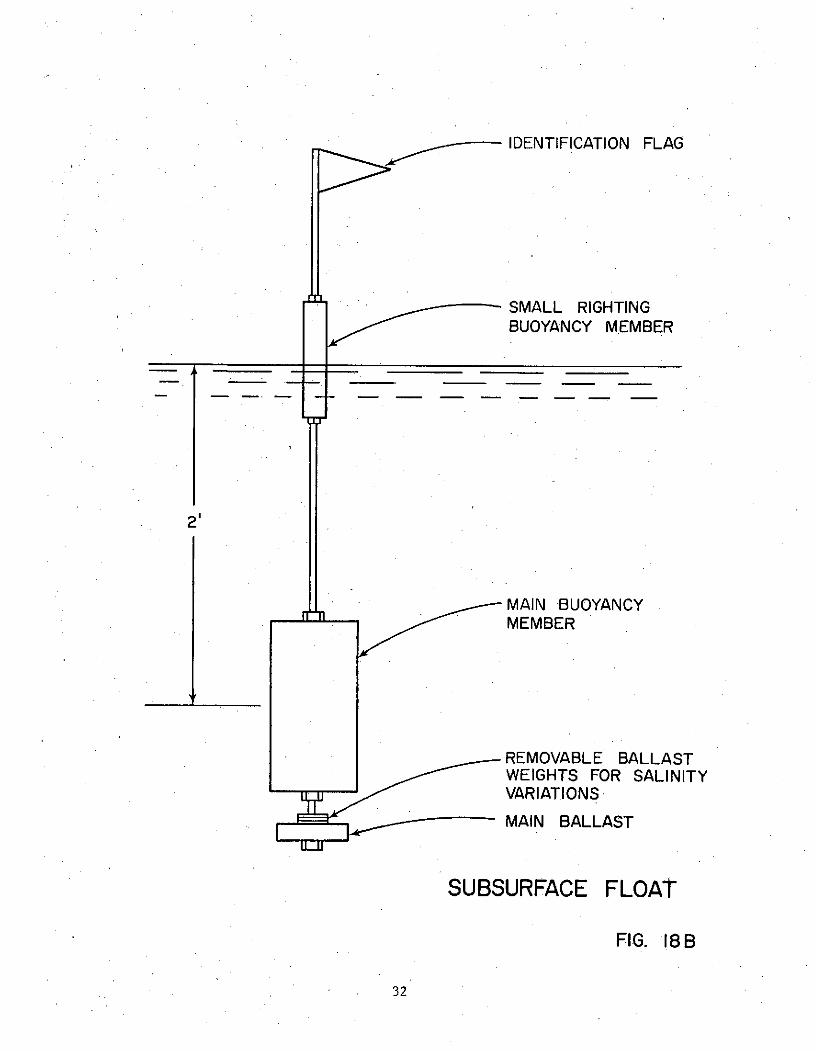
The other objective of the field study was the obtaining of hydraulic data to
supplement and verify the photographic 'data. A special subsurface 'float (Figure 18B)
was designed and fabricated to observe the littoral currents passing around the jetty.
29
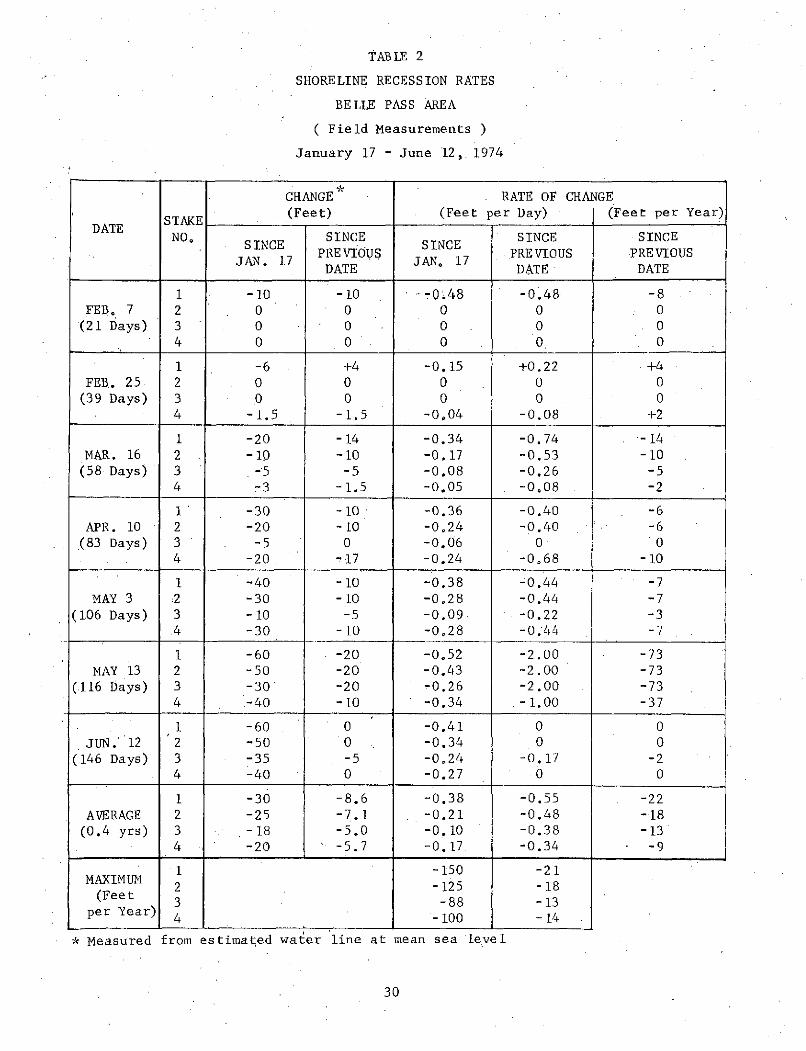
TABLE 2
SHORELINE RECESSION RATES
BELLE PASS AREA
( Field Measurements )
January 17 - June 12, 1974
CHANGE RATE OF CHANGE
DATE STAE (Feet) (Feet per Day) (Feet per Year)
NO. SINCE SINCE SINCESINCE PREVIOUS SINCE PREVIOUS PREVIOUS
JAN 17 JAN° 17JAN. 17 DATE 17 DATE DATE
1 -10 -10 - -0.48 -0.48 -8FEB. 7 2 0 0 0 0 0
(21 Days) 3 0 0 0 0 04 0 0 0 . 0. O0
1 -6 +4 -0.15 +0.22 +4FEB. 25 2 0 0 0 0 0(39 Days) 3 0 0 0 0 0
4 -1.5 -1.5 -0.04 -0.08 +2
1 -20 -14 -0.34 -0.74 -14MAR. 16 2 -10 -10 -0.17 -0.53 -10
(58 Days) 3 -5 -5 -0.08 -0.26 -54 -3 -1.5 -0.05 -0.08 -2
1 -30 -10 -0.36 -0.40 -6APR. 10 2 -20 -10 -0.24 -0.40 -6
(83 Days) 3 -5 0 -0.06 0 0
4 -20. -17 -0.24 -0.68 -10
1 -40 -10 -0.38 -0.44 -7
MAY 3 2 -30 -10 -0.28 -0.44 -7
(106 Days) 3 -10 -5 -0.09 -0.22 -34 -30 -10 -0.28 -0.44 -7
1 -60 -20 -0.52 -2.00 -73
MAY 13 2 -50 -20 -0.43 -2.00 -73
(116 Days) 3 -30 -20 -0.26 -2.00 -73
4 -40 -10 -0.34 -1.00 -37
1 -60 0 -0.41 0 0JUN. 12 2 -50 0 -0.34 0 0
(146 Days) 3 -35 -5 -0.24 -0.17 -24 -40 0 -0.27 .0 0
1 -30 -8.6 -0.38 -0.55 -22
AVERAGE 2 -25 -7.1 -0.21 -0.48 -18(0.4 yrs) 3 -18 -5.0 -0.10 -0.38 -13
4 -20 -5.7 -0.17 -0.34 -9
1 -150 -21MAXIMUM
2 -125 -18(Feet 3 -88 -13
per Year) 4 -100 -14
* Measured from estimated water line at mean sea level
30
Stake No. 4
"/ StStkeN o. 3
/ / St ke/No. N
/ take' l~o No. 2
/ / /L /"
Note: Numbers at grid /intersections are average / LOCATION OF FIXED STAKESwater depth. FOR
"-.9 / EROSION MEASUREMENTSS1000 2000' 3000 BELLE PASS AREA
FIG. 18 A
IDENTIFICATION FLAG
SMALL RIGHTINGBUOYANCY MEMBER
2'
MAIN BUOYANCYMEMBER
REMOVABLE BALLASTWEIGHTS FOR SALINITYVARIATIONS
MAIN BALLAST
SUBSURFACE FLOAT
FIG. 18B
32
The float, designed so that the surface winds would have very little effect on its
drift path, moved with the littoral current, both in speed and direction.
The float, released east of the jetty, was followed as it passed around the end
of the jetty and its speed measured at intervals to establish velocities along thestreamline. On February 25, 1974, the float was used to obtain a typical streamline.
This line is also typical of the flow obtained from the aerial photographs. The,results from the float test were used to verify the physical model discussed in thenext section.
33
IV. MODEL STUDY
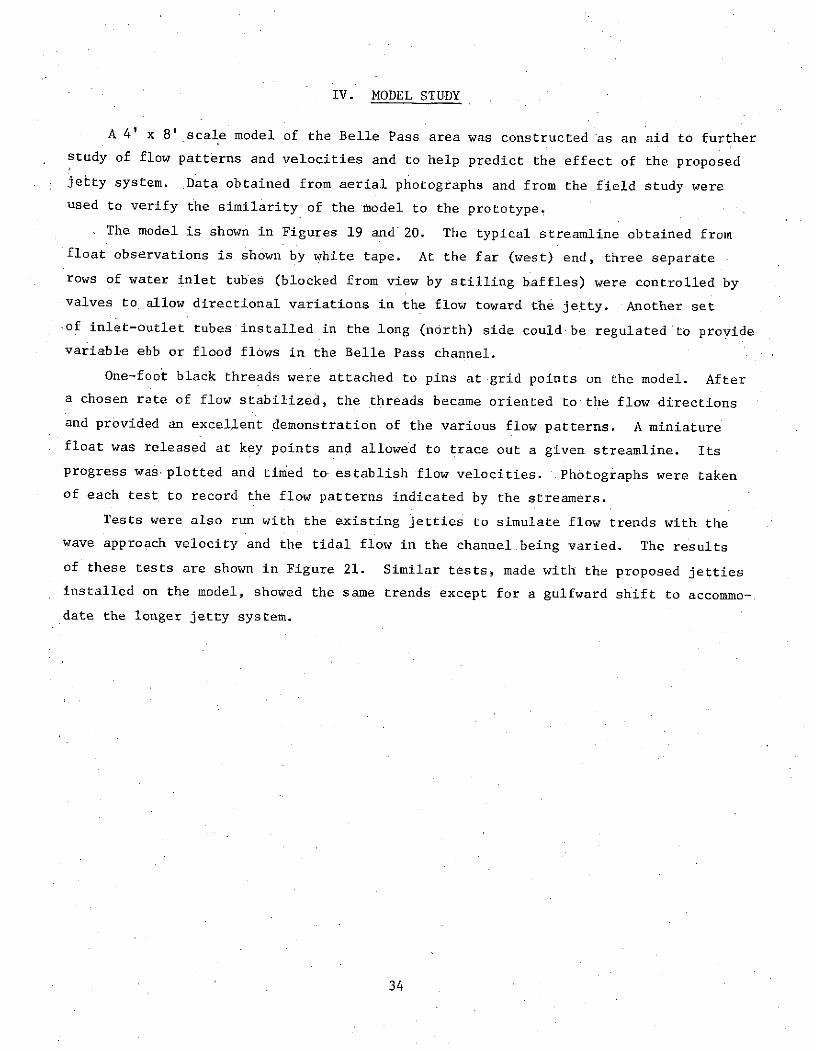
A 4' x 8' scale model of the Belle Pass area was constructed as an aid to further
study of flow patterns and velocities and to help predict the effect of the proposed
jetty system. Data obtained from aerial photographs and from the field study wereused to verify the similarity of .the model to the prototype.
The model is shown in Figures 19 and 20. The typical streamline obtained from
float observations is shown by white tape. At the far (west) end, three separate
rows of water inlet tubes (blocked from view by stilling baffles) were controlled byvalves to allow directional variations in the flow toward the jetty. Another set
of inlet-outlet tubes installed in the long (north) side could be regulated to provide
variable ebb or flood flows in the Belle Pass channel.
One-foot black threads were attached to pins at grid points on the model. After
a chosen rate of flow stabilized, the threads became oriented to the flow directions
and provided an excellent demonstration of the various flow patterns. A miniature
float was released at key points and allowed to trace out a given streamline. Its
progress was plotted and timed to establish flow velocities. .Photographs were taken
of each test to record the flow patterns indicated by the streamers.
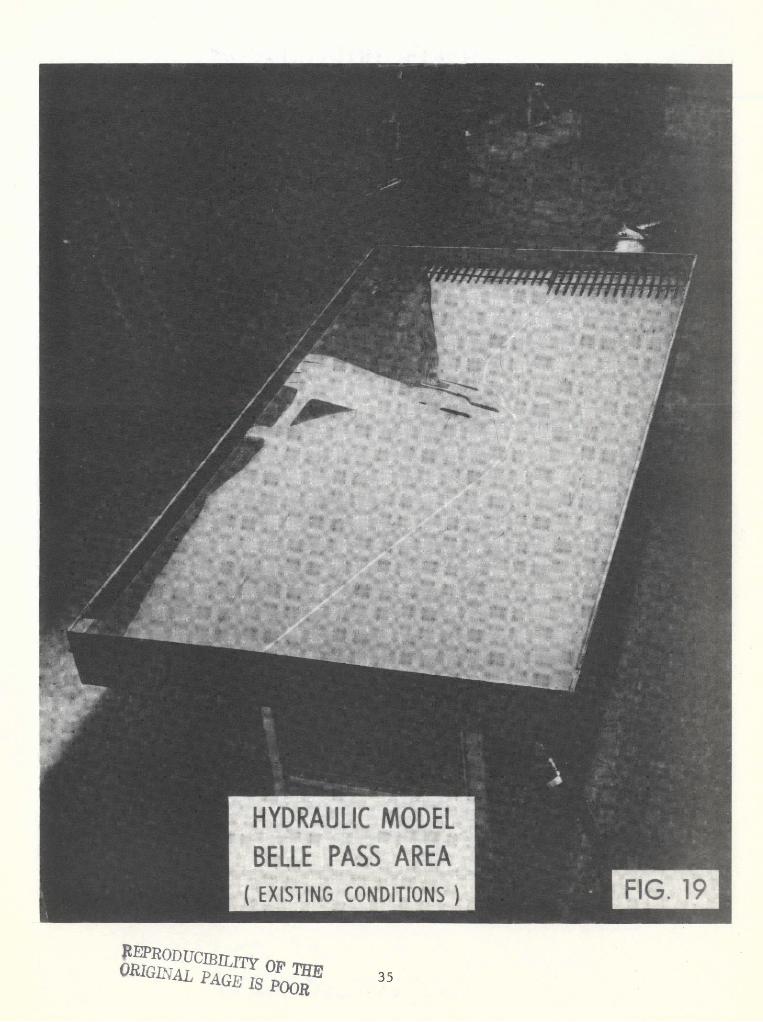
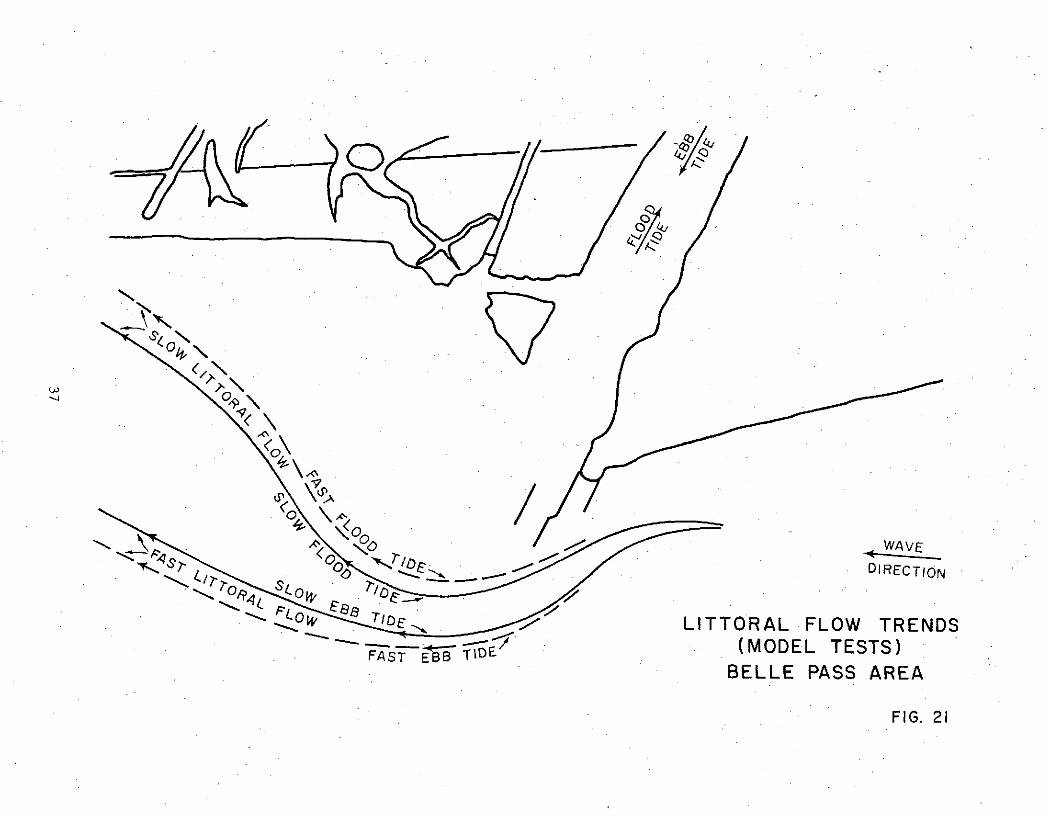
Tests were also run with the existing jetties to simulate flow trends with the
wave approach velocity and the tidal flow in the channel.being varied. The results
of these tests are shown in Figure 21. Similar tests, made with the proposed jetties
installed on the model, showed the same trends except for a gulfward shift to accommo-
date the longer jetty system.
34
HYDRAULIC MODELBELLE PASS AREA
(EXISTING CONDITIONS )
*RPRODUCMLITy OF T 35
O-RIGIDAL PAGE IS POOR

HYDRAULIC MODELBELLE PASS AREA
(WITH PROPOSED JETTY MODIFICATIONS )
REPRODUCIBILITY OF THEjUc.iAT, PAGE IS POOR 36
<O \
BELLE PASS AREA
FIG. 21FIG. 21

V. CONCLUSIONS AND RECOMMENDATIONS
Comparisons of maps and aerial photographs from 1935 to September 1973 have
shown that the existing jetty at Belle Pass has not adversely affected the coastline
in the area. Before the construction of the original jetties, the shoreline recession
had been estimated by several investigators, who used very old coastal charts, to
be between 95 and 150 feet per year.
The.Belle Pass area is part of a remnant deltaic plain that has undergone
erosion and subsidence during the past 600 or 700 years. At an undefined point east
of the jetty, the longshore current, caused by generally southeast waves, changes
direction, with flow from east to west toward the jetty and the Timbalier Islands
and from west to east toward Grand Isle. Thus the coastline between Belle Pass
and Bay Champagne during most of the year is an unreplenished feeder for beach materials
in both directions.
The existing jetty and its companion groin apparently have greatly retarded
erosion in the area immediately to the east. Between 1945 and 1973, the point of land
at the east jetty receded 11 feet (average) per year. Farther east (1000 feet), the
recession amounted to 24 feet annually.
West of Belle Pass, the rate was higher. The remnant island receded at a varying
rate (38 to 52 feet per year). Farther west, the recession rate apparently becomes
evened out to 46 feet per year.
If these average rates for the last 28 years are unquestioned, then it can safely
be assumed that the present jetty system has played a major role in the reduced rate
of recession at Belle Pass.
Aerial photo interpretation and field observations showed that most eastward-
flowing littoral material bypasses the jetty and becomes redeposited west of the pass.
(One reason for the bypassing may be the inefficient orientation of the jetty with
the east shoreline.) At ebb tide, the materials mix with suspended sediment from
Bayou Lafourche. The deposition area varies from 5000 to 8000 feet to the west,
depending on ebb or flood tide flow in the channel, and the strength of the littoral
current.
Tests on a scale model of the Belle Pass area, with the proposed jetty system
in place, indicated that the same bypass conditions would occur. The littoral materials,
although deflected farther out by the extended jetty, would be redeposited to the
west in the same area as they are now. There is a slight possibility that the proposed
east jetty could accumulate some littoral material, even though the orientation with
respect to the shoreline is inefficient for the purpose.
38
Shoreline erosion west of Belle Pass will continue at the present rate from natural
processes. The 1200-ft. dike extension on the proposed west jetty will retard wave
action on the remnant island and at the mouth of the north-south canal to the west.
A shoreward extension of the existing east jetty and its companion groin should
be included, either as part of the proposed construction or as a separate project.
A possible breach of the narrow point, especially during storm waves, would result
in serious shoaling of the pass.
The study further indicates that the proposed jetty system will offer a much
needed safety factor to navigation in and out of Belle Pass at times of rough seas.
39
VI. REFERENCES
Bruun, Per, 1966, Tidal Inlets and Littoral Drift, H. Skipnes Offsettrykker,Trondheim, Norway.
Coleman, James P. and Gagliano, Sherwood M., 1964, Cyclic Sedimentation inthe Mississippi River Deltaic Plain, 1974, Trans. Gulf Coast Assoc.of Geol. Soc., XIV, Corpus Christi.
Kwan, Hyuck J., 1969, Barrier Islands of the Northern'Gulf of Mexico Coast:Sediment Source and Development, Coastal Studies Institute Tech. ReportNo. 75, LSU, Baton Rouge, pp. 26-32.
Louisiana Department of Public Works, 1960, Biennial Report, 1950-1958,Baton Rouge, pp. 191-192.
Morgan, James P., and Larimore, Philip B., 1957, Changes in the LouisianaShoreline, Transactions of the Gulf Coast Association of GeologicalSocieties, Vol. VII.
Morgan, James P., 1972, Impact of Subsidence and Erosion on Louisiana CoastalMarshes and Estuaries, Proc. of the Second Symposium on Coastal Marsh andEstuary Management, July 17-18, 1972, LSU, Baton Rouge, pp. 217-233.
Peyronnin, Chester A., Jr., 1962, Erosion of Isles Dernieres and TimbalierIslands, Proc. ASCE, Journal of the Waterways and Harbors Div., PaperNo. 3048, Feb. 1962
Shore Protection, Planning and Design, 1966, Army Coastal Engineering ResearchCenter, Washington, (Report Number AD 750 451).
Terich, Thomas, and Komar, Paul D., 1973, The Development and Destructionof Bayocean Spit, Oregon, Proc. 3rd Annual Technical Conferences - Estuariesof the Pacific Northwest, March 15-16, 1973.
Whitehurst, C.A., 1974, A Parametric Study of Water Resources Variables inDelta Region of South Louisiana -- Bayou Lafourche, Technical Report to theOffice of Water Resources Research, Division of Engineering Research, LSU,February, 1974.
Whitehurst, Charles A., and Self, R.P., 1974, Sediment Transport and Erosionin the Fourchon Area of Lafourche Parish, Division of Engineering Research
Monograph No. RM-3, LSU, Baton Rouge, May 1974.
40