Embed Size (px)
Citation preview

Louisiana State UniversityLSU Digital Commons
LSU Historical Dissertations and Theses Graduate School
1988
An Investigation of Internal Auditor Judgment onthe Importance of Indicators of Potential FinancialFraud: An Analytic Hierarchy Process Approach.Barbara Ann ApostolouLouisiana State University and Agricultural & Mechanical College
Follow this and additional works at: https://digitalcommons.lsu.edu/gradschool_disstheses
This Dissertation is brought to you for free and open access by the Graduate School at LSU Digital Commons. It has been accepted for inclusion inLSU Historical Dissertations and Theses by an authorized administrator of LSU Digital Commons. For more information, please [email protected].
Recommended CitationApostolou, Barbara Ann, "An Investigation of Internal Auditor Judgment on the Importance of Indicators of Potential Financial Fraud:An Analytic Hierarchy Process Approach." (1988). LSU Historical Dissertations and Theses. 4555.https://digitalcommons.lsu.edu/gradschool_disstheses/4555

INFORMATION TO USERS
The most advanced technology has been used to photograph and reproduce this manuscript from the microfilm master. UMI films the text directly from the original or copy submitted. Thus, some thesis and dissertation copies are in typewriter face, while others may be from any type of computer printer.
The quality of this reproduction is dependent upon the quality of the copy submitted. Broken or indistinct print, colored or poor quality illustrations and photographs, print bleedthrough, substandard margins, and improper alignment can adversely affect reproduction.
In the unlikely event that the author did not send UMI a complete manuscript and there are missing pages, these will be noted. Also, if unauthorized copyright material had to be removed, a note will indicate the deletion.
Oversize materials (e.g., maps, drawings, charts) are reproduced by sectioning the original, beginning at the upper leii-hand corner and continuing from left to right in equal sections with small overlaps. Each original is also photographed in one exposure and is included in reduced form at the back of the book. These are also available as one exposure on a standard 35mm slide or as a 17" x 23" black and white photographic print for an additional
Photographs included in the original manuscript have been reproduced xerographically in this copy. Higher quality 6" x 9" black and white photographic prints are available for any photographs or illustrations appearing in this copy for an additional charge. Contact UMI directly to order.
University Microfilms International A Bell & Howell Information Company
3Q0 North Zeeb Road. Ann Arbor. Ml 48106-1346 USA 313/761-4700 800/521-0600
Reproduced with permission of the copyright owner. Further reproduction prohibited without permission.

Reproduced with permission of the copyright owner. Further reproduction prohibited without permission.

Order Number 8904524
An investigation of internal auditor judgment on the importance of indicators of potential financial fraud: An analytic hierarchy process approach
Apostolou, Barbara Ann, Ph.D.The Louisiana State University and Agricultural and Mechanical CoL, 1988
UMI300 N, Zeeb Rd.Ann Arbor, MI 48106
Reproduced with permission of the copyright owner. Further reproduction prohibited without permission.

Reproduced with permission of the copyright owner. Further reproduction prohibited without permission.

AN INVESTIGATION OF INTERNAL AUDITOR JUDGMENT ON THE IMPORTANCE OF INDICATORS
OF POTENTIAL FINANCIAL FRAUD: AN ANALYTICHIERARCHY PROCESS APPROACH
A Dissertation
Submitted to the Graduate Faculty of the Louisiana State University and
Agricultural and Mechanical College in partial fulfillment of the
requirements for the degree of Doctor of Philosophy
inThe Department of Accounting
byBarbara Ann Apostolou
B.S., Plymouth State College* 1979 M.B.A.* Plymouth State College* 1984
August 1988
Reproduced with permission of the copyright owner. Further reproduction prohibited without permission.

ACKNOWLEDGEMENTS
I wish to express my sincere appreciation to the members of my dissertation committee for their ongoing support and valuable assistance: Professors Vincent C.Brenner (chairman)* Robert M. Harper* Michael J. R.Hoffman* W. Douglas McMillin (economics)* and Glenn E. Sumners.
I would especially like to thank the Institute of Internal Auditors Research Foundation for their generous financial support of this project.
Two individuals deserve special recognition— my husband* Professor Nick Apostolou* for his endless support and devotion and my sister* Susan Keir* for leading the way to LSU. This dissertation is dedicated to them.
i i
Reproduced with permission of the copyright owner. Further reproduction prohibited without permission.
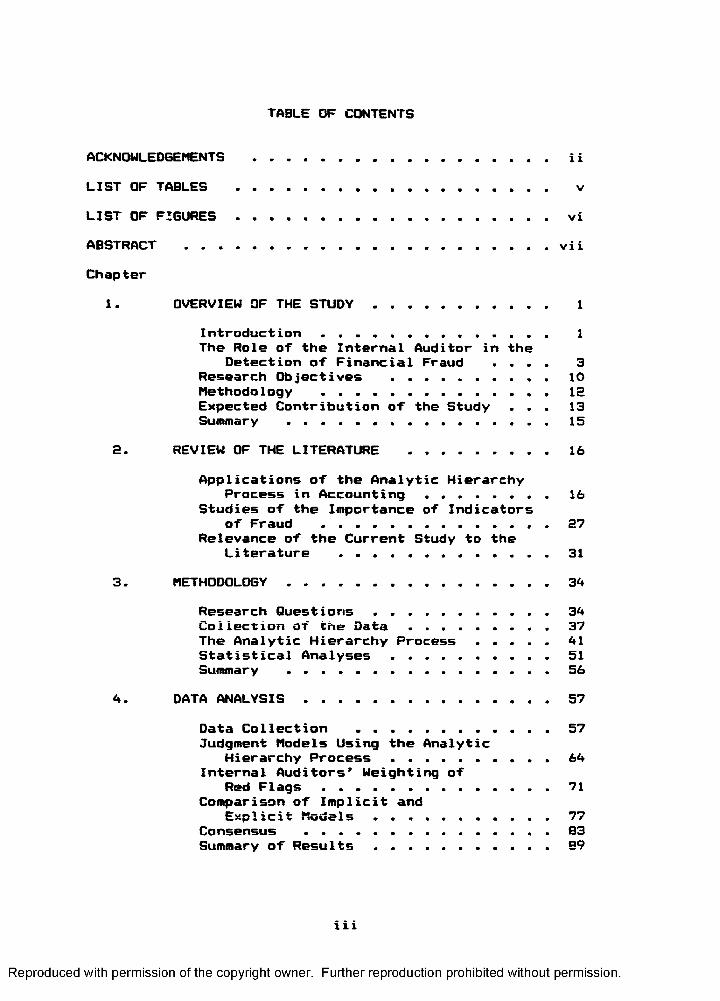
TABLE OF CONTENTS
ACKNOWLEDGEMENTS ...................................... i iLIST OF TABLES ....................................... vLIST OF F I G U R E S ......................................... viABSTRACT ...............................................viiChapter
1. OVERVIEW OF THE S T U D Y ...................... 1Introduction . . . . . . ............... 1The Role of the Internal Auditor in the
Detection of Financial Fraud . . . . 3Research Objectives ................... 10Methodology ...............................ISExpected Contribution of the Study . . . 13Summary ..................... 15
S. REVIEW OF THE LITERATURE ....................16Applications of the Analytic Hierarchy
Process in Accounting . . . . . . . . 16Studies of the Importance of Indicators
of Fraud .............. 27Relevance of the Current Study to the
Literature ............................ 313. METHODOLOGY ...................................34
Research Questions ...................... 34Collection of the D a t a ....................37The Analytic Hierarchy Process ......... 41Statistical Analyses ................... 51Summary ...................................56
4. DATA A N A L Y S I S .................................57Data Collection ........................ 57Judgment Models Using the Analytic
Hierarchy Process . ................. 64Internal Auditors1 Weighting of
Red F l a g s .............................. 71Comparison of Implicit and
Explicit Models ................... 77Consensus . . . . . ................... 83Summary of R e s u l t s ........................ 89
iii
Reproduced with permission of the copyright owner. Further reproduction prohibited without permission.

5. SUMMARY AND CONCLUSIONS ......................92Summary and Implications . ...............92Limitations .......... 96Suggestions for Future Research . . . . 98
BIBLIOGRAPHY .......................................... 101APPENDIX ........................................... 104VITA ................................................... 124
iv
Reproduced with permission of the copyright owner. Further reproduction prohibited without permission.

LIST OF TABLESTable Page4-1. Summary of Subjects’ Experience as
Internal A u d i t o r ................... 604-2. Summary of Subjects* Combined Experience a?.
Internal and External Auditor ............. 604-3. Breakdown of Subjects by Industry Membership . 614-4. Breakdown of Subjects by State Where
E m p l o y e d .....................................624-5. Summary of Degrees Held by S u b j e c t s .......... 634-6. Summary of Subjects by Professional
Certification ........................ 634-7. Average Overall Consistency Ratios With and
Without Inconsistent Models (Consistency Ratios > 0 . 200)............................ 69
4-8. Summary of Inconsistent Models Based onExperience as Internal Auditor ......... 70
4-9. Average Weights on Red F l a g s ................... 734—10. Frequency Distribution of Management
Characteristics ............................ 764—11. Results of Spearman’s Rho Analysis ...........794-12. Results of Correlation Analysis................. 794-13. Correlation of Implicit and Explicit Weights
on Firms Across Subjects ................. 804-14. Frequency Distributions of Implicit and
Explicit Models ............................ 834-15. Measures of C o n s e n s u s ..........................884-16. Measures of Consensus Based on Subjects’
Combined Experience as Internal andExternal A u d i t o r ................... 89
4-17. Summary of Hypothesis Test Results.............90
v
Reproduced with permission of the copyright owner. Further reproduction prohibited without permission.

LIST OF FIGURES Figure Page2—1. Analytical Review Procedure Hierarchy . . . . 182-2. Accounts Receivable Hierarchy . . ........... 202-3. Hierarchy of Internal Controls in a LAN . . . 222-4. Hierarchy of Qualitative Characteristics . . . 243—1. Hierarchy of Red Flags that Indicate the
Potential for Financial Fraud . . . . . . . 383-2. Advantages of the Analytic Hierarchy Process . 433-3. The Pairwise Comparison Scale ............... 473-4. Matrices for Pairwise Comparisons ........... 503-5. Matrices and Priority Vectors for Implicit
Choice of Firm ............................ 544-1. Dominance Matrix and Priority Vector for
Example Subject’s Explicit AHP Model . . . . 654-2. Dominance Matrices and Priority Vectors for
Example Subject’s Implicit AHP Model . . . . 67
vi
Reproduced with permission of the copyright owner. Further reproduction prohibited without permission.

ABSTRACT
Financial fraud has become a serious problem to the business community. As a result• regulators and financial statement users have leaked to the auditing profession for answers to the problem. The role of the internal auditor has received significant attention due to the unique position they fill. That is» they are positioned to observe and test financial and operational activities of the firm on a continuous basis. In addition! internal auditors are able to devote more time to the deterrence and detection of financial fraud than their external counterparts.
The National Commission on Fraudulent Financial Reporting (Treadway Commission) issued its final report in October 1987 following a two-year investigation of the problem of financial fraud. An effective internal audit function was mentioned as a chief variable in the detection and deterrence of financial fraud. Both the Treadway Commission and the American Institute of Certified Public Accountants (Statement on Auditing Standards No. 53i The Auditor’s Responsibility to Detect and Report Errors and Irregularities. May 1988) published lists of indicators or red flags of financial fraud.
This study focused on the internal auditor’s ability to identify red flags and rank their importance to the overall assessment of the potential for financial fraud.
vii
Reproduced with permission of the copyright owner. Further reproduction prohibited without permission.

The Analytic Hierarchy Process was used to model the judgment of each subject who participated in this study.In addition* measures of consensus were computed to evaluate the overall level of agreement between the subjects on the importance rankings of the red flags.
In general* internal auditors ranked management red flags as most important to the overall evaluation of the potential for financial fraud* followed by firm then industry red flags. Conclusions as to the rankings within each of the three principal groupings of red flags were not so clear.
vii i
Reproduced with permission of the copyright owner. Further reproduction prohibited without permission.

CHAPTER 1 OVERVIEW OF THE STUDY
IntroductionThe auditor’s responsibility For the detection oF
Financial Fraud has recently received signiFicant attention From regulators and users oF Financial statements as well as the auditing proFession. In response to growing concerns oF various parties over the auditor’s role in the detection oF Financial Fraud, a private-sector initiative to study Fraudulent Financial reporting was created in 1985. This initiative resulted in the National Commission on Fraudulent Financial Reporting, or the Treadway Commission, named aFter its chairman, Former Securities and Exchange Commissioner (SEC), James C. Treadway, Jr. The Treadway Commission was jointly sponsored by the American Institute oF Certified Public Accountants (AICPA), the American Accounting Association (AAA), the Financial Executives Institute (FEI), the Institute oF Internal Auditors (IIA); and the National Association oF Accountants (NAA) (Treadway 1987, 1).
As a result oF the increased Focus upon the detection oF Financial Fraud, the role oF the internal
1
Reproduced with permission of the copyright owner. Further reproduction prohibited without permission.

2
auditor has received attention. In particular* the IIA has become increasingly visible in efforts to address the responsibility of internal auditors in the prevention* detection* and reporting of financial fraud. In addition to their co-sponsorship of the Treadway Commission* the IIA published a report entitled The Role of the Internal Auditor in the Deterrence* Detection, and Reporting of Fraudulent Financial Reporting for the benefit of the Treadway Commission (IIA 1986). This report outlined the internal auditor’s responsibilities in addressing the problem of financial fraud in addition to providing recommendations for improved coordination between external and internal auditors in the detection of financial fraud. The internal auditor’s responsibilities are clearly set forth in Statement of Internal Auditing Standards (SIAS) No. 3* Deterrence* Detection*Investigation* and Reporting of Fraud (IIA 1985).Furthermore* SIAS No. 5* Internal Auditors’ Relationships with Independent Outside Auditors (IIA 1987) calls for increased coordination of effort between internal and external auditors to enhance efficiency and minimize duplication of effort.
The Treadway Commission defined financial fraud as "intentional or reckless conduct* whether act or omission* that results in materially misleading financial statements." This definition excludes unintentional errors that have a material impact on the financial
Reproduced with permission of the copyright owner. Further reproduction prohibited without permission.

3
statements* as weii as "corporate improprieties such as tax fraud * employee embezzlements* or violations of environmental or product safety regulations" (Treadway 1987* 2). The AICPA includes financial fraud within its definition of irregularities— "intentional misstatements or amissions of amounts or disclosures in financial statements" (AICPA 1988* 2). 5IA5 No. 3 defines financial fraud as an "array of irregularities and illegal acts characterized by intentional deception" (IIA 1985* 2). These three groups concur that financial fraud is characterized by both intent and misleading financial statements.
The first section of this chapter will describe in some detail the role of the internal auditor in the detection of financial fraud. In the second section* the research objectives of the study will be discussed* followed by a description of the proposed methodology. Lastly* the expected contribution of this study will be presented.
The Role of the Internal Auditor in the Detection of Financial Fraud
The Cohen Commission In 197*., the AICPA established an independent
commission to "develop conclusions and recommendations regarding the appropriate responsibilities of independent auditors" (Cohen 1978* xi). The Commission on Auditors’
Reproduced with permission of the copyright owner. Further reproduction prohibited without permission.

Responsibilities became known as the Cohen Commission after its chairman* Manuel F. Cohen. Its final report was issued in 1978.
Included among the recommendations summarized in the report was clarification of the independent auditor’s responsibility for the detection of fraud. The auditor’s primary concern should be with "intentional misrepresentations in or omissions from financial statements*“ or financial fraud. The Cohen Commission stressed that "an audit should be designed to provide reasonable assurance that the financial statements are not affected by material fraud" (Cohen 1978* 36).
In January 1977* Statement on Auditing Standards (SAS) No. 16* The Independent Auditor’s Responsibility for the Detection of Errors and Irregularities (AICPA 1977)* was issued* coinciding with preliminary recommendations of the Cohen Commission. SAS No. 16 states that the auditor has fulfilled the responsibility to detect errors or irregularities when the audit has been carried out in accordance with generally accepted auditing standards (GAAS). However* the audit program should be designed to detect errors and irregularities that have a material impact on the financial statements.
The Cohen Commission focused on the independent auditor’s role and responsibility. The Commission called for increased attention by auditors in the detection of financial fraud. SAS No. 9* The Effect of an Internal
Reproduced with permission of the copyright owner. Further reproduction prohibited without permission.

5
Audit Function on the Scope of the Independent Auditor's Examination (AICPA 1975* A)* notes that "the independent auditor may make use of internal auditors to provide direct assistance in performing an examination in accordance Mith generally accepted auditing standards." Although an independent auditor may not subordinate his or her judgment to that of the internal auditor* valuable assistance may be available from the internal auditor in the evaluation of the potential for financial fraud.
Regulatory PressureThe Foreign Corrupt Practices Act of 1977 covers
all domestic corporations required to file annual reports under the Securities Exchange Act of 1934 (Greanias 1982, 1—17). These firms must create and maintain a system of internal accounting controls. The primary purpose of the internal accounting control system is to maintain accountability for assets and ensure that transactions are authorized and properly recorded. The role of the internal auditor gained importance Mith the passage of this legislation* since the presence of an effective internal auditing staff is a strong internal accounting control feature.
In late 1986* Congressman Ron Wyden introduced a revised version of a bill (HR5439) drafted in response to recent business failures associated with financial fraud. This bill, the Financial Fraud and Disclosure Act of
Reproduced with permission of the copyright owner. Further reproduction prohibited without permission.

6
1996, which is still pending before Congress, would amend the Securities Exchange Act of 1934 by requiring that audits of public companies include reasonable procedures for detection of material financial fraud. Furthermore, the bill would require that auditors report fraudulent activities to appropriate enforcement and regulatory authorities Cl). S. Congress 1986), an action that is currently not required.
In response, the Auditing Standards Board (ASB) issued a new SAS to supersede existing SAS No. 16. SAS No. 53, entitled The Auditor’s Responsibility to Detect and Report Errors and Irregularities, requires auditors to design their audits to detect material errors and irregularities, consistent with the recommendation made in the Uyden bill. However, SAS No. 53 calls for the auditor to report financial fraud to the audit committee for its disposition, rather than to enforcement or regulatory authorities (AICPA 1988).
According to SAS No. 9, independent auditors may consider the work of the internal auditor in determining the nature, timing, and extent of audit procedures to be performed (AICPA 1975). Since more stringent requirements are forthcoming with respect to the independent auditor’s responsibility to detect and report financial fraud, the role of the internal auditor is becoming more important. As one independent auditor
Reproduced with permission of the copyright owner. Further reproduction prohibited without permission.

7
notes:Often- internal auditors are best positioned to
detect fraud because they can devote more time to its discovery. In addition* they knot* the entity and its operations better than independent auditors (Levy 1985. 79).
In summary, congressional pressure (i.e.. Uyden bill) hascoincided Mith the issuance of SAS No. 53 that Millrequire the independent auditor to detect and reportmaterial fraud. The Treadway Commission has applaudedthis effort by the ASB. Clearly, the role of theinternal auditor is important as a result of his or herintimate association with the firm through both financialand operational audits.
The Treadway Commission Report The Treadway Commission published its final report
in October 1987. This report consists of detailed recommendations as follows (Treadway 1987* 11-16):
I. Recommendations for the Public Company. The Commission indicates that prevention and detection of financial fraud begins with the company, and that it is up to management to "set the tone” for integrity in financial reporting.
II. Recommendations for the Independent Public Accountant. The role of the independent auditor is secondary to that of management, but is still critical to the detection of
Reproduced with permission of the copyright owner. Further reproduction prohibited without permission.

e
financial fraud. Among other things* the report suggests that the independent auditor be required to detect material financial fraud if it exists.
III. Recommendations to the SEC and Others toImprove the Reoulatorv and Leoal Environment. These recommendations essentially call for increased SEC sanctions and enforcement power along with improved regulation of the public accounting profession.
IV, Recommendations for Education. The Commissioncalls for increased attention on ethics inaccounting and business curricula.
Recommendations for the internal auditor arespecifically addressed in Part I of the Report (Treadway1907 * 37-39):
Properly organized and effectively operated* internal auditing gives management and the audit committee a way to monitor the reliability and the integrity of financial and operating information. The internal audit function is an important element in preventing and detecting fraudulent financial reporting.
The Report calls for public companies to adopt IIAprofessional standards and to ensure that their internalaudit departments are objective. In addition* internalauditors should consider the impact of nonfinancial auditfindings (as a result of operational audits) on thepotential for financial fraud. The Commission believesthat the implementation of these recommendations* when
Reproduced with permission of the copyright owner. Further reproduction prohibited without permission.

9
effectively coordinated with efforts of the independent auditor, can assist in the prevention and detection of financial fraud.
Internal Auditing StandardsIn 1985, the IIA issued SIAS No. 3 (IIA 1985) to
set forth guidance on the internal auditor’s responsibility to prevent, detect, and report financial fraud. SIAS No. 3 appropriately offers general guidance without identifying specific audit procedures that the internal auditor should carry out. In particular, SIAS No. 3 states that "internal auditors should have sufficient knowledge of fraud to be able to identify indicators that fraud might have been committed" (IIA 1985, 1). If indicators of fraud are present and detected, the internal auditor should perform additional audit procedures. In addition, the internal auditor is required to report incidences of financial fraud to “management or the board of directors" (IIA 1985, 3).
The report issued by the IIA (1986) for the Treadway Commission echoes the requirements set forth in SIAS No. 3. That is, the internal auditor has a responsibility to identify indicators of fraud and expand audit procedures accordingly. Furthermore, this report calls for improved coordination between internal and external auditors in the detection of financial fraud (IIA 1986).
Reproduced with permission of the copyright owner. Further reproduction prohibited without permission.

10
The Institute of Internal Auditors recently issuedSIAS No. 5i Internal Auditors’ Relationships withIndependent Outside Auditors (IIA 1987). SIAS No. 5focuses on the working relationship of internal andexternal auditors as recommended by the TreadwayCommission (1987! 39):
Appropriate involvement by the internal auditors at the corporate level» effectively coordinated to avoid duplication of the independent public accountants* efforts! can help prevent and detect fraudulent financial reporting.
In particular! SIAS No. 5 requires maximum coordinationto minimize duplication of effort and promote efficiency.The internal audit director is responsible for thiscoordination of effcrt! including the process ofeducating the internal auditor on the audit approach usedby the external auditor. The issuance of SIAS No. 5strengthens the need to study internal auditors sincetheir judgments are integral to the completion of theannual financial audit.
Research ObjectivesIndicators of the Potential for
Financial FraudIdentifying the potential for fraud is a complex
judgment task for the auditor. This judgment requiresthe auditor to assess attributes of the environment thatsuggest fraud may have occurred. Much attention has beengiven to identifying indicators (red flags) of financial
Reproduced with permission of the copyright owner. Further reproduction prohibited without permission.

11
'fraud is aid in the auditor’s evaluation. Many auditors use red-flag lists to assist Mith this process* although a study performed by Albrecht and Romney (1986) found that these lists Mere inconsistent across fraud firms and contained invalid red flags. In response to the demand for a comprehensive red-flag list* the AICPA incorporated such a list in SAS No. S3 (AICPA 1988, 4-5).Furthermore* the TreadMay Commission identified and discussed red flags in their report (TreadMay 1987* 154- 163).
Red-flag lists can assist the auditor in the evaluation of the potential for financial fraud.HoMevsr, the use of a list does not eliminate the need for internal auditor judgments. For example* if "material related-party transactions" is a red'flag, the internal auditor must be able to identify this characteristic during the course of the audit in addition to Meighting its importance in the presence or absence of other red flags.
Research Questions In vieM of the role that the internal auditor may
serve in the detection of financial fraud* it is important that he or she is able to identify red flags in the audit environment. The nature* timing* and extent of financial audit procedures performed (by both the internal and external auditor) Mill depend to a great
Reproduced with permission of the copyright owner. Further reproduction prohibited without permission.

12
extent upon the overall evaluation of the potential for financial fraud. The purpose of this research was to investigate the internal auditor’s judgment on the relative importance of specific red flags. As stated) both the AICPA (1988) 4-5) and the Treadway Commission (1987) 154-163) generated comprehensive red-flag lists. However) no research had been performed to determine whether internal auditors perceive these items as red flags.
In addition to modeling the internal auditor’s judgment as to the relative importance of specific red flags) this research also addressed whether internal auditors achieve consensus. In particular) the extent to which internal auditors agree with one another on the weighting of the importance of red flags of financial fraud was examined. Finally) the study investigated whether internal auditors make explicit judgments of the potential for financial fraud in a manner consistent with their modeled judgment.
Methodology The Analytic Hierarchy Process
The methodology used in this study was the Analytic Hierarchy Process (AHP) advanced by Saaty (1986)1988).The AHP is a technique for modeling judgments and for providing the decision maker with a means for selecting among alternatives. This approach is especially well-
Reproduced with permission of the copyright owner. Further reproduction prohibited without permission.

13
suited to situations involving qualitative attributes. Furthermorei the AHP can handle complex judgment tasks involving interrelated cues with varying degrees of impact on the decision.
The application of the AHP involves complex matrix operations. Saaty and others have developed software (Decision Support Software 1983)? called Expert Choice? to perform the necessary computations. This study employed Expert Choice.
Expected Contribution of the Study The role of the internal auditor in the deterrence
and detection of financial fraud is clearly recognized. Considerable emphasis has been placed by regulators? the public? and those within the auditing profession on the importance of the internal auditor's role in the detection of financial fraud. This study provides information on the internal auditor's ability to identify and weight th'e importance of red flags relative to one another. In addition? measures of consensus provide information about the extent to which internal auditors agree with one another on their evaluations of the relative importance of red flags.
SAS No. 9 acknowledges the importance of the internal auditor as a valuable resource to the independent auditor in carrying out audits in accordance with GAAS. The more information that the independent
Reproduced with permission of the copyright owner. Further reproduction prohibited without permission.

14
auditor obtains Mith respect to the ability of the internal auditor to support the independent audit* the greater the potential for improved coordination and efficiency between the two groups of auditors. In addition* the recent issuance of SIAS No. 5 (IIA 1985) reinforces the need for internal and external auditors to coordinate their efforts. This study offers insight to the independent auditor into the judgment quality of internal auditors in their evaluation of the potential for financial fraud.
According to Libby (1981* 3)* judgment research is important in that it may reveal when steps need to be taken to improve the judgment process. Improvement may take the form of additional education for the judge* development of judgment aids or decision models* and so forth. This study investigated the use of a decision aid* the Analytic Hierarchy Process. The results of this study provide information as to the usefulness of the AHP in real situations calling for the evaluation of the potential for financial fraud.
tFurthermore* the AHP is only recently beginning t? receive attention as a tool for modeling judgment in complex situations. This study advances the use of the AHP in the auditing literature. In addition* it provides additional insight into the advantages and disadvantages of the AHP as a methodology* for the benefit of future research in audit judgment.
Reproduced with permission of the copyright owner. Further reproduction prohibited without permission.

15
SummaryThis chapter has presented a general overview of
the study. The role of the internal auditor in the detection of -financial fraud has been described. In addition* the research questions and methodology have been summarized. The remaining chapters will present a review of the relevant literature* a detailed description of the methodology* analysis of the data* and conclusions of the research.
Reproduced with permission of the copyright owner. Further reproduction prohibited without permission.

CHAPTER S REVIEW OF THE LITERATURE
The purpose of this chapter is to review and summarize the literature relevant to this research study* as well as to demonstrate how the current project will contribute to the literature. Areas of research relevant to this purpose include:
1. Applications of the Analytic Hierarchy Process (AHP) in accounting and auditing.
S. Attempts to measure the importance of red flags.
Applications of the Analytic Hierarchy Process in Accounting
The AHP is applicable to a wide variety of decision problems* and has received attention as a decision aid in fields such as health* politics* marketing* and education (Zahedi 1986* lOl). The application of the AHP in accounting-related research has been fairly recent* and has been primarily associated with auditing. This section of the literature review will evaluate two published and three unpublished research studies in the accounting literature. These studies represent a review of applications of the AHP in accounting. In addition* a
16
Reproduced with permission of the copyright owner. Further reproduction prohibited without permission.

17
brief review of the criticisms of the AHP is presented.
Arr ington* Hillison* and JensenArrington* Hillison* and Jensen (1984) were the
first to publish an auditing application of the AHP. The major objective of their study was to introduce the AHP as a technique to model the judgment of auditors. To accomplish this end* they used a small sample of auditors in an Analytical Review Procedure (ARP) task.
The authors attempted to determine how auditors weight multiple attributes to select ARPs (Arrington* Hillison* and Jensen 1984* 899). Previous research typically examined only one dimension of the choice of ARP* such as predictive accuracy of the model. The AHP allows for examination of many dimensions that enter the decision simultaneously. The hierarchy developed hy Arrington* Hillison* and Jensen (1984* 300-301) is included in Figure 2-1.
Six subjects were used in this study* 3 academicians and 3 practitioners* and all were considered experts in analytical review procedures and had extensive auditing experience. The actual task was divided into 8 distinct phases. In the first stage* subjects were asked to make all possible pairwise comparisons of the attributes in level 1 of the hierarchy using Saaty’s (1988* 54) response scale. These responses allowed the researchers to use the AHP to generate dominance matrices
Reproduced with permission of the copyright owner. Further reproduction prohibited without permission.

18
and priority weights for each attribute for each subject. The second stage of the task required the subjects to make paired comparisons of each alternative with respect to each attribute. For example* they compared Box- Jenkins to Random-Walk with respect to Statistical Performance using the Saaty (1988* 54) response scale.
Level 0 Selection of Analytical Review Procedure(Objective)Level 1 Statistical Performance
Model Robustness Ease of Application Understandab i1i ty Costs
Regression (54 quarters in base period) Regression 0 6 quarters in base period) Box—Jenkins Random-Walk Random-Ua1k-Dr i ft
Figure 2-1. Analytical Review Procedure Hierarchy.
The final phase of the study was performed by the researchers* and resulted in the ranking of the alternatives by subject and on average. This procedure entailed multiplying the weights derived in stage one by the result obtained in stage two to generate overall rankings for each ARP alternative. The rankings represent the selection of ARP made by subjects when all 5 of the hierarchical attributes were simultaneously evaluated.
Consistency ratios for each subject were less than
Level 2 (Alternatives)
Reproduced with permission of the copyright owner. Further reproduction prohibited without permission.

19
the .10 threshold established by Saaty (1988* 21)*indicating that the subjects Mere fairly consistent intheir own judgmental process. Howeverf little agreementMas noted betMeen experts in the selection of ARP*although the 2 Regression Models and Random-Walk modelMere preferred to Box—Jenkins and Random-Walk—Drift.
The authors concluded that the AHP is a very usefultool for modeling auditor judgment* especially Mhenqualitative attributes are integral to the decisionprocess. The AHP is particularly Mell-suited formodeling multiple attributes and for determining theimportance of individual attributes. This study islimited in that only (a subjects were employed* however*this action is appropriate in an exploratory study. Tosum* the authors note:
AHP is applicable to any number of auditing processes in which qualitative* nonmetric dimensions influence the quality of professional judgments. . . . such as materiality* internal control evaluation* opinion qualifications* and strategic planning (Arrington* Hillison* and Jensen 1984, 309).
Lin* Mock* and Wright Lin* Mock, and Wright (1984) demonstrated the use
of the AHP as an aid in planning audit procedures associated with accounts receivable. Similar to the Arrington, Hillison* and Jensen (1984) study, this paper was an attempt to introduce the AHP as a technique for modeling the judgment of auditors. Although they did not
Reproduced with permission of the copyright owner. Further reproduction prohibited without permission.

20
carry out a full-scale study* they demonstrated how the AHP would work in an actual research setting. The hierarchy they structured is quite simplistic* and is detailed in Figure 2-2 (Lin* Mock* and Uright 19B4, 93* 94).
Level 0 Selection of Audit Procedure for Accounts(Objective) ReceivableLevel 1 Reliability Cost Validity
Level 2 Analytical Review(Alternatives)
Confirmations Test of Subsequent Collections
Figure 2-2. Accounts Receivable Hierarchy.
To carry out this hypothetical study* subjects would be required to make all possible pairwise comparisons of the attributes on Level 1. In addition* all possible pairwise comparisons of Level 2 with respect to each Level 1 criteria would be required. The Saaty (1988* 54) response scale would be used to measure the judgments.
Lin* Mock* and Wright (1984) intended that their paper be used to introduce the AHP as a potentially powerful tool for modeling auditor judgments. Theysummarized by stating?
Reproduced with permission of the copyright owner. Further reproduction prohibited without permission.

S I
. . . this approach offers the potential for greater rigor and efficiency when compared to traditional heuristic evidence evaluation procedures. The AHP is also relatively easy to apply and understand and usually requires limited decision maker time (Lin, Mock, and Uright 1984,96) .
HarperHarper (1964) used the AHP in his DBA dissertation
at Florida State University. He modeled EDP auditor judgment of internal controls in Local Area Networks (LANs). A LAN is a popular configuration of microcomputei— workstations linked together in one installation. Since LANs represent a fairly recent development in computer installations, the internal controls in place may differ from more traditional settings.
One of Harper’s (1984, 83) principal research objectives was to identify the internal accounting controls unique to a LAN in a sales transaction processing setting. Five EDP auditing experts from Big Eight accounting firms were interviewed by the researcher and resulted in the identification of 17 internal control attributes appropriate to a LAN (Harper 1984, 88-89). Based on the outcome of this phase of the research, a hierarchy was developed and is included in Figure 2-3 (Harper 1984, 91).
Reproduced with permission of the copyright owner. Further reproduction prohibited without permission.

22
Level 0 Evaluation ef Iateraal Control(Objective}Level 1 Uurkstation Processing Data 1 Prograa Supervisory
Controls Controls Security ControlsLevel 2 PM w t r r Rtfuniy LOSS
InitTr PRICE CeopCode KeyPersSDOCS R-fi QMN6E PAPERMkRs OUTPUT BkUp
RsBiskPuMnt
PM - Nulti-level passwords InitTr = Initiation of transactions SOOCS = Source Documents HkRs = Uortstation restrictions INPUT = Input controls R-fl = Run-to-Run controls
PRICE - Pricing controls OUTPUT = Output controls PuMnt = Passuord naintenance
RdOnly = Read-but-not-urite protection Conpcode = Coepiled prograa code CHANGE = Control of nontransactional changes BkUp = Backup and recovery
RsBisk = Physical restriction to disks LOGS = Cooputer logs
Keypers = Monitoring of key persons PAPER = Hard-copy docunents
Figure 2-3. Hierarchy of Internal Controls in a LAM.
ft second important research objective involved the determination of the relative importance to individual auditors of the internal accounting controls identified by the 5 Big Eight auditors (Harper 198<»f 83). The AHP was used to model EDP auditors* judgments within the context of the hierarchy described in Figure 2-3. The subjects consisted of a nationwide sample of experienced EDP auditors employed with Big Eight firms. A total sample of 51 subjects represented a 60 percent response rate to the mailed questionnaire. The questionnaire consisted of a series of pairwise comparisons at levels 1 and 2 o* the hierarchy! measured with Saaty*s (1988i 5b)
Reproduced with permission of the copyright owner. Further reproduction prohibited without permission.

23
response scale. Note that in this particular study* the subjects were not asked to select among alternatives as in the Arrington* Hillison* and Jensen (19B4) or Lin* Mock* and Wright (1904) studies.
Once the individual subject’s AHP models were developed* consensus vss measured by computing intei—
rater correlations for every pair of EDP auditors. The result of the correlation analysis indicated consensus to be quite low (Harper 1984* 134—135)* suggesting that the EDP auditors failed to agree on the relative weights placed on the importance of the various controls in the hierarchical model.
Harper’s efforts represented an initial attempt to use the AHP to model the judgment of auditors in a computer processing environment. Additional research in this area should be directed toward refinement of the hierarchy and investigation into the implications of the low consensus measures. This exploratory study has generated an initial AHP model that should be subjected to further research.
SingletonSingleton (1985) used the AHP in his Ph.D.
dissertation at Louisiana State University. The focus of his study was to examine the qualitative characteristicsset forth in Statement of Financial Accounting Concents No . 2 ; Qualitative Characteristics of Accounting
Reproduced with permission of the copyright owner. Further reproduction prohibited without permission.

24
Information (FASB 1980). He specifically analyzed them to determine if they are operationalf comprehensive! and parsimonious.
The AHP did not serve as the primary methodology in his study. Rather( he applied it to generate weights for linear models that were used to predict each subject’s choice of accounting method. The AHP was used to compute priority weights for the level 1 categories and for each of the nine level 8 qualitative characteristics examined. Subjects were asked to make all possible pairwise comparisons of the characteristics using Saaty's (1988!54) response scale. The hierarchy established for purposes of Singleton’s (1985) study is included in Figure 8-4.
Level 0(Objective) Decision Usefulness
Level 1 Relevance Reliability
Level 8 Predictive value VerifiabilityFeedback value NeutralityTimeliness ComparabilityComparability Representational
faithfulness
Figure 8-4. Hierarchy of Qualitative Characteristics.
McDermottMcDermott (19Bfe) used the AHP in her Ph.D.
Reproduced with permission of the copyright owner. Further reproduction prohibited without permission.

25
dissertation at the George Washington University. She studied EDP auditor judgment of the internal accounting control system in a microcomputer environment. Her research was specifically directed to generating a working AHP model of EDP auditor judgment of internal controls in an effort to reduce the subjectivity associated with such reviews.
The initial phase of this research involved the development of the AHP hierarchy based upon a thorough review of the relevant literature. The result was a working AHP model consisting of four levels in the hierarchy:
Level 1: Focus — A Strong Internal Accounting ControlSystem
Level 8: Factors — Special Control ConsiderationsLevel 3: Scenarios — Risks/ExposuresLevel A: Sub-Factors — Controls/Compensating Controls
Thirty-five cues were incorporated into the hierarchy:6 on level 2> 6 on level 3* and 83 on level A (McDermott 1906, 73-78).
The second phase of this study involved the use of a questionnaire to which 39 EDP auditors responded, representing a 78 percent response rate (McDermott 1986, 93). These auditors were asked to select the 5 most important cues associated with each factor on each level of the hierarchy. The results were used to modify the working AHP model into a refined AHP model. While the
Reproduced with permission of the copyright owner. Further reproduction prohibited without permission.

86
latter retains the same -Four levels as the original hierarchy* the components of the model were revised to reflect the subjective judgment of the expert EDP auditors.
The third and final phase of the study was to test the refined model (McDermott 1986* 111-118). Three EDP auditors who had participated in the second phase of the study were used to make all possible pairwise comparisons of attributes at each level of the hierarchy with respect to its immediate criteria. Expert Choice (Decision Support Software 1983) software was used which incorporates Saaty's (1988* 54) response scale in making the judgments as to the relative importance of each item in the pairs. Local and global weights were computed for each cue for each of the 3 subjects. Results suggest little agreement between subjects as to the relative importance of elements in the hierarchy. The sample size was too small to draw inferences.
McDermott's (1986) study provided a contribution to the literature in that it represented an attempt to use the AHP to model auditor judgments. She reported that the model is a general one that is suitable for further study of its potential application in practice. The subjects involved in the study were positively impressed by the use of the AHP as a judgment aid.
Reproduced with permission of the copyright owner. Further reproduction prohibited without permission.

£7
Criticisms of the Analytic Hierarchy Process
Lin (1987, 4) notes that the AHP is becoming the most frequently used method to elicit judgments. The major limitation he observes is that the number of pairwise comparisons can become unwieldy as the quantity cf attributes in the model becomes large. However, Saaty (1986, 33) contends that no more than 5 to 9 attributes should be examined at a given level of the hierarchy, since the human mind is generally incapable of processing more. If the researcher adheres to this rule, the task should remain manageable.
Dyer and Uendell (1984/85) are especially critical of the AHP. They observe that the rankings of alternatives may be arbitrary in some instances. This premise is illustrated in their paper by introducing an irrelevant alternative into their AFP model that alters the ranking of the alternatives. This is viewed as a shortcoming of the AHF since irrelevant information should be excluded from the solution. However, they note that when correct attributes are incorporated into the model, the results from the AHP approximate a correct solution (Dyer and Uendell 1984/85, 31).
Studies of the Importance of Indicators of Fraud
Two studies appear in the literature that attempt to measure the importance of red flags in the auditor’s
Reproduced with permission of the copyright owner. Further reproduction prohibited without permission.

28
judgment of the potential for fraud. One deals with red flags associated with employee fraud (i.e.* embezzlement) and is based on information acquired from actual case studies involving internal auditors. The second study investigated financial fraud and obtained data from partners in CPA firms.
Albrecht* Howe* and RomneyIn their 1964 study* Albrecht* Howe* and Romney
attempted to rank the importance of red flags of employee fraud or embezzlement. Based upon a review of the literature* the authors developed a list of 50 potential indicators (red flags) of employee fraud. These red flags were incorporated into a questionnaire that was mailed to internal auditors representing 325 different companies that had experienced employee fraud and had agreed in advance to participate in the study".' Only 212 of the internal auditors returned usable responses (Albrecht* Howe* and Romney 1984* 14).
The questionnaire asked each subject to provide detailed information on the fraud that had actually occurred in his or her company* including perpetrator characteristics as well as organizational conditions that may have allowed the fraud. This demographic data was used to determine if relationships exist among variables (e.g.* education level of perpetrator with amount of the fraud). Significance of these relationships was measured
Reproduced with permission of the copyright owner. Further reproduction prohibited without permission.

29
with the Chi-Square statistic.The second and third parts of the questionnaire
asked subjects to evaluate two sets of' red flags. One set was a list of 85 perpetrator characteristics* and the other was a list of 85 organizational characteristics.The evaluation was with respect to the fraud reported by the subject company. Each red flag was rated on a 7- point Likert scale (Strongly disagree to Strongly agree!.For example* one question was "The perpetrator(s) had unusually high personal debts*" to which the subject would respond with his or her level of agreement (Albrecht* Howe* and Romney 1984* 30).
The researchers generated a wealth of statistics from this questionnaire survey. A significant finding of their study was that perpetrator characteristics were not consistent across fraud cases. Nonetheless* the authors suggest that the information presented should be useful to internal auditors in their efforts to deter and detect employee fraud.
Albrecht and Romney In a study similar to Albrecht* Howe* and Romney
(1984)* Albrecht and Romney (1986) attempted to validate a list of 87 potential red flags of management or financial fraud. The red flags used in the study were constructed from an extensive review of fraud-related literature. Since no attempt had previously been made to
Reproduced with permission of the copyright owner. Further reproduction prohibited without permission.

30
validate red-flag lists used by auditors in practice* a primary purpose of the research Mas to assess the predictive ability of red flags.
The research hypothesis Mas that red flags have predictive ability if they appear in fraud situations and do not appear in no-fraud situations. In an effort to make this determination* the authors developed tmo questionnaires. One Mas sent to audit partners on engagements Mhere fraud had not been found. The second questionnaire Mas mailed to audit partners on engagements that had experienced financial fraud. The partners Mere asked to respond Mhether each of the 87 red flags Mas present* absent* or if they did not knoM. In addition* each was asked to rank the 5 most salient red flags on the fraud engagements (Albrecht and Romney 1986* 325- 326).
The proposed sample consisted of asking 20 CPA firms to complete 20 questionnaires each* 10 fraud clients and 10 no-fraud clients. In addition* since the researchers were unable to identify 10 fraud clients for each of the firms* they asked that these firms send remaining fraud questionnaires to "partners of their choice who had experience with management fraud." Of the 200 fraud questionnaires delivered* 27 responded. Thirty-six of the no-fraud group returned their questionnaires (Albrecht and Romney 1986* 325—326).
Using the Chi-Square statistic* the researchers
Reproduced with permission of the copyright owner. Further reproduction prohibited without permission.

3 i
'found that significant differences between the fraud andno-fraud groups existed with only 31 of the 87 red flags.Howeveri some of the red flags proved to be untestabledue to infrequency of occurrence. The significant redflags consisted of both personal factors and companyfactors. Auditor perceptions of the 5 most salient redflags were (Albrecht ana Romney 19S6'i~33H>:
Too Much Trust in Key Executives Key Executives Living Beyond Means Domination of the Company by One or Two Strong
Individuals Inadequate Internal Control System Significant Related-Party TransactionsThe results of this study should be viewed with
caution. The sample size was quite small* suggesting thatthe results are not necessarily generalizable. Inaddition* since many of the red flags proved to beuntestable* no conclusion can be drawn with respect totheir predictive ability.
Relevance of the Current Study to the Literature
Judgment Studies of Internal Auditors
Published studies attempting to model the judgmentof internal auditors are scarce in the auditingliterature. The importance of judgment research wasstressed by Libby (1981* 8-3):
Why should accountants be interested in individual judgment and decision making? The general answer is that decision making is an intrinsic part of the current practice of accounting. . . . The quality
Reproduced with permission of the copyright owner. Further reproduction prohibited without permission.

32
of these decisions* among others* will determine the accountant’s success in the marketplace.Whether accountants are concerned with their own or others’ decisions* the focus of their concern is on the improvement of decisions.
Libby (1981* 3) suggests that three options are availablefor the improvement of decisions:
1. Change the information.S. Educate the decision maker to change the way he
or she processes information.3. Replace the decision maker with a model.
This study will focus on options S and 3. First* byidentifying how an internal auditor perceives theimportance of red flags* areas for potential improvementof the judgment process can be suggested. Second* theAHP may serve as a decision aid to the internal auditorin his or her efforts to assess the potential forfinancial fraud.
This study will fill a void in the literature inthat it represents an initial attempt to model thejudgment of internal auditors. Since judgment studies ofinternal auditors in other task settings are scarce* thisstudy will serve to stimulate research into the judgmentof internal auditors in general. This aspect of theresearch is especially important in view of the criticalrole internal auditors play in the performance of theaudit function.
Studies of the Importance of Red Flags
Only two studies appear in the literature that
Reproduced with permission of the copyright owner. Further reproduction prohibited without permission.

33
examine the importance of red flags. These research efforts are actually post mortem analyses of actual fraud cases* and do not represent the judgment of auditors or others as to the importance of the red flags. In addition* the sample sizes in these studies were quite small* compromising the generalizability of the results.
Treadway (1987, 154-163) and the AICPA (1988, 4-5> have generated comprehensive lists of red flags of financial fraud following lengthy investigations. This study will attempt to determine whether internal auditors perceive these red flags as relevant to the assessment of the potential for financial fraud. Furthermore* the relative importance of the various red flags will be evaluated. The findings from this research will provide the means for internal auditors to improve their decision processes with respect to the assessment of the potential for financial fraud.
Use of the AHP to Model the Judgment of Internal Auditors
The use of the AHP in accounting and auditing is still in its infancy. Studies employing the AHP have only appeared in the literature since 1984* and have been exploratory in nature. This research effort will extend the AHP beyond the exploratory stage to a full-scale study of internal auditor judgment. In addition* this study will be the first AHP study to examine internal auditors in particular.
Reproduced with permission of the copyright owner. Further reproduction prohibited without permission.

CHAPTER 3 METHODOLOGY
The purpose of this chapter is to outline the research methodology used in this study. The research questions and related hypotheses are discussed first* followed by a detailed explanation of the data collection prucess in the second section. The third section offers a complete description of the Analytic Hierarchy Process (AHP) along with its relevance to addressing the research questions. The fourth section describes statistical tests that were employed to test the research hypotheses.
Research Questions This study was directed toward obtaining evidence
to answer three specific research questions. These research questions relate to the overall purpose of investigating the judgment of the internal auditor on the importance of indicators (red flags) of the potential for financial fraud. Each question* a discussion of its importance* and its related research hypothesis* if applicable* follows:1. How do internal auditors perceive the importance of
the red flags that indicate the potential for financial fraud?Roth thp ATCPA (1908- A—5) and the Treadway
Commission (1987* 15A-163) have generated comprehensive
3 A
Reproduced with permission of the copyright owner. Further reproduction prohibited without permission.

35
red-flag lists that are in general agreement. The importance of the red flags relative to one another was evaluated using the AHP to determine whether any are considered to be more important than others. Figure 3-1 presents the red flags evaluated in this study. Since neither the AICPA nor the Treadway Commission prioritized the red flags they have identified* this study offers the first attempt to do so from the internal auditor's perspective.S. Are explicit judgments made by an internal auditor
in hypothetical firm descriptions consistent with the implicit judgments made by the corresponding AHP model?This question addressed the ability of the AHP
model to operate as a judgment aid to the internal auditor. In developing the judgment model* the internal auditor was asked to evaluate individual red flags. However* in real situations* they may be confronted with many red flags simultaneously. This question considered whether the internal auditor's modeled judgment is consistent with explicit judgments made in hypothetical case situations. It was* in fact* a test of the AHP model. The research hypothesis associated with this question (stated in the null form) was (for each sub ject):
HI: There is no agreement between the explicitranking of firms by a subject and the implicit rankinq of firms by the subject’s AHP model.
Reproduced with permission of the copyright owner. Further reproduction prohibited without permission.

36
3. Do internal auditors achieve consensus in their weighting of the importance of the different red flags and categories of red flags?Consensus is a measure of the degree to which the
internal auditors agree with each other on the weightsthey have assigned to the importance of the different redflags. As Libby (1981* 31) notes* "where the lack ofobjective criterion data makes the direct measurement ofachievement impossible* the consensus judgment of expertsoften serves as a substitute criterion." He also remarksthat when the auditor's judgment is challenged* defenserequires that generally accepted or consensus procedureswere followed.
In this study* consensus was measured at bothlevels 1 and 8 of the hierarchy depicted in Figure 3-1.Level 1 represents general categories of red flagcharacteristics. Level 8 provides more specific detailfor each of the level 1 categories. This researchquestion was concerned with the degree to which theinternal auditors agree on the ranking of the importanceof the level 1 categories as well as the ranking of thespecific red flags within each category.
The following research hypotheses (stated in thenull form) directly addressed consensus of internalauditor judgment (Figure 3-1):
H8: Internal auditors fail to achieve consensusin ranking the importance of the level 1categories of red flags that indicate thepotential for financial fraud.
Reproduced with permission of the copyright owner. Further reproduction prohibited without permission.

37
H3: Internal auditors fail to achieve consensusin ranking the importance of firm characteristics that indicate the potential for financial fraud.
HA: Internal auditors fail to achieve consensusin ranking the importance of industry characteristics that indicate the potential for financial fraud.
H5: Internal auditors fail to achieve consensusin ranking the importance of management characteristics that indicate the potential for financial fraud.
Collection of the Data The Subjects
The subjects used in this study Mere practicing internal auditors. Since this study Mas an effort to model the judgment of internal auditors; the use of these subjects ensured they were trained and experienced in the profession of internal auditing. Furthermore* prac v iCi ny internal auditors should be familiar with promulgated literature on financial fraud such as SIAS No. 3 (IIA, 1985) and the Treadway Report (1987).
As will be explained in a later section* the task was administered in two phases to minimize the possibility that the subjects would be sensitized to the research questions. As a result* the task was administered to the subjects in person. The subjects were obtained by gaining access to educational seminars* professional meetings* and firms. The task was also completed by internal auditors visiting the Louisiana
Reproduced with permission of the copyright owner. Further reproduction prohibited without permission.

38
Level 0 Evaluation of Potential for Financial Fraud
Level 1 FireCharacteristics
IndustryCharacteristics
IbnageaentCharacteristics
Level 2 Frequent and significant transactions involving unusually difficult or coupler calculations (FC1)The elistence of financial stateaest elenents that depend heavily on the exercise of subjective judgnent (FC2)Organization is decentralized uithout .adequate oonitoring (FC3)
Profitability of entity relative to its industry is inadequate or inconsistent (ICllDirection of change in entity's industry is declining uith nany business failures (IC2)
Rate of change in entity’s industry is rapid (products! services* lines of business! or scifeods of operating! (IC3i
Sensitivity of operating results to econoaic factors (inflation« interest rates! is high (FCh)Solvency probleos or other natters that bring into question the entity’s ability to continue in elistence are present (FC5)Material related-party transactions (FC4)
Nanagenent operating and financial decisions are doninated by a single individual (NCI)Nanagenent’s attitude touard financial reporting is unduly aggressive (HC2)
Nanageuent turnover is high* particularly senior accounting personnel (HC3iNanagenent’s coapensation is tied to reported earnings (Ntt)Nanageoent places undue enphasis on seeting earnings projections (SC5)
Level 3 Evaluation of Alternative Fins Alpha Coapany* Sanaa Goapaayi Oaega Coapanyi Zeta Coapany
Figure 3-1. Hierarchy of Red Flags that Indicate the Potential for Financial Fraud.
Reproduced with permission of the copyright owner. Further reproduction prohibited without permission.

39
State University campus in conjunction with the Internal Audit Pilot School. The subjects represented various industries* experience levels* educational backgrounds* and geographical locations.
The TaskThe subjects Here provided with an instrument
consisting of two distinct parts. The first part requested that the subjects read four short individual case studies about hypothetical companies* nherein specific red flags mere varied (Figure 3-1). A subsequent section describes how these cases were constructed. After reading the cases* the subjects were asked to make all possible pairwise comparisons of the cases with respect to the following question using Saaty’s (1988* 54) response scale:
Which company has the greater potential for theoccurrence of financial fraud?
This phase of the task provided data on the explicit judgment of the internal auditors necessary to address the second research question and HI.
Immediately after the first part of the instrument was collected* the second part was administered. The subjects were asked to make pairwise comparisons of the individual red flags by using Saaty’s (1988* 54) response scale. These responses generated the AHP model* the weights placed by the subjects on each red flag* and the implicit judgments. This data enabled the researcher to
Reproduced with permission of the copyright owner. Further reproduction prohibited without permission.

40
completely address the first and second research questions and HI.
A complete copy of the research instrument is included in the appendix. The actual instrument was prepared in booklet form with the following pages facing each other:
Part I: pages 8 and 3* A and 5* 6 and 7Part II: pages 1 and 8* 3 and 4* 5 and 6*
7 and 8* 9 and 10Close inspection of this instrument reveals why theresearcher administered it in two phases. If the secondphase been administered first* the subjects would becued to look for the specific red flags in the casestudies. However* by administering the case studiesfirst* the subjects did not have the opportunity toadjust their responses based on the subsequentinformation* which is more explicit. The case studieswere written in such a way that the specific red flagswere disguised* and they did not appear to be a strongcue to the subjects in completing the task.
The subjects were also requested to supply some demographic data. While no specific hypotheses were designated for using this data* it assisted the researcher in interpreting results obtained in testing Hi through H5. In addition* the subjects were given an opportunity to express their opinion about the instrument and the importance of the subject matter.
Reproduced with permission of the copyright owner. Further reproduction prohibited without permission.

41
Finally* two versions of the instrument were used to vary order of presentation. The results were compared to determine whether order had an effect on the responses or not. Previous studies using the AHP indicated that order of presentation did not present any difficulty for the researcher.
The Analytic Hierarchy Process Overview
The methodology used in this study was the Analytic Hierarchy Process (AHP) advanced by Saaty (1986*1988).The AHP is a technique for modeling judgments and for providing the decision maker with a means to choose among alternatives. This approach is especially well-suited to situations involving qualitative attributes.Furthermore* the AHP can handle complex judgment tasks involving interrelated cues with varying degrees of impact on the decision.
Saaty (1986* 17-18) discusses how natural principles of analytic thought underlie the AHP. Saaty and others theorize that humans tend to structure reality into pieces of homogeneous information in a hierarchical manner. Analysis is more manageable when a complex task is reduced to comparison of pairs of items so that priorities of importance may be established. As Saaty (1986, 18) states:
Reproduced with permission of the copyright owner. Further reproduction prohibited without permission.

48
The analytic hierarchy process incorporates both the qualitative and the quantitative aspects of human thought: the qualitative to define theproblem and its hierarchy and the quantitative to express judgments and preference concisely. The (analytic hierarchy) process is designed to integrate these dual properties.The AHP combines both the deductive and the systems
approach to understanding complex problems. Saaty (1986* 6) notes:
The AHP enables us to structure a system and its environment into mutually interacting parts and then to synthesize them by measuring and ranking the impact of these parts on the entire system.
The AHP* therefore* provides a structured approach tojudgments by eliminating confusion brought about by"piecemeal explanations arrived at through deduction"(Saaty 1986* 6).
The AHP has emerged as a potent tool for makingjudgments. It Mas created to accommodate both logic and
» • ■»- wpersonal values without forcing the judge to think in a manner that is unnatural. Mental agility* background* and wisdom are used to develop the hierarchy of the problem while logic* intuition* and experience provide the judgments (Saaty 1986* 88). As such* there exist many advantages to the use of the AHP to model expert judgments. Figure 3-8 provides a summary of the positive aspects of the AHP (Saaty 1986* 83).
Reproduced with permission of the copyright owner. Further reproduction prohibited without permission.

43
Unity:Thn AHP provides a single, easily understood, flexible model (or a wide range of unstructured problems
Process Repetition:The AHP enables people to refine their definition of a problem and to improve their judgment and understanding through repetition
Judgment and Conaensus:The AHP does not insist on consensus but synthesizes a representative outcome from diverse judgments
Tradeoffs:The AHP takes into consideration the relative priorities of factors in a system and enables people to select the best alternative based on their goals
Synthesis:The AHP leads to an overall estimate of the desirability of each alternative
Complexity:The AHP integrates deductive and systems approaches in solving complex problems
The AHP can deal with the interdependence of elementsin a system and dess net insist on linear thinking
Hierarchic Structuring: The AHP reflects the natural tendency of the mind to sort elements of a system into different levels and to group like elements in each level
Measurement:The AHP provides a scale for measuring intangibles and a method for establishing priorities
Consistency:The AHP tracks the logical consistency of judgments used in determining priorities
Figure 3-2. Advantages of the Analytic Hierarchy Process. Reprinted* by permission* from Thomas J. Saaty*Decision Making for Leaders (Pittsburgh:University of Pittsburgh* 1986)* 23.
Reproduced with permission of the copyright owner. Further reproduction prohibited without permission.

Structuring a HierarchyFundamental to the application of the AHP is the
development of a hierarchy that structures a system into its component parts. Hierarchies are created to direct a system toward a desired goal or objective. The top level of' the hierarchy represents the broad objective of the judgment. Subsequent levels of the hierarchy represent homogeneous clusters of attributes related to their immediate criterion. The bottom level of the hierarchy consists of the alternatives available.
Since no specific rules exist for developing a hierarchy, thoughtful consideration must enter into its preparation. The development of the hierarchy for this project drew heavily from the comprehensive red-flag lists published by the Treadway Commission (1987, 154- 163) and the AICPA (1988, 4-5). The red flags that appear in the hierarchy are Horded in essentially the same manner as these sources. Fortunately, the amount of judgment necessary is minimized in this case since the red flags tend to follow a natural hierarchy. The hierarchy used in this study is included in Figure 3-1.
Level 0 represents the overall objective. In this study, it is the evaluation of the potential for financial fraud. Level 1 establishes three general groupings of characteristics that should be considered in the evaluation of the potential for financial fraud according to Treadway (1987, 154—i63) and the AICPA
Reproduced with permission of the copyright owner. Further reproduction prohibited without permission.

45
(1988, 4-5). Level S provides more detail with respect to each grouping of characteristics. Finally, level 3 consists of the alternatives available to the judge.
The level 3 alternatives represent hypothetical firms. Each firm reflects one set of red flag characteristics as being dominant, with the exception of the Zeta Company, which demonstrates the absence of any red flags The red f 1 rr; characteristics associated with each firm are as follows:
Alpha Company: Management CharacteristicsGamma Company: Industry CharacteristicsOmega Company: Firm CharacteristicsZeta Company: Absence of Red Flags
The AHP model formed by the subjects made an implicit selection of the firm with the most potential for financial fraud based upon the importance placed by the subject on each red flag. For example, a subject who weighted Firm Characteristics as being most important in the evaluation of financial fraud generated a model that selected Omega Company, since that category of red flags is clearly dominant.
As described, the subjects were previously asked to make explicit judgments as to the firm with the most potential for financial fraud. This wes accomplished by asking the subjects to read each case description and develop priority rankings using Saaty’s (1988, 54)
Reproduced with permission of the copyright owner. Further reproduction prohibited without permission.

46
response scale. Data gathered -from these tasks was used to address the second research question.
The Measurement Scale Saaty has developed a ratio measurement scale for
purposes of implementing the AHP (1988* 54). This scale* bounded at one and nine* is reproduced in Figure 3—3.The purpose of the scale is to establish weights as to the relative importance of each element in the hierarchy* to evaluate the consistency of the judgment (discussed below)* and to come to a decision.
Consistency Ratio Saaty (1986* 82-85) discusses the relevance of
judgment consistency to the AHP. In this sense* consistency refers to transitivity and magnitude. For example* if A is preferred to B by a multiple of 3* and B is equally preferred to C» then A should be preferred to C by a multiple of 3. However* as Saaty notes* humans violate consistency routinely for many reasons. For example* they may feel differently over time about the topic* or new information may cause them to change their opinions. If humans were perfectly consistent* they would not be permitted to change their minds or to accept new ideas. As a result* some judgment inconsistency must be tolerated.
Reproduced with permission of the copyright owner. Further reproduction prohibited without permission.
Intensity ofIiportance Definition Explanation
1 Equal importance of both eleoents
Tut eleients contribute egnally to the property
3 Ueak iiportance of one elenent over another
Experience and judgient slightly favor one eleient over another
5 Essential or strong iiportance of one eleient over another
Experience and judgient strongly favor one eleient over another
7 Demonstrated importance of one eleient over another
An eleient is strongly favored and its doiinance is demonstrated in practice
9 Absolute iiportance of one eleient over another
The evidence favoring one eleient over another is of of the highest possible order of affirsatisn
a,4,4,5 intermediate values betmeen tuo adjacent
Coapromise is needed betneen tno judgments
judgments
Figure 3-3. The Pairwise Comparison Scale.
The exact degree of tolerable inconsistency has been established by Saaty (1986* 83) as "in the neighborhood of .10 or less." The AHP provides a measure of consistency* called the Consistency Ratio (CR). If the CR is tolerable* the values of the priority vector are considered to be good approximations of a perfectly consistent judgment. Consistency ratios were computed for each subject in this study.
Reproduced with permission of the copyright owner. Further reproduction prohibited without permission.

48
Priority MatricesThe initial step toward the establishment of
priorities in an AHP model is to make pairwise comparisons against a given criterion. Saaty (1986* 76) demonstrates that the matrix is the favored approach for this analysis since it is able to identify the dual aspects of priorities. That is* one element is dominated and the other is dominating.
To carry out the pairwise comparison process! a matrix is prepared at each level of the hierarchy for each criterion. The matrices for this research study are shown in Figure 3-4i and should be read in conjunction with the hierarchy in Figure 3-1. Gnes are placed on the diagonals since an element compared to itself is of equal significance. Pairwise comparisons were made by comparing the left-hand element with the column element.For example> in the Level 1 matrix! the subject was asked to measure the relative importance of Industry Characteristics to Firm Characteristics using the Pairwise Comparison Scale in Figure 3-3. If the subject believed that Industry Characteristics are absolutely more important than Firm Characteristics in the evaluation of the potential for financial fraud! then a 9 would be placed in row 3, column 1. Alternatively! the reciprocal value! l/9i should be placed in row li column 3. This process continued for all possible pairwise
Reproduced with permission of the copyright owner. Further reproduction prohibited without permission.

49
comparisons in each matrix. The general rule is that C(n x n — n)/ai comparisons must be made in each matrix.
The matrices representing the pairwise comparisons of elements are called dominance matrices because they reflect the subject’s assessment of how one item in a comparison dominates the other. Normalized eigenvectors corresponding to the maximum eigenvalue of each matrix represent the priority weight placed by the subject on each cue. The process of normalization permits meaningful comparison among the elements in the matrix.
Once the priority weights were computed for each dominance matrix* local and global weights were calculated. A local weight is the value from the normalized eigenvector* and measures the relative importance of an item to its immediate criteria.P *r f erring ts Figure 3-4* a .ocal weight measures the relative importance (priority weight) of Firm Characteristics to Overall Evaluation* and so forth.
Global weights measure the relative importance of an element toward the overall objective* and yield the weights placed on the alternatives. A global weight is computed by multiplying a local weight of an element by the local weight of its immediate criteria. For example* in Figure 3-4* a global weight for element FC1 is computed by multiplying the FC1 local weight by the local weight on Firm Characteristics. Global weights* then*
Reproduced with permission of the copyright owner. Further reproduction prohibited without permission.

LEVEL 1
Overall Evaluatian FC IG NC
Fin Characteristics 1 Industry Characteristics 1
Naaageaeat Characteristics 1
LEVEL E
Fire IndustryCharacteristics FG1 FC2 FC3 FCt FC5 FC6 Characteristics IC1 ICS IC3
FC1 1 IC1 1FC2 I ICS 1FC3 1 IC3 1FCt 1FC5 1FC6 1
SaHageacntCharacteristics NCI NCS NC3 NCt HC5
NCI 1 NC2 1 NC3 1NC4 1NCS 1
LEVEL 3
Fire Evaluatian AC GC OC ZC
Alpha Coapany 1 Eaaaa Caapany 1Gaega Caapany iZeta Caapany 1
F ig u r e 3 -*» . M a t r ic e s f o r P a ir w is e C o m p a ris o n s .
m easu re th e r e l a t i v e im p o rta n c e o f each re d f l a g t o th e
o v e r a l l e v a lu a t io n o f th e p o t e n t i a l f o r f i n a n c i a l f r a u d .
The c o m p u ta tio n o f th e lo c a l and g lo b a l w e ig h ts g e n e ra te d
Reproduced with permission of the copyright owner. Further reproduction prohibited without permission.

51
the AHP model for each subject. For purposes of this study* the results Mere averaged across 5iiu jebts Tor interpretation and analysis in addition to an individual revieu.
Statistical AnalysesThe generation of the AHP models allowed the
researcher to address the first research question in full. Howeveri additional statistical tests were required to answer the second and third research questions. This section explains the tests in detail.
Explicit Versus Implicit Choice of Firms
The purpose of the second research question was to determine whether explicit choices made by each subject were consistent with the implicit choices made by his or her AHP model. As discussed previously! when the instrument was administered to the subjects they were asked to make all possible pairwise comparisons of firms with respect to which had the greater potential for financial fraud (based on the facts presented). The resultant dominance matrix was used to generate the normalized eigenvector of priority weights. These values represented the explicit choices of the subjects.
Implicit choices were generated directly from the AHP model. To accomplish this task* the priority weights were generated in a separate computation. Firsts
Reproduced with permission of the copyright owner. Further reproduction prohibited without permission.

52
priority vectors were calculated for the firms with respect to each red flag on level 8 of the hierarchy (Figure 3-1). Since the researcher designated the red flags that Mere present or absent in each hypothetical firm, the values for the matrix Mere predetermined.Figure 3-5 provides a summary of these matrices and corresponding priority vectors.
In the first matrix in Figure 3-5, the Omega Company has only Firm Characteristics present as red flags. Therefore, 9s Mere placed in the indicated spaces since Omega Company has absolute importance over the other three firms Mith respect to these red flags (refer to scale in Figure 3—3). The reciprocal values are appropriately placed in the matrix, and the remaining spaces are filled Mith ones since the other firms are of equal importance Mith respect to Firm Characteristics.The normalized priority vector is also shoMn. This process is applied to all of the red flags on level 8 of the hierarchy, and the resultant matrices and priority vectors are shown in Figure 3-5. Note that the priority vectors Mere identical Mithin each grouping of red-flag characteristics, so that only one matrix is illustrated for each of the three types.
The second step Mas to generate a vector of overall priorities that represented the implicit choice of firm by each subject's AHP model. The global Meight for each red flag in level 8 of the hierarchy Mas multiplied by
Reproduced with permission of the copyright owner. Further reproduction prohibited without permission.

53
the priority weight of the red flag with respect to each of the four alternative firms (Figure 3-5). Then these values were summed for each firm* resulting in the relative priority for each firm. The firm with the highest priority weight was the firm selected by the model as having the greatest potential for financial fraud. The second research question was addressed by testing the following hypothesis (stated in the null form):
HI: There is no agreement between the explicitranking of firms by a subject and the implicitranking of firms by the subject's AHP model.
Two sets of data were collected from each subject. Thesubject generated the explicit choice while the AHP modelmade the implicit firm selection based on input from thesubject.
The appropriate statistical procedure to test this hypothesis was the Spearman rank correlation coefficient? also known as Spearman’s rho. According to Siegel (1956? SOS)? this statistic is appropriate to use in determining the association between S sets of rankings. In testing this research hypothesis? each subject generated explicit rankings of the four firms and the AHP model produced implicit rankings of the four firms. Spearman’s rho was computed for each subject and tested for significance. Siegel (1956? 302-213) notes that the only requirement to use this statistic is that the data be at least ordinal.
Reproduced with permission of the copyright owner. Further reproduction prohibited without permission.

54
S in c e a r a t i o m easurem ent s c a le mss used in t h i s s tu d y *
t h i s a s s u m p tio n i s s a t i s f i e d .
For Each Fin Characteristic Priority(FC1-FC6 on Level 2 of Hierarchy) A 6 0 Z Vector
Alpha Caapany 1 1 1/9 I .00Saaaa Coapany i I 1/9 1 .00Oaega Caapany 9 9 1 9 .76Zeta Caapany I 1 1/9 1 .00
Only Oaega Caapany reflects the presence of Fin Characteristics as red flags.
For Each Hanageaent Characteristic Priority(HC1-HC5 on Level 2 of Hierarchy) A S 0 Z Vector
Alpha Caapany 1 9 9 9 .766aaaa Coapany 1/9 1 1 1 .08Oaega Coapany 1/9 1 1 1 .08Zeta Coapany 1/9 i 1 i .vu
Only Alpha Coapany reflects the presence of Hanageaent Characteristics as red flags.
For Each Industry Characteristic Priority(IC1-IC3 on Level 2 of Hierarchy) A 6 0 Z Vector
Alpha Coapany 1 1/9 1 1 .08Gaaaa Coapany 9 1 9 9 .76Oaega Coapany 1 1/9 1 1 .08Zeta Coapany 1 1/9 1 1 .08
Only Saaaa Coapany reflects the presence of Industry Characteristics as red flags.
F ig u r e 3 - 5 . M a t r ic e s and P r i o r i t y V e c to r s f o r Im p lie :C h o ic e o f F ir m .
M easures o f Consensus
T h is r e s e a r c h s tu d y r e p r e s e n te d an i n i t i a l a t te m p t
to m easure th e consensus o f i n t e r n a l a u d i t o r s in a
Reproduced with permission of the copyright owner. Further reproduction prohibited without permission.

55
judgment task. Consensus is a measure of the degree to Mhich the subjects agree Mith each other on a given judgment. The research question Mas directed toMard determining Mhether the subjects achieve consensus on their judgments as to the relative importance of individual red flags. The related research hypotheses (stated in the null form) are:
HS: Internal auditors fail to achieve consensus inranking the importance of the level 1 categories of red flags that indicate the potential for financial fraud.
H3: Internal auditors fail to achieve consensus inranking the importance of firm characteristics that indicate the potential for financial fraud.
i-K*: Internal auditors fail to achieve consensus inranking the importance of industry characteristics that indicate the potential for financial fraud.
H5: Internal auditors fail to achieve consensus inranking the importance of management characteristics that indicate the potential for financial fraud.
The appropriate statistical procedure vs test these hypotheses Mas the Kendall Coefficient of Concordance, or W statistic. According to Siegel (1956, 229), this statistic is appropriate to use in determining the association among k sets of rankings. 'he AHP model produced rankings at each level of the hierarchy.
H2 examined the categories of red-flag characteristics on level 1 of the hierarchy (Figure 3-1), while H3-H5 addressed specific red flags Mithin each category (level 2). The local Meights computed by each
Reproduced with permission of the copyright owner. Further reproduction prohibited without permission.

56
subject*s AHP model represented the ranking of importance by each subject within each level of the hierarchy.
Values of the W statistic range from 0 (no association) to 1 (perfect association). Once the U statistic was computed* it was tested for significance to determine if it was significantly different from zero.The null hypothesis was that W=0, or that no association existed between the ranks of data. A high or significant value of W implied that the judges were applying the same judgment criteria in ranking the firms. In order to use the U statistic* the data must be at least ordinal* an assumption satisfied in this study.
SummaryThis chapter has presented an overview of the
methodology used in this research study. The three research questions were discussed along with the related research hypotheses. A detailed discussion of the data collection process was presented* including a description of the subjects and the task administration process. The principal methodology* the Analytic Hierarchy Process* was described in conjunction with its relevance to the current study. Finally* the statistical tests used in this research effort were discussed.
Reproduced with permission of the copyright owner. Further reproduction prohibited without permission.

CHAPTER ** DATA ANALYSIS
This chapter presents the results of the analyses described in Chapter 3. The first section describes the sample and data collection procedures. A description of the AHP model building is provided in the second section. Sections three* four* and five address the three specific research questions and related matters. The analyses are summarized in the final section.
Data Collection The subjects used in this study were practicing
internal auditors representing a variety of industries* geographic locations* and experience levels. The task was delivered to the subjects in person to maintain control over the completion of the two-part instrument (see Appendix). That is* part one was administered prior to part two to avoid sensitizing the subjects to the red flags revealed in part two.
A total of 186 subjects participated in the study. Subjects were obtained by gaining access to internal auditor training seminars and businesses. The training sessions were sponsored by various local chapters of the Institute of Internal Auditors (IIA). Individual firms
57
Reproduced with permission of the copyright owner. Further reproduction prohibited without permission.
58
made their internal audit departments available for the study in a spirit of cooperation with the IIA because the IIA was providing financial support for the study. In addition* some subjects participated when they visited the Louisiana State University campus on official business related to the Internal Audit Pilot School.Each subject was employed as art internal auditor when he or she was associated with the study.
Two versions of the instrument were used to determine whether order of data presentation had an effect on the results. The two versions were administered to the subjects on a random basis* resulting in 83 subjects receiving version 1 and A3 receiving version S. One-way analysis of variance (ANOVA) was used to compare the mean weights placed on each of the A firms (Alpha Company* Gamma Company* Omega Company* and Zeta Company) in the implicit model* resulting in A separate ANOVAs. No statistically significant differences were noted* suggesting order made no difference. As a result* both versions have been treated as a single sample.
The SubjectsCertain demographic information was gathered from
each subject. While the data was not collected to address a specific research question* it provides insight into the subjects and may assist in interpreting results of the analyses. Experience* industry representation*
Reproduced with permission of the copyright owner. Further reproduction prohibited without permission.

59
geographic location* education* and professional certification were the demographic variables of interest. Experience
The subjects were asked to reveal the number of years of experience as an internal auditor and as an external auditor. In addition* they also indicated whether they had ever been an auditor on a fraud audit. The fraud audit could include either financial fraud* management fraud* or both. Seventy—two of the 1S6 subjects had been associated with a fraud audit* representing 57 percent of the total.
Tables 4—1 and 4-2 summarize the subjects by their years of experience as an internal auditor and as both internal/external auditor combined* respectively. Experience as an internal auditor ranged from new hire (0 years) to 31 years. Combined internal and external audit experience ranged from 0 to 38 years. The mean experience as an internal auditor was 5.8 years* while the mean combined audit experience was 7.3 years. As a result of the overall diversity in experience levels* the results of this study should be generalizable to internal auditors over a broad range of experience.Industry Representation
A variety of industries were represented by the subjects in this study. Table 4-3 provides a summary of the subject breakdown by industry. Internal auditors
Reproduced with permission of the copyright owner. Further reproduction prohibited without permission.

60
TABLE <i-lSUMMARY OF SUBJECTS3 EXPERIENCE AS INTERNAL AUDITORNumber of Number of Percentage
Years Subjects of Total
0 - 3 64 50.8> 3 - 5 8 6.3> 5 - 1 0 38 85.4> io 28 17.5
186 100.0
TABLE 4-8SUMMARY OF SUBJECTS’ COMBINED EXPERIENCE AS INTERNAL
AND EXTERNAL AUDITORNumber of Number of Percentage
Years Subjects of Total
0 1 u 54 48.9> 3 - 5 7 5.5> 5 - 1 0 34 87.0> IO 31 84.6
186 100.0sss sssss
-from public utility companies made up the major share at 36.5 percent of the total* followed by banking and retail. The retail and insurance groupings were each
Reproduced with permission of the copyright owner. Further reproduction prohibited without permission.

61
composed of a single firm. The remaining categories consisted of multiple firms. The diversity of industry membership enhances the generalizability of the results across industry groups represented by subjects who participated in this study.
TABLE 4-3BREAKDOWN OF SUBJECTS BY INDUSTRY MEMBERSHIP
Number of PercentageIndustry Subjects of Total
Public Utility 46 36.5Banking 29 23.0Retail 22 17.5Government 10 7.9Manufacturing 9 7.1Insurance 8 6.3Other 2 1.7
126 100.0
Geographic DispersionWhile the states of Texas and Louisiana supplied
the greatest number of subjects* other states were represented as detailed in Table 4—4. The southern states were most convenient in carrying out the task administration. However* the geographic representation is not considered to be of critical concern. Many of the subjects employed by firms in the south often travel as internal auditors to divisions located throughout the United States. In addition* the subjects are exposed to
Reproduced with permission of the copyright owner. Further reproduction prohibited without permission.

62
in-formation on a national level with respect to their profession as well as fraudulent financial reporting.
TABLE 4-4BREAKDOUN OF SUBJECTS BY STATE WHERE EMPLOYED
Number of PercentageState Subjects of Total
Texas 61 48.ALouisiana 50 39.7Florida 3 2.4Illinois 2 1.6Massachusetts 2 1.6Mew York 2 1.6Oklahoma 2 1.6California 1 .8Minnesota 1 .8Mississippi 1 .8Pennsylvania 1 .7
126 100.0
Education and Professional CertificationMost of the subjects (9H.1 percent) had earned at
least a bachelor’s degree in a business-related program such as accounting* finance* or management. Only 7 subjects (5.6 percent of the total) had not completed a college degree. The remaining 15 percent had earned master’s degrees. Refer to Table 4-5 for a detailed breakdown of the deqrees held by the subjects.
Approximately 50 percent of the subjects had acquired a professional designation such as CIA or CPA. While this may seem low* recall that nearly half of the
Reproduced with permission of the copyright owner. Further reproduction prohibited without permission.
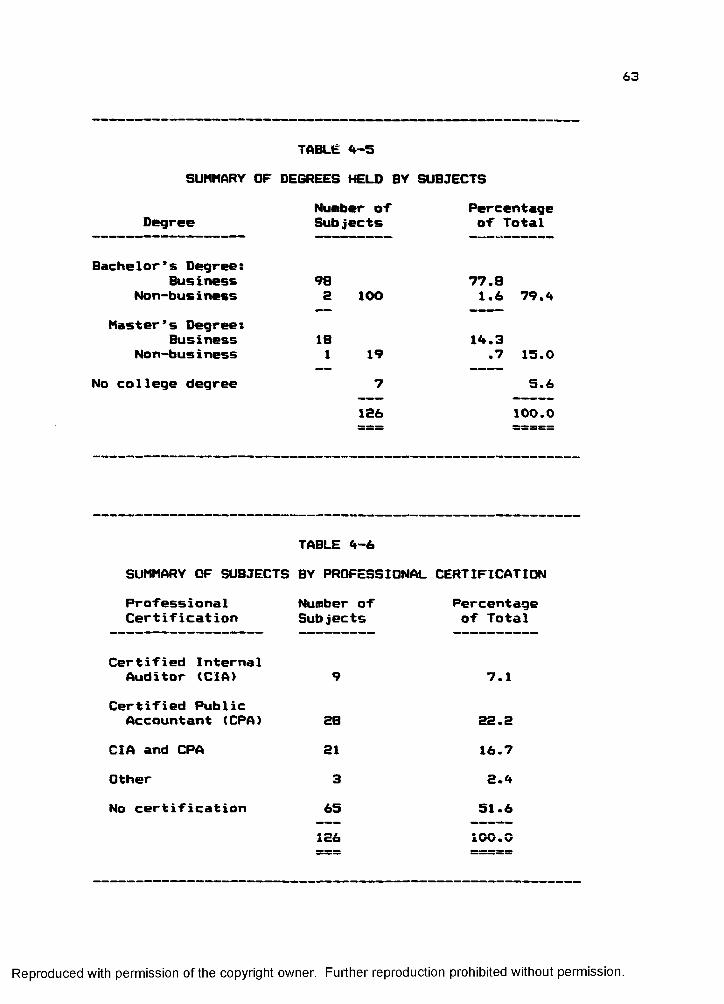
63
TABLE 4-5SUMMARY OF DEGREES HELD BY SUBJECTS
Number of PercentageDegree Subjects of Total
Bachelor’s Degree:Business 98 77.8
Non-business 2 10O 1.6 79.4Master’s Degree:
Business IB 14.3Non-business 1 19 .7 15.0
No college degree 7 5.6126 100.0
TABLE 4-6SUMMARY OF SUBJECTS BY PROFESSIONAL CERTIFICATIONProfessional Number of PercentageCertification Subjects of Total
Certified InternalAuditor (CIA) 9 7.1
Certified PublicAccountant (CPA) 2B 22.2
CIA and CPA 21 16.7Other 3 2.4No certification 65 51.6
126 100.0
Reproduced with permission of the copyright owner. Further reproduction prohibited without permission.

64
subjects fell within the 0 — 3 years of experience (Table 4-2) and may still be in the process of working toward a professional certification. Refer to Table 4-6 for a summary of subjects* professional designations.
Judgment Models llsino the Analytic HierarchyProcess
The crux of this research study was to generate an AHP model for each subject based upon responses to the pairwise comparisons in the instrument. Two separate models were actually created. One is an imp 1icit model based upon part two of the instrument wherein the ranking of firms is dependent upon the subject*s judgment of the relative importance of the specific red flags used in this study. An exolicit model was developed based upon each subject’s pairwise comparisons of the hypothetical firm descriptions presented in part one of the instrument. These points will be clarified by illustrating the process with one subject.
Example subject completed part one of the task by reading each firm description and then making all possible pairwise comparisons of the firms with respect to the question: in each pair, which firm has the greater potential for financial fraud? The intensity of importance was evaluated using the pairwise comparison scale (Figure 3—3). This process yielded the dominance matrix and priority vector in Figure 4-1, or the explicit model. The results indicated that Alpha Company,
Reproduced with permission of the copyright owner. Further reproduction prohibited without permission.

65
representing red flags that are management characteristics, had the greatest potential for financial fraud. Omega Company (firm characteristics) ranked second* Gamma Company (industry characteristics) ranked third* and Zeta Company (absence of red flags) appropriately ranked fourth. The consistency ratio will be discussed in a forthcoming section.
A G 0 ZPriorityVector Rank
Alpha (a) 1 5 5 g .634 «XGamma (b) 1/5 1 1/3 3 .106 3Omega (c> 1/5 3 1 5 .213 2Zeta (d) 1/9 1/3 1/5 1 .047 4
1 .0 0 0
Consistency Ratio = 0.067(a) Management characteristics as red flags(b) Industry characteristics as red flags(c) Firm characteristics as red flags(d) Absence of red flagsFigure <*—1. Dominance Matrix and Priority Vector for Example Subject’s Explicit AHP Model.
Part two of the task resulted in the generation of 4 dominance matrices and priority vectors representing levels 1 and 2 of the hierarchy (Figure 3-1). These matrices and vectors comprise Example subject’s imp1icit model* and also yield a ranking of the firms on level 3 of the hierarchy. Refer to Figure 4-2 for details (use Figure 3-1 to interpret the coding). Example subject
Reproduced with permission of the copyright owner. Further reproduction prohibited without permission.

66
explicitly selected Alpha Company (management characteristics) as more fraud prone* but thought that industry characteristics were more critical thus leading to the implicit selection of Gamma Company. A comparison of Example subject’s explicit (Figure A—1) and implicit (Figure 4-2) firm rankings reveals this disparity. A comparison of the implicit and explicit firm rankings is addressed in a subsequent section of this chapter in an attempt to determine whether subjects selected the same characteristics as being important in isolation as in a complex case environment.
Priority weights were computed for each category of red flags as well as for each individual red flag. These weights define the importance placed on the item relative to the others in the study. For instance* Example subject believes industry characteristics to be more important than management and firm characteristics in that order (see Figure 3-1 at level 1). The weights in the other priority vectors can be interpreted in a similar fashion. This process was performed on each of the 126 subjects* resulting in an explicit and implicit ranking of the four hypothetical firms.
Consistency RatioIn both Figures A—1 and 4-2* consistency ratios
were computed for each dominance matrix. This feature of the AHP reveals how consistent the subject’s judgments
Reproduced with permission of the copyright owner. Further reproduction prohibited without permission.

67
Level 1: Categories of Red FlagsPriorityVector(local
F I M Heights)Firm 1 1/7 1 .132Industry 7 1 3 .694Management 1 1/3 1 .174
1 .0 0 0
Consistency Ratio ' 0.069 Level 2: Firm Characteristics as Red Flags
Priority Vector (local
FC1 FC2 FC3 FC4 FC5 FC6 weights)FC1 1 1/3 1 1 1/7 1/7 .045FC2 3 1 5 5 1/5 1/5 .133FC3 1a i /cA) U 1 1 1/7 1/7 .042FC4 1 1/5 1 1 1/7 1/7 .042FC5 7 5 7 7 1 1 .369FC6 7 5 7 7 1 1 .369
1.000
Consistency Ratio = 0.038Level 3: Industry Characteristics as Red Flags
Priority Vector (local
IC1 IC2 ICS neights)IC1 1 1 5 .455ICE 1 1 5 .455IC3 1/5 1/5 1 .090
1.000Consistency Ratio — 0.000
Figure 4-2 (continued on next page). Dominance Matrices and Priority Vectors for Example Subject’s Implicit AHP Model.
Reproduced with permission of the copyright owner. Further reproduction prohibited without permission.

68
Figure A-2 continued from previous page.Level S: Management Characteristics as Red Flags
PriorityVector(local
MCI MC3 MCS MCA MCS weights)MCI 1 1 1/5 1/3 1/3 .070MCS 1 1 1/5 1/3 1/3 .070MC3 5 5 1 5 3 .507MCA 3 3 1/5 1 1 .170MCS 3 3 1/3 1 1 .183
1.C00Consistency Ratio = 0.031
Level 3: AlternativesOverall
Priorities Ran!Alpha .200 3Gamma • 5A6 1Omega .171 3Zeta .083 A
1.000□vsrall Consistency Ratio = 0.030
Figure A-3. Dominance Matrices and Priority Vectors for Example Subject’s Implicit AHP Model.
were. The consistency ratio should not exceed a value "in the neighborhood of 0.10" (Saaty 1986* 83). The 0.10 threshold allows for the normal inconsistency inherent in human judgment.
Professor Ernest Forman of George Washington University* a co-developer of Expert Choice software (Decision Support Software 1983) used in this study* has
Reproduced with permission of the copyright owner. Further reproduction prohibited without permission.
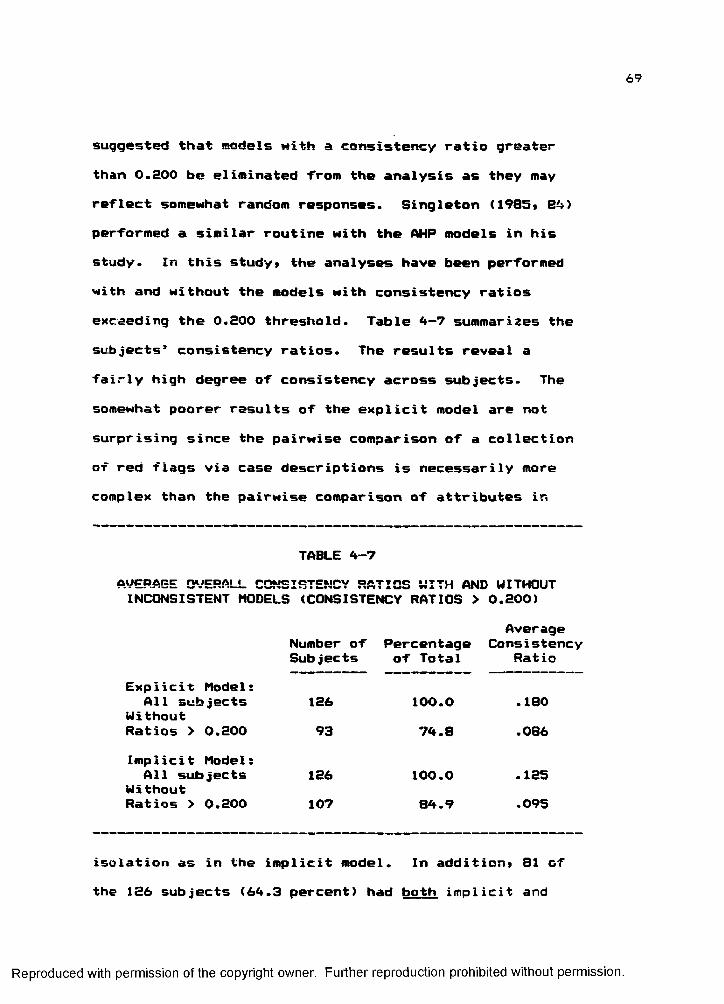
69
suggested that models with a consistency ratio greater than 0.300 be eliminated from the analysis as they may reflect somewhat random responses. Singleton (1985* 84) performed a similar routine with the AHP models in his study. In this studyt the analyses have been performed with and without the models with consistency ratios exceeding the 0.300 threshold. Table 4—7 summarizes the subjects' consistency ratios. The results reveal a fairly high degree of consistency across subjects. The somewhat poorer results of the explicit model are not surprising since the pairwise comparison of a collection of red flags via case descriptions is necessarily more complex than the pairwise comparison of attributes in
TABLE 4-7AVERAGE OVERALL CONSISTENCY RATIOS WITH AND WITHOUT INCONSISTENT MODELS (CONSISTENCY RATIOS > 0.300)
AverageNumber of Percentage Consistency Subjects of Total Ratio
Explicit Model:All subjects 136
WithoutRatios > 0.300 93Implicit Model:All subjects
WithoutRatios > 0.300
isolation as in the implicit model. In additiont 81 of the 136 subjects (64.3 percent) had both implicit and
136107
100.0
84.9.135.095
100.0
74.8.180.086
Reproduced with permission of the copyright owner. Further reproduction prohibited without permission.

70
explicit models falling below the 0.200 threshold.An analysis was performed to determine if
experience affected the subject’s ability to make consistent judgments. A summary of the results is included in Table 4-8. An interesting finding is that consistency progressively deteriorates as subjects gain experience. A possible explanation is that the less- experienced subjects took the task more seriously and were therefore more consistent. A more plausible explanation is that experienced internal auditors are not as accustomed to performing detail tasks (akin to this research task) as are internal auditors with less
TABLE 4-8SUMMARY OF INCONSISTENT MODELS BASED ON EXPERIENCE
AS INTERNAL AUDITORYears of Experience
0 - 1 > 1 - 5 > 5 TotaNumber ofinconsistent models:
Implicit 3 3 6 12Explicit 8 4 14 26
Implicit and explicit 0 3 u 7— — — — —
Total 11 10 24 45Total number of subjects 40 32 54 126Inconsistent models as a
percentage of total 27.5 31.3 44.4 35.'
Reproduced with permission of the copyright owner. Further reproduction prohibited without permission.

71
experience. Any explanation however, is tentative until future research efforts address this issue directly.
Internal Auditors* Weighting of Red FlagsThe first research question asked how the subjects
weight red flags of financial fraud. Specifically, theresearch question was:
How do internal auditors perceive the importance of the red flags that indicate the potential for financial fraud?
This question was addressed with the generation of theimplicit AHP model. Referring to Figure 4-2, the weightsof interest are the values obtained from the priorityvectors at levels 1 and 2 of the hierarchy. An implicitmodel was developed for each subject and the resultssummarized to answer this research question. Table 4-9reports the results (which are discussed in the followingparagraphs! across all 126 subjects as well as over the107 subjects with implicit models having consistencyratios falling below the 0.200 threshold discussedpreviously. Refer to Figure 3-1 to interpret the coding.The inconsistent models had a negligible influence on theaverage weights and had no effect on the averagerankings. Since the impact of the higher consistencyratios was insignificant, results were evaluated byconsidering the total sample of 126 subjects.
With respect to the categories of red flags,subjects on average ranked management characteristics as
Reproduced with permission of the copyright owner. Further reproduction prohibited without permission.

7£
being most important in the evaluation of the potential for financial fraud. As one subject noted on the instrument* "when it stinks at the top* forget it!" This statement supports the general sentiment of the subjects. Furthermore* this finding is consistent with the Treadway Commission’s (1987) recommendation that management must set the tone for integrity in financial reporting. Firm characteristics were viewed as second most important* followed by industry characteristics. In fact* industry characteristics had a very low average weight* suggesting it bears little importance to the subjects studied. Subsequent subsections provide a discussion of the results of the individual red flag analysis.
Firm Characteristics Level 2 red flags were evaluated with respect to
the category to which they belonged* and the results included in Table ^-9. For example* FC1 - FC6 were compared to each other with regard to how important each was in the examination of firm characteristics. In the analysis of firm characteristics* FCS (solvency problems or other matters that bring into question the entity’s ability to continue in existence are present) was viewed* on average* to be the most important item followed by FC6 (material related-party transactions) and FCS (organization is decentralized without adequate monitoring).
Reproduced with permission of the copyright owner. Further reproduction prohibited without permission.

73
TABLE 4-9 AVERAGE WEIGHTS ON RED FLAGS
WithoutLevel 1: ConsistencyCategories of Red Flags All Subjects Ratios > 0.200
Avg.Weight
Avg.Rank
Avg.Weight
Avg. Rank
Firm .280 2 .394 2Industry .107 3 .105 3
Level 2:
Management .613 1 .601 1
Specific Red FlagsFirm FC1 .096 5 .091 5
Characteristics FC2 .162 4 .161 4FC3 .183 3 .194 3FC4 .070 6 .067 6FC5 .27 4 1 .272 1FC6 .215 2 .215 2
Industry t n .487 1 .488 1Characteristics IC2 .302 2 .309 2
IC3 .211 3 .£03 3Management MCI .243 2 .249 2
Characteristics MC2 .117 5 .116 5MC3 .147 4 .141 4MC4 .283 1 .277 1MCS .210 3 .217 3
The result that FC5 (solvency problems) rankshighest (on average) is reasonable in view of the highly- publicized bankruptcies of recent times associated withfinancial fraud. Although FC6 (material related-party transactions) and FC3 (Organization decentralized) are
Reproduced with permission of the copyright owner. Further reproduction prohibited without permission.

7 * f
•Firm red flags* they involve managerial discretion.Subjects clearly viewed management red flags as most important* and ranked firm red flags that involved managerial influence highest within the firm red flags category.
The remaining rankings are easily interpreted by referring to the hierarchy in Figure 3-1. The least important firm characteristic* on average* was FC4 (sensitivity of operating results to economic factors).Note that FC4 is closely aligned with industry red flags.This outcome is consistent with the result that industry red flags were ranked least important (on average) as a category.
Industry CharacteristicsAlthough industry characteristics were not weighted
by the subjects as being important to the overall evaluation for financial fraud* subjects were able to discriminate between the 3 specific red flags within that grouping. Referring to Table <*-9, IC1 (profitability of entity relative to its industry is inadequate or inconsistent) had the highest average weight. Both ICS (direction of change in entity’s industry is declining with many business failures) and IC3 (rate of change in entity’s industry is rapid) relate to events independent of the firm* while IC1 suggests the possibility of management influencing the profit numbers. Insofar as
Reproduced with permission of the copyright owner. Further reproduction prohibited without permission.

75
the subjects weighted the category of management characteristics as being most important to the overall evaluation for financial fraud* they were consistent in that they weighted "managerial—type" red flags as most important within the other 2 categories. This fact reveals that the subjects strongly believe that red flags associated with management behavior are the most important.
Management CharacteristicsWithin the category of management characteristics
(Table 4-9), the importance of one red flag over another is not so clear. For the 5 red flags in this study* average weights ranged from a high of .283 on MC4 (management’s compensation is tied to reported earnings) to a low of .117 on MC2 (management’s attitude toward financial reporting is unduly aggressive). Each average weight lies close to .200* the weight that would indicate the red flags were equally weighted with respect to the category. The fairly tight range of average weights suggests that the subjects tended to believe they were somewhat equally important with respect to the evaluation of management characteristics as a category.
Frequency distribution analysis was performed in an attempt to clarify how the subjects ranked management characteristics since the average weights were clustered so tightly. Examination of the results in Table 4-10
Reproduced with permission of the copyright owner. Further reproduction prohibited without permission.

76
reveals that MCS tmanagement*s attitude toward financial reporting is unduly aggressive) was ranked least important most of the timei with 84.95 percent of the rankings at 3 or higher. Frequency distributions of the rankings for MCI* MC3* MC4, and MC5 (see Figure 3—i for translation) support the notion that* on whole* the subjects were unable to clearly distinguish among the management characteristics with respect to the impact on the potential for financial fraud. This finding suggests that the subjects felt they were all important.
TABLE 4-10FREQUENCY DISTRIBUTION OF MANAGEMENT
CHARACTERISTICSNumber of Subjects Assigning Rank
(Xage of total)1 S 3 4 5 Tota]
MCI 36 (SB.57'
S7 (SI.43)
15(11.90)
30 (S3.81)
18 (14.S9)
1S6
MCS a< 1.59)
17(13.49)
30 (S3.81)
45(35.71)
3S(55.40)
1S6
MC3 14(11.11)
19(15.08)
39 (S3.OS)
as(17.46)
4S(53.33)
126
MC4 51(40.47)
S8(sa.aa)
SI(16.67)
13(10.3S)
13(10.35)
156
MC5 S3(18.S5)
39(30.95)
S9 (S3.OS)
SI(16.67)
14(11.11)
1S6
The first research question asked how internal auditors perceive the importance of the red flags that
Reproduced with permission of the copyright owner. Further reproduction prohibited without permission.

77
indicate the potential for financial fraud. On average* t h e ju d g ed Ctei-iageiiie-.it c h a r a c te r l a i t i e s e e e e i r.-g
the most important indicators of the potential for financial fraud. Industry characteristics mere ranked least important with firm characteristics falling in between.
Comparison of the Implicit and Explicit ModelsThe second research question was an attempt to
determine if the implicit AHP model produced resultssimilar to the subject's explicit evaluation ofhypothetical firm descriptions. The purpose was todetermine if the model would make the same ranking of theA firms as the subject would directly. As mentionedpreviously with respect to Figures A-l and A-2* theExample subject’s implicit and explicit models were notin agreement. The specific research question was:
Are explicit judgments made by an internal auditor in hypothetical firm descriptions consistent with the implicit judgments made by the corresponding AHP model?
This question was asked with respect to each subject’sranking of the A hypothetical firms: Alpha Company*Gamma Company* Omega Company* and Zeta Company. Theresearch hypothesis (stated in the null form) was:
HI: There is no agreement between the explicitranking of firms by a subject and the implicit ranking of firms by the subject’s AHP model.
This hypothesis was tested using Spearman’s rho* anonparametric statistic that measures the degree and
Reproduced with permission of the copyright owner. Further reproduction prohibited without permission.

78
significance of association between 5 sets of ranked data. In this case* n=4 since there are 4 firms to compare for each subject. The difficulty encountered in this study was that for n=4* rho must be equal to 1.00 to be statistically significant (perfect positive correlation). Unless there was perfect agreement between the explicit and implicit rankings* the null hypothesis could not be rejected. That is* no degree of correlation less than 1.00 could be detected since "n" was so small.
In testing HI using Spearman’s rho* the hypothesis was rejected for 36 of the 1S6 subjects. This means that perfect agreement in rankings between the implicit and explicit models occurred only 58.6 percent of the time.If the analysis is repeated without those subjects whose explicit and/or implicit models had consistency ratios greater than 0.500* there is a marginal improvement in the results. Of the 81 subjects with consistency ratios less than 0.500* HI could be rejected 54 of 81 times* or for 59.6 percent of the subjects. A summary of these results is included in Table 4-11.
The results of Spearman’s rho suggest that nearly two—thirds of the subjects did not have significant association between the rankings of the implicit and explicit models. Due to the limitation of n=4* additional correlation analysis was performed. The Pearson correlation coefficient was used on the weights
Reproduced with permission of the copyright owner. Further reproduction prohibited without permission.

79
(versus the rankings) of" the implicit and explicit models. Once again* since the correlation had to be at least equal to .910 to be statistically significant. The results inslcale that nearly 75 percent of the subjects had insignificant correlation between the weights on their implicit and explicit models. Refer to Table 4-12 for a summary of the correlation analysis.
TABLE 4-11RESULTS OF SPEARMAN’S RHO ANALYSIS
Number with Percentagerho = 1.00* of Total
All subjects (126) 36 28.6Without ratios < 0.200 (81) 24 29.6
♦significant at alpha = .05
TABLE 4-12RESULTS OF CORRELATION ANALYSIS
Number With Significant* Correlation
Percentage of Total
All subjects (126) 37 29.4Without ratios < 0.200 (81) 23 28.4
*alpha = .05
Reproduced with permission of the copyright owner. Further reproduction prohibited without permission.

so
These statistical results Mere discouraging since cursory review of the data reveals that Alpha Company (management characteristics) was frequently ranked first and Zeta Company (absence of red flags) last by both the implicit and explicit models. Therefore some degree of association Mas present. As a result, tMo other types of overall analyses were performed. The first Mas to measure the degree of association betMeen the implicit and explicit Meights across ail subjects using the Pearson correlation coefficient. This analysis Mas performed Mith and Mithout the models Mith consistency ratios exceeding 0.200. The results are summarized in Table A-13.
TABLE <i-13CORRELATION OF IMPLICIT AND EXPLICIT WEIGHTS ON FIRMS
ACROSS SUBJECTSCorrelationCoefficient
All subjects (126) .533*Without ratios < 0.200 (81) .559*
♦significant at alpha = .10
This analysis indicates a moderate level of association betMeen the implicit and explicit models, but not as much as would be desirable. Removing the inconsistent models improves the statistic only slightly.
Reproduced with permission of the copyright owner. Further reproduction prohibited without permission.

81
The ramifications inherent in this result are threefold: either the implicit AHP model not robust or the subjects encountered difficulty in making pairwise comparisons of the hypothetical firms in the explicit model* or both. Since two models are being compared* it is not possible to say whether the low correlation is attributable to one or the other or both models being poor representations of the subjects’ judgments.However* even these conclusions must be expressed with caution since the correlation coefficients are not statistically significantly different from zero.
Since the ultimate goal of the AHP Is fco rank alternatives* a second approach was to review the rankings (Saaty 1986* 2). Frequency distributions were prepared for each firm to compare the implicit and explicit rankings. This frequency distribution analysis was performed with and without the inconsistent models. Since the results with and without the inconsistent models were so similar* the analysis with all 126 subjects is presented in Table 4-14. Careful review of the frequency distributions reveals a few items of interest. Alpha Company (management red flags) was ranked first most of the time by both the explicit and implicit models. Sixty-two subjects (49.21 percent) ranked Alpha Company first with both models. Gamma Company (industry red flags) was ranked third most of the
Reproduced with permission of the copyright owner. Further reproduction prohibited without permission.

82
time by both models. Furthermore* 65 (51.59 percent) subjects ranked it third with both models. Zeta Company (no red -flags) was ranked -fourth a majority of the time by the implicit and explicit models. In fact* 113 (89.68 percent) subjects ranked it -fourth with both models. The only clouded results are with respect to Omega Company (firm red flags) in that the implicit models tended to rank it second* while the explicit models split between first and second.
A possible conclusion is that* on an overall basis* the rankings of the four firms bv the implicit and explicit models appear to be in general agreement. Since the ultimate objective of the AHP is to rank alternatives (Saaty 1986* 2)* then the fact that the rankings tend to be the same on an overall basis provides positive support for the application of the AHP to rank priorities. Note that the firm most frequently ranked as being most susceptible to financial fraud (by both models) is the Alpha Company* which represents management characteristics as red flags. This result is consistent with the earlier finding that subjects weighted management characteristics as the most important in the overall evaluation for financial fraud. Alternatively* Zeta Company ranked last in nearly every case (by both models) indicating the subjects were able to appropriately perceive it as a company free of red flags.
Reproduced with permission of the copyright owner. Further reproduction prohibited without permission.

TABLE 4-14FREQUENCY DISTRIBUTIONS OF IMPLICIT AND EXPLICIT MODELS
Explicit Models
FirmRed Flag Presented
Number1
of Subjects Assigning (Xage of total)8 3
Rank4
Aloha Management 69t54.76>
31(8h .61>
S3(18.85)
3( 8.38)
□mega Firm 4808.10)
55(43.65)
80(15.87)
3( 8.38)
Gamma Industry 13(10.31)
37(89.37)
73(57.94)
3( 8.38)
Zeta None 1( .79)
3( 8.38)
9( 7.15)
113(89.68)
ImDlicit Models
FirmRed Flag Presented
Number1
of Subjects Assigning (Xage of total)
8 3Rank
4
Alpha Management 110(87.30)
14(11.11)
8( 1.59)
0( 0.00)
Omega Firm 80(15.87)
97(76.98)
9( 7.15)
0( 0.00)
Gamma Industry 4( 3.17)
13(10.38)
109(86.51)
0( 0.00)
Zeta None 0( 0.00)
0( 0.00)
C 186 ( 0.00) (100.00)
ConsensusConsensus is a common measure of judgment
achievement in the absence of an objective or known
Reproduced with permission of the copyright owner. Further reproduction prohibited without permission.

84
criterion response. Consensus is a Measure of the level of interjudge agreement Mith respect to a response or judgment made by experts. Generally accepted practices are the norm for the auditing profession and reflect consensus of its members. In this study* consensus was evaluated at levels 1 and 8 of the hierarchy (Figure 3-1) in an effort to determine the extent to which the sub iects agree or disagree on the weighting of the red flags and categories of red flags. The research questionN o a i
Do internal auditors achieve consensus in their ranking of the importance of the different red flags and categories of red flags?
There are 4 research hypotheses associated with thisoverall question* and each will be addressedindividually.
Consensus was measured using the KendallCoefficient of Concordance* or U statistic. Thisnonparametric test is used to measure the degree andsignificance of association among k sets of ranked data.A high and significant value of U implies the subjectswere applying the same standard to some degree in makingthe judgment. This does not suggest that the rankingsare correct* only that there exists some level ofagreement among the subjects. U can assume values from 0(complete disagreement) to 1 (complete agreement).
Each of the t hypotheses were tested with andwithout the models having consistency ratios greater than
Reproduced with permission of the copyright owner. Further reproduction prohibited without permission.

85
O.SOO. Since consensus was evaluated with only the implicit model« 107 subjects were available for the "without" group (refer to Table 4-7). However* the exclusion of the inconsistent models had little bearing on the results.
Categories of Red FlagsTo measure consensus at level 1 of the hierarchy
(Figure 3-l>* the following hypothesis was tested (statedin the null form):
HE: Internal auditors fail to achieve consensus inranking the importance of the level 1 categories of red flags that indicate the potential for financial fraud.
Results of the W statistic for HS as well as H3 throughH5 are summarized in Table 4-15.
Based on the relatively high and statisticallysignificant value of the kl statistic (.717)* HS isrejected. Clearly the subjects achieved a moderatelyhigh level of agreement in their ranking of the level 1categories of red flags. That is* management red flagsdominated as most important with industry red flags leastimportant. Mote that the exclusion of the inconsistentmodels had little impact on the W statistic.
Firm Characteristics The evaluation of consensus at level S of the
hierarchy (Figure 3-1) called for the consideration of *>e level of interjudge agreement within each of the 3
Reproduced with permission of the copyright owner. Further reproduction prohibited without permission.

06
categories o'f red 'flags. The null hypothesis to test Tor consensus of the ranking of firm characteristics was:
H3: Internal auditors fail to achieve consensus inranking the importance of firm characteristics that indicate the potential for financial fraud.
Referring once again to Table 4-15* the U statistic for H3 was .306 for all subjects and .359 when the inconsistent models Mere excluded. These U values Mere statistically significant. Since the U values Mere so low, it appears that the subjects tended to disagree as to the relative importance of the red flags Mithin this category. As a result* H3 Mas not rejected.
Industry CharacteristicsThe hypothesis to test consensus within the
category of industry characteristics was:HA: Internal auditors fail to achieve consensus in
ranking the importance of industry characteristics that indicate the potential for financial fraud.
As noted in Table 4-15* the W statistics for industrycharacteristics are quite low (.£03 and .218) andindicate a high level of disagreement. Consequently* HAcould not be rejected indicating there was not consensusamong the subjects in their ranking of industrycharacteristics that are red flags.
Management Characteristics Consensus in the grouping of management
Reproduced with permission of the copyright owner. Further reproduction prohibited without permission.

87
characteristics was tested with the fellowing null hypothesis:
H5: Internal auditors fail to achieve consensus inranking the importance of management characteristics that indicate the potential for financial fraud.
As measured by the U statistic* consensus clearly did notoccur. The W values of .139 and .146 (Table 4—15)indicate that the subjects nearly perfectly disagreed onthe rankings of these red flags. As a result* H5 couldnot be rejected.
One possible explanation for the apparent lack of consensus may be drawn from an examination of Table 4-9. As mentioned previously* the average weights on management characteristics (level 2) were tightly clustered near .200* the value that would be obtained if all were judged to be equally important. By forcing subjects to rank these red flags* slight differences in weights could yield very different rankings. Although H5 could not be rejected* it could be that the ranking process is not powerful enough to detect agreement when the variance of the average weights is so low. This explanation may not hold for firm and industry characteristics* however* since the average weights covered a wider range (Table 4-9).
Consensus Measures Based on ExperienceAs an additional test of consensus* the sample was
Reproduced with permission of the copyright owner. Further reproduction prohibited without permission.

se
divided betMeen -hose subjects with up to and including 5 years experience in internal/external auditing combined and those subjects Mith greater than 5 years of experience. The purpose of this procedure Has to determine Mhether or not experience played a part in the level of agreement across subjects. Consensus Mas
TABLE **—15 MEASURES OF CONSENSUS
Without All Consistency
Subjects Ratios > 0.S00 (126) (107)
Categories of red flags (H2) .717* .727*Firm characteristics (H3) .306* .329*
Industry characteristics (H4) .203* .218*Management characteristics (H5* .139* .146**p-value < .001
measured using the Kendall Coefficient of Concordance at levels 1 and 2 of the hierarchy. The same procedures Mere followed as Mith the total sample just discussed.The results of consensus measures based on experience are included in Table 4-16. Since the results are so similar for each of the two groups* any conclusions Mith respect to experience would be tentative. In general* subjects with and without experience tend to achieve similar levels of agreement or disagreement with respect to the rankings of the red flags and categories of red flags.
Reproduced with permission of the copyright owner. Further reproduction prohibited without permission.

89
TABLE **-16MEASURES OF CONSENSUS BASED ON SUBJECTS’ COMBINED
EXPERIENCE AS INTERNAL AND EXTERNAL AUDITORThrough 5 Greater ThanYears 5 YearsExperience Experience(61 subjects) (65 subjects)
Categories of red flags (H2) .760* .698*Firm characteristics (H3) .277* .368*
Industry characteristics (H6) .201* .217*Management characteristics (H5) .200* .102*
- AA« .VOIUC V • S/S/ X
Summary of Results A total of 126 practicing internal auditors
participated in this research study. While they were not drawn as a random sample of the population of practicing internal auditors* they do represent a variety of experience levels* industries* and geographic locations. All but 7 of the subjects had earned at least a bachelor's degree. Given the heterogeneous nature of the sample* the results of this study may be generalizable over a cross-section of practicing internal auditors.
Five hypotheses were developed to test 2 of the 3 research questions. A summary of the results of these tests is provided in Table 6-17. Only H2 could be firmly rejected. The results of HI were mixed* and H3* H6* and H5 clearly could not be rejected. The first research
Reproduced with permission of the copyright owner. Further reproduction prohibited without permission.

90
question was addressed via the development of an AHP judgment model -for each subject rather than through hypothesis testing.
The strongest conclusion is that management characteristics are the most important to the internal auditors in the overall evaluation of the potential Tor
TABLE 4-17 SUMMARY OF HYPOTHESIS TEST RESULTS
Null Hypothesis Statistical Test Outcome
HI: No agreement between implicit and explicit models
HE: No consensus inranking of red flag categories (level 1)
Spearman’s rho
Kendall Coefficient of Concordance
Reject for 36 of 126 subjectsReject
H3: No consensus in ranking of firm characteristics
Kendall Fail toCoefficient of rejectConcordance
H4: No consensus inranking of industry characteristics
Kendall Fail toCoefficient of rejectConcordance
H5: No consensus inranking of management characteristics
Kendall Fail toCoefficient of rejectConcordance
financial fraud. This result is supported by the average weight placed on the category* management characteristics* as well as the fairly high level of consensus on the category rankings. Consensus within the groupings of red flags was not readily apparent.
Reproduced with permission of the copyright owner. Further reproduction prohibited without permission.

91
In tests of whether the implicit AHP models produced results similar to the explicit AHP models* the results were mixed. The "n" was not large enough to give the statistical tests the power to detect anything but neai— perfect association. However* an overall test of the implicit and explicit models reveals that they both tended to rank Alpha Company (management characteristics) first* Gamma Company (Industry Characteristics) third* and Zeta Company (absence of red flags) fourth. The agreement between the two models was not as high for Omega Company (Firm Characteristics). However* at least on an overall basis* the two models appear to be generating similar rankings on the alternatives.Implications of these results are discussed in Chapter 5.
Reproduced with permission of the copyright owner. Further reproduction prohibited without permission.

CHAPTER 5 SUMMARY AND CONCLUSIONS
This chapter provides an overall summary of the research study and the implications of the results. Limitations of this research are addressed as well. Finally* suggestions for extensions of this research are presented.
Summary and Implications The Treadway Commission issued its final report of
recommendations to deter* detect* and prevent financial fraud in October 1987. The importance of the role of the internal auditor was emphasized as being critical in this capacity due to their unique role in the corporation.The Treadway Commission (1987) identified indicators (red flags) of financial fraud that should alert internal auditors and others to the possibility that financial fraud has occurred. Many of these red flags also appear in SAS No. 53* The Auditor’s Responsibility to Detect and Report Errors and Irregularities (AICPA 1988* 4-5).
Little research has focused on financial fraud issues* and no prior studies have attempted to examine the judgment of internal auditors. Furthermore* attempts to measure consensus of internal auditors in a judgment
9 2
Reproduced with permission of the copyright owner. Further reproduction prohibited without permission.
93
task are scarce. This study has been a -first attempt to fill this void in the literature* by specifically focusing on internal auditor judgment in a financial fraud context.
The overriding objective of this research effort was to examine how internal auditors were able to identify red flags and now they Mould weight or rank their importance in performing an overall evaluation of the potential for financial fraud. This objective was accomplished using the Analytic Hierarchy Process (AHP) to model each subject’s judgment. The results were averaged and summarized across all subjects as well as across subjects without inconsistent models. There is little doubt that management characteristics are the most important type of red flag to the internal auditors in this study. Industry characteristics* on the other hand* received very little weight.
One implication of this result is that the internal auditors focus on incentives rather than opportunities. Although an opportunity to commit financial fraud may be present (firm or industry characteristics)* the incentive (management characteristics* e.g.* compensation tied to reported earnings) is necessary for the fraud to occur.A concern is that internal auditors may be ignoring risk situations in which opportunities are present (firm and industry characteristics) yet where management projects a
Reproduced with permission of the copyright owner. Further reproduction prohibited without permission.

9A
-false sense of integrity. Internal auditors Mho are engaged in operational audits may encounter these opportunities and disregard them because the incentives are not apparent. A significant finding of this research study is that internal auditors should be made aware that the firm and industry characteristics must be considered even in the apparent absence of management red flags.
An evaluation of the usefulness of the AHP to model internal auditor judgment was made by comparing each subject’s implicit and explicit models. While some difficulty was encountered with power of the the statistic and the small "nB> over 25 percent of the subjects’ implicit and explicit models provided identical rankings of the A alternative firms. A comparison of the frequency distributions of the rankings of the implicit and explicit models for each firm indicates a high level of agreement between the 2 models on an overall basis.These results support the use of the AHP as an aid in ranking the importance of various alternatives. Since this is the intended purpose of the AHP, its continued application in auditing research is supported.
Consensus was found to be fairly high in the ranking of the groupings of red flag characteristics.Hi thin each of the 3 groupings, however, consensus was not detected. Perhaps a reason for the lack of consensus was that the statistic used compared rankings across subjects and could not detect slight differences in the
Reproduced with permission of the copyright owner. Further reproduction prohibited without permission.

95
weights. The more details that a subject must ranki the more complex the task becomes. The high consensus at level 1 of the hierarchy is an indication that internal auditors tend to agree on the general approach to the overall evaluation for financial fraud. Whether the approach is correct or not remains a normative, question. Experience does not appear to be a factor in the consensus measures in this study.
Consistency is an important issue with AHP applications. The consistency ratio offers a mathematical measure of the subject’s ability to exercise logic in the assignment of importance in each pairwise comparison. An example of a perfectly consistent judgment is: A is 9 times more important than B and 9times more important than C— therefore* B and C are equally important. Consistency measures both transitivity and magnitude. A consistency ratio in the neighborhood of 0.10 is considered satisfactory* and models with ratios greater than 0.20 should be excluded from the analysis since they may represent somewhat random judgments. In this study* analyses were performed with and without the inconsistent (greater than 0.20) models with negligible impact on the results.Furthermore* the average consistency ratios of the models with ratios less than 0.20 fell below the 0.10 threshold. This is a very positive outcome. First* the internal
Reproduced with permission of the copyright owner. Further reproduction prohibited without permission.

96
auditors tended to express their judgments in a logical manner. Second* the results do not vary significantly with removal of the inconsistent models* suggesting that the AHP is fairly robust with respect to inconsistent judgments.
However* experience was found to be inversely associated with the number of inconsistent models. That is* fewer inconsistent models were noted among the lessei— experienced subjects. The implication is that as internal auditors become more experienced and involved with the overall picture* they may lose some skill in analyzing details. Career training sessions could focus on this issue.
LimitationsThe subjects used in this study were not a random
sample of practicing internal auditors* but a convenience sample of internal auditors who expressed a willingness to participate. Consequently* the results may not be generalizable to the population of internal auditors. However* this limitation has been overcome to some extent by including a variety of subjects in the sample. The benefits of controlling the task administration in this exploratory study were deemed to outweigh the benefits and costs associated with random sampling.
Another limitation of this study is that a majority of the subjects represent regulated industries (e.g.*
Reproduced with permission of the copyright owner. Further reproduction prohibited without permission.

97
public utility). Internal auditors in regulated (as opposed to unregulated) industries nay have a different perspective on issues associated with the potential for financial fraud. The results are limited to the extent this may be true.
This study has been an attempt to measure real- world phenomenon in an artificial setting. A normally complex judgment was reduced to a relatively simple level. The results* therefore* may not be representative of the real world. However* it is impractical to consider all the possible cues that enter into the judgment of all internal auditors in the evaluation of the potential for financial fraud. Furthermore* this study examined red flags as homogeneous groupings (i.e.* firm* industry* and management). In reality* these groupings may overlap or interrelate in a manner not provided for in the model used in this study. As a result* conclusions drawn to situations not depicted by the model used in this study should be expressed with caution.
An assumption was made that the AHP is an appropriate technique for modeling internal auditor judgment. Yet nothing exists in the psychology literature to prove or disprove this assumption. There is* nonetheless* healthy debate favoring the AHP as a tool to model judgment (Zahedi 1986). The AHP is a linear aggregation process and much of the judgment
Reproduced with permission of the copyright owner. Further reproduction prohibited without permission.

98
research in auditing supports the notion that such judgments are linear. Libby (1981) offers documentation to support this assumption.
internal auditors typically work as a team in making complex decisions such as the overall evaluation for financial fraud. This study is limited in that only individuals were examined. The dynamics of group interaction were not considered. However> the individual brings a judgment to the team* suggesting that study of the individual is the logical first step.
Suggestions for Future Research Most of the suggestions for future research are
borne of the limitations just discussed. The others* however, are suggested by the findings of the study.This research study was an initial attempt to explore the judgment of internal auditors in a financial fraud context. As a result* there was no basis for a priori expectations of the outcome. Now that these results are available* extensions of this line of research are suggested.
This study could be replicated using external auditors as they are also concerned with evaluating the risk of financial fraud* particularly in view of the recent issuance of SAS No. S3* The Auditor’s Responsibility to Detect and Report Errors and Irregularities (AICPA 1988). It would be enlightening to
Reproduced with permission of the copyright owner. Further reproduction prohibited without permission.
99
learn whether the external and internal auditors engage in similar judgment processes.
More research should be performed to consider whether firm and/or industry characteristics (red flags) are disregarded in practice or considered only in the presence of management red flags. Since the former were not weighted as heavily as the latter* some concern exists as to whether they receive the appropriate level of attention.
Further applications of the AHP to model auditor judgment are encouraged. The subjects quickly learned the process and enjoyed the task. Furthermore* the relatively low consistency ratios support the premise that the subjects are able to understand the logic cf the pairwise comparison process. Future AHP research studies could focus on applications in which the subject supplies responses directly using Expert Choice software (Decision Support Software* 1983). The use of the software gives the subject the opportunity to adjust responses until an acceptable consistency ratio is computed. Then all the data would be generated from consistent models and may be more readily interpretable.
Additional research could examine reasons for apparent lack of consensus. In this study it could be attributable to the fact that subjects had difficulty considering so many cues in the model and assigning
Reproduced with permission of the copyright owner. Further reproduction prohibited without permission.

100
importance to them. Other research contexts should be considered to determine whether lack of consensus is a function of task complexity, the AHP methodology, or true disagreement among internal auditors.
Future studies could develop models with more and/or different red flags. In addition, further research could address red flags of employee fraud rather than financial fraud. The former is also of concern to the internal auditor.
Finally, this study could be extended to evaluate the judgments that internal auditors make as teams rather than as individuals alone. An interesting question is whether group dynamics would lead to judgments that were significantly different from the those made by the individuals in this study.
Reproduced with permission of the copyright owner. Further reproduction prohibited without permission.

BIBLIOGRAPHY
Albrecht* W. Steve* Keith R. Howe* and Marshall B.Romney. 1984. Deterring Fraud: The InternalAuditors Perspective. Altamonte Springs* FL: TheInstitute of Internal Auditors Research Foundation.
Albrecht* W. Steve* and Marshall B. Romney. 1986. Red-Flagging Management Fraud: A Validation. Advancesin Accounting 3: 323-333.
American Institute of Certified Public Accountants* Auditing Standards Board. 1975. Statement on Auditing Standards No. 9, The Effect of an Internal Audit Function on the Scope of the IndependentAuditor’s Examination. Mew York: ATC.PA.
__________ • Auditing Standards Board. 1977. Statementon Auditing Standards No. 16* The Independent Auditor’s Rgca>u<*sibi 1 itv for the Detection of Errors and Irregularities. New York: AICPA.
__________ * Auditing Standards Board. 1988- Statementon Auditing Standards No. 53* The Auditor’s Responsibility to Detect and Report Errors and Irreou1arities. New York: AICPA.
Arrington* C. Edward* William Hillison* and Robert E. Jensen. 1984. An Application of Analytical Hierarchy Process to Model Expert Judgments onAnalytical Review Procedures. Journal of Accounting Research 22 (Spring): 298-312.
Cohen* Manuel F.* Chairman. 1978. The Commission on Auditors* Responsibilities: Report* Conclusions* and Recommendations. New York: The Commission on Auditors’ Responsibilities.
Decision Support Software* Inc. 1983. Expert Choice. McLean* VA: Decision Support Software* Inc.
Dyer* James S.* and Richard E. Wendell. 1984/1985. A Critique of the Analytic Hierarchy Process.Working Paper 84/85-4—24. Department of Management* University of Texas at Austin.
101
Reproduced with permission of the copyright owner. Further reproduction prohibited without permission.

10 2
Financial Accounting Standards Board. 1980. Statementof Financial Accounting Concepts No. 2: Qualitative Characteristics of Accounting Information.Stamford* CT: FASB.
Sreanias* George C. 1932. The Foreion Corrupt Practices Act. D. C. Heath and Company.
Harper* Robert M.* Jr. 1984. Internal Control in Local Area Networks: Consensus of Auditors’ Judgments.DBA diss.» Florida State University.
Levy* Marvin M. 1985. Financial Fraud: Schemes andIndicia. Journal of Accountancy (August): 78-87.
Libby* Robert. 1981. Accounting and Human Information Processing: Theory and Applications. EnglewoodCliffs* NJ: Prentice-Hall* Inc.
Lin, Thomas W. 1987. Multiple Criteria Decision Making in Auditing: The State-of-the-Art (Winter): 1,4-6.
Lin, U. Thomas* Theodore J. Mock* and Arnold Wright.1984. The Use of the Analytic Hierarchy Process as an Aid in Planning the Nature and Extent of Audit Procedures. Auditing; A Journal of Practice & Theory 4 (Fall): 89-99.
McDermott* Nancy Ann. 1986. The Internal AccountingControl System in a Microcomputer Environment: An Analytic Hierarchy Process Approach. Ph.D. diss.* The George Washington University.
Saaty, Thomas L. 1986. Decision Making for Leaders. Pittsburgh, PA: University of Pittsburgh.
___________. 1988. The Analytic Hierarchy Process.Pittsburgh; PA: University of Pittsburgh.
Siegel* Sidney. 1956. Nonparametric Statistics for the Behavioral Sciences. New York: McGraw-Hill BookCompany.
Singleton* Larry G. 1985. A Field Test of thePerceptions of the Qualitative Characteristics of Statement of Financial Accounting Concepts No. 2 by Practicing CPAs. Ph.D. diss.* Louisiana State University.
The Institute of Internal Auditors. 1985. Statement on Internal Auditing Standards (SIAS) No. 3* Deterrence* Detection* Investigation* and Reporting of Fraud. Altamonte Springs, FL: IIA.
Reproduced with permission of the copyright owner. Further reproduction prohibited without permission.

10 3
__________ . September 1986. The Role of the InternalAuditor in the Deterrence. Detection, and Reaorfcino of Fraudulent Financial Reporting. Altamonte Springs* FL: IIA.
__________ . 1987. Statement on Internal AuditingStandards (SIAS) No. a* Internal Auditors* Relationships with Independent Outside Auditors. Altamonte Springs* FLs IIA.
Treadway* James C.* Jr.* Chairman. October 1987. Report of the National Commission on Fraudulent Financial Reportino.
U. S. Congress* House. 1986. Financial Fraud Detection and Disclosure Act of 1986. 99th Cong., 2d sess.i H.R. 5439.
Zahedi* Fatemeh. 1986. The Analytic Hierarchy Process— A Survey of the Method and its Applications. Interfaces 16 (July - August): 96-108.
Reproduced with permission of the copyright owner. Further reproduction prohibited without permission.

APPENDIXINSTRUMENT FOR COLLECTION OF DATA
104
Reproduced with permission of the copyright owner. Further reproduction prohibited without permission.

1 0 5
EVALUATION OF THE POTENTIAL FOR
FINANCIAL FRAUD
PART I
Study byBarbara Apostolou Doctoral Candidate
Louisiana State University
Reproduced with permission of the copyright owner. Further reproduction prohibited without permission.

1 0 6
EVALUATION OF THE POTENTIAL FOR FINANCIAL FRAUD
This instruaent is designed to olteit your }udg*r>»it about the svaluation of tho potantial Tor financial fraud. You Mill bo askad to aaka a sarios of pairuisa coaparisons Mith raspact to a given objective. In aach pair of itaas> you ara to avaluata tha ralativa iaportanca of tha tMO itaas according to a proas tab li shad scala.
In Octobar 19B7, tha National Coaaission on Fraudulant Financial Reporting (TraadMay Coaaission) issuad thair final raport on tha aaasuras to ba takan by coapanias and auditors to datar and datact financial fraud. Financial Traud is dafinad by tha TraadMay Coaaission as “intentional or racklass conduct. Mhathar act or oaission. that rasults in aatartally aislaading financial stataaants." Thair definition oxcludas employee eabezzleaent. In thair raport. tha rola of tha internal auditor is stressed as being a significant elaaant in tha prevention and detection of financial fraud.
Your responses should reflect your personal opinion. All responses Mill reaain strictly confidential, and only suaaary rasults Mill ba reported.
THANK YOU FOR YOUR ASSISTANCE IN THIS STUDY
Reproduced with permission of the copyright owner. Further reproduction prohibited without permission.

Reproduced with permission of the copyright owner. Further reproduction prohibited without permission.

108
INSTRUCTIONS
You Mill be asked to sake a series of pairMiae comparisons Mith respect to a given objective. For example, suppose you are
5 r5*sSUrsrit tskc SpSClS* tc fcf Hfnnar. Tnthe process of making your decision as to where to go> you eight consider the ieportance or doeinance of various criteria. Using the scale provided belOMi a pairwise comparison of the relative ieportance of the following features say be eadet
Note that in each situation, a number is placed next to only one of the iteas in each pairwise comparison. If you wish to use a
place it next to either item in the pairwise comparison.
PLEASE INDICATE VOUR RESPONSES WITH THE FOLLOWING NUMERICAL SCALE1
Intensity of Importance Definition
Intimate atmosphere i Duality of service ___
Duality of service i Cost of meal
1 Equal Ieportance of both items to thw objective
3 Weak Importance of this item over the other item
5 Strong Importance of this item over the other item
7 Very Strong Ieportance of this item ever the other item
9 Absolute Ieportance of this item over the other item
a , 4 , 6 , 0 When compromise is needed between adjacent judgments
3
Reproduced with permission of the copyright owner. Further reproduction prohibited without permission.

109
ALPHA COMPANYUpka CNfaay >* • Ndiie-iiito ftolicly-toM carpautiia litk iti tan cfficc ii He liAmt. Tit
cmnt cntrillir toe tan till He fire fir tit Mttit raplaciay m itoiriAul At m i f N n toert aitictw w J *— .. .. l— . . Ttm 4kimf M tto iffin p alM in> b ri ato M ltiw fraa IN hM
m n p vc Nt litk itnfc criticise.I'vnmiit cAcrn ti invally aoeptto actmtUi priviplif tkit vc vliavy *< entacary fir iti
iMif. HwtTtr, ii litutiiH A m ekiiCH Miiti tkcir pilicy ii U nlict aKNattoy pKtios tilt ymrati Ike kiytost aft ivMC fi|v«. Hey vc tetanic U Ic nvatiay ii m iatostry tkit mjtys a steady kcaA fir it* prtoacti. Ike m natnllv if ylaant ta icfarc yMt tic iitcraal ato i Ur, tlat to (■pacts a Ivye kerne Av to toe !ml if taraiay* fir Avc to w p a M fir tie nrrnt year.
OMEGA COMPANYkqa CNfaay ic a iU ato nll-Ntablitoto ftolic cvfvatiM niratiay to tic ctatc if In Eaqlmd.
Carrnt naiynmt ic friairily g tfurt if fcsceadaits if tto viyiNl fiNtori if Ike carfcratiNf Ai ire Njirity ctocttoltorc u Nil. Ttoy ttjgy a fccntnlizto nfirmnt tkit ttoy Iclicw wkc ill liaci ttoy vc fiaily m i ki’t n t to mitor in nattor's activities.
Tie cntrillir, yrata-toayltor if tto eriyinl mer, liHta if tor yraAutc toyrn ic accintiay that CHblH tar to Mfliy ai MHrtaHt if accmtiay pnatoH. Awe yantiavd m tic eitraac flvtaatiiis in taniayc i«cr tic fact imral ycwii iaclafiay m e wt lassis, toe attritotoc tie cane to ’vcmtiny illasiia’ An to rayairto qplicatiia if yncrally sseptto KCMtiy friviflH. Ike cntrillir aetis that toe ic ycitc caftolc if uiiiy Ike lifficilt jtoyac«tc NCMiary to cvryiay Nt tie civic* vcmtiiy tasks, •N tkit tto fleetest:;!? ve a tnctiin if tto ricnl nlatility ic icflitiM ato ictorcst rates.
GAMMA COMPANYTic tan tNfiay ii a fairly in ftolic enpaay, citfc ita iffices licatto to tto lnttont. Imyimt
cisiiitc frimrily if tto ntriyrcmri to* stvtto tto tocims Nt if ttoir cillcyc toraitory tec yciri aye. kNNNHt toarn tie tor In if aitiay tocisina aai fcliyitiay rMfmilility. kiiiym it rniias Minted to tto csatinri prisptriiy :f ttoir fire.
to ciNicitiM if ttoir nnat fin-ycar fiacaeial itotiantc rciNli toat ttoir fcrfvcaKc lac nt tom taaaifini aiin iii iaaasiry. ito uairaiiir toi» ym iait niSSS ttoy • sss a s;577, ttoy stssMs't to enparto U tto i toes try atil ttoy tow ton ia tociNii fv wrii arc ynrs. fcensr, tto tan Emin* aill k m tr. to i m t ia rwarck m i fcnlapnit ic vtor to rmie itrcact if tedmlayicilA iikimi ia itc iaAstry. Tto cntrillir ntec tkat iicilv firm k m failto la tkcir i ton try to to ttoir iatoility to toift to tcctaaliyical ctacyes.
ZETA COMPANYTito CNfaay ic a nll-ntaklitato ito riffictto ptolic ccapacy. taaaymit ic prato if ttoir
effective tacntraliaN vyuizatiia tkat toe ton nto is a atoll fv sttor fine to feltae. Tenner is yaite In iNiy all emliycnt Imlc. Ia fact, it ic tto m plan torn mryiv is tto ana amid live te ntI. to a rmlt, itoei if tto Jcaatiiy ctaff ito ictcnal atoitiay toparicnt nroto fcyrces frn fnctiyiNC nimiitiis.
Zita Ciapaiy Npleyc CNunatin accmtiay priKipln. Ttoir tadyrtiay syctac ia ctotcif- tto-vt, ato nriucH an atorifsto is a fair ato raamtolc cmnt. Tkic fin toe nkikitto a cMiiftnt y w f Nniays treto far may yeve, ato ic ia m itokctry tkat ic vt ynatiy affected ly Kimic wlatility. tettanvi, ttoy vc Nil tone is an prtoact litovc ia ttoir itoutry.
i*
Reproduced with permission of the copyright owner. Further reproduction prohibited without permission.

110
PLEASE READ EACH OP THE POUR PIRN DESCRIPTIONS ON THE PACING PAGE CAREFULLY. ASSUME YOU ARE THE INTERNAL AUDITOR AND MUST MAKE AN EVALUATION OP THE POTENTIAL FOR FINANCIAL FRAUD BASED ONLY ON THE PACTS PRESENTED.IN EACH PAIRWISE COMPARISON. WHICH PIRN HAS THE GREATEST POTENTIAL FOR FINANCIAL FRAUD?
For uch pairwise comparison, plftit place a nuabar next to only ana of tha firms named. Please refer to the numerical scale belOM.
a. Alpha Company i Omega Company ___b. ____ Gamma Company < Alpha Company ___c. ____ Omega Company i Canaa Company ____d . ____ Zeta Company i Alpha Company____e . ____ Gamma Company i Zeta Company _____f . Zeta Company t Omega Company____
PLEASE INDICATE YOUR RESPONSES WITH THE FCLLGUING NUMERICAL SCALEt
Intensity of Importance Definition
1 Two firms have equal potential forfinancial fraud
3 This firm is slightly favored as havingthe greater potential for financial fraud
S This firm is strongly favored as havingthe greater potential for financial fraud
7 This firm is very strongly favored ashaving the greater potential for financial fraud
9 This firm is absolutely favored as havingthe greater potential for financial fraud
5.4.6.8 When compromise is needed betweenadjacent judgments
5
Reproduced with permission of the copyright owner. Further reproduction prohibited without permission.

i l l
6
Reproduced with permission of the copyright owner. Further reproduction prohibited without permission.

115
BACK8R0UND INFORMATION
Hom aany yurt of mporionco do you hovo as Intarnol ___ External ____
S. Hove you personally conducted or boon involvod in fraud audits?
Y o s _____ No ____
3. Ap rl ri
loss than 10 10 to 83 as to 90 ooro than SO
<*. In Mhat industry aro you coploycd? Banking Utility____ Manufacturing Bovornoont Othor (please describe)____________________
5. Which of tha following profossional certifications do you havo?(ploaso chock all that apply)
Cortifiod Internal Auditor (CIA) Cortifiod Public Accountant (CPA) Cortifiod Bank Auditor (CBA) Cortifiod Inforoation Systeas Auditor (CISA) Other (ploaso doscribo) ____________________
6. Ploaso indicate the degrees you havo earned and your Majori Bachelor’s Degree in ____________ year?_____ Master's Degree in ______________ year?_____ Ph.D. Degree in year? ____ Other (please describe) _____________________
______ State _PLEASE PLACE BOOKLET FACE DOWN ON YOUR DESK AND THE
RESEARCHER WILL PROVIDE YOU WITH PART II
Reproduced with permission of the copyright owner. Further reproduction prohibited without permission.

1 1 3
EVALUATION OF THE POTENTIAL FOR
FINANCIAL. FRAUD
PART II
Study DyBarbara Apostolou Doctoral Candidate
Louisiana State University
Reproduced with permission of the copyright owner. Further reproduction prohibited without permission.

114
INDUSTRY CHARACTERISTICS THAT MAY SUGGEST THE POTENTIAL FOR FINANCIAL FRAUDX
1 ■ Prof itabi 1 ity of entity relative to its industry is inadequate or inconsistent.
S. Direction of change in entity's industry is declining Mith many business failures.
3. Rate of change in entity's industry is rapid (productSi services> lines of businessi etc.).
PLEASE INDICATE YOUR RESPONSE WITH THE FOLLOWING NUMERICAL SCALE:
Intensity of Importance Definition
1 Equal Importance brtb iteme the objective
3 Weak Importance of this item over the other item
5 Strong Importance of this item over the other item
7 Very Strong Importance of this item over the other item
9 Absolute Importance of this item over the other item
3.A.6.8 When compromise is needed between adjacent judgments
1
Reproduced with permission of the copyright owner. Further reproduction prohibited without permission.

1 1 5
ASSUME YOU ARE EVALUATING THE POTENTIAL FOR FINANCIAL FRAUD BY EXAMINING INDUSTRY CHARACTERISTICS. IN EACH PAIRWISE COMPARISON, WHICH CHARACTERISTIC IS MORE LIKELY TO INDICATE FINANCIAL FRAUD?
For nch pairtoise coapariHfi, please plaea a nwber next to only on* of the characteristic! described. Please refer to the nuaerical scale on the facing page.
Prifitotility tf ittiiy rditiv* to ill Hracttoe if cktoft to ntity’s . itotstry to iutoyutt tr imsistoit i totetry to tocltoiq aito tuy
flilVH
•i'Ktigg tf tkisgs is tstity’s totetry Ibte tf rtityt it ntity’s iitetryk. to teliiinq aitfc tuy tasitMi failirts > it reto (yroteti, itrvicis, lies
tf taiitHii tie.)
Hits tf duiqt it ntity’s itoutry it fnfitoftility if ntity rtlitin toc. riyU (yritets, wrvictt, lilts if : its totetry is istoiewto ir
kisiiesi, itc.) tometotoBt
S
Reproduced with permission of the copyright owner. Further reproduction prohibited without permission.

1 1 6
MANAGEMENT CHARACTERISTICS THAT MAY SUGGEST THE POTENTIAL FOR FINANCIAL FRAUD:
1. HwwgMwnt operating and financial decision* are dominated by a single person.
8. Management’s attitude toward financial reporting is unduly aggressive.
3. Management turnover is high> particularly senior accounting personnel.
4. Management places undue emphasis on meeting earnings projections.
5. Management’s compensation is tied to reported earnings.
PLEASE INDICATE YOUR RESPONSE WITH THE FOLLOWING NUMERICAL SCALE:
Intensity of importance
1
3
5
7
9
Ef4|6«B
3
DefinitionEqu«l importance of both items to tns objectiveWeak Importance of this item over the other itemStrong Importance of this item over the other itemVery Strang Importance of this item over the othar itemAbsolute Importance of this item over the other itemWhen compromise is needed between adjacent judgments
Reproduced with permission of the copyright owner. Further reproduction prohibited without permission.

117
ASSUME YOU ARE EVALUATING THE POTENTIAL FOR FINANCIAL FRAUD BY EXAMINING MANAGEMENT CHARACTERISTICS. IN EACH PAIRUISE COMPARISON, WHICH CHARACTERISTIC IS MORE LIKELY TO INDICATE FINANCIAL FRAUD?
For nch pairxise coaparison, please place a nueber next to only one of the characteristics described. Please refer to the nuaerical scale on the facing page.
Inamt aparatiip id fiiuciil Inn ia t'i ngisitiw is tied to. fccitius in taiutd ky t siulc pvui t rsxtd m iq i
luSKtt': ittitdt tiwri fiiuciil Xuipuit plans edw aapkasis »r k . rapartiap is ufcly appraisers i Mtiu m i q i prijactius
Hiupcunt tiruvir is high, partinlarly laupauit’s attitaka tourf fiiuciil . sniir vcuatiip par so eel : npartiu is adily gpwin
Xuipaiaat piacu ndx uptuis •• . laatiaq sviius prijactius
at apsratiap id fiuicial i kacisius vc Mntd ky i siaplt
psm
IfuuuNt cupassafiu is iiuk ti . rapartck aaniaps
at teniae is high,: pvticslvly sniir vcmtiap pcriaael..
IlMUHut sparitiap oik fiiuciil Xiujiest's ittiM* tuark fiiuciil. kacisius vt iaiotd ky a siapla pm i npariiai is eriaiy appraiiiif
fluapufat tmascr is kipk, pvticilvly Wingpaeaf plvas uku upkuis an . suior accuatiap pcrsaeel : aeetiag aanUps praiactiias
kiupaasafs ittitika tmrk fiiuciil taapamt’s caywitin is tied to k. rtportiap is ukaly apprassive i rapartak aaniaps
Ruaacuit apcratiu id fiaucial haapunt tana nr is kipk,. Pacifism ire SaaiutH ky a siiplc perm : pvticilv ly sniir accsutiap ptruaul_
Maupaaeat's CMpauatiai is tick ta kuipi i t plvis ate upkuis u. reported aaniaps i aaatiip hemps pnjcctius
Reproduced with permission of the copyright owner. Further reproduction prohibited without permission.

118
FIRM CHARACTERISTICS THAT MAY SUGGEST THE POTENTIAL FOR FINANCIAL FRAUD:I. Fr«qumt and significant transactions Involving unusually
difficult or complex calculations.
S. The existence of financial statement alaaants that dapand haavily on tha axarcisa of subjective judgment.
3. Organization is decentralized without adequate aonitoring.
A. Material ralatad-party transactions.
5. Sansitivity of operating results to econoaic factors (inflation, interest rates) is high.
6. Solvency problaas or other aattars that bring into question tha entity’s ability to continue in existence are present.
PLEASE INDICATE YlJUR RESPONSES WITH THE FOLLOWING NUMERICAL SCALE:
Intensity of Importance1
3
5
7
9
8.A.6.8
5
DefinitionEqual Iaportance of both items to tha objectiveWeak Iaportance of this item over tha other itaaStrong Iaportance of this item over tha other itaaVary Strong Iaportance of this item over the other itaaAbsolute Importance of this item over tha other itaaWhan coaproaise is needed between adjacent judgaents
Reproduced with permission of the copyright owner. Further reproduction prohibited without permission.

119
ASSUME Y u li ARE EVALUATING THE POTENTIAL FOR F IN A N C IA L FRAUD BY EXAMINING FIR M CHARACTERISTICS. IN EACH PAIRW ISE COMPARISON, WHICH CHARACTERISTIC IS MORE L IK E L Y TO IN D IC A TE FFN flN T IA L FRAUD?
F o r n c h p i i r i t i M c o m p a r is o n , p lo a s o p la c o a n u a b a r n a x t to o n ly o n * o f th a c h a r a c t e r i s t i c s d e s c r ib e d . P la a s a r a f a r t o th e n u m e r ic a l s e a l * o n t h a f a c in g p a g e .
Frtqstal «W ii) i i f ic M t trn u c litM iatalviaq saasaally Sifficalt i r caaqlti calcalatiass
kalvtacy prahlass ir itk ir sitters that krisy i i i * ptstiea Uc aatity’si t i l l t y to cosiixc is o : i : i» i i a t prastat
Tht u i i t n u i f fisaacial statasmt alaacatsk . tkat haytad htarily in tht tiarcite t f >
MiiKtin js saotSaasitivity t f operatic rm its to tCMtaic f t t t t r i l i i f i i t iM , iatartst ratts) is kith
Orqiaiaciiaa is Cicratrslizrd aitkast adtipatt maiteriaq : la t ir ia l rtlatad-yarty traasactiaas
d. lU ttr iil rtlattd-yarty traasactiaasTht u is ttact t f fisaacial atataatnt tlMMts tkat dtycid kta,ily in tht m rc iie af n t jK t ia j r ip n t
Stasitirity i f aytratiaq rasalts t t I t KtaMic faetars (ioflanan. ia itrts i ratts) is kifh
Fraqatat aad sitsificast traasactiaas isralvisq smuttily d i f f in l t or c m lt i calcilatins
Selyaaqr prakltts t r ttb tr satttrs thatf . ___ hriag iata tatstiaa tht ts tity 's akility ta
caatiaat is t i i i ta ic t art prastat
tryasizatiai i t AciatraliziS sitkaat a kyu t, aaaitariaq
Tht n is tn n t f fisaacial atataaaat t lt i that ktytar! atariIy aa tht a itrc itt afSAjKtiva jsdt»t
i ts Ayaaizatiaa is dactatraliztd i sithast aktfuta aaaitariat
h. Qrqaaiaatiaa is dactstralirid aithaat l iip u l t aaaitariaq
S m itiv ity af aytratiaq rasalts to tttaatic faetars lisflatias, is ttrts t ratts) is biyh
Rattrial rtlaM-aarty traasactiaasFraqatat ad sitsificast traasactiaas
: istslviaq m ssaliy d iffica lt ar caaplti calcslatiass
Reproduced with permission of the copyright owner. Further reproduction prohibited without permission.

ISO
PLEASE INDICATE YOUR RESPONSES WITH THE FOLLOWING NUMERICAL SCALES
Intan*ity of Importance Definition
1 Equal Iaportance or both itams tothe objective
3 Weak Importance of inis item overthe other item
5 Strong Iaportance of this item overthe other item
7 Very Strong Iaportance of this itemover the other itea
9 Absolute Iaportance of this item overthe other itea
3i4)6iB When coaproaise is needed betweenadjacent judgments
7
Reproduced with permission of the copyright owner. Further reproduction prohibited without permission.

121
FIRM CHARACTERISTICS. CONTINUED. . .
ASSUME YOU ARE EVALUATING THE POTENTIAL FOR F IN A N C IA L FRAUD BY EXAMINING FIRM CHARACTERISTICS. IN EACH PAIRW ISE COMPARISON, WHICH CHARACTERISTIC IS MOST L IK E L Y TO IN D IC A TE F IN A N C IA L FRAUD?
F o r e a c h p a i r w is e c o m p a r is o n , p l o m p la c e a n u a b e r n e x t t o o n ly o n * o f th e c h a r a c t e r i s t i c s d e s c r ib e d . P le a s e r e f e r t o th e n u a e r i c a l s c a le o n t h e f a c in g p a g e .
SmitiYity if aytcatiaq riulti It Kinetic factor* (iiflatiaa, iattrtft rata* it hiqh
Ratarial rtlaM-party trMUctitM
lolvtacy prthlaas »r ttktr aatttr* tktt briny iita satin tht entity’* ability W cantiaw it niitnci art yrmnt
Tkt tnisltnct t f financial itatMMt t l n a l i tkat fcytnd httvily t t tht ■nreiic t f M k jtc iitt jtkyatnt
Frtytmt u i liyaificoat tranuctiam intla iny a n a l ly d ifficu lt t r catyln c ilc tlttitns
( ry u iia t it i i* ktctntralink lithant ahtyaatt nanitarinq
Tht t i i i l t t c t i f financial itataant t ltw its tkat k p d k tr tily in tkt t i t r c i i t af M k jtc tin jahyatnt
Frqatnt ad aiynificaat traauctiins iaml«iay annilly difficalt tr CMplti calcalatiMS
r:!:is!-aa■.arty traasactiaasStltncy yrthlaat t r t tk tr natttri that hriay ista fe t t i ia th t n t i ty ’* d i l i t y ta cantiaw i t t i i i t t ic e art ( r a n t
Stlvtacy yroblns i r atktr a ittirs tkat briny into yttstiaa tk t n t ity ’ * ability ta caatiaat i t n iit tn c t art nr m at
S ns iti.ity af aftratiny r tw lt* to Kataaic factar* (iifla tiaa , ia ttrn t ra ttt) i* high
Reproduced with permission of the copyright owner. Further reproduction prohibited without permission.

125
9
Reproduced with permission of the copyright owner. Further reproduction prohibited without permission.

IS .
ASSUME YOU ARE EVALUATING THE POTENTIAL FOR FINANCIAL FRAUD. WHICH CATEGORY OF CHARACTERISTICS DO YOU VIEW AS HOST IMPORTANT IN VCUR EVALUATION?
For tich pairwise coaparison! please place a nuaber next toonly one of the items described scale below.
Flraa . Chan
Industryb. Characteristics
Hanageaentc . Character i
Please rufer to the numerical
Industry » Characteristics ____
Hanageaentt Characteristics
Firai Characteristics
PLEASE INDICATE YOUR RESPONSES WITH THE FOLLOWING NUMERICAL SCALE:
Intensity of Iaportance Definition
1 Equal Iaportance of both items tothe objective
3 Weak Iaportance of this item overthe other itea
5 Strong Iaportance of this item overthe other itea
7 Very Strong Iaportance of this itemover the other itea
9 Absolute Iaportance of this item overthe other itea
2(4iiiB When coaproaise is naeded betweenadjacent judgaents
THANK YOU VERY MUCH FOR YOUR ASSISTANCE IN THIS STUDY
10
Reproduced with permission of the copyright owner. Further reproduction prohibited without permission.

VITA
BARBARA APOSTOLOUDepartment of Accounting
College of Business Administration Louisiana State University
Baton Rouge« Louisiana 7C303(504) 388 - 6202
EDUCATION AND CERTIFICATIONPhD in Accounting with Minor in Economics* Louisiana State
University* Baton Rouge* Louisiana— August 1988.MBA from Plymouth State College (of the University System
of New Hampshire)* Plymouth* New Hampshire— May 1984.BS in Accounting from Plymouth State College* Plymouth*
New Hampshire— May 1979.Certified Public Accountant (New Hampshire).
TEACHING EXPERIENCEAssistant Professor* Louisiana State University* Baton
Rouge* Louisiana* August 1998 to present.Teaching Assistant* Louisiana State University* Baton
Rouge* Louisiana— August 1985 to August 1988.Assistant Professor* Plymouth State College* Plymouth*
New Hampshire— August 1983 to June 1985.Teaching Assistant* Plymouth State College* Plymouth*
New Hampshire— August 1982 to May 1983.
PROFESSIONAL ACCOUNTING EXPERIENCESenior Accountant (audit and tax) with Ernst & Uhinney*
Manchester* New Hampshire— August 1901 to August 1982.
Senior Accountant (audit) with Peat Marwick Main*Providence* Rhode Island— August 1979 to August 1981
12^
Reproduced with permission of the copyright owner. Further reproduction prohibited without permission.
1 2 5
AWARDSInstitute of Internal Auditors Research Foundation doctoral
dissertation grant* 1988.U. S. Department of Education Graduate Fellowship * 1986-1 OOQ
a • ww •
Lloyd F. Morrison award For excellence in teaching* Louisiana State University* 19B6/87.
MEMBERSHIPS American Accounting Association (AAA).American Institute of Certified Public Accountants (AICPA). Institute of Internal Auditors (IIA).
PUBLICATIONS"Repurchase Agreements»" Handbook of Governmental
Accounting and Finance, edited by N. Apostolou and D. L. Crumbley* John Wiley & Sons* Inc.* 1988 (co- authored ).
"Expert Systems in Auditing: An Emerging Technology*"Internal Auditing. Fall 1987 (co-authored).
"Auditing Financial Futures*" The CPA Journal. November 1987 (co-authored).
"New Reporting Requirements for Banks*" The Journal of Bank Accounting and Auditing* September 1987 (co- authored >.
"A New Audit Guide for Oil and Gas Producers*" The Oil &Gas Tax Quarterly* June 1987.Reprinted in Oil & Gas Law and Taxation Review* 1987/88 (Volume 6 Issue 3).
"Interest Rate Swaps: An Emerging Issue*" Accounting Horizons. June 1987 (co-authored).
Reproduced with permission of the copyright owner. Further reproduction prohibited without permission.

DOCTORAL EXAMINATION AND DISSERTATION REPORT
Candidate: Barbara Ann. Apostolou
Major Field: Accounting
Title of Dissertation: An In v e s tig a t io n o f In te rn a l A u d ito r Judgment on the Importance o f In d ic a to rs o f P o te n tia l F in a n c ia l Fraud: An A n a ly t ic H ierarchyProcess Approach.
Approve i:
' /Major Professor and Chairman
Dean of the Graduate Spijooi )
EXAMINING COMMITTEE:
M 7W, M A U L
Date of Examination:
Ju ly 13 f 1988
Reproduced with permission of the copyright owner. Further reproduction prohibited without permission.