Embed Size (px)
Citation preview
An Investigation of the Interaction of DNA With Selected Peptides and Proteins
by
Basab Roy
A Dissertation Presented in Partial Fulfillment
of the Requirements for the Degree
Doctor of Philosophy
Approved November 2014 by the
Graduate Supervisory Committee:
Sidney Hecht, Chair
Anne Jones
Marcia Levitus
John Chaput
ARIZONA STATE UNIVERSITY
December 2014
i
ABSTRACT
The communication of genetic material with biomolecules has been a major
interest in cancer biology research for decades. Among its different levels of
involvement, DNA is known to be a target of several antitumor agents. Additionally,
tissue specific interaction between macromolecules such as proteins and structurally
important regions of DNA has been reported to define the onset of certain types of
cancers.
Illustrated in Chapter 1 is the general history of research on the interaction of
DNA and anticancer drugs, most importantly different congener of bleomycin (BLM).
Additionally, several synthetic analogues of bleomycin, including the structural
components and functionalities, are discussed.
Chapter 2 describes a new approach to study the double-strand DNA lesion
caused by antitumor drug bleomycin. The hairpin DNA library used in this study displays
numerous cleavage sites demonstrating the versatility of bleomycin interaction with
DNA. Interestingly, some of those cleavage sites suggest a novel mechanism of
bleomycin interaction, which has not been reported before.
Cytidine methylation has generally been found to decrease site-specific cleavage
of DNA by BLM, possibly due to structural change and subsequent reduced bleomycin-
mediated recognition of DNA. As illustrated in Chapter 3, three hairpin DNAs known to
be strongly bound by bleomycin, and their methylated counterparts, were used to study
the dynamics of bleomycin-induced degradation of DNAs in cancer cells. Interestingly,
cytidine methylation on one of the DNAs has also shown a major shift in the intensity of
ii
bleomycin induced double-strand DNA cleavage pattern, which is known to be a more
potent form of bleomycin induced cleavages.
DNA secondary structures are known to play important roles in gene regulation.
Chapter 4 demonstrates a structural change of the BCL2 promoter element as a result of
its dynamic interaction with the individual domains of hnRNP LL, which is essential to
facilitate the transcription of BCL2. Furthermore, an in vitro protein synthesis technique
has been employed to study the dynamic interaction between protein domains and the i-
motif DNA within the promoter element. Several constructs were made involving
replacement of a single amino acid with a fluorescent analogue, and these were used to
study FRET between domain 1 and the i-motif, the later of which harbored a fluorescent
acceptor nucleotide analogue.
iii
ACKNOWLEDGMENTS
First, I would like to extend my sincere gratitude to my research advisor, Dr.
Sidney Hecht, for his outstanding guidance throughout the past five years, which helped
me to grow as a researcher and enabled me to think and solve problems independently.
Additionally, I want to thank him for providing a wonderful environment for learning, in
a group of friendly and highly skilled individuals and offering me the opportunity to
explore different aspects of biochemical research. My gratitude is also extended to my
committee members, Dr. Anne Jones, Dr. Marcia Levitus and Dr. John Chaput for their
extensive support and advice regarding research and life outside the laboratory.
I would like to thank Dr. Melissa del Rosario for her exceptional mentoring,
which enabled me to learn valuable laboratory skills and furthermore, a methodical way
of approaching problems. Additionally I want to thank Dr. Larisa Dedkova and Dr. Omar
Khdour for their constant help and advice, which helped me to gain insight into some
critical aspects of my research. I am also thankful of all of the current and former
members of Hecht laboratory, especially Dr. Shengxi Chen, Dr. Manikandadas
Mathilakathu Madathil and Dr. Rakesh Paul for their friendship, and helping me gain a
thorough understanding of my research.
I want to thank Dr. Rumit Maini for his occasional friendly counseling throughout
my PhD career, Dr. Pablo Arce for his companionship and Dr. Jose Israel Armendariz
Guajardo for introducing me to some of the great outdoor activities, such as sport
climbing. My experiences in the Hecht group would not have been as exciting without
their involvement, which exceeded the strict boundary of coworkers to an enjoyable
environment of friendship.

iv
I would like to extend my gratitude to Dr. Trevor Bozeman, who always
stimulated thoughtful discussions involving interesting topics, which enabled me to
question established ideas in the field of scientific research and beyond. A rebel at heart,
Dr. Bozeman always offered non-conventional ways of thinking, contributing to my
growth as a researcher. I am also thankful to my former roommates, Dr. Souvik Roy and
Dr. Manas Chakraborty for our shared feeling of camaraderie and their support in my
daily life.
Finally, I want to thank my parents, family and close friends for their
unconditional support, above and beyond my research career. The final years of my
graduation would not have been as interesting without the involvement of Angela
Edwards and Dr. Petro Yakovchuk. Experts in their respective fields, and nature lovers in
heart, they always presented progressive ideas to my evolution as an individual. I am
grateful to Dr. Ryan Nangreave for being a big brother whenever needed, offering help,
sharing his experiences and motivating me to think independently. I cannot thank him
and his family, including Dr. Jeanette Nangreave and Emma Nangreave, enough for their
support at every step and especially their cordial encouragement in my art projects. I am
equally indebted to my sisters Caridad Rodrigues and Agneyee Roy for their unrestricted
affection, care and sincere support in all aspects of my life. Lastly, I would like to thank
Dr. Yana Chen. A silent educator by nature, she helped me and continues to do so, to
grow as a better person everyday.

v
TABLE OF CONTENTS
Page
LIST OF TABLES ........................................................................................................... IX
LIST OF FIGURES ...........................................................................................................X
LIST OF SCHEMES ................................................................................................... XVII
LIST OF ABBREVIATIONS .....................................................................................XVIII
CHAPTER
1. GENERAL INTRODUCTION…………………………………………..........1-14
1.1. Molecular Therapeutics of Cancer Research.……………………….........1
1.2. Bleomycin and DNA……………………………………………………..3
1.3. Strustural Domains of Bleomycin……………………………………..…5
1.4. Pathway of DNA Cleavage by Bleomycin……………………………...11
2. MECHANISM OF BLEOMYCIN INDUCED DOUBLE STRAND DNA
CLEAVAGE ……….…………………………………………………...……15-48
2.1. Introduction ……………………………………………………………..15
2.2. Results …………………………………………………………………..17
2.3. Discussion ……………………………………………………………....37
2.4. Experimental …………………………………………………………....45
2.4.1. Materials ………………………………………………………… 45
2.4.2. End Labeling and Purification of Hairpin DNAs ………………...45
2.4.3. Double-Strand DNA Cleavage of Hairpin DNAs ……………..…46
2.4.4. n-Butylamine Treatment of Hairpin DNA 8 …………………..…46
vi
CHAPTER Page
2.4.5. Maxam-Gilbert Sequencing Reaction ……………………………47
2.4.6. Denaturing Gel Electrophoresis of DNA Cleavage Products ……47
3. EFFECT OF ABERRANT CYTIDINE METHYLATION ON BLEOMYCIN
INTERACTION WITH DNA ………………………………………………49-81
3.1. Introduction …………………………………………………………….49
3.2. Results ……………………………..……………………………….…..51
3.2.1. Competition Assay and the Tight Binders of Fe•BLM……...…51
3.2.2. DNA Methylation Results in Reduced Cleavage by
Fe•BLM…………………………………………………………59
3.2.3. Characterization of Double-Strand Cleavage of Methylated
DNAs……………………………………………………………64
3.2.4. Structural Basis for Diminished Binding and Cleavage of DNAs
Containing Methylated Cytidines……………………………….69
3.3. Discussion …………………………..…………………………….…....73
3.4. Experimental ………………………………..……………………….…78
3.4.1. Materials ………………………………………………………….78
3.4.2. End-Labeling and Purification of Hairpin DNAs and Their
Methylated Counterparts...……………..…………………………78
3.4.3. Double-Strand DNA Cleavages of Hairpin DNA 10, 10-Me, 10-
2Me and 10-3Me by Bleomycin A5…...…….……………………79
3.4.4. Maxam Gilbert Sequencing Reaction…………………………....80
vii
CHAPTER Page
3.4.5. Sequence Selective Cleavage of Radiolabeled Hairpin DNAs by
BLM A5.………………………………………..…………………80
3.4.6. Fluorescent Competition Analysis of Hairpin DNAs …………....81
4. EVALUATION OF THE INTERACTION BETWEEN BCL2 PROMOTER
ELEMENT AND INDIVIDUAL DOMAINS OF hnRNP LL, LEADING TO A
STRUCTURAL CHANGE IN DNA ………………………………………82-115
4.1. Introduction ………………………………………………………….….82
4.2. Results …………………………………………………………………..84
4.2.1. RRM Constructs…………………………………………………..84
4.2.2. Study of the Binding Interaction Between Domains and i-
Motif………………………………………………………………85
4.2.3. Structural Change of i-Motif Following the Binding With
RRMs……………………………………………………………..88
4.2.4. Sequence Based Binding Between i-motif and RRMs…………...93
4.2.5. FRET between i-Motif and RRM1……………………………….96
4.3. Discussion ……………………………………………………………..101
4.4. Experimental ………………………………………..…………………106
4.4.1. End-labeling of Oligonucleotides ………………………………106
4.4.2. Maxam-Gilbert Sequencing Reaction………………………...…107
4.4.3. Electrophoretic Mobility Shift Assay………………………...…107
4.4.4. Bromine Foot-Printing Assay……...………………………...….108
viii
CHAPTER Page
4.4.5. Circular Dichroism………………………………………………108
4.4.6. Mutagenesis and Subcloning……………………………………109
4.4.7. Competent Cell Preparation…………………………………..…110
4.4.8. NVOC protected aminoacyl Dinucleotide Preparation..………...110
4.4.9. Transcription of 74-Nucleotide tRNA and Purification…………110
4.4.10. Digestion of pYRNA8 Plasmid With FokI……………………...111
4.4.11. Purification of tRNA by DEAE Sephadex Chromatography..…..111
4.4.12. Ligation of tRNA-COH With Aminoacyl-pdCpA and NVOC
Deprotection………………………………………………...…...112
4.4.13. S-30 Preparation…………………………………………………112
4.4.14. In vitro Protein Synthesis and Amber Suppression…………..…113
4.4.15. FRET Experiment…………………………………………….…114
4.4.16. Graphical Modeling and Simulation of DNA Protein
Interaction………………………...……………………………..114
REFERENCES ………………………………………………………………….….… 116
APPENDIX
A. DNA AND PROTEIN SEQUENCES OF THE RRM CONSTRUCTS.………124
B. LIST OF MUTAGENESIS PRIMERS FOR RRM1…………………...………130
ix
LIST OF TABLES
Table Page
2.1. Sequence of 10 Hairpin DNAs.………………….…...…………………..........17
2.2. Coupled Double-Strand BLM Cleavage Sites in Hairpin DNAs 1 – 10……….41
2.3. Non-Coupled Double-Strand BLM Cleavage Sites in Hairpin DNAs 1 –
10……………………………………………………………………………….43
3.1. Inhibition of Fluorescent Emission by Hairpin DNAs………....……………...55
3.2. Inhibition of Fluorescent Emission by Hairpin DNAs………………………………59
3.3. Percentage of DNA Cleavage of Hairpin DNAs……………………...…………………68
4.1. Percentage Binding of i-motif by RRM1 and RRM2…………...……………..87
4.2. Percentage Binding of i-motif by RRM3-4…………………………...…….....88
4.3. Percentage Binding of i-motif by Domains With Varying Random DNA...…..90
x
LIST OF FIGURES
Figure Page
1.1. Groove Binding of Hoescht 33258 to the Minor Groove of DNA (A, NDB
Structure 8bna)2 and the Intercalation of Ellipticine into DNA (B, NDB
Structure 1z3f).………………….……………....................................................2
1.2. Structures of Typical Intercalators, Atypical Intercalators, and Groove
Binders………………………………………………………...…………....…...3
1.3. Different Congeners of Bleomycin……….……………………...………….…..4
1.4. Structural Compositions of Antitumor Antibiotics Bleomycin A2, B2,
Tallysomycin S10B, Phleomycin D1 and Zorbamycin…………...……………...5
1.5. Schematic of HOO-Co(III)•Bleomycin B2 Highlighting the Metal Binding
Domain, Linker Region, Disaccharide Moiety and C-Terminal Substituent…....6
1.6. Carbohydrate Moiety of Bleomycin………………………………...……….….7
1.7. Metal Chelating Domain of Fe(II)•BLM....……………..……………………....8
1.8. Interactions of the Metal Binding Domain and Disaccharide Moiety With
DNA……………………………………………………………………………..9
1.9. Proposed Model for the Insertion of the Bithiazole Moiety of Bleomycin into
the DNA Kink.....................................................................................................10
1.10. Deglycobleomycin Containing Monothiazole Analogues………..……...……11
1.11. Deglycobleomycin With a Trithiazole Moiety……………...………..………..11
1.12. Pathways of DNA Cleavage by Bleomycin.…………………...………..……..12
1.13. Possible Activated Fe•Bleomycin Formation Pathways…………..….………..13
xi
Figure Page
1.14. Proposed Catalytic Cycle of DNA Degradation by BLM……………….…….14
2.1. Double-Strand DNA Cleavage Patterns Exhibited by BLM………….……….15
2.2. NMR Modeling of DNA-Bleomycin Interaction Revealing the Potential Site of
a Double-Strand Break…………………………...…………………………….16
2.3. Sites of BLM-Mediated Damage for the Ten Hairpin DNAs Studied…………18
2.4. Double-Strand Cleavage of [5-32P]-End Labeled (lanes 1 – 3) and [3-32P]-End
Labeled (lanes 4 – 6) 64-Nucleotide Hairpin DNA 8 by Fe(II)•BLM A5....…..20
2.5. Sequencing Gel Analysis of Fe(II)•BLM A5-Induced Double-Strand Cleavage
Sites of [3-32P]-End Labeled (lanes 1-6) and [5-32P]-End Labeled (lanes 7-12)
DNA 8………………………………...……………………………..…………22
2.6. Summary of Fe•Bleomycin Induced Double-Strand Cleavage Sites on Hairpin
DNAs 1 - 10………………………………………………………..………….23
2.7. Double-Strand Cleavage of [3-32P]-End Labeled (lane 2) and [5-32P]-End
Labeled (lane 3) 64-Nucleotide Hairpin DNA 2 by Fe•BLM A5.……..………24
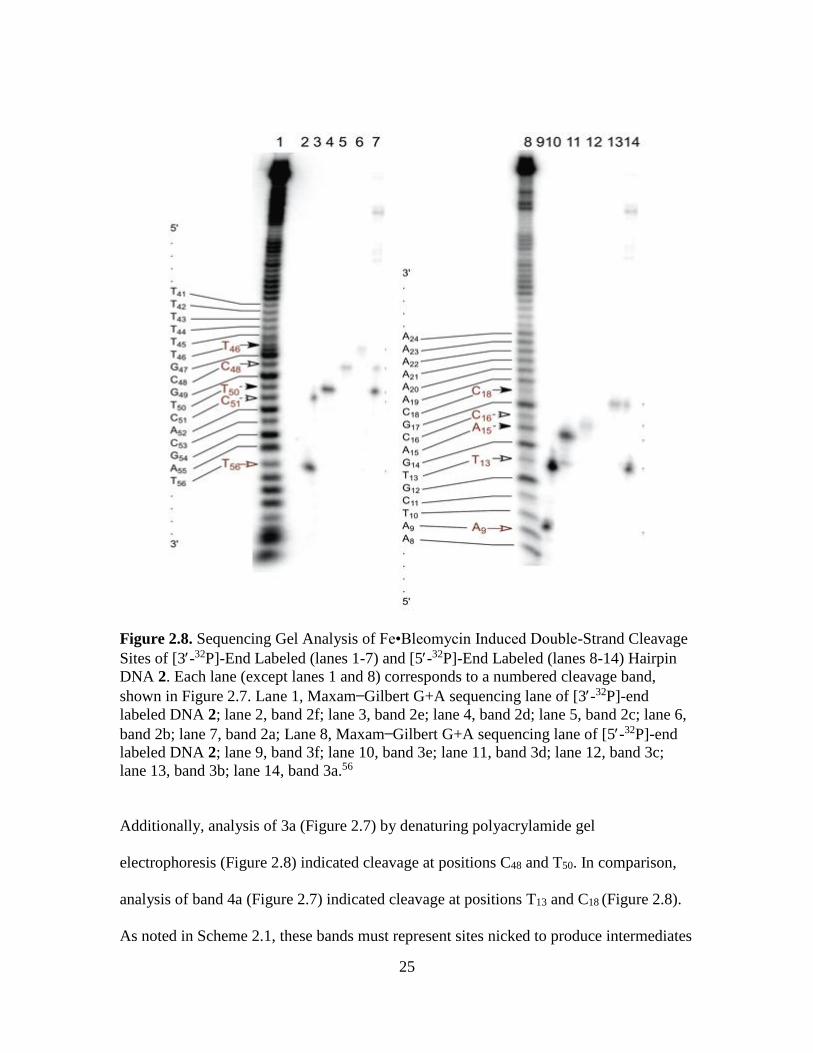
2.8. Sequencing Gel Analysis of Fe•Bleomycin Induced Double-Strand Cleavage
Sites of [3-32P]-End Labeled (lanes 1-7) and [5-32P]-End Labeled (lanes 8-14)
Hairpin DNA 2……………………………...……………………..…………...25
2.9. Analysis of Fe•Bleomycin Induced Double-Strand Cleavage Sites on Hairpin
DNA 1…………………………………………………..……………………...27
2.10. Analysis of Fe•Bleomycin Induced Double-Strand Cleavage Sites on Hairpin
DNA 3………………..………………………………………………………...28
xii
Figure Page
2.11. Analysis of Fe•Bleomycin Induced Double-Strand Cleavage Sites on Hairpin
DNA 4………………………………..………………………………………...29
2.12. Analysis of Fe•Bleomycin Induced Double-Strand Cleavage Sites on Hairpin
DNA 5………………………………………………………..………………...31
2.13. Analysis of Fe•Bleomycin Induced Double-Strand Cleavage Sites on Hairpin
DNA 6……………………………………………..…………………………...32
2.14. Analysis of Fe•Bleomycin Induced Double-Strand Cleavage Sites on Hairpin
DNA 7…………………………………………………..……………………...33
2.15. Analysis of Fe•Bleomycin Induced Double-Strand Cleavage Sites on Hairpin
DNA 9……………………………………..…………………………………...35
2.16. Analysis of Fe•Bleomycin Induced Double-Strand Cleavage Sites on Hairpin
DNA 10………………………………………………..……………………….36
2.17. Bleomycin Induced Double-Strand DNA Lesion Progresses Through Either (A)
A Coupled Cleavage Event or (B) A Non-Coupled Cleavage Event……….…40
3.1. 64-Nucleotide DNAs, Their Methylated Counterparts and the 16-Nucleotide
DNA-Cf15………………………………………...…………………….………50
3.2. Chemical Structure of Bleomycin A5……………………....…………...……..51
3.3. Fluorescence Emission Spectra Resulting from Treatment of 16-nt Hairpin
DNA-Cf15 With Fe(II)•BLM in the Presence or Absence of 64-nt Hairpin DNA
7…………………...........................................................................................…52

xiii
Figure Page
3.4. Competition Effects of Unlabeled Denatured Calf Thymus DNA on Fe(II)•BLM
A5 Mediated Cleavage of [5-32P]-End Labeled Hairpin DNAs 7 and 16-nt
Hairpin DNA………………………………………………………………...…53
3.5. Comparison of the Effects of Unlabeled Calf Thymus DNA on the Cleavage of
[5-32P]-End Labeled Hairpin DNA 7 and 16-Nucleotide DNA by Fe(II)•BLM
A5……………………………………………………………………….……...54
3.6. Fluorescence Emission Spectra of 2-Deoxyriboside of 4-
aminobenzo[g]quinazoline-2-one, Resulting from the Treatment of 16-nt
Hairpin DNA Cf15 With Fe(II)•BLM in the Presence or Absence of 64-nt
Hairpin DNAs………………...…………………………...…………………...56
3.7. Emission Spectra Following Admixture of 1 µM Fe(II)•BLM and 1 µM 16-nt
Hairpin DNA With or Without 1 µM DNA 10 or DNA 10-Me………..…...…57
3.8. Fluorescence Emission Spectra of the Profluorescent 16-nt Hairpin DNA Cf15
With Fe(II)•BLM in the Presence or Absence of One Equivalent of a 64-nt
Hairpin DNA…...................................................................................................58
3.9. Bleomycin Cleavage of 5-Labeled DNA 7, DNA 7-4Me, DNA 10 and DNA
10-Me……………………………………………………...…………………...60
3.10. Summary of the Cleavage Intensity at the Nucleotides in the Variable Region of
DNA 7 and DNA 7-Me………………………………………………………...62
3.11. Analysis of Fe•Bleomycin Induced Double-Strand Cleavage Sites on Hairpin
DNA 11………………………………………..……….………………………63
xiv
Figure Page
3.12. Bleomycin Cleavage of 5-Labeled DNA 11 and DNA 11-5Me. (A) Sequence
Selective Cleavage of DNA 11 by BLM A5………………...…………………64
3.13. Summary of Fe•Bleomycin-Induced Double-Strand Cleavage Sites on DNAs 7,
10, and 11……………….......………………………………………………….65
3.14. Patterns of the Double-Strand Cleavage of DNA 10 and DNA 10-Me..……....66
3.15. DNA 10 Constructs With Substitutions at C13 Alone Forming DNA 10-Me; C13
and C53 Forming DNA 10-2Me; C13, C11 and C53 Forming DNA 10-3Me,
Respectively…………………………………………………………...…...…..67
3.16. Fluorescence Emission Spectra of the Profluorescent 16-nt Hairpin DNA Cf15
With Fe(II)•BLM in the Presence or Absence of One Equivalent of a 64-nt
Hairpin DNA……………………...……………………………………………68
3.17. Patterns of the Double-Strand Cleavage of DNA 10-2Me and DNA 10-
3Me………………………………………………………………………..…...69
3.18. Fluorescence Emission Spectra of the Profluorescent 16-nt Hairpin DNA Cf15
With Fe(II)•BLM in the Presence or Absence of One Equivalent of a 64-nt
Hairpin DNA……………………………………………………...…………....70
3.19. Sequence Selective Cleavage of DNA 9 and DNA 9-dU by BLM
A5…………………………………………………………………….………...71
3.20. Time Dependent, Sequence Selective Cleavage of DNA 9 (A) and DNA 9-dU
(B) by 5 µM BLM A5 at 0 oC………………………..…………………………72
3.21. Overall Change of the Cytidine Methylation Pattern in Cancer………….……77
4.1. Sequence of hnRNP LL With Four Interactive Domains……….………...…...83
xv
Figure Page
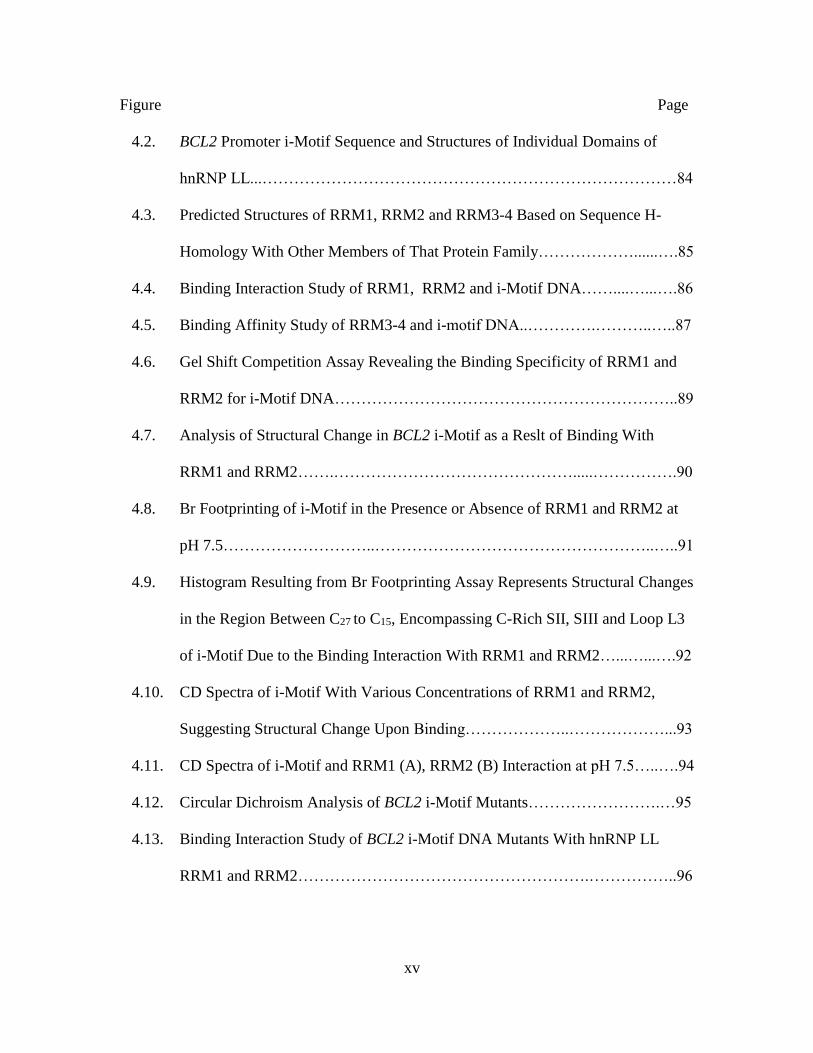
4.2. BCL2 Promoter i-Motif Sequence and Structures of Individual Domains of
hnRNP LL...……………………………………………………………………84
4.3. Predicted Structures of RRM1, RRM2 and RRM3-4 Based on Sequence H-
Homology With Other Members of That Protein Family………………......….85
4.4. Binding Interaction Study of RRM1, RRM2 and i-Motif DNA……....…...….86
4.5. Binding Affinity Study of RRM3-4 and i-motif DNA..………….………..…..87
4.6. Gel Shift Competition Assay Revealing the Binding Specificity of RRM1 and
RRM2 for i-Motif DNA………………………………………………………..89
4.7. Analysis of Structural Change in BCL2 i-Motif as a Reslt of Binding With
RRM1 and RRM2…….……………………………………….....…………….90
4.8. Br Footprinting of i-Motif in the Presence or Absence of RRM1 and RRM2 at
pH 7.5………………………..……………………………………………..…..91
4.9. Histogram Resulting from Br Footprinting Assay Represents Structural Changes
in the Region Between C27 to C15, Encompassing C-Rich SII, SIII and Loop L3
of i-Motif Due to the Binding Interaction With RRM1 and RRM2…...…...….92
4.10. CD Spectra of i-Motif With Various Concentrations of RRM1 and RRM2,
Suggesting Structural Change Upon Binding………………..………………...93
4.11. CD Spectra of i-Motif and RRM1 (A), RRM2 (B) Interaction at pH 7.5…..….94
4.12. Circular Dichroism Analysis of BCL2 i-Motif Mutants…………………….…95
4.13. Binding Interaction Study of BCL2 i-Motif DNA Mutants With hnRNP LL
RRM1 and RRM2……………………………………………….……………..96
xvi
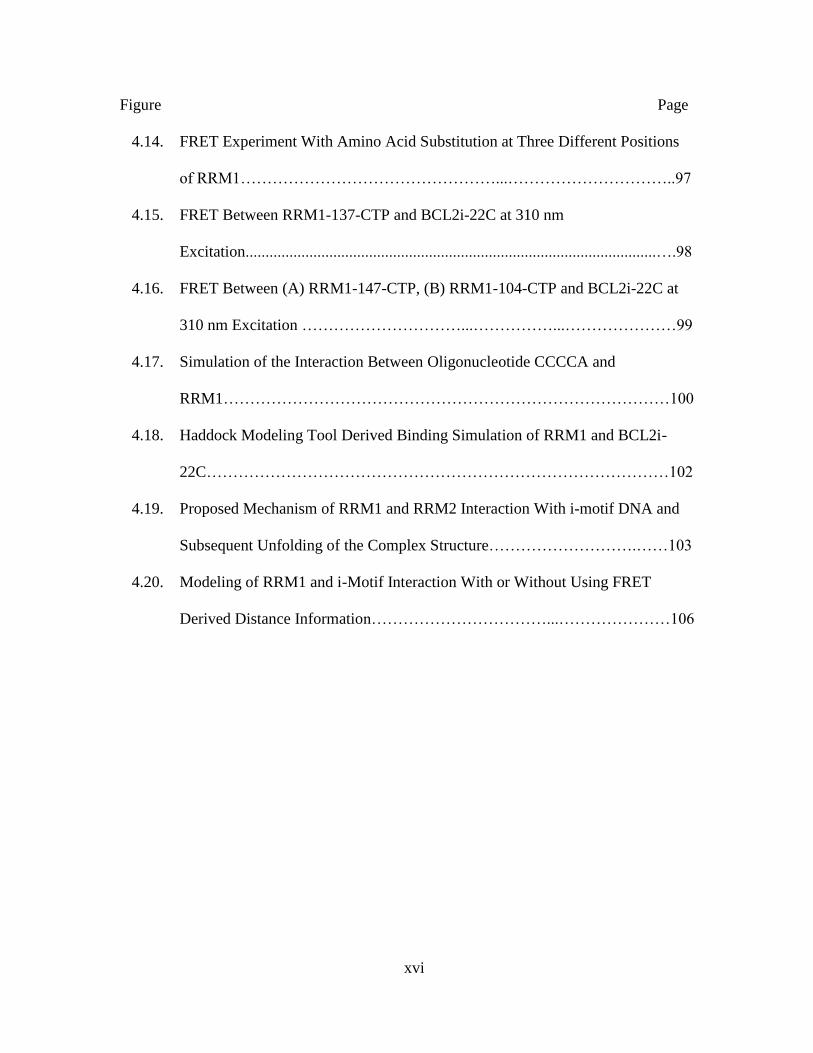
Figure Page
4.14. FRET Experiment With Amino Acid Substitution at Three Different Positions
of RRM1…………………………………………...…………………………..97
4.15. FRET Between RRM1-137-CTP and BCL2i-22C at 310 nm
Excitation.......................................................................................................….98
4.16. FRET Between (A) RRM1-147-CTP, (B) RRM1-104-CTP and BCL2i-22C at
310 nm Excitation …………………………...……………...…………………99
4.17. Simulation of the Interaction Between Oligonucleotide CCCCA and
RRM1…………………………………………………………………………100
4.18. Haddock Modeling Tool Derived Binding Simulation of RRM1 and BCL2i-
22C……………………………………………………………………………102
4.19. Proposed Mechanism of RRM1 and RRM2 Interaction With i-motif DNA and
Subsequent Unfolding of the Complex Structure……………………….……103
4.20. Modeling of RRM1 and i-Motif Interaction With or Without Using FRET
Derived Distance Information……………………………...…………………106
xvii
LIST OF SCHEMES
Scheme Page
2.1. Mechanisms of Fe•Bleomycin Induced Double-Strand DNA Cleavage…....…19
xviii
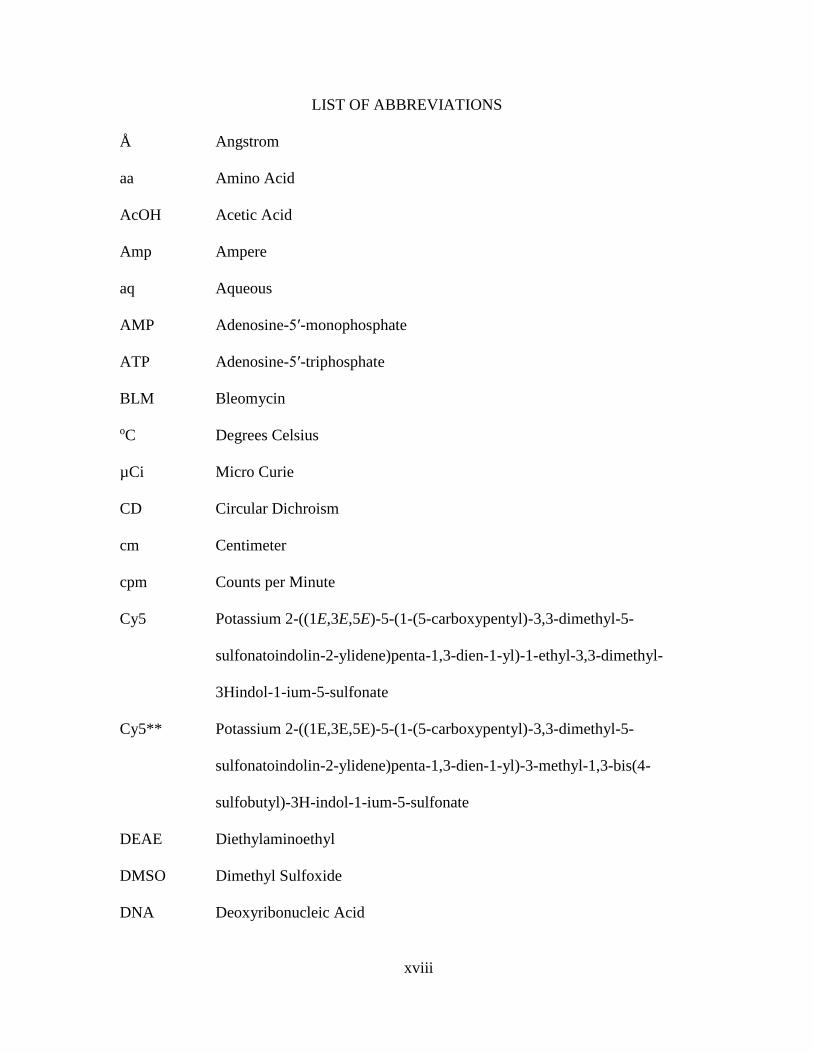
LIST OF ABBREVIATIONS
Å Angstrom
aa Amino Acid
AcOH Acetic Acid
Amp Ampere
aq Aqueous
AMP Adenosine-5ʹ-monophosphate
ATP Adenosine-5ʹ-triphosphate
BLM Bleomycin
oC Degrees Celsius
µCi Micro Curie
CD Circular Dichroism
cm Centimeter
cpm Counts per Minute
Cy5 Potassium 2-((1E,3E,5E)-5-(1-(5-carboxypentyl)-3,3-dimethyl-5-
sulfonatoindolin-2-ylidene)penta-1,3-dien-1-yl)-1-ethyl-3,3-dimethyl-
3Hindol-1-ium-5-sulfonate
Cy5** Potassium 2-((1E,3E,5E)-5-(1-(5-carboxypentyl)-3,3-dimethyl-5-
sulfonatoindolin-2-ylidene)penta-1,3-dien-1-yl)-3-methyl-1,3-bis(4-
sulfobutyl)-3H-indol-1-ium-5-sulfonate
DEAE Diethylaminoethyl
DMSO Dimethyl Sulfoxide
DNA Deoxyribonucleic Acid
xix
DTT Dithiothreitol
EDTA Ethylenedinitrilotetraacetic Acid
EtOH Ethanol
EtOAc Ethyl Acetate
g Gram(s)
h Hours
IPTG Isopropyl -D-1-thiogalactopyranoside
kDa Kilodalton
L Liter
µL Microliter
µM Micromolar
μmol Micromole(s)
M Molar
mCi Millicurie
MeOH Methanol
mg Milligram
min Minute(s)
mL Milliliter(s)
mmol Millimole(s)
mM Millimolar
mRNA Messenger Ribonucleic Acid
N Normal
NaCl Sodium Chloride
xx
nt Nucleotide
nm Nanometer
NMR Nuclear Magnetic Resonance
NOE Nuclear Overhauser Effect
PBS Phosphate Buffered Saline
pdCpA 5ʹ′-O-phosphoryl-2ʹ′-deoxycytidylyl(3ʹ′→5ʹ′)adenosine
PTC Peptidyltransferase Center
pYRNA8 Plasmid Containing the Gene Encoding 74-nucleotide tRNACUA
RNA Ribonucleic Acid
rt Room Temperature
SDS PAGE Sodium Dodecyl Sulfate Polyacrylamide Gel Electrophoresis
soln Solution
SPR Surface Plasmon Resonance
TAE Tris-acetic Acid-EDTA
TBE Tris-borate-EDTA
Tris Tris(hydroxymethyl)aminomethane
tRNA Transfer RNA
Trp Tryptophan
UV Ultraviolet
1
CHAPTER 1
GENERAL INTRODUCTION
1.1. Molecular Therapeutics of Cancer Research
Cancer is an uncontrolled growth of normal cells in the body. It claims millions of
lives worldwide every year and it is a major public health concern.1 Symptoms of cancer
involve abnormal cell growth, bleeding, cough, and weight loss.2 Among several types of
cancers, lung and prostate cancers are most common in men, whereas breast, cervical and
ovarian cancers are prevalent in females.3 Leukemia, brain tumors and skin cancers are
other types of cancer that affect a wide population of all ages.4 Increased risk of cancer is
associated with developing countries5 and with age,6 though it has been argued that the
increased life expectancy has contributed to the higher occurrence of cancer in developed
countries. Although the majority of cancers most likely develop due to environmental
causes,7 genetics8 and lifestyle also play an important role in the development of
malignancies. Other factors include smoking,9,10 diet, infection, exposure to radiation and
stress.11 The treatment of cancer is practiced at several different levels, including
chemotherapy, radiation therapy, hormonal treatment and patient counseling.
Chemotherapy research broadly involves the synthesis and study of novel
chemotherapeutic agents for the diagnosis and treatment of cancer. Therapeutic
anticancer agents are mainly designed with a curative intent to prolong life. DNA-
targeted agents constitute a broad class of therapeutic anticancer agents and can be
classified into sub-categories such as, intercalators and groove binders (Figure 1.1).
2
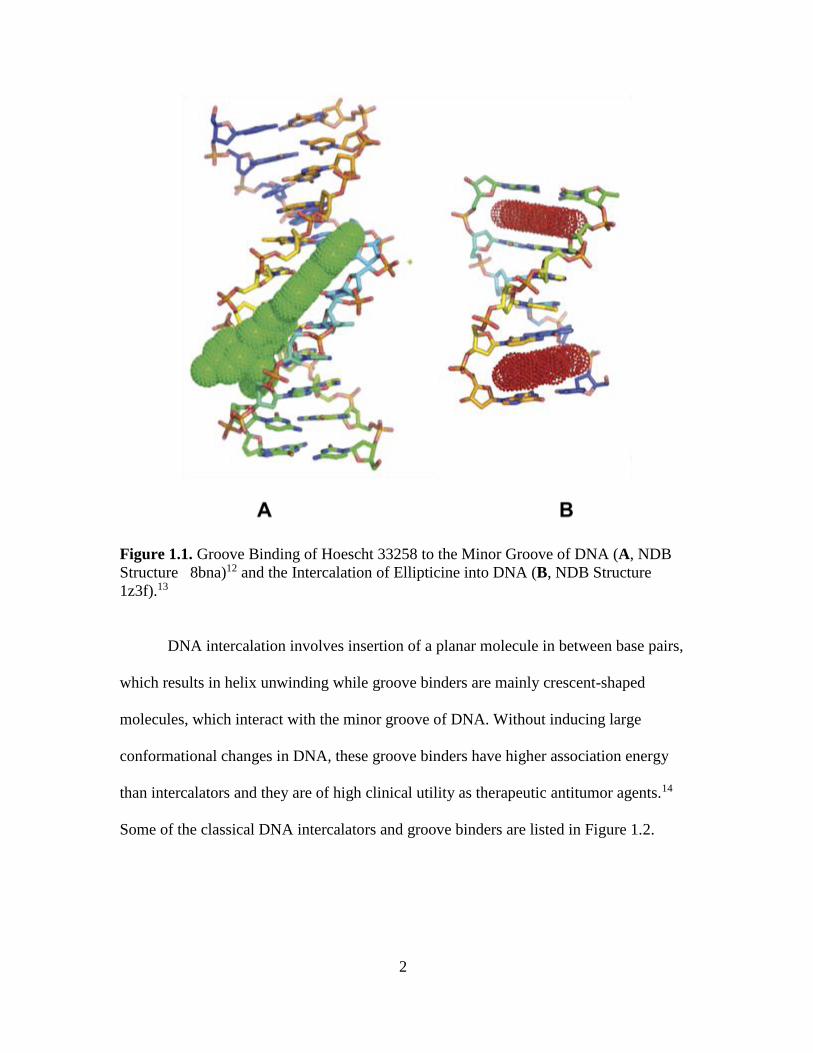
Figure 1.1. Groove Binding of Hoescht 33258 to the Minor Groove of DNA (A, NDB
Structure 8bna)12 and the Intercalation of Ellipticine into DNA (B, NDB Structure
1z3f).13
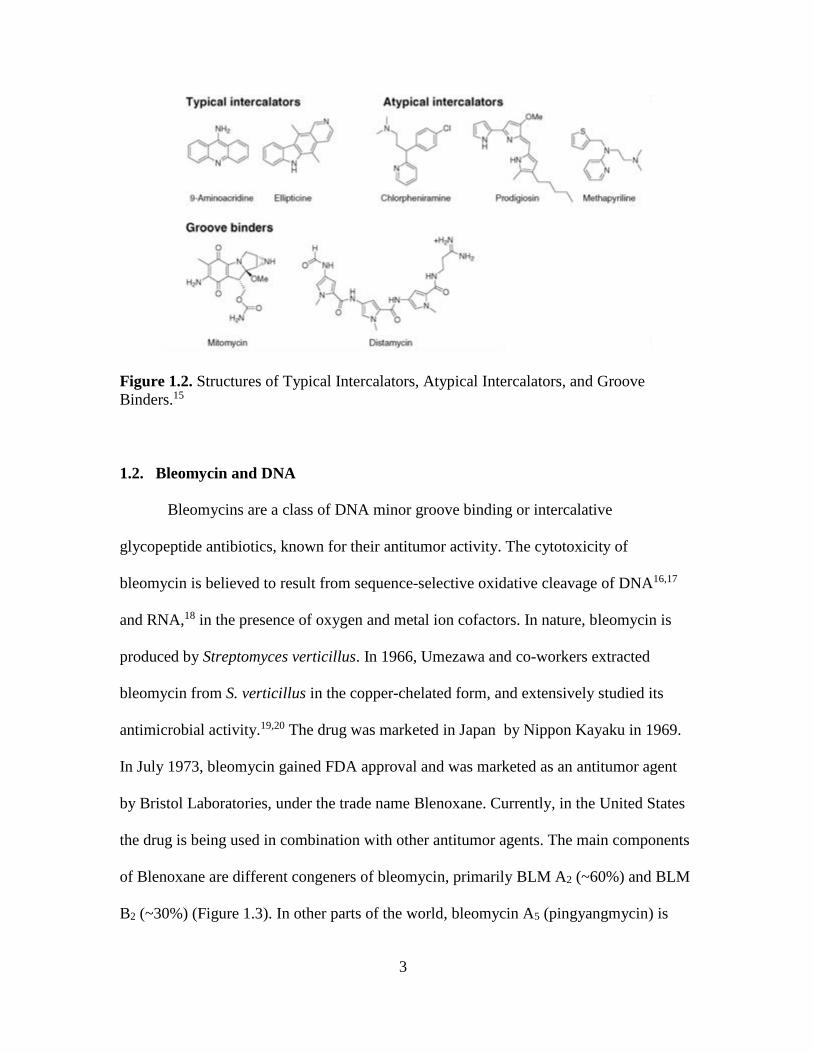
DNA intercalation involves insertion of a planar molecule in between base pairs,
which results in helix unwinding while groove binders are mainly crescent-shaped
molecules, which interact with the minor groove of DNA. Without inducing large
conformational changes in DNA, these groove binders have higher association energy
than intercalators and they are of high clinical utility as therapeutic antitumor agents.14
Some of the classical DNA intercalators and groove binders are listed in Figure 1.2.
3
Figure 1.2. Structures of Typical Intercalators, Atypical Intercalators, and Groove
Binders.15
1.2. Bleomycin and DNA
Bleomycins are a class of DNA minor groove binding or intercalative
glycopeptide antibiotics, known for their antitumor activity. The cytotoxicity of
bleomycin is believed to result from sequence-selective oxidative cleavage of DNA16,17
and RNA,18 in the presence of oxygen and metal ion cofactors. In nature, bleomycin is
produced by Streptomyces verticillus. In 1966, Umezawa and co-workers extracted
bleomycin from S. verticillus in the copper-chelated form, and extensively studied its
antimicrobial activity.19,20 The drug was marketed in Japan by Nippon Kayaku in 1969.
In July 1973, bleomycin gained FDA approval and was marketed as an antitumor agent
by Bristol Laboratories, under the trade name Blenoxane. Currently, in the United States
the drug is being used in combination with other antitumor agents. The main components
of Blenoxane are different congeners of bleomycin, primarily BLM A2 (~60%) and BLM
B2 (~30%) (Figure 1.3). In other parts of the world, bleomycin A5 (pingyangmycin) is
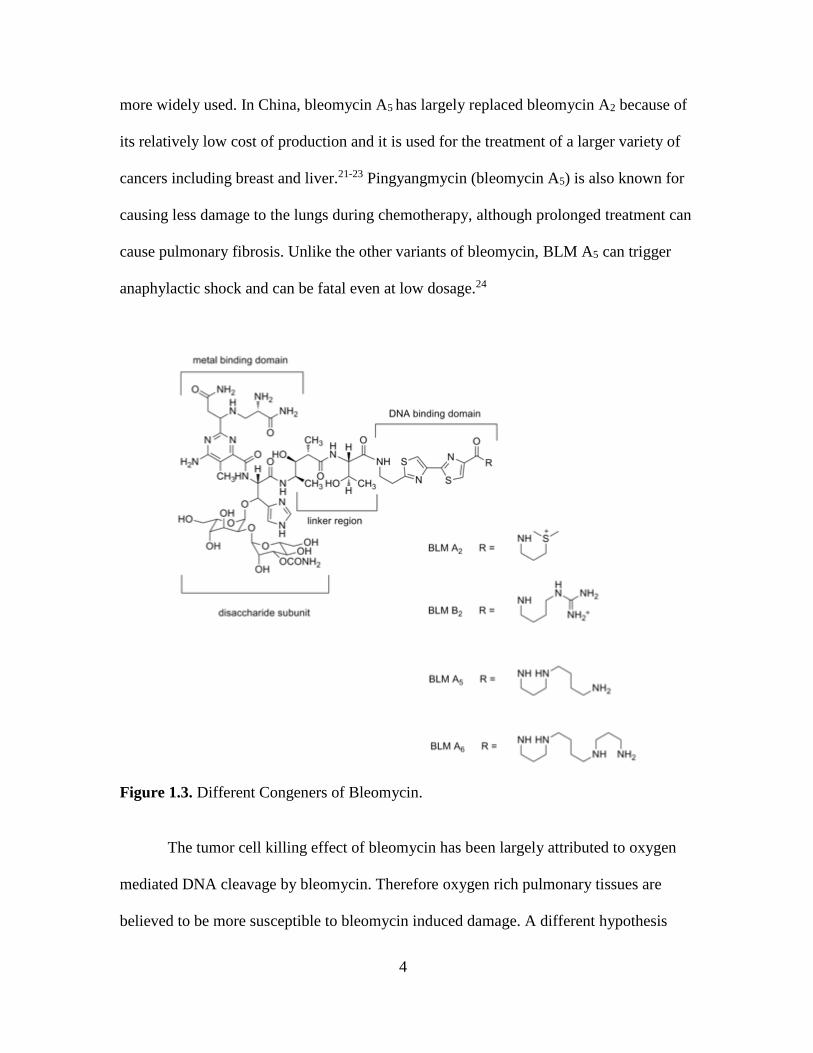
4
more widely used. In China, bleomycin A5 has largely replaced bleomycin A2 because of
its relatively low cost of production and it is used for the treatment of a larger variety of
cancers including breast and liver.21-23 Pingyangmycin (bleomycin A5) is also known for
causing less damage to the lungs during chemotherapy, although prolonged treatment can
cause pulmonary fibrosis. Unlike the other variants of bleomycin, BLM A5 can trigger
anaphylactic shock and can be fatal even at low dosage.24
Figure 1.3. Different Congeners of Bleomycin.
The tumor cell killing effect of bleomycin has been largely attributed to oxygen
mediated DNA cleavage by bleomycin. Therefore oxygen rich pulmonary tissues are
believed to be more susceptible to bleomycin induced damage. A different hypothesis
5
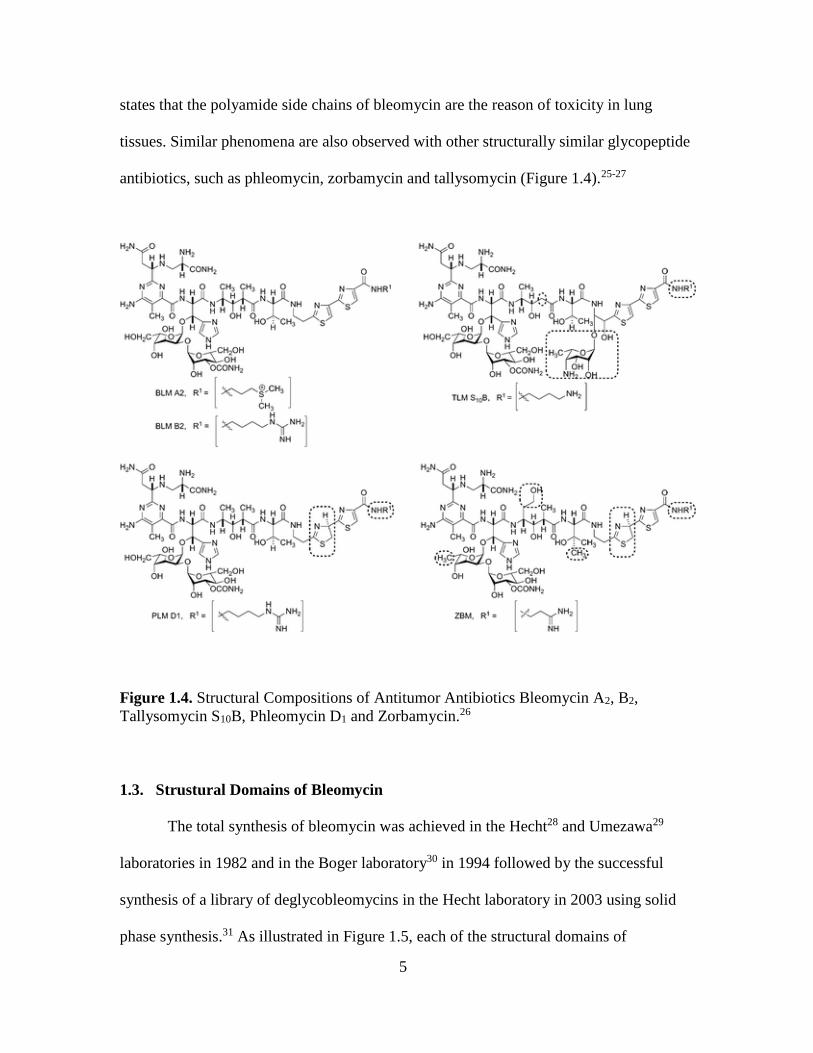
states that the polyamide side chains of bleomycin are the reason of toxicity in lung
tissues. Similar phenomena are also observed with other structurally similar glycopeptide
antibiotics, such as phleomycin, zorbamycin and tallysomycin (Figure 1.4).25-27
Figure 1.4. Structural Compositions of Antitumor Antibiotics Bleomycin A2, B2,
Tallysomycin S10B, Phleomycin D1 and Zorbamycin.26
1.3. Strustural Domains of Bleomycin
The total synthesis of bleomycin was achieved in the Hecht28 and Umezawa29
laboratories in 1982 and in the Boger laboratory30 in 1994 followed by the successful
synthesis of a library of deglycobleomycins in the Hecht laboratory in 2003 using solid
phase synthesis.31 As illustrated in Figure 1.5, each of the structural domains of
6
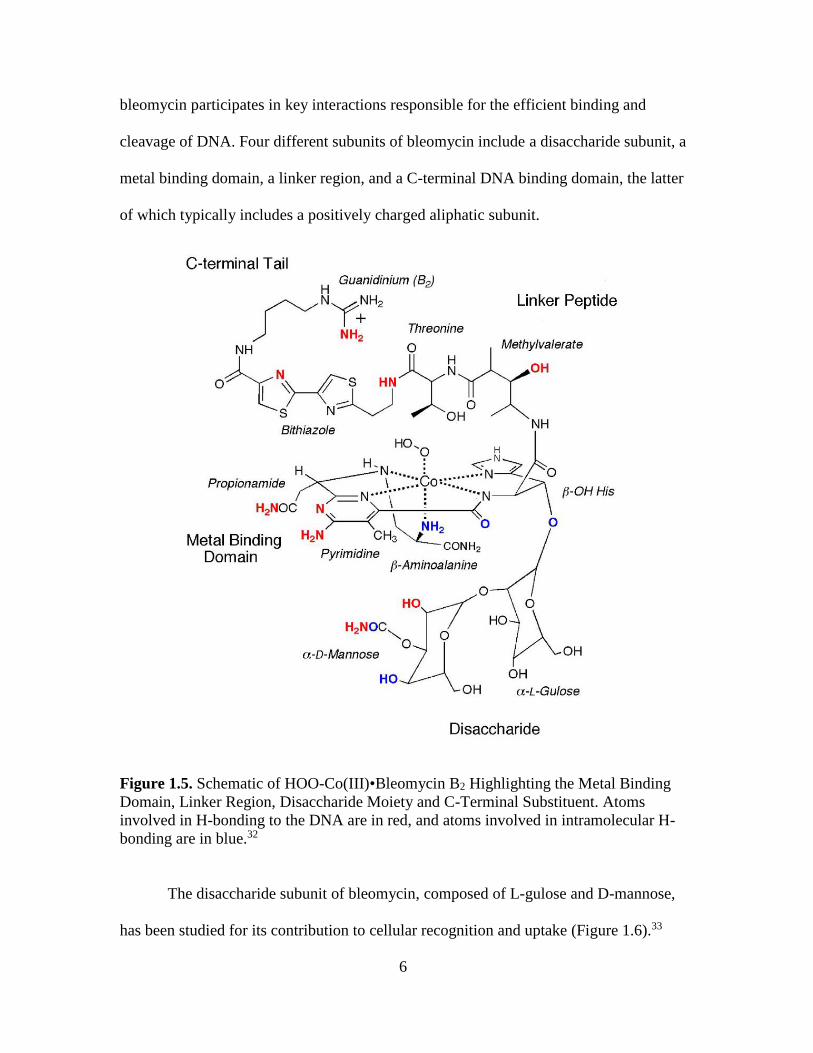
bleomycin participates in key interactions responsible for the efficient binding and
cleavage of DNA. Four different subunits of bleomycin include a disaccharide subunit, a
metal binding domain, a linker region, and a C-terminal DNA binding domain, the latter
of which typically includes a positively charged aliphatic subunit.
Figure 1.5. Schematic of HOO-Co(III)•Bleomycin B2 Highlighting the Metal Binding
Domain, Linker Region, Disaccharide Moiety and C-Terminal Substituent. Atoms
involved in H-bonding to the DNA are in red, and atoms involved in intramolecular H-
bonding are in blue.32
The disaccharide subunit of bleomycin, composed of L-gulose and D-mannose,
has been studied for its contribution to cellular recognition and uptake (Figure 1.6).33
7
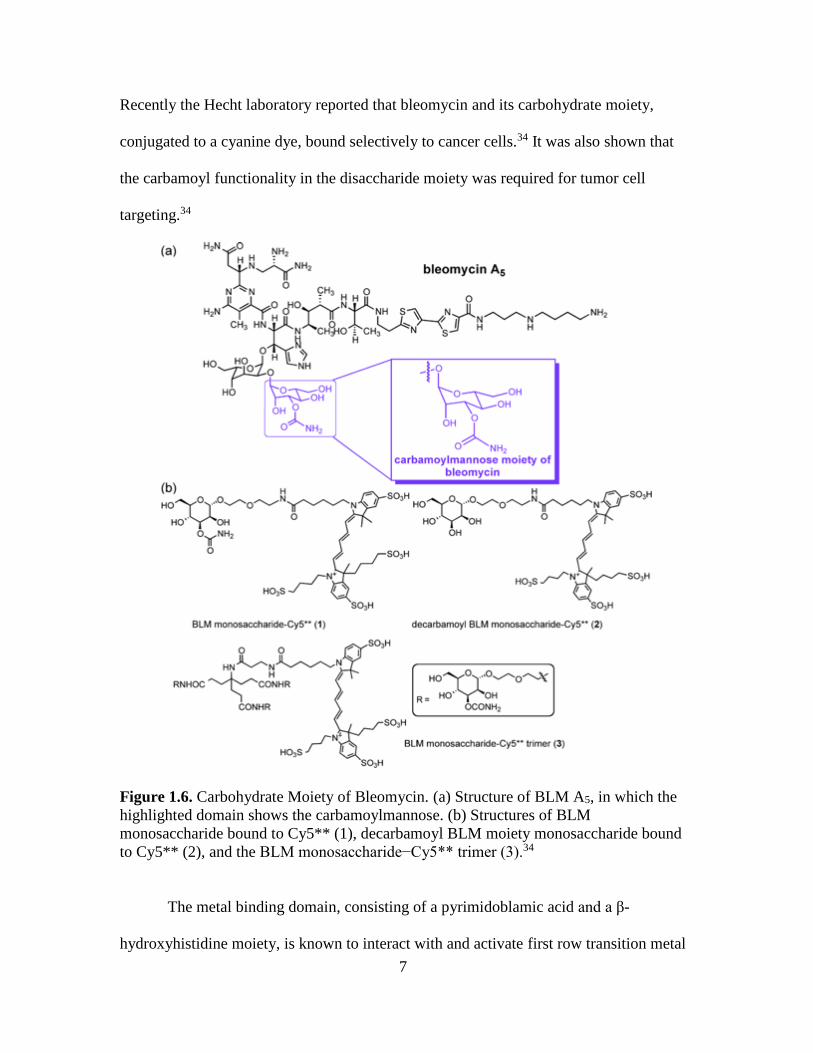
Recently the Hecht laboratory reported that bleomycin and its carbohydrate moiety,
conjugated to a cyanine dye, bound selectively to cancer cells.34 It was also shown that
the carbamoyl functionality in the disaccharide moiety was required for tumor cell
targeting.34
Figure 1.6. Carbohydrate Moiety of Bleomycin. (a) Structure of BLM A5, in which the
highlighted domain shows the carbamoylmannose. (b) Structures of BLM
monosaccharide bound to Cy5** (1), decarbamoyl BLM moiety monosaccharide bound
to Cy5** (2), and the BLM monosaccharide−Cy5** trimer (3).34
The metal binding domain, consisting of a pyrimidoblamic acid and a β-
hydroxyhistidine moiety, is known to interact with and activate first row transition metal
8
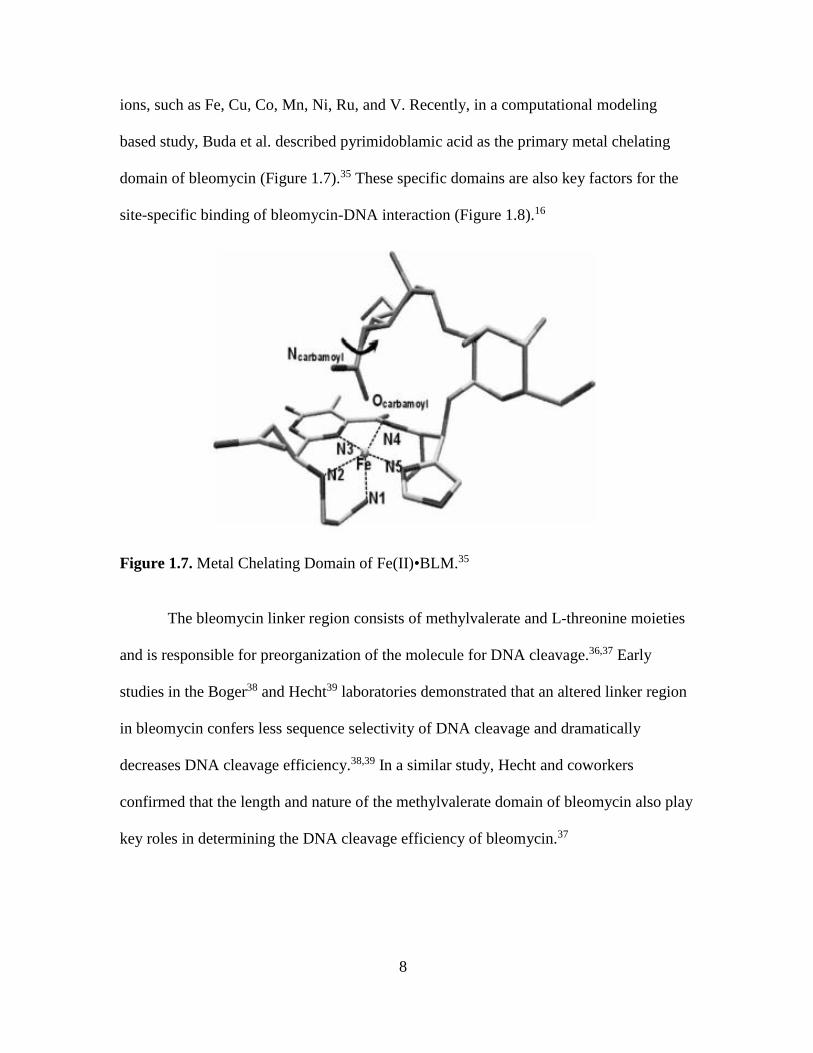
ions, such as Fe, Cu, Co, Mn, Ni, Ru, and V. Recently, in a computational modeling
based study, Buda et al. described pyrimidoblamic acid as the primary metal chelating
domain of bleomycin (Figure 1.7).35 These specific domains are also key factors for the
site-specific binding of bleomycin-DNA interaction (Figure 1.8).16
Figure 1.7. Metal Chelating Domain of Fe(II)•BLM.35
The bleomycin linker region consists of methylvalerate and L-threonine moieties
and is responsible for preorganization of the molecule for DNA cleavage.36,37 Early
studies in the Boger38 and Hecht39 laboratories demonstrated that an altered linker region
in bleomycin confers less sequence selectivity of DNA cleavage and dramatically
decreases DNA cleavage efficiency.38,39 In a similar study, Hecht and coworkers
confirmed that the length and nature of the methylvalerate domain of bleomycin also play
key roles in determining the DNA cleavage efficiency of bleomycin.37
9
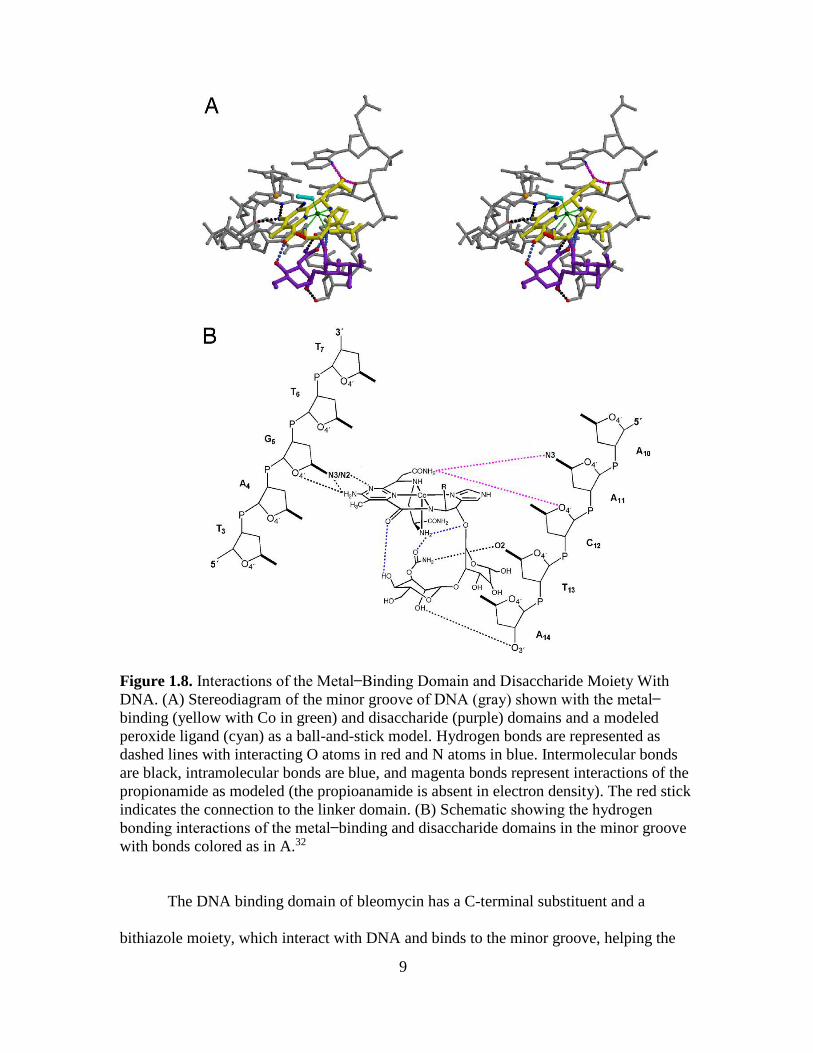
Figure 1.8. Interactions of the Metal Binding Domain and Disaccharide Moiety With
DNA. (A) Stereodiagram of the minor groove of DNA (gray) shown with the metal
binding (yellow with Co in green) and disaccharide (purple) domains and a modeled
peroxide ligand (cyan) as a ball-and-stick model. Hydrogen bonds are represented as
dashed lines with interacting O atoms in red and N atoms in blue. Intermolecular bonds
are black, intramolecular bonds are blue, and magenta bonds represent interactions of the
propionamide as modeled (the propioanamide is absent in electron density). The red stick
indicates the connection to the linker domain. (B) Schematic showing the hydrogen
bonding interactions of the metal binding and disaccharide domains in the minor groove
with bonds colored as in A.32
The DNA binding domain of bleomycin has a C-terminal substituent and a
bithiazole moiety, which interact with DNA and binds to the minor groove, helping the
10
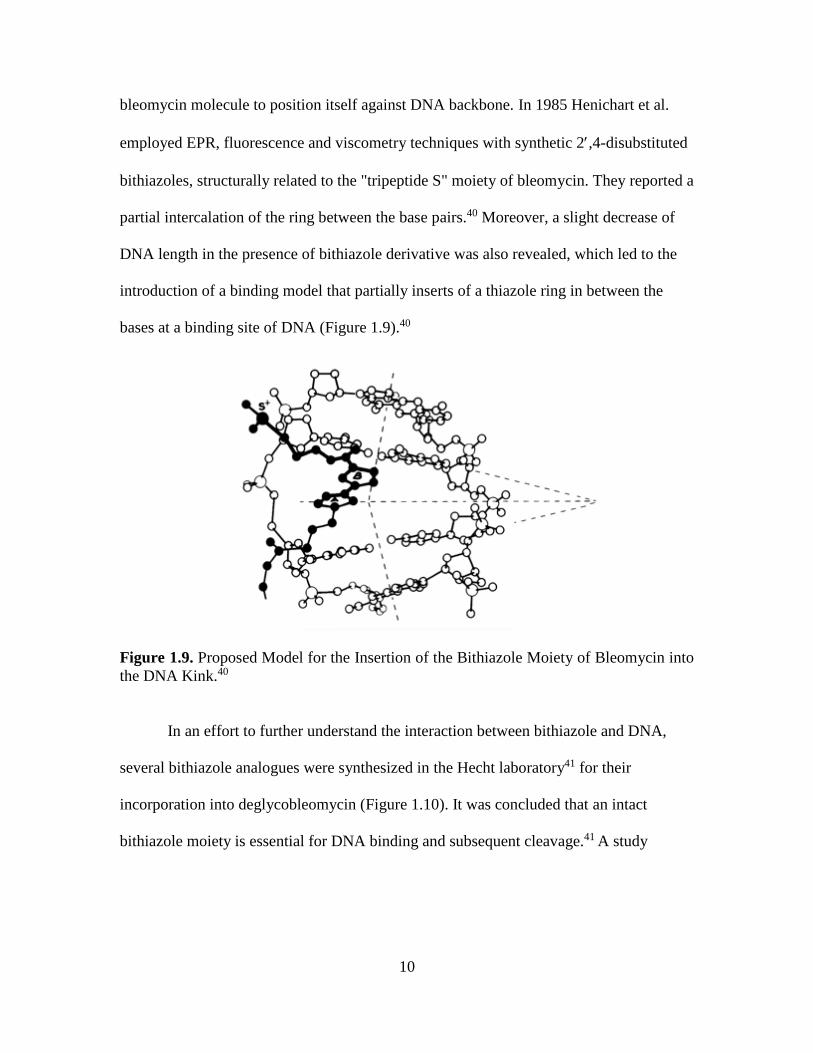
bleomycin molecule to position itself against DNA backbone. In 1985 Henichart et al.
employed EPR, fluorescence and viscometry techniques with synthetic 2,4-disubstituted
bithiazoles, structurally related to the "tripeptide S" moiety of bleomycin. They reported a
partial intercalation of the ring between the base pairs.40 Moreover, a slight decrease of
DNA length in the presence of bithiazole derivative was also revealed, which led to the
introduction of a binding model that partially inserts of a thiazole ring in between the
bases at a binding site of DNA (Figure 1.9).40
Figure 1.9. Proposed Model for the Insertion of the Bithiazole Moiety of Bleomycin into
the DNA Kink.40
In an effort to further understand the interaction between bithiazole and DNA,
several bithiazole analogues were synthesized in the Hecht laboratory41 for their
incorporation into deglycobleomycin (Figure 1.10). It was concluded that an intact
bithiazole moiety is essential for DNA binding and subsequent cleavage.41 A study
11
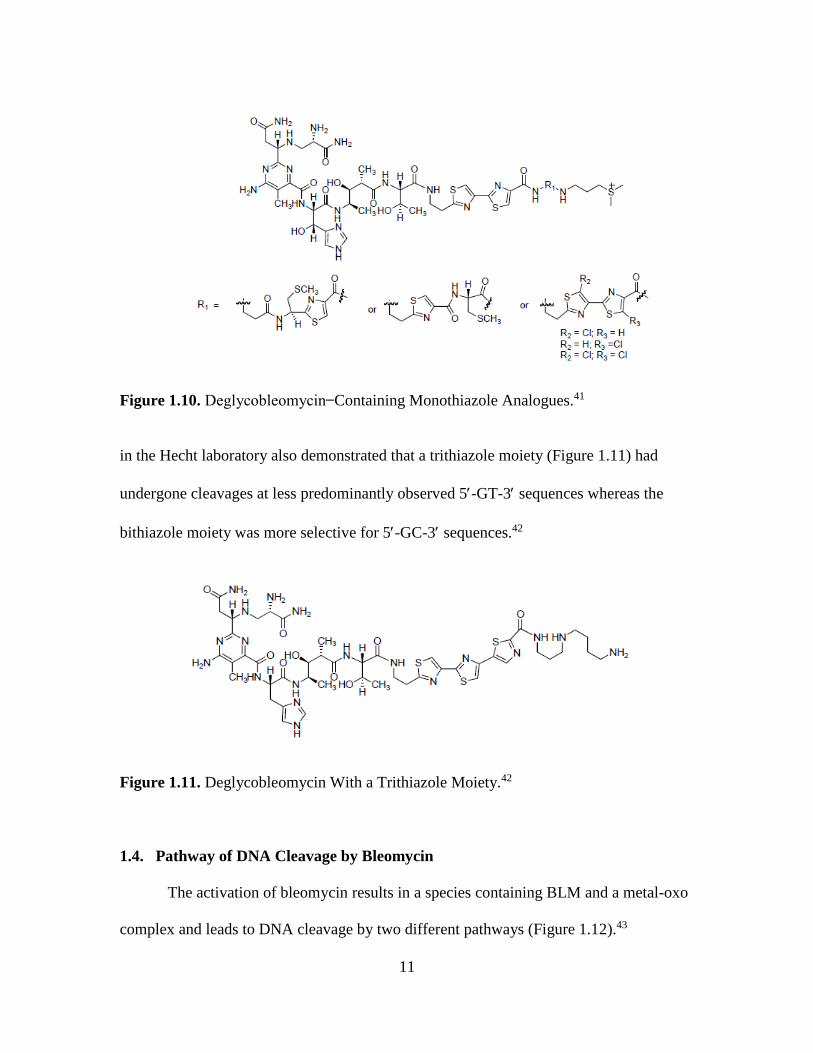
Figure 1.10. Deglycobleomycin Containing Monothiazole Analogues.41
in the Hecht laboratory also demonstrated that a trithiazole moiety (Figure 1.11) had
undergone cleavages at less predominantly observed 5-GT-3 sequences whereas the
bithiazole moiety was more selective for 5-GC-3 sequences.42
Figure 1.11. Deglycobleomycin With a Trithiazole Moiety.42
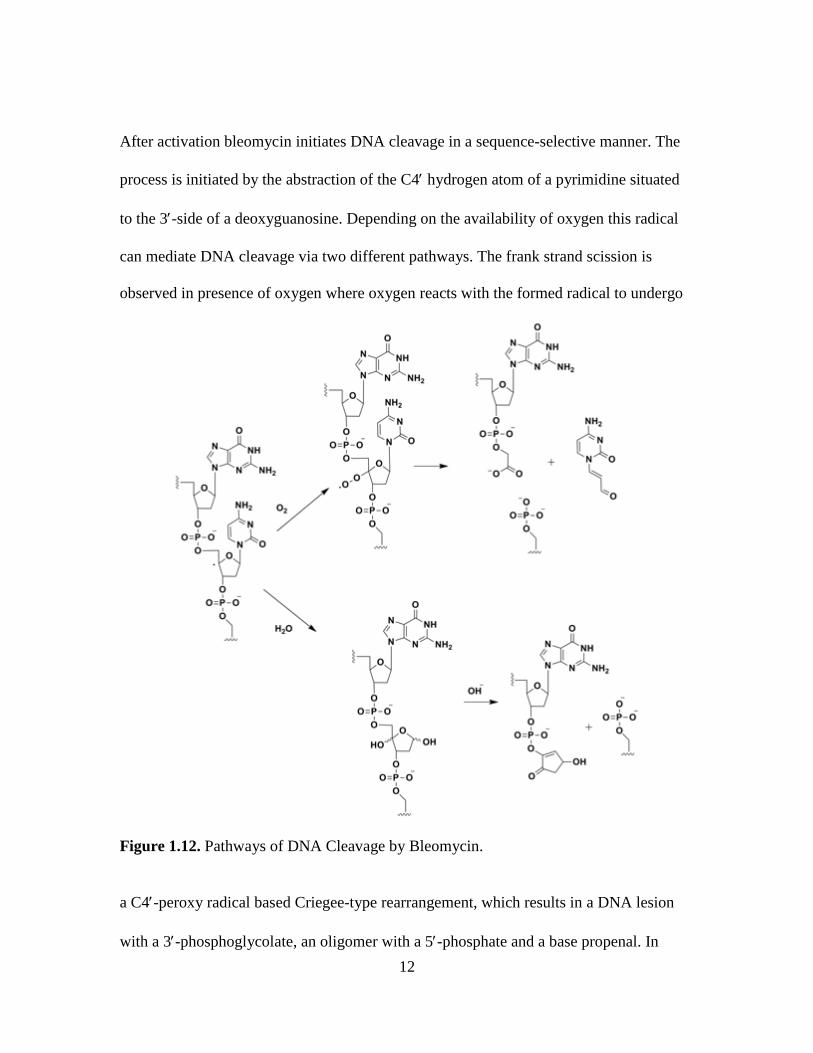
1.4. Pathway of DNA Cleavage by Bleomycin
The activation of bleomycin results in a species containing BLM and a metal-oxo
complex and leads to DNA cleavage by two different pathways (Figure 1.12).43
12
After activation bleomycin initiates DNA cleavage in a sequence-selective manner. The
process is initiated by the abstraction of the C4 hydrogen atom of a pyrimidine situated
to the 3-side of a deoxyguanosine. Depending on the availability of oxygen this radical
can mediate DNA cleavage via two different pathways. The frank strand scission is
observed in presence of oxygen where oxygen reacts with the formed radical to undergo
Figure 1.12. Pathways of DNA Cleavage by Bleomycin.
a C4-peroxy radical based Criegee-type rearrangement, which results in a DNA lesion
with a 3-phosphoglycolate, an oligomer with a 5-phosphate and a base propenal. In
13
contrast, the “anaerobic” pathway leads to a transformation producing a 4-
hydroxyapurinic acid moiety and the release of a nucleobase. This abasic site yields an
oligonucleotide terminating in a 3ʹ-phosphate or 3ʹ-hydroxycyclopentenone moiety, when
treated with alkali.44-48
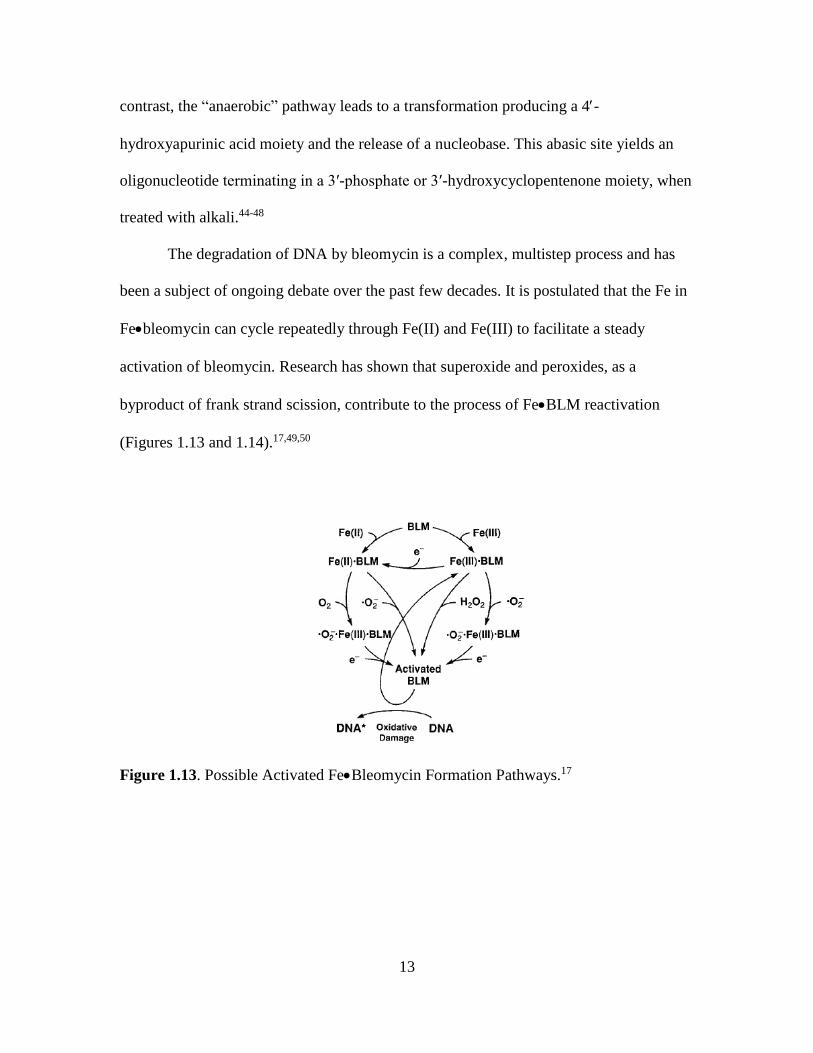
The degradation of DNA by bleomycin is a complex, multistep process and has
been a subject of ongoing debate over the past few decades. It is postulated that the Fe in
Febleomycin can cycle repeatedly through Fe(II) and Fe(III) to facilitate a steady
activation of bleomycin. Research has shown that superoxide and peroxides, as a
byproduct of frank strand scission, contribute to the process of FeBLM reactivation
(Figures 1.13 and 1.14).17,49,50
Figure 1.13. Possible Activated FeBleomycin Formation Pathways.17

14
Figure 1.14. Proposed Catalytic Cycle of DNA Degradation by BLM.49,50
In my research, a combination of a low concentration of bleomycin, comparable
to the clinically approved dosage, and a library of hairpin DNAs that strongly bind to
bleomycin were employed to investigate the biochemistry of bleomycin A5 induced
double-strand DNA cleavage.
15
CHAPTER 2
MECHANISM OF BLEOMYCIN INDUCED DOUBLE-STRAND DNA CLEAVAGE
2.1. Introduction
Even though it is clear from early studies that the cytotoxicity of bleomycin is a
result of its DNA cleavage activity, and the single-strand mode of cleavage is well
understood, the nature of DNA double-strand breakage has not been as well
characterized. In DNA cleavage by bleomycin, a secondary coupled cleavage has been
observed at the site on the opposite strand directly opposing the primary lesion, occurring
at the frequency of 20% of the total DNA cleavage.
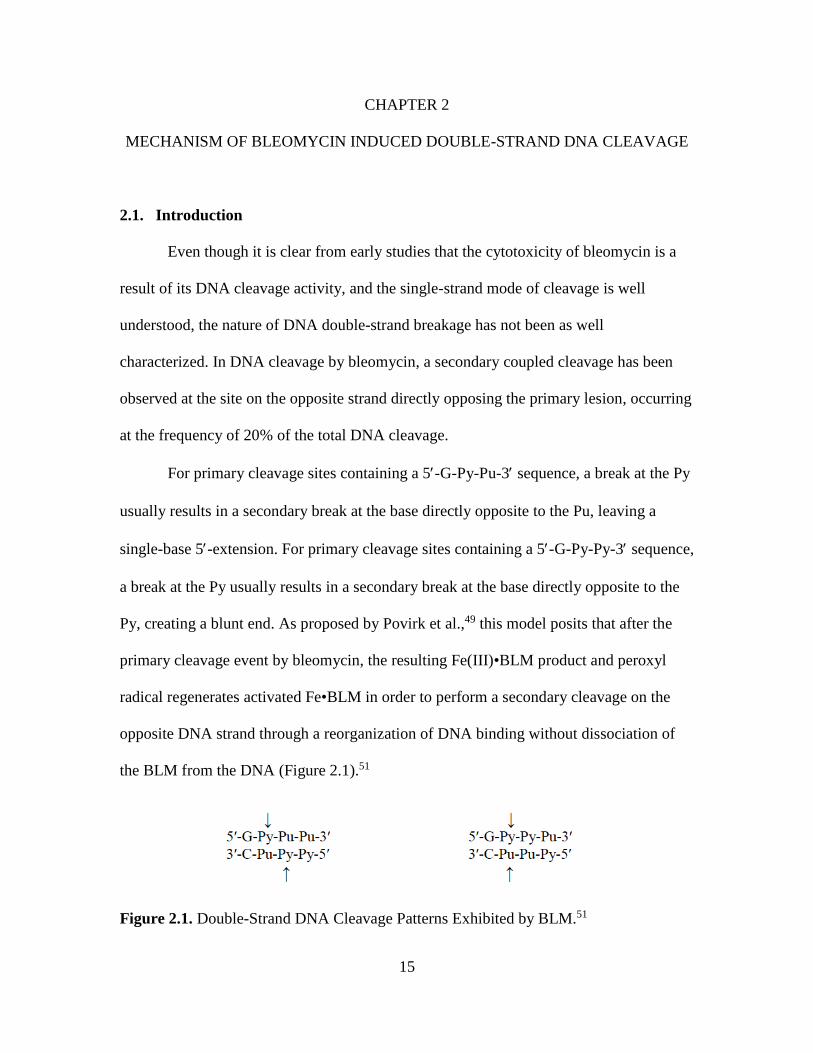
For primary cleavage sites containing a 5-G-Py-Pu-3 sequence, a break at the Py
usually results in a secondary break at the base directly opposite to the Pu, leaving a
single-base 5-extension. For primary cleavage sites containing a 5-G-Py-Py-3 sequence,
a break at the Py usually results in a secondary break at the base directly opposite to the
Py, creating a blunt end. As proposed by Povirk et al.,49 this model posits that after the
primary cleavage event by bleomycin, the resulting Fe(III)•BLM product and peroxyl
radical regenerates activated Fe•BLM in order to perform a secondary cleavage on the
opposite DNA strand through a reorganization of DNA binding without dissociation of
the BLM from the DNA (Figure 2.1).51
Figure 2.1. Double-Strand DNA Cleavage Patterns Exhibited by BLM.51
16
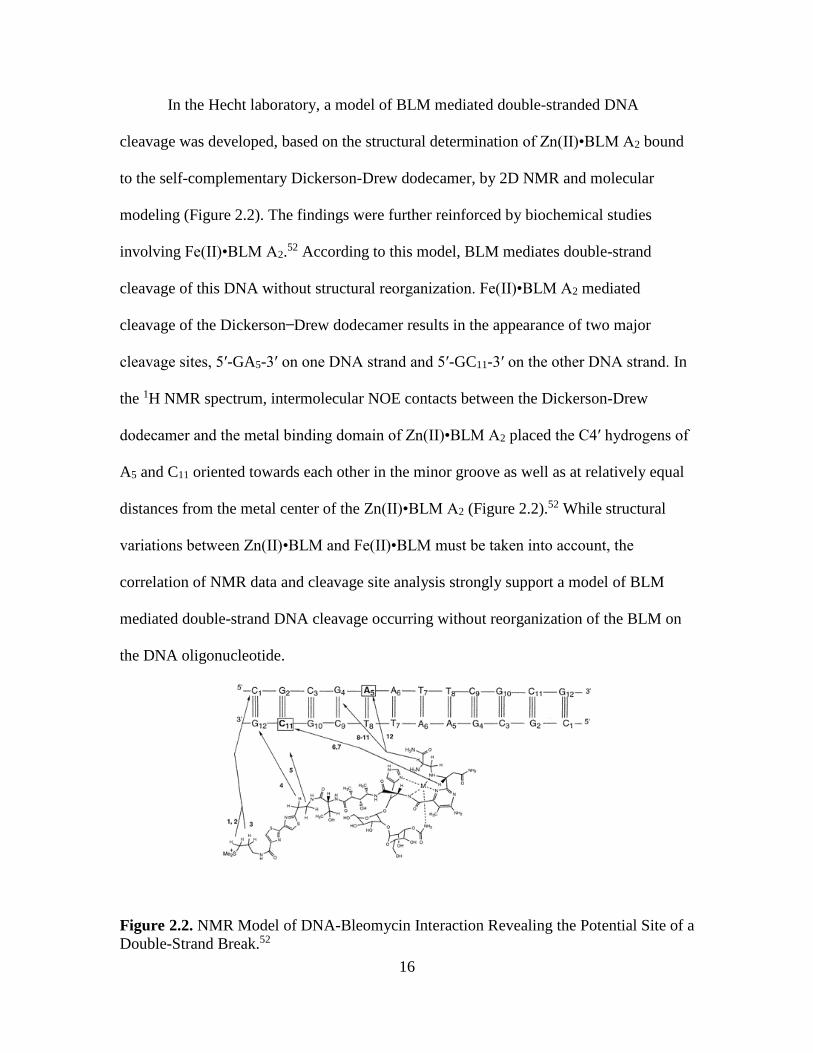
In the Hecht laboratory, a model of BLM mediated double-stranded DNA
cleavage was developed, based on the structural determination of Zn(II)•BLM A2 bound
to the self-complementary Dickerson-Drew dodecamer, by 2D NMR and molecular
modeling (Figure 2.2). The findings were further reinforced by biochemical studies
involving Fe(II)•BLM A2.52 According to this model, BLM mediates double-strand
cleavage of this DNA without structural reorganization. Fe(II)•BLM A2 mediated
cleavage of the Dickerson Drew dodecamer results in the appearance of two major
cleavage sites, 5ʹ-GA5-3ʹ on one DNA strand and 5ʹ-GC11-3ʹ on the other DNA strand. In
the 1H NMR spectrum, intermolecular NOE contacts between the Dickerson-Drew
dodecamer and the metal binding domain of Zn(II)•BLM A2 placed the C4ʹ hydrogens of
A5 and C11 oriented towards each other in the minor groove as well as at relatively equal
distances from the metal center of the Zn(II)•BLM A2 (Figure 2.2).52 While structural
variations between Zn(II)•BLM and Fe(II)•BLM must be taken into account, the
correlation of NMR data and cleavage site analysis strongly support a model of BLM
mediated double-strand DNA cleavage occurring without reorganization of the BLM on
the DNA oligonucleotide.
Figure 2.2. NMR Model of DNA-Bleomycin Interaction Revealing the Potential Site of a
Double-Strand Break.52
17
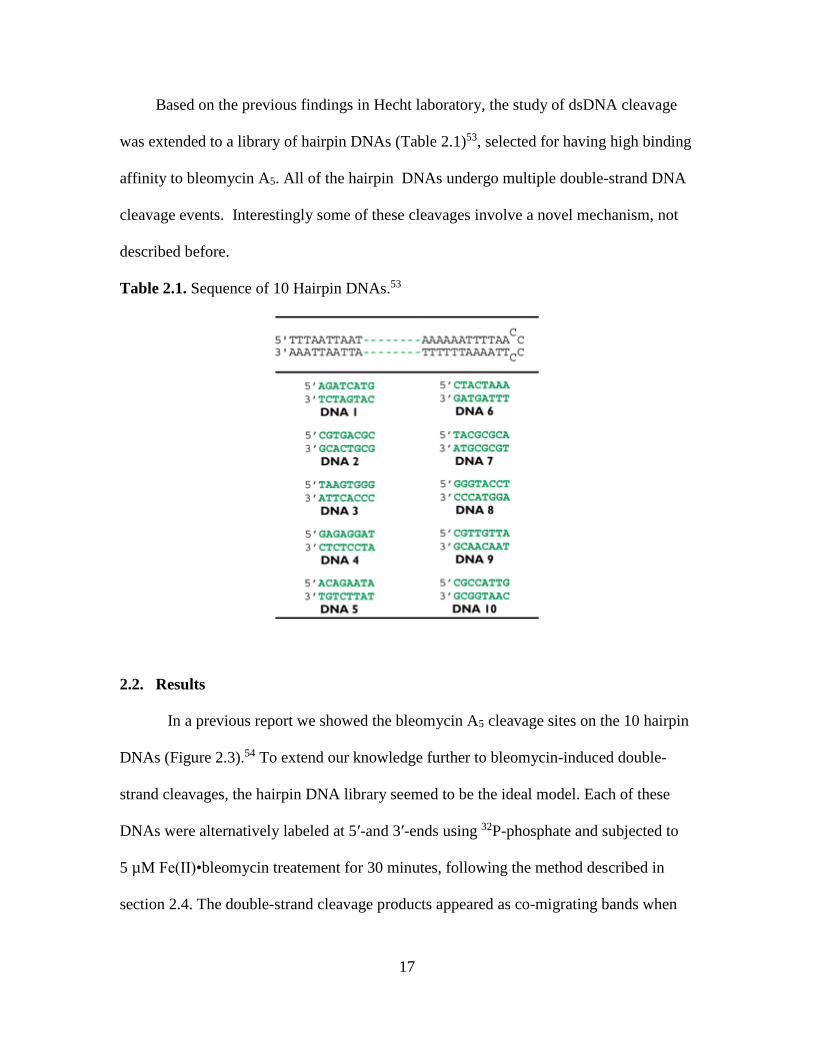
Based on the previous findings in Hecht laboratory, the study of dsDNA cleavage
was extended to a library of hairpin DNAs (Table 2.1)53, selected for having high binding
affinity to bleomycin A5. All of the hairpin DNAs undergo multiple double-strand DNA
cleavage events. Interestingly some of these cleavages involve a novel mechanism, not
described before.
Table 2.1. Sequence of 10 Hairpin DNAs.53
2.2. Results
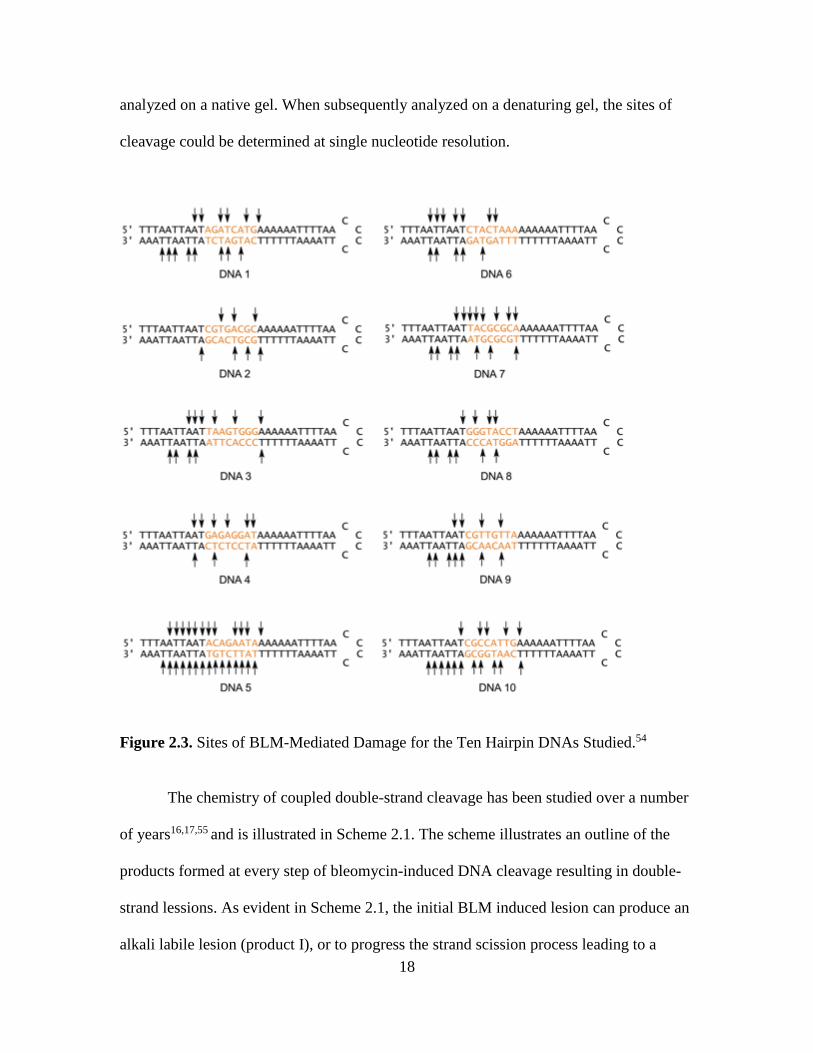
In a previous report we showed the bleomycin A5 cleavage sites on the 10 hairpin
DNAs (Figure 2.3).54 To extend our knowledge further to bleomycin-induced double-
strand cleavages, the hairpin DNA library seemed to be the ideal model. Each of these
DNAs were alternatively labeled at 5ʹ-and 3ʹ-ends using 32P-phosphate and subjected to
5 µM Fe(II)•bleomycin treatement for 30 minutes, following the method described in
section 2.4. The double-strand cleavage products appeared as co-migrating bands when
18
analyzed on a native gel. When subsequently analyzed on a denaturing gel, the sites of
cleavage could be determined at single nucleotide resolution.
Figure 2.3. Sites of BLM-Mediated Damage for the Ten Hairpin DNAs Studied.54
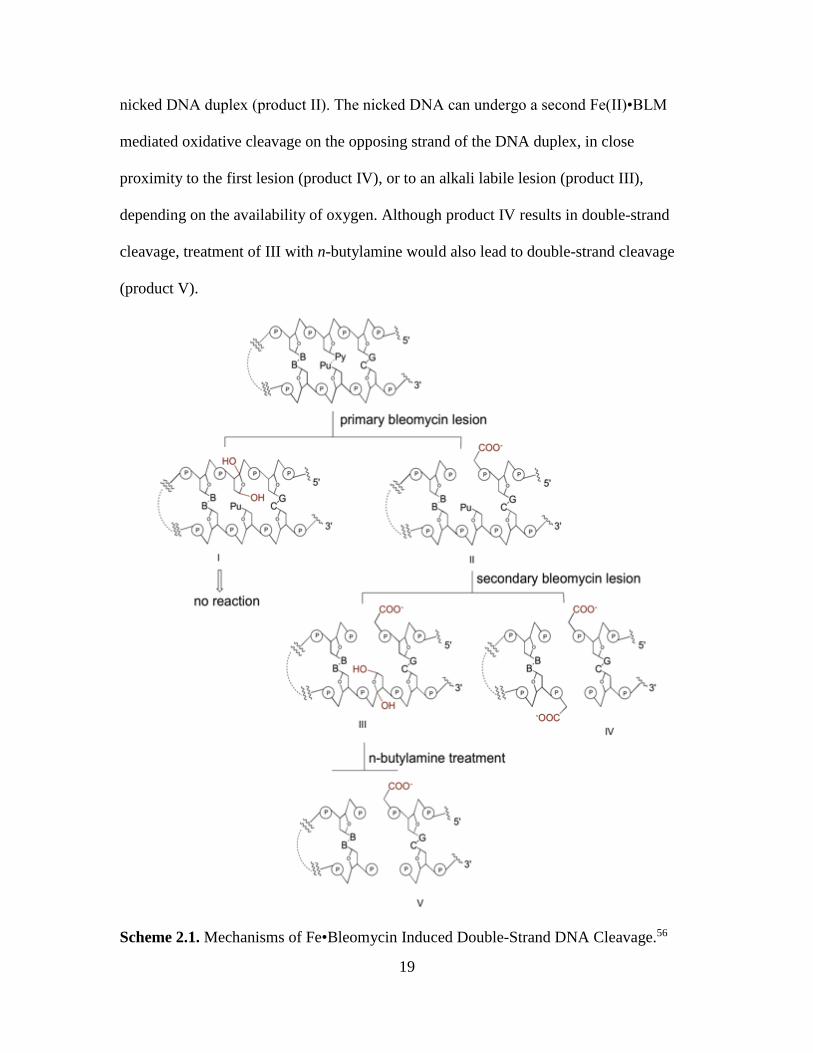
The chemistry of coupled double-strand cleavage has been studied over a number
of years16,17,55 and is illustrated in Scheme 2.1. The scheme illustrates an outline of the
products formed at every step of bleomycin-induced DNA cleavage resulting in double-
strand lessions. As evident in Scheme 2.1, the initial BLM induced lesion can produce an
alkali labile lesion (product I), or to progress the strand scission process leading to a
19
nicked DNA duplex (product II). The nicked DNA can undergo a second Fe(II)•BLM
mediated oxidative cleavage on the opposing strand of the DNA duplex, in close
proximity to the first lesion (product IV), or to an alkali labile lesion (product III),
depending on the availability of oxygen. Although product IV results in double-strand
cleavage, treatment of III with n-butylamine would also lead to double-strand cleavage
(product V).
Scheme 2.1. Mechanisms of Fe•Bleomycin Induced Double-Strand DNA Cleavage.56
20
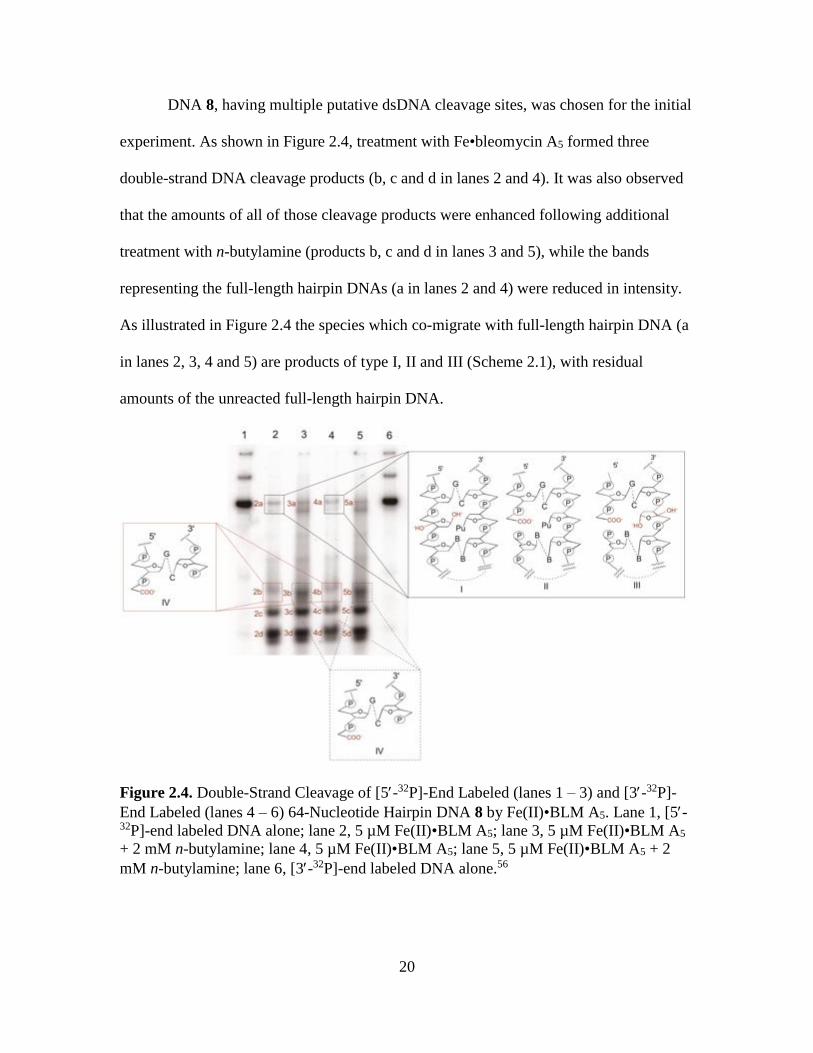
DNA 8, having multiple putative dsDNA cleavage sites, was chosen for the initial
experiment. As shown in Figure 2.4, treatment with Fe•bleomycin A5 formed three
double-strand DNA cleavage products (b, c and d in lanes 2 and 4). It was also observed
that the amounts of all of those cleavage products were enhanced following additional
treatment with n-butylamine (products b, c and d in lanes 3 and 5), while the bands
representing the full-length hairpin DNAs (a in lanes 2 and 4) were reduced in intensity.
As illustrated in Figure 2.4 the species which co-migrate with full-length hairpin DNA (a
in lanes 2, 3, 4 and 5) are products of type I, II and III (Scheme 2.1), with residual
amounts of the unreacted full-length hairpin DNA.
Figure 2.4. Double-Strand Cleavage of [5-32P]-End Labeled (lanes 1 – 3) and [3-32P]-
End Labeled (lanes 4 – 6) 64-Nucleotide Hairpin DNA 8 by Fe(II)•BLM A5. Lane 1, [5-32P]-end labeled DNA alone; lane 2, 5 µM Fe(II)•BLM A5; lane 3, 5 µM Fe(II)•BLM A5
+ 2 mM n-butylamine; lane 4, 5 µM Fe(II)•BLM A5; lane 5, 5 µM Fe(II)•BLM A5 + 2
mM n-butylamine; lane 6, [3-32P]-end labeled DNA alone.56
21
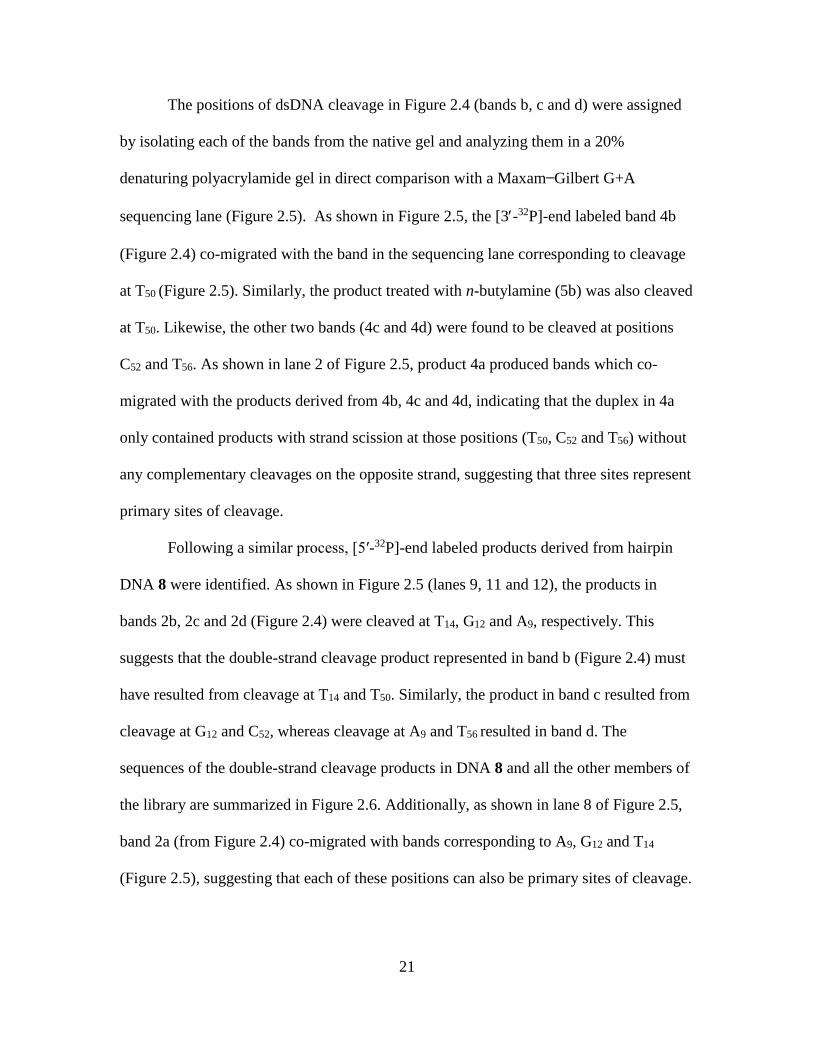
The positions of dsDNA cleavage in Figure 2.4 (bands b, c and d) were assigned
by isolating each of the bands from the native gel and analyzing them in a 20%
denaturing polyacrylamide gel in direct comparison with a Maxam Gilbert G+A
sequencing lane (Figure 2.5). As shown in Figure 2.5, the [3-32P]-end labeled band 4b
(Figure 2.4) co-migrated with the band in the sequencing lane corresponding to cleavage
at T50 (Figure 2.5). Similarly, the product treated with n-butylamine (5b) was also cleaved
at T50. Likewise, the other two bands (4c and 4d) were found to be cleaved at positions
C52 and T56. As shown in lane 2 of Figure 2.5, product 4a produced bands which co-
migrated with the products derived from 4b, 4c and 4d, indicating that the duplex in 4a
only contained products with strand scission at those positions (T50, C52 and T56) without
any complementary cleavages on the opposite strand, suggesting that three sites represent
primary sites of cleavage.
Following a similar process, [5′-32P]-end labeled products derived from hairpin
DNA 8 were identified. As shown in Figure 2.5 (lanes 9, 11 and 12), the products in
bands 2b, 2c and 2d (Figure 2.4) were cleaved at T14, G12 and A9, respectively. This
suggests that the double-strand cleavage product represented in band b (Figure 2.4) must
have resulted from cleavage at T14 and T50. Similarly, the product in band c resulted from
cleavage at G12 and C52, whereas cleavage at A9 and T56 resulted in band d. The
sequences of the double-strand cleavage products in DNA 8 and all the other members of
the library are summarized in Figure 2.6. Additionally, as shown in lane 8 of Figure 2.5,
band 2a (from Figure 2.4) co-migrated with bands corresponding to A9, G12 and T14
(Figure 2.5), suggesting that each of these positions can also be primary sites of cleavage.
22
Thus analysis of the dsDNA cleavage of DNA 8 indicates the absence of any obligatory
order of cleavage seen in previous studies.
Figure 2.5 Sequencing Gel Analysis of Fe(II)•BLM A5-Induced Double-Strand Cleavage
Sites of [3-32P]-End Labeled (lanes 1-6) and [5-32P]-End Labeled (lanes 7-12) DNA 8.
Each lane (except lanes 1 and 7) corresponds to a numbered cleavage band, shown in Fig.
2.4 Lane 1, Maxam Gilbert G+A sequencing lane of [3-32P]-end labeled DNA 8; lane 2,
band 4a; lane 3, band 4b; lane 4, band 5b; lane 5, band 4c; lane 6, band 4d; lane 7,
Maxam Gilbert G+A sequencing lane of [5-32P]-end labeled DNA 8; lane 8, band 2a;
lane 9, band 2b; lane 10, band 3b; lane 11, band 2c; lane 12, band 2d.56
23
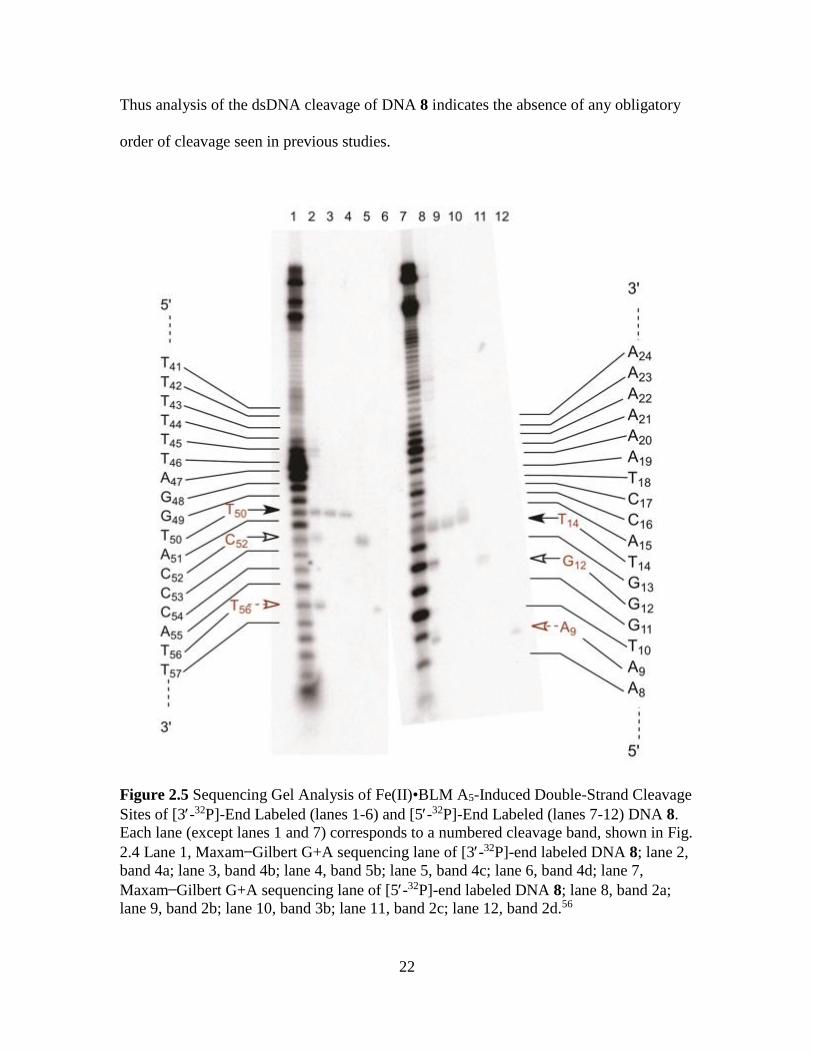
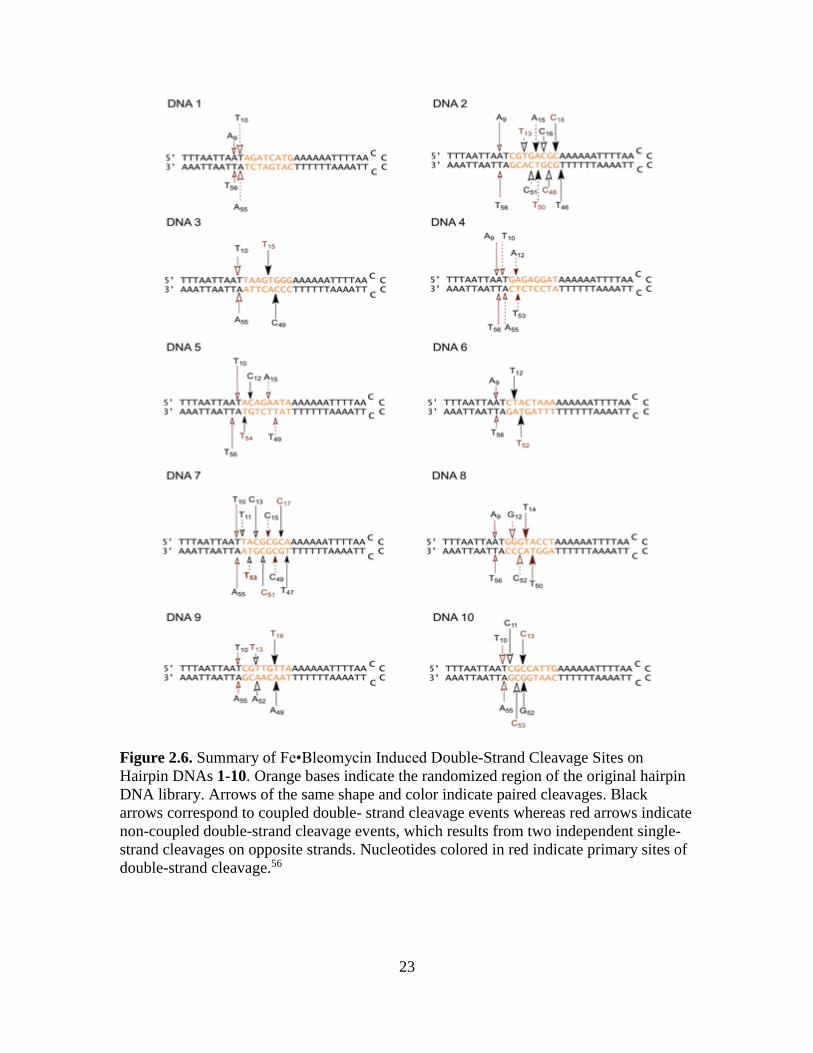
Figure 2.6. Summary of Fe•Bleomycin Induced Double-Strand Cleavage Sites on
Hairpin DNAs 1-10. Orange bases indicate the randomized region of the original hairpin
DNA library. Arrows of the same shape and color indicate paired cleavages. Black
arrows correspond to coupled double- strand cleavage events whereas red arrows indicate
non-coupled double-strand cleavage events, which results from two independent single-
strand cleavages on opposite strands. Nucleotides colored in red indicate primary sites of
double-strand cleavage.56

24
As shown in Figure 2.7, five new bands appeared when hairpin DNA 2 was
treated with Fe(II)•BLM A5. Each of the five bands in lanes 2 and 3 along with the bands
(2a and 3a) co-migrating with unreacted DNA were isolated and subjected to analysis by
denaturing polyacrylamide gel electrophoresis.
Figure 2.7. Double-Strand Cleavage of [3-32P]-End Labeled (lane 2) and [5-32P]-End
Labeled (lane 3) 64-Nucleotide Hairpin DNA 2 by Fe•BLM A5. Lane 1, [3-32P]-end
labeled DNA alone; lane 2, 5 µM Fe(II)•BLM A5; lane 3, 5 µM Fe(II)•BLM A5; lane 4,
[5-32P]-end labeled DNA alone.56
As shown in Figure 2.8, the [5′-32P]-end labeled DNA 2, when treated with
bleomycin, was cleaved at positions A9, T13, A15, C16 and C18, whereas the [3′-32P]-end
labeled bleomycin treated DNA 2 was cleaved at positions T46, C48, T50, C51 and T56. Co-
migrating bands suggests that DNA 2 involved dsDNA cleavage at T46/C18, C48/C16,
T50/A15, C51/T13 and T56/ A9. The sequences of dsDNA cleavage products are summarized
in Figure 2.6.
25
Figure 2.8. Sequencing Gel Analysis of Fe•Bleomycin Induced Double-Strand Cleavage
Sites of [3-32P]-End Labeled (lanes 1-7) and [5-32P]-End Labeled (lanes 8-14) Hairpin
DNA 2. Each lane (except lanes 1 and 8) corresponds to a numbered cleavage band,
shown in Figure 2.7. Lane 1, Maxam Gilbert G+A sequencing lane of [3-32P]-end
labeled DNA 2; lane 2, band 2f; lane 3, band 2e; lane 4, band 2d; lane 5, band 2c; lane 6,
band 2b; lane 7, band 2a; Lane 8, Maxam Gilbert G+A sequencing lane of [5-32P]-end
labeled DNA 2; lane 9, band 3f; lane 10, band 3e; lane 11, band 3d; lane 12, band 3c;
lane 13, band 3b; lane 14, band 3a.56
Additionally, analysis of 3a (Figure 2.7) by denaturing polyacrylamide gel
electrophoresis (Figure 2.8) indicated cleavage at positions C48 and T50. In comparison,
analysis of band 4a (Figure 2.7) indicated cleavage at positions T13 and C18 (Figure 2.8).
As noted in Scheme 2.1, these bands must represent sites nicked to produce intermediates
26
of type II or III (Scheme 2.1), without associated cleavage on the opposite strand, thus
indicating primary sites of cleavages. Similarly, bands 2f/3f, when compared in a
denaturing gel (Figure 2.8), showed little partially cleaved material corresponding to
products derived from bands 2a/3a suggesting that the cleavages at A9 and T56 represent
independent single strand cleavage events, resulting in adventitious dsDNA cleavage
product. In comparison, the rest of the cleavage sites (T13/C51, A15/T50, C16/C48 and
C18/C46) appeared to be coupled dsDNA cleavages with obligatory primary sites,
consistent with the mechanism described previously.57
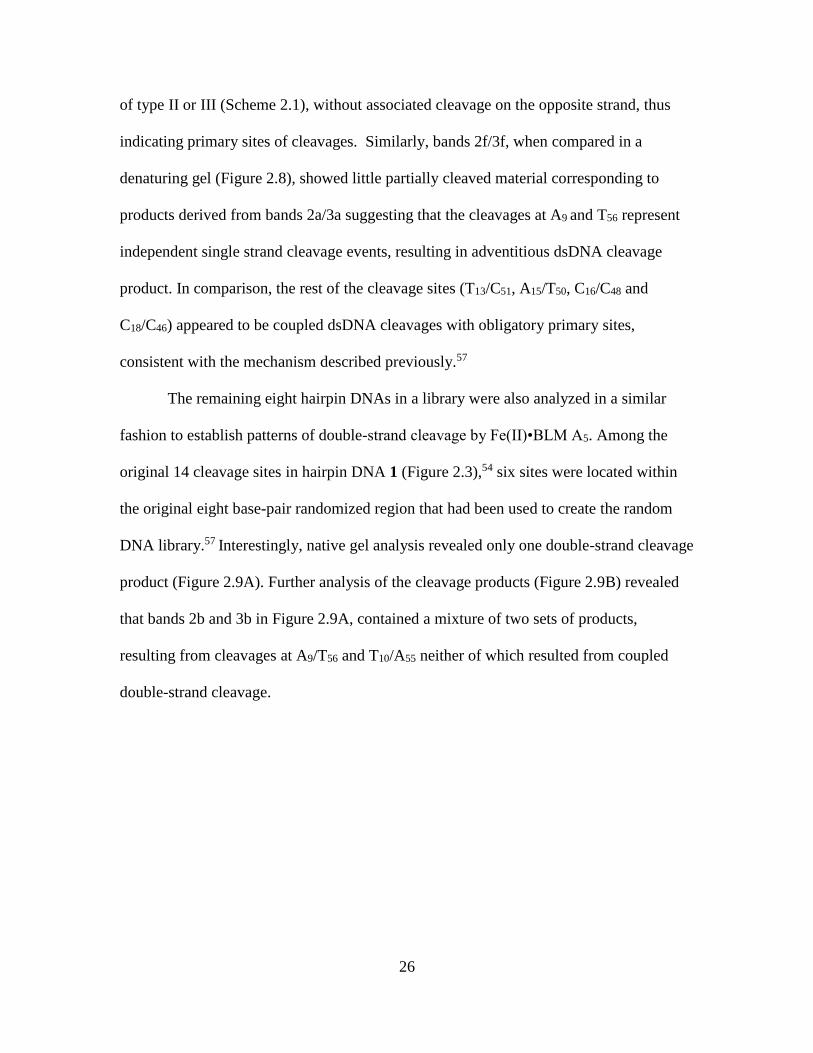
The remaining eight hairpin DNAs in a library were also analyzed in a similar
fashion to establish patterns of double-strand cleavage by Fe(II)•BLM A5. Among the
original 14 cleavage sites in hairpin DNA 1 (Figure 2.3),54 six sites were located within
the original eight base-pair randomized region that had been used to create the random
DNA library.57 Interestingly, native gel analysis revealed only one double-strand cleavage
product (Figure 2.9A). Further analysis of the cleavage products (Figure 2.9B) revealed
that bands 2b and 3b in Figure 2.9A, contained a mixture of two sets of products,
resulting from cleavages at A9/T56 and T10/A55 neither of which resulted from coupled
double-strand cleavage.
27
Figure 2.9. Analysis of Fe•Bleomycin Induced Double-Strand Cleavage Sites on Hairpin
DNA 1. (A) Double-strand cleavage of [3-32P]-end labeled (lanes 1 and 2) and [5-32P]-
end labeled (lanes 3 and 4) 64-nucleotide hairpin DNA 1 by bleomycin A5. Lane 1, [3′-32P]-end labeled DNA alone; lane 2, 5 µM Fe(II)BLM A5; lane 3, 5 µM Fe(II)BLM A5;
lane 4, [5-32P]-end labeled DNA alone. (B) Sequencing gel analysis of bleomycin
induced double-strand cleavage sites on [3-32P]-end labeled (lanes 1-3) and [5-32P]-end
labeled (lanes 4-6) DNA 1. Each lane (except lanes 3 and 4) corresponds to a numbered
cleavage band, shown in (A). Lane 1, band 2b; lane 2, band 2a; lane 3, Maxam Gilbert
G+A sequencing lane of [3-32P]-end labeled DNA 1; lane 4, Maxam Gilbert G+A
sequencing lane of [5-32P]-end labeled DNA 1; lane 5, band 3b; lane 6, band 3a.56
28
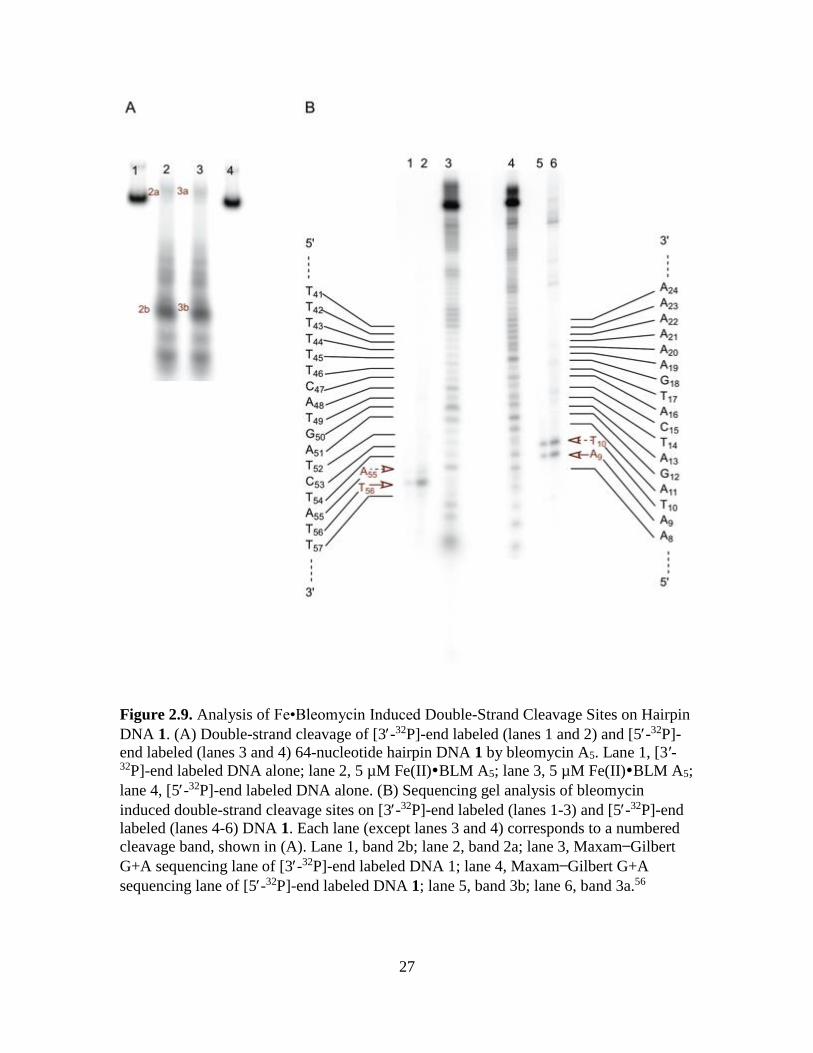
Hairpin DNA 3, shown in Figure 2.6, displayed two pairs of co-migrating bands
in the native polyacrylamide gel analysis (Figure 2.10A). Further analysis of those bands
by denaturing polyacrylamide gel electrophoresis (Figure 2.10B) indicated that they are
the products from coupled double-strand cleavage at T15/C49, having T15 as the primary
site of cleavage and non-coupled double-strand cleavage involving T10 and A55.
Figure 2.10. Analysis of Fe•Bleomycin Induced Double-Strand Cleavage Sites on
Hairpin DNA 3. (A) Double strand cleavage of [3-32P]-end labeled (lanes 1 and 2) and
[5-32P]-end labeled (lanes 3 and 4) 64-nucleotide hairpin DNA 3 by bleomycin A5. Lane
1, [3-32P]-end labeled DNA alone; lane 2, 5 µM Fe(II)BLM A5; lane 3, 5 µM
Fe(II)BLM A5; lane 4, [5-32P]-end labeled DNA alone. (B) Sequencing gel analysis of
bleomycin induced double-strand cleavage sites on [3-32P]-end labeled (lanes 1-4) and
29
[5-32P]-end labeled (lanes 5-8) DNA 3. Each lane (except lanes 1 and 5) corresponds to a
numbered cleavage band, shown in (A). Lane 1, Maxam Gilbert G+A sequencing lane of
[3-32P]-end labeled DNA 3; lane 2, band 2a; lane 3, band 2b; lane 4, band 2c; Lane 5,
Maxam Gilbert G+A sequencing lane of [5-32P]-end labeled DNA 3; lane 6, band 3a;
lane 7, band 3b; lane 8, band 3c.56
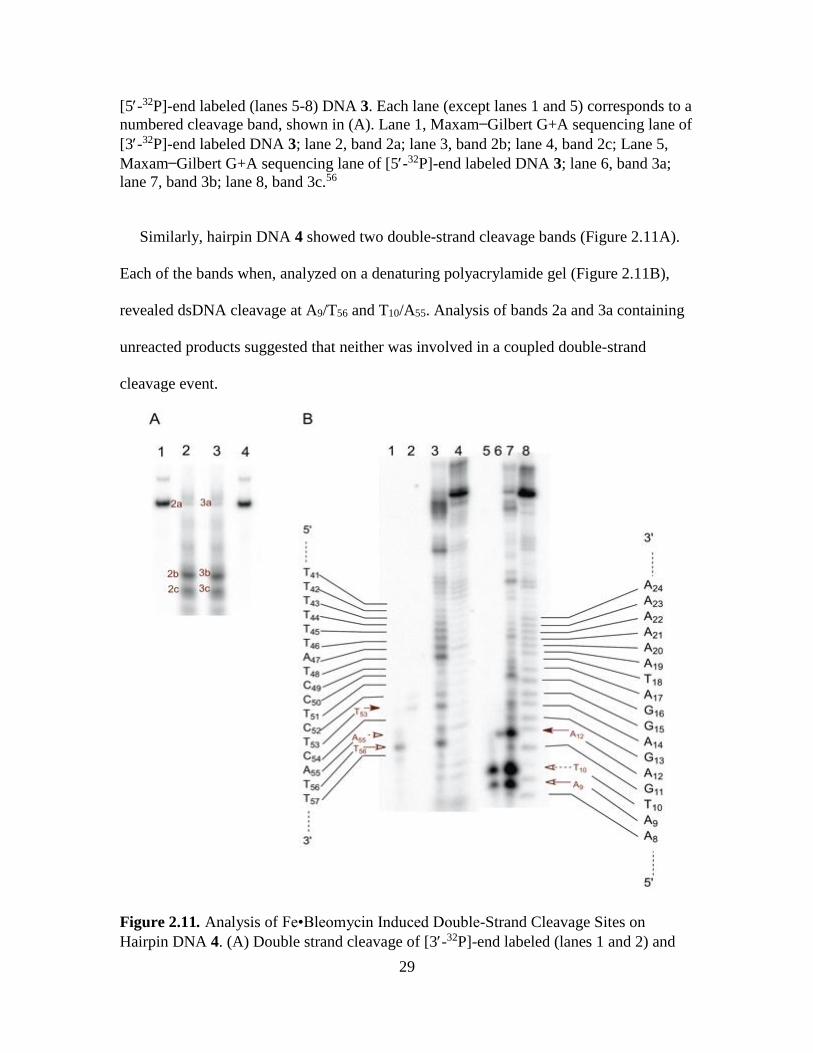
Similarly, hairpin DNA 4 showed two double-strand cleavage bands (Figure 2.11A).
Each of the bands when, analyzed on a denaturing polyacrylamide gel (Figure 2.11B),
revealed dsDNA cleavage at A9/T56 and T10/A55. Analysis of bands 2a and 3a containing
unreacted products suggested that neither was involved in a coupled double-strand
cleavage event.
Figure 2.11. Analysis of Fe•Bleomycin Induced Double-Strand Cleavage Sites on
Hairpin DNA 4. (A) Double strand cleavage of [3-32P]-end labeled (lanes 1 and 2) and
30
[5-32P]-end labeled (lanes 3 and 4) 64-nucleotide hairpin DNA 4 by bleomycin A5. Lane
1, [3-32P]-end labeled DNA alone; lane 2, 5 µM Fe(II)BLM A5; lane 3, 5 µM
Fe(II)BLM A5; lane 4, [5-32P]-end labeled DNA alone. (B) Sequencing gel analysis of
bleomycin induced double-strand cleavage sites on [3-32P]-end labeled (lanes 1-4) and
[5-32P]-end labeled (lanes 5-8) DNA 4. Each lane (except lanes 4 and 8) corresponds to a
numbered cleavage band, shown in (A). Lane 1, band 2c; lane 2, band 2b; lane 3, band
2a; lane 4, Maxam Gilbert G+A sequencing lane of [3-32P]-end labeled DNA 4; lane 5,
band 3c; lane 6, band 3b; lane 7, band 3a; lane 8, Maxam Gilbert G+A sequencing lane
of [5-32P]-end labeled DNA 4.56
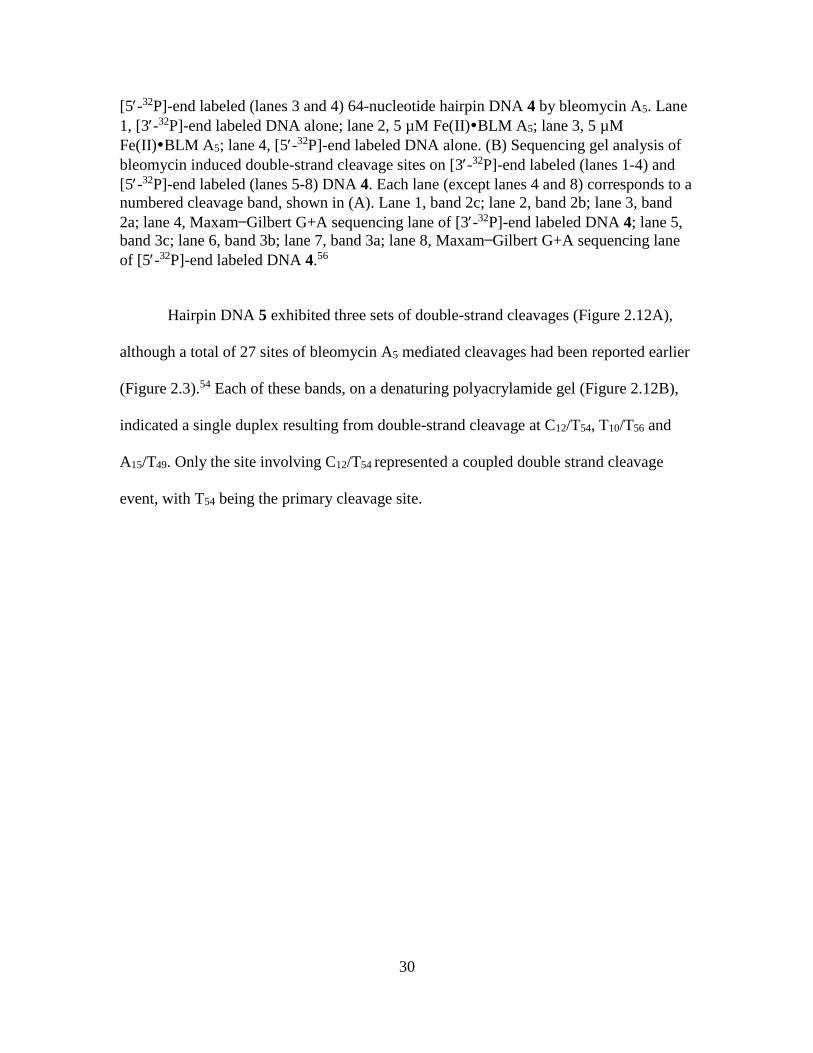
Hairpin DNA 5 exhibited three sets of double-strand cleavages (Figure 2.12A),
although a total of 27 sites of bleomycin A5 mediated cleavages had been reported earlier
(Figure 2.3).54 Each of these bands, on a denaturing polyacrylamide gel (Figure 2.12B),
indicated a single duplex resulting from double-strand cleavage at C12/T54, T10/T56 and
A15/T49. Only the site involving C12/T54 represented a coupled double strand cleavage
event, with T54 being the primary cleavage site.
31
Figure 2.12. Analysis of Fe•Bleomycin Induced Double-Strand Cleavage Sites on
Hairpin DNA 5. (A) Double strand cleavage of [3′-32P]-end labeled (lanes 1 and 2) and
[5′-32P]-end labeled (lanes 3 and 4) 64-nucleotide hairpin DNA 5 by bleomycin A5. Lane
1, [3′-32P]-end labeled DNA alone; lane 2, 5 µM Fe(II)BLM A5; lane 3, 5 µM
Fe(II)BLM A5; lane 4, [5′-32P]-end labeled DNA alone. (B) Sequencing gel analysis of
bleomycin induced double-strand cleavage sites on [3′-32P]-end labeled (lanes 1-5) and
[5′-32P]-end labeled (lanes 6-10) DNA 5. Each lane (except lanes 5 and 10) corresponds
to a numbered cleavage band, shown in (A). Lane 1, band 2d; lane 2, band 2c; lane 3,
band 2b; lane 4, band 2a; lane 5, Maxam Gilbert G+A sequencing lane of [3′-32P]-end
labeled DNA 5; lane 6, band 3d; lane 7, band 3c; lane 8, band 3b; lane 9, band 3a; Lane
10, Maxam Gilbert G+A sequencing lane of [5′-32P]-end labeled DNA 5.56
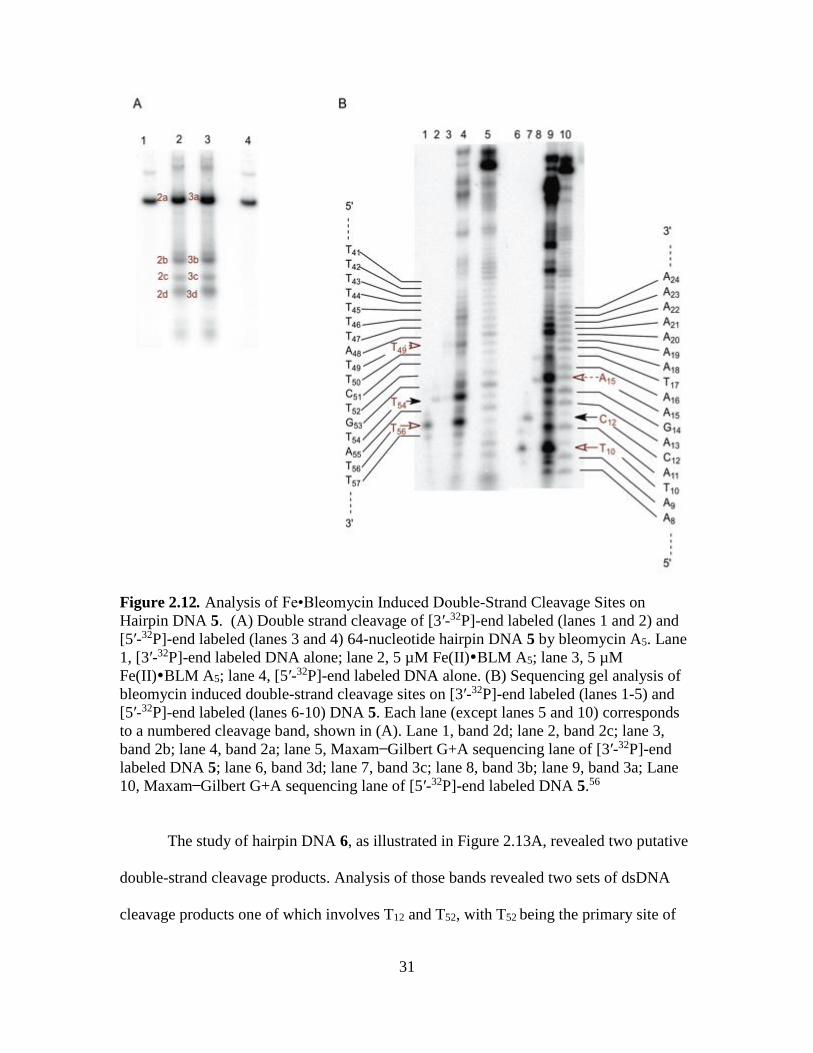
The study of hairpin DNA 6, as illustrated in Figure 2.13A, revealed two putative
double-strand cleavage products. Analysis of those bands revealed two sets of dsDNA
cleavage products one of which involves T12 and T52, with T52 being the primary site of
32
cleavage. The second dsDNA cleavage product at A9 and T56, resulted from non-coupleed
dsDNA cleavage with no obligatory primary site of cleavage.
Figure 2.13. Analysis of Fe•Bleomycin Induced Double-Strand Cleavage Sites on
Hairpin DNA 6. (A) Double strand cleavage of [3′-32P]-end labeled (lanes 1 and 2) and
[5′-32P]-end labeled (lanes 3 and 4) 64-nucleotide hairpin DNA 6 by bleomycin A5. Lane
1, [3′-32P]-end labeled DNA alone; lane 2, 5 µM Fe(II)BLM A5; lane 3, 5 µM
Fe(II)BLM A5; lane 4, [5′-32P]-end labeled DNA alone. (B) Sequencing gel analysis of
bleomycin induced double-strand cleavage sites on [3′-32P]-end labeled (lanes 1-4) and
[5′-32P]-end labeled (lanes 5-8) DNA 6. Each lane (except lanes 1 and 5) corresponds to a
numbered cleavage band, shown in (A). Lane 1, Maxam Gilbert G+A sequencing lane of
[3′-32P]-end labeled DNA 6; lane 2, band 2a; lane 3, band 2b; lane 4, band 2c; lane 5,
Maxam Gilbert G+A sequencing lane of [5′-32P]-end labeled DNA 6; lane 6, band 3a;
lane 7, band 3b; lane 8, band 3c.56
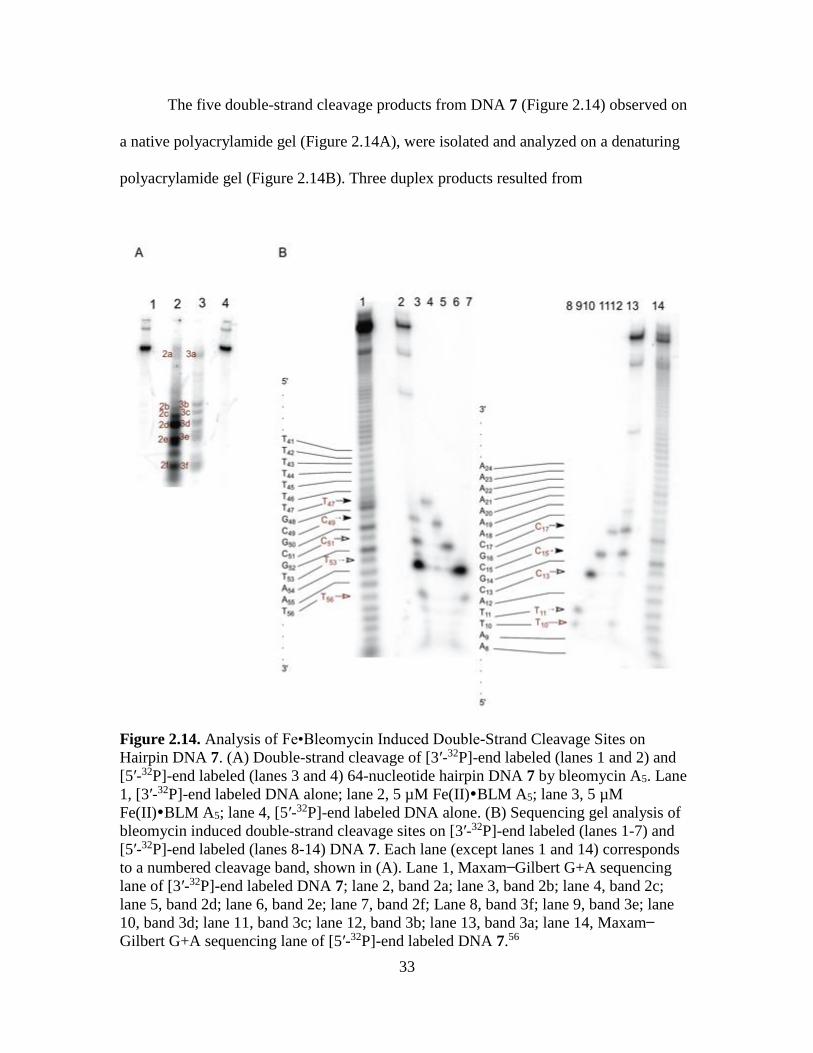
33
The five double-strand cleavage products from DNA 7 (Figure 2.14) observed on
a native polyacrylamide gel (Figure 2.14A), were isolated and analyzed on a denaturing
polyacrylamide gel (Figure 2.14B). Three duplex products resulted from
Figure 2.14. Analysis of Fe•Bleomycin Induced Double-Strand Cleavage Sites on
Hairpin DNA 7. (A) Double-strand cleavage of [3′-32P]-end labeled (lanes 1 and 2) and
[5′-32P]-end labeled (lanes 3 and 4) 64-nucleotide hairpin DNA 7 by bleomycin A5. Lane
1, [3′-32P]-end labeled DNA alone; lane 2, 5 µM Fe(II)BLM A5; lane 3, 5 µM
Fe(II)BLM A5; lane 4, [5′-32P]-end labeled DNA alone. (B) Sequencing gel analysis of
bleomycin induced double-strand cleavage sites on [3′-32P]-end labeled (lanes 1-7) and
[5′-32P]-end labeled (lanes 8-14) DNA 7. Each lane (except lanes 1 and 14) corresponds
to a numbered cleavage band, shown in (A). Lane 1, Maxam Gilbert G+A sequencing
lane of [3′-32P]-end labeled DNA 7; lane 2, band 2a; lane 3, band 2b; lane 4, band 2c;
lane 5, band 2d; lane 6, band 2e; lane 7, band 2f; Lane 8, band 3f; lane 9, band 3e; lane
10, band 3d; lane 11, band 3c; lane 12, band 3b; lane 13, band 3a; lane 14, Maxam
Gilbert G+A sequencing lane of [5′-32P]-end labeled DNA 7.56
34
coupled double-strand cleavage events. These included sites involving T11/T53, C13/C51
and C17/T47. In these, T53, C51 and C17 were the primary sites of cleavages. The other
double-strand cleavage products involving cleavage at T10/A55 and C15/C49 represented
non-coupled dsDNA cleavage events.
When DNA 9 (Figure 2.15) was analyzed for dsDNA cleavage as shown in Figure
2.15A, three double-strand cleavage products were observed. The denaturing
polyacrylamide gel (Figure 2.15B) of those bands indicated that the sites involved
cleavage at T10/A55, T13/A52 and T16/A49. Analysis of the mixed products 2a and 3a
(Figure 2.15A) revealed four primary sites of cleavages at T10, T13, T16 and A55 (Figure
2.15B), suggesting that cleavage at T13/A52 and T16/A49 represent coupled dsDNA
cleavage events whereas that at T10/A55 indicates a non-coupled event.
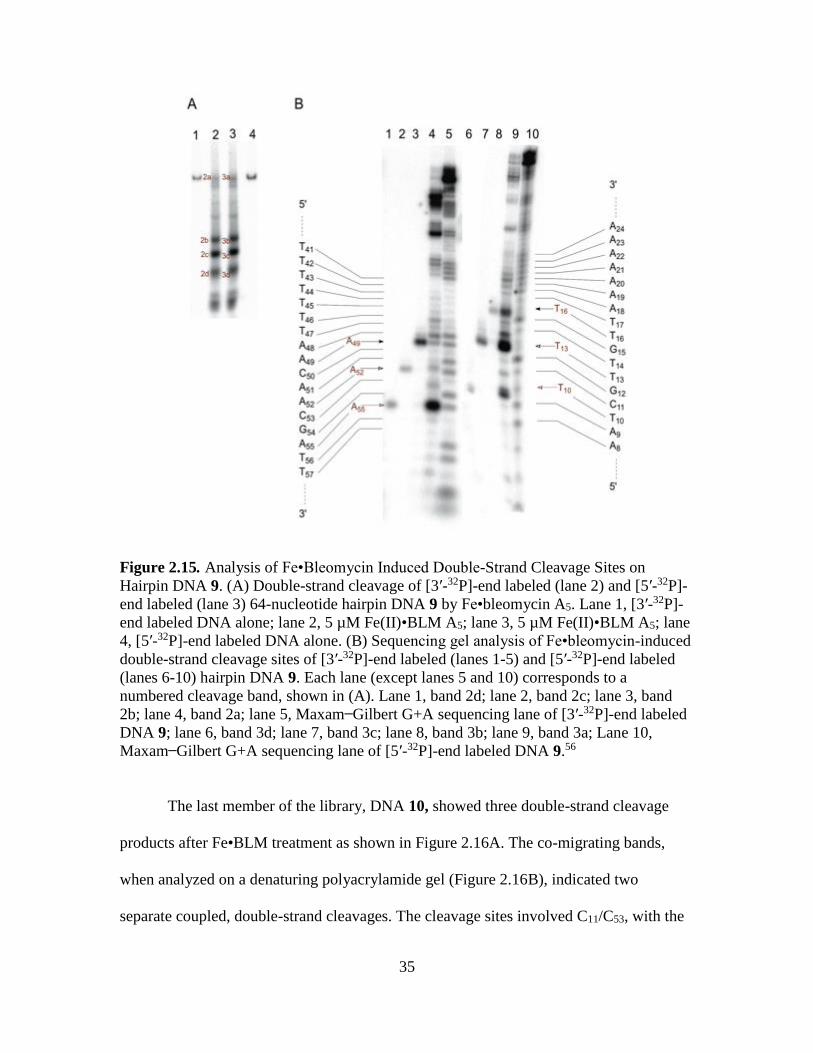
35
Figure 2.15. Analysis of Fe•Bleomycin Induced Double-Strand Cleavage Sites on
Hairpin DNA 9. (A) Double-strand cleavage of [3′-32P]-end labeled (lane 2) and [5′-32P]-
end labeled (lane 3) 64-nucleotide hairpin DNA 9 by Fe•bleomycin A5. Lane 1, [3′-32P]-
end labeled DNA alone; lane 2, 5 µM Fe(II)•BLM A5; lane 3, 5 µM Fe(II)•BLM A5; lane
4, [5′-32P]-end labeled DNA alone. (B) Sequencing gel analysis of Fe•bleomycin-induced
double-strand cleavage sites of [3′-32P]-end labeled (lanes 1-5) and [5′-32P]-end labeled
(lanes 6-10) hairpin DNA 9. Each lane (except lanes 5 and 10) corresponds to a
numbered cleavage band, shown in (A). Lane 1, band 2d; lane 2, band 2c; lane 3, band
2b; lane 4, band 2a; lane 5, Maxam Gilbert G+A sequencing lane of [3′-32P]-end labeled
DNA 9; lane 6, band 3d; lane 7, band 3c; lane 8, band 3b; lane 9, band 3a; Lane 10,
Maxam Gilbert G+A sequencing lane of [5′-32P]-end labeled DNA 9.56
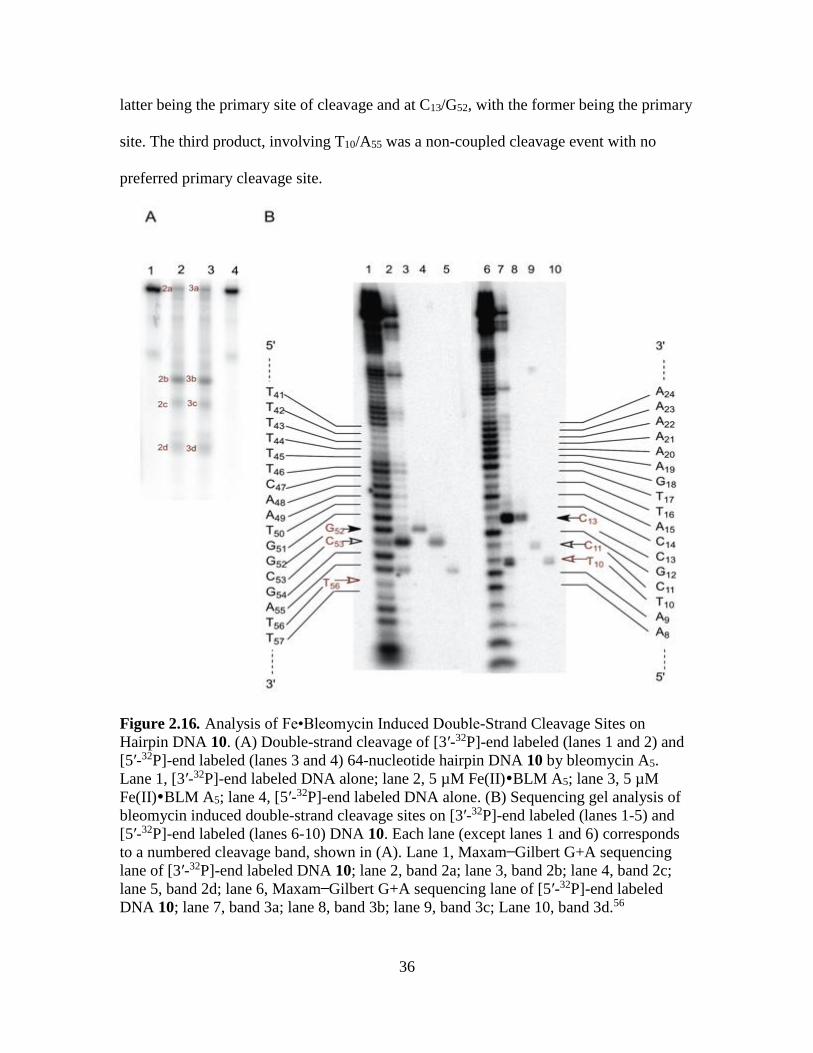
The last member of the library, DNA 10, showed three double-strand cleavage
products after Fe•BLM treatment as shown in Figure 2.16A. The co-migrating bands,
when analyzed on a denaturing polyacrylamide gel (Figure 2.16B), indicated two
separate coupled, double-strand cleavages. The cleavage sites involved C11/C53, with the
36
latter being the primary site of cleavage and at C13/G52, with the former being the primary
site. The third product, involving T10/A55 was a non-coupled cleavage event with no
preferred primary cleavage site.
Figure 2.16. Analysis of Fe•Bleomycin Induced Double-Strand Cleavage Sites on
Hairpin DNA 10. (A) Double-strand cleavage of [3′-32P]-end labeled (lanes 1 and 2) and
[5′-32P]-end labeled (lanes 3 and 4) 64-nucleotide hairpin DNA 10 by bleomycin A5.
Lane 1, [3′-32P]-end labeled DNA alone; lane 2, 5 µM Fe(II)BLM A5; lane 3, 5 µM
Fe(II)BLM A5; lane 4, [5′-32P]-end labeled DNA alone. (B) Sequencing gel analysis of
bleomycin induced double-strand cleavage sites on [3′-32P]-end labeled (lanes 1-5) and
[5′-32P]-end labeled (lanes 6-10) DNA 10. Each lane (except lanes 1 and 6) corresponds
to a numbered cleavage band, shown in (A). Lane 1, Maxam Gilbert G+A sequencing
lane of [3′-32P]-end labeled DNA 10; lane 2, band 2a; lane 3, band 2b; lane 4, band 2c;
lane 5, band 2d; lane 6, Maxam Gilbert G+A sequencing lane of [5′-32P]-end labeled
DNA 10; lane 7, band 3a; lane 8, band 3b; lane 9, band 3c; Lane 10, band 3d.56

37
2.3. Discussion
Although bleomycin has been used as an antitumor agent for decades, the
mechanism by which it exerts its therapeutic effect has never been fully established.
Additionally, the very small clinical dose also suggests the presence of multiple highly
specific mechanisms to achieve tumor cell killing. The recent use of a hairpin DNA
library, selected for tight binding to the drug, in bleomycin cleavage studies has
confirmed our early findings that model hairpin DNAs having a single strong bleomycin
binding site can be cleaved in multiple places.58 Additionally, we found that those
cleavages include numerous double-strand cleavages, which may suggest a mechanism
for tumor cell killing.
Bleomycin induced double-strand cleavage of DNA was first studied extensively
by the Povirk laboratory.51,59-61 In their study, three linear DNA duplexes containing 250
base pairs were analyzed for dsDNA cleavages, which showed 26 double-strand DNA
cleavage sites. The sites of double-strand cleavage, resulting from treatment with
Fe(II)•BLM A2, were analyzed by separation of the DNA fragments on a native
polyacrylamide gel. An analysis of each of the bands following 5 or 3-32P-end labeling
was carried out using a sequencing gel. With one exception, all of the double-strand
breaks showed a G-Py sequence on one strand and a much greater diversity of cleavage
products on the other strand. Interestingly, eleven of the dsDNA cleavages produced
blunt-end products, whereas twelve of them resulted in products with one nucleotide 5′-
extensions.51
As they had maintained the condition of single hit kinetics throughout their
studies, Povirk et al.51 concluded that each dsDNA cleavage observed in their analysis
38
must have resulted from the action of a single bleomycin molecule. The appearance of a
G-Py sequence virtually in all of the dsDNA cleavages suggested that this must be the
primary site of cleavage. The occasional formation of alkali labile lesions was also
observed by the researchers at the secondary sites. In a different study by Keller and
Oppenheimer, an enhanced cleavage opposite to an initial bleomycin-induced nick had
also been reported. 62 Absalon et al.63,64 explained the nature of dsDNA cleavages in a
more detailed way in a subsequent study, utilizing hairpin DNA oligonucleotides.
Employing the technique of labeling their hairpin DNAs internally at a 32P-labeled
phosphate, they were able to determine the ratio of single-strand and double-strand
cleavage at each individual site. Replacing the C-4 H atom, susceptible to abstraction by
Fe•BLM by deuterium in putative bleomycin cleavage site, they concluded that
bleomycin induced dsDNA cleavage results from a single bleomycin molecule and
requires reactivation of bleomycin after the first cleavage event (Figure 2.17).
In a previous study we reported a hairpin DNA with one bleomycin cleavage site
that undergoes highly efficient cleavage at that site.52 The method involved alternatively
labeling the hairpin DNAs at 5- and 3-ends with a radiolabeled 32P-ATP. For coupled
dsDNA cleavage events (Figure 2.17) the ratio of cleavage products observed for the two
labeled hairpin DNAs varied dramatically, which enabled quantification of frank-strand
scission and alkali labile lesion.
In our present study, the alternatively labeled 5 and 3-end cleavage products also
produced bands of different intensities on the native gel, suggesting that some of those
cleavages involve dsDNA cleavages. However, presence of a large number of dsDNA
cleavage bands in the hairpin DNAs prompted us to employ a modified technique similar

39
to one described by Povirk et al.51 In addition to studying the bands containing dsDNA
cleavage products, we also analyzed the bands at the top of each cleavage lanes on a non-
denaturing polyacrylamide gel. As described in Scheme 2.1, these bands contained a
mixture of products with unreacted hairpin DNA. Among all the different types of
products in the mixture, product III (Scheme 2.1) had a frank strand scission on a primary
site of bleomycin cleavage and an alkali labile lesion on the other strand, affording a
hairpin DNA nicked at the primary site. As suggested by Povirk et al.,51 product III
resulted from reactivation of a bleomycin molecule after the frank strand scission at the
primary site, leading to an alkali labile lesion on the second strand instead of a second
strand break. Product III also carries the information of a primary bleomycin induced
dsDNA cleavage site when analyzed on a denaturing polyacrylamide gel. As illustrated in
Figure 2.3, treatments of bands 2a and 3a with n-butylamine resulted in additional
dsDNA cleavage products in lanes 3 and 5, which suggested the presence of product III.
Additionally, coupled double-strand bleomycin cleavage events were identified
by analyzing the top bands from each native gel. As shown in Figure 2.15, the DNA
cleavage product III gave a band at the primary cleavage site on a denaturing
polyacrylamide gel, which came from the singly nicked DNA. The strand containing the
alkali labile lesion failed to produce a similar band on a denaturing gel, confirming that it
was a secondary site of cleavage. These phenomena were further illustrated in Figure
2.15B. 3-32P-end labeled DNAs recovered from bands 2d, 2c and 2b (Figure 2.15A),
respectively, revealed the sites of bleomycin induced dsDNA cleavage at the 3 labeled
side of the hairpin DNAs at A55, A52 and A49, respectively (lanes 1, 2 and 3 in Figure
40
2.15B). Lane 4 of Figure 2.15 B, containing band 2a from Figure 2.15A, showed a strong
cleavage at A55, but weak cleavages at A52 and A49. Similarly, lanes 6, 7 and 8 of
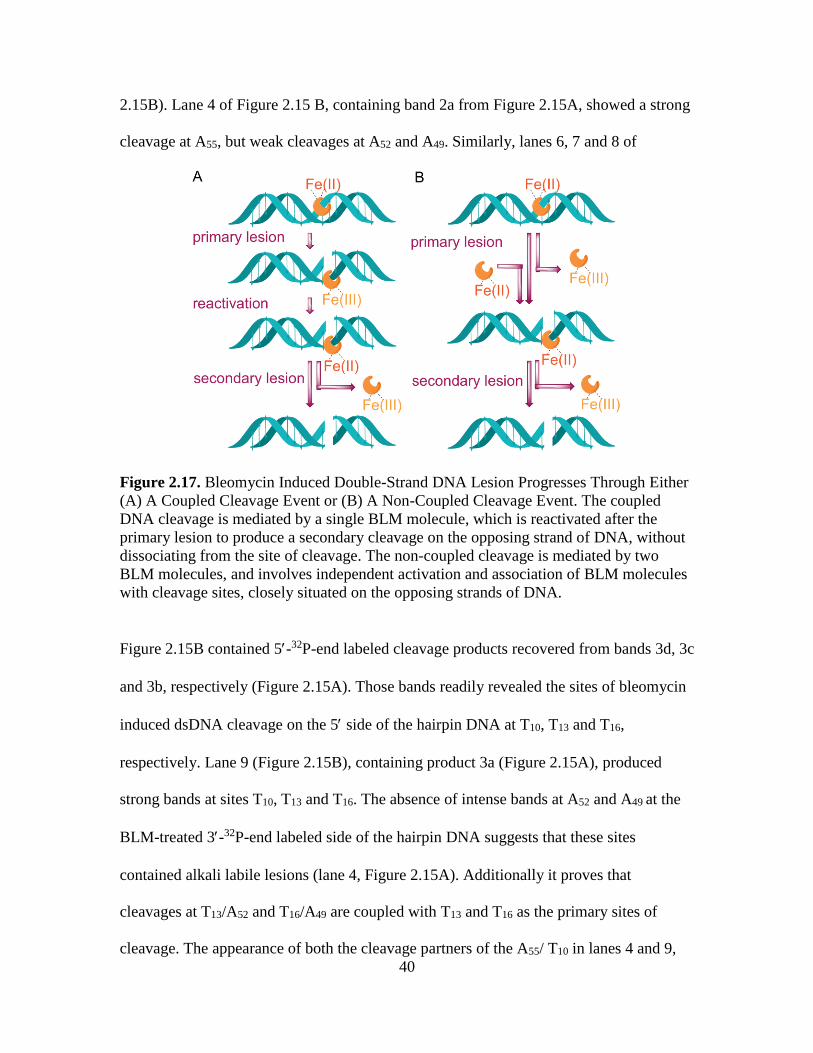
Figure 2.17. Bleomycin Induced Double-Strand DNA Lesion Progresses Through Either
(A) A Coupled Cleavage Event or (B) A Non-Coupled Cleavage Event. The coupled
DNA cleavage is mediated by a single BLM molecule, which is reactivated after the
primary lesion to produce a secondary cleavage on the opposing strand of DNA, without
dissociating from the site of cleavage. The non-coupled cleavage is mediated by two
BLM molecules, and involves independent activation and association of BLM molecules
with cleavage sites, closely situated on the opposing strands of DNA.
Figure 2.15B contained 5-32P-end labeled cleavage products recovered from bands 3d, 3c
and 3b, respectively (Figure 2.15A). Those bands readily revealed the sites of bleomycin
induced dsDNA cleavage on the 5 side of the hairpin DNA at T10, T13 and T16,
respectively. Lane 9 (Figure 2.15B), containing product 3a (Figure 2.15A), produced
strong bands at sites T10, T13 and T16. The absence of intense bands at A52 and A49 at the
BLM-treated 3-32P-end labeled side of the hairpin DNA suggests that these sites
contained alkali labile lesions (lane 4, Figure 2.15A). Additionally it proves that
cleavages at T13/A52 and T16/A49 are coupled with T13 and T16 as the primary sites of
cleavage. The appearance of both the cleavage partners of the A55/ T10 in lanes 4 and 9,
41
respectively suggests that either of these sites can act as a primary site of cleavage in a
dsDNA cleavage event or they result from two independent single strand cleavages
induced by two separate bleomycin molecules, resulting in an adventitious dsDNA
cleavage. Although the reactions were not carried out under single-hit kinetic condition to
assure whether the cleavages at T10/A55 involved a single bleomycin molecule, the earlier
observations made by Povirk suggest that the cleavage at T10/A55 represented two
independent events.
In the study of dsDNA cleavage done by Povirk et al.,51 all but one of the dsDNA
cleavage sites involved a G-Py sequence as one of the cleavage sites and the opposing
strand mostly involved a non-conventional site, not usually seen as a single-strand
cleavage site. In our present study all 14 confirmed coupled double-strand cleavage
events involved a G-Py sequence as a primary site. In the previous study, seven of the
cleavages had a G-Py-Py-Pu sequence as the primary site with the initial cleavage at the
first Py residue following the guanosine. The subsequent cleavage on the opposing strand
produced blunt ended products. Six of the other cleavages involved G-Py-Py-Pu
sequences and the cleavage at the first Py resulted in either blunt-end products or
products with a single-base 5 overhang on the opposing strand. In our study, four of the
cleavage products involved G-Py-Py-Pu sequences and none had G-Py-Py-Py sequences
(Table 2.2). In the earlier study, six of the dsDNA cleavages were also found at G-Py-Pu-
Py sequences, whereas three at G-Py-Pu-Pu sequences. In all of those cleavages, the
strand scission resulted in products with one-base 5 overhangs. In the current study, three
of the double-strand events involved G-Py-Pu-Py sequences and, more interestingly,
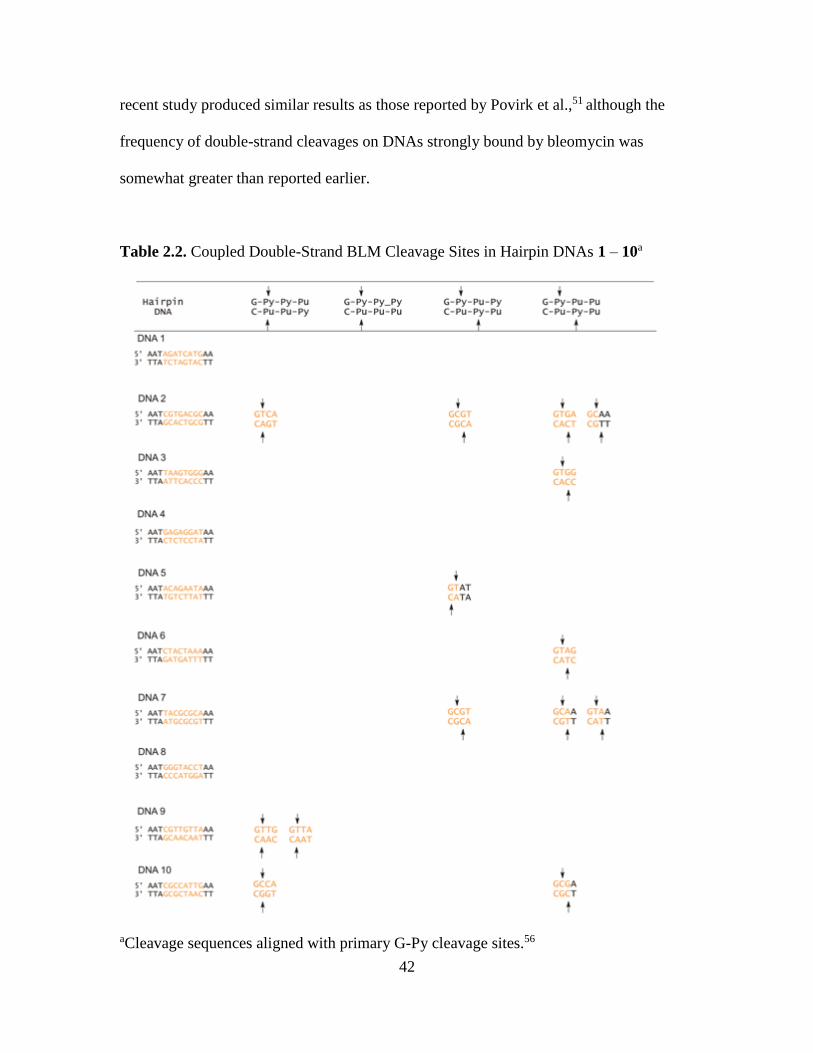
seven of the 14 cleavages involved G-Py-Pu-Pu sequences (Table 2.2). Overall, our
42
recent study produced similar results as those reported by Povirk et al.,51 although the
frequency of double-strand cleavages on DNAs strongly bound by bleomycin was
somewhat greater than reported earlier.
Table 2.2. Coupled Double-Strand BLM Cleavage Sites in Hairpin DNAs 1 – 10a
aCleavage sequences aligned with primary G-Py cleavage sites.56
43
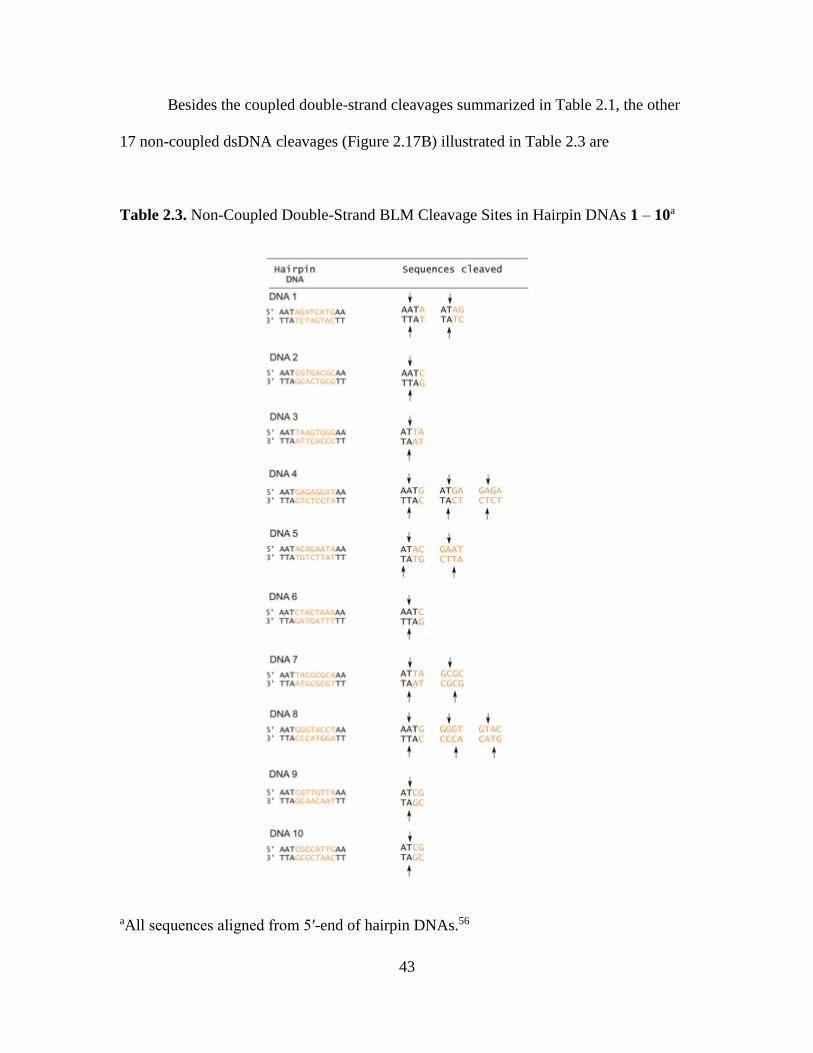
Besides the coupled double-strand cleavages summarized in Table 2.1, the other
17 non-coupled dsDNA cleavages (Figure 2.17B) illustrated in Table 2.3 are
Table 2.3. Non-Coupled Double-Strand BLM Cleavage Sites in Hairpin DNAs 1 – 10a
aAll sequences aligned from 5′-end of hairpin DNAs.56
44
unprecedented. None of these cleavages was of a type previously observed by Povirk et
al.51 in their early studies. Interestingly, no sequence preferences have been observed in
this particular kind of cleavage other than an appearance at AT-rich sequences. Most of
these cleavages occurred at the non-randomized region of the hairpin DNAs, and were
concluded to be a result of experimental design. However, a few of those cleavages
occurred in the randomized regions of the hairpin DNAs, such as GAGA in DNA 4, a
GAAT in DNA 5 and a GCGC in DNA 7. The only exception was DNA 8, which had
two of those sites in the eight base pair long variable region, identified as GTAC and
GGGT.
In a recent report, we have used three of those DNAs in a study involving surface
plasmon resonance to elucidate bleomycin binding sites on those DNAs.58 DNAs 2, 4 and
5 in that study revealed one strong bleomycin binding site on each of those DNAs and a
few weak binding sites. In our current study, each of those DNAs was observed to
undergo multiple cleavages in close proximity, including single and double strand
cleavage. The competition experiment involving DNA 2 and a 16-nucleotide hairpin
DNA with a single bleomycin cleavage site indicated that even though bleomycin
dissociates from the cleavage site on DNA 2, detectable by surface plasmon resonance
spectroscopy (SPR), it did not cleave the 16-nucleotide hairpin DNA when both were
present at the same concentration.
The model derived from these observations suggests that the hairpin DNAs are
closely associated with Fe•BLM, even when not bound to them as judged by SPR. This
strong association of bleomycin with the hairpin DNAs apparently provides enough
opportunity for multiple cleavages in close proximity to the site of interaction. In our
45
study, both DNA 2 and 7, being the tightest binders57 of bleomycin A5 underwent five
pairs of dsDNA cleavages whereas the DNAs 1, 3 and 6, being weak binders,57 produced
two dsDNA cleavages. Chromosomal DNAs may have regions, which bind to Fe•BLM
more tightly than any DNA used in our study. Assuming that the pattern of bleomycin-
induced dsDNA cleavage seen in the present study is more general, those regions in the
chromosome may undergo extensive dsDNA cleavage, leading to deletions in gene
structure. These deletions being difficult to repair may potentially be the cause of cell
death, which would explain the potency of Fe•bleomycin in tumor cell killing.
2.4. Experimental
2.4.1. Materials.
T4 polynucleotide kinase was purchased from New England Biolabs.
Recombinant terminal deoxynucleotidyl transferase was obtained from Roche. [γ-32P]-
ATP and [α-32P]-cordycepin were purchased from Perkin Elmer. Fe(NH4)2(SO4)2•6H2O
and Chelex 100 were from Sigma Aldrich. The hairpin DNAs were obtained from
Integrated DNA Technologies, Inc.
2.4.2. End Labeling and Purification of Hairpin DNAs.
The hairpin DNAs were end labeled using [γ-32P]ATP + T4 polynucleotide kinase
and [α-32P]-cordycepin + terminal deoxytransferase at the 5ʹ and 3ʹ -ends, respectively.
Ten pmol of 64-nucleotide hairpin DNAs were [5ʹ-32P]-end labeled by incubation with 20
units of T4 polynucleotide kinase and 0.06 mCi [γ-32P]ATP (specific activity 6000 Ci
(222 TBq)/mmol) in 50 μL (total volume) of 70 mM Tris-HCl buffer, pH 7.6, containing
46
10 mM MgCl2 and 5 mM DTT. The reaction mixture was incubated at 37 °C for 1 h
followed by DNA purification by 16% polyacrylamide gel electrophoresis at 1800 V for
2.5 h. The [3ʹ-32P]-end labeling was done by incubating 10 pmol of hairpin DNA with 20
units of terminal deoxynucleotidyl transferase and 0.06 mCi [α-32P]-cordycepin (specific
activity 6000 Ci (222 TBq)/mmol) in 50 μL (total volume) of 70 mM Tris-HCl buffer, pH
7.6, containing 10 mM MgCl2, 10 mM CoCl2 and 5 mM DTT. The reaction mixture was
incubated at 37 °C for 1 h followed by purification of DNA by 16% polyacrylamide gel
electrophoresis at 1800 V for 2.5 h.
2.4.3. Double-Strand DNA Cleavage of Hairpin DNAs.
Bleomycin cleavage of [5ʹ-32P]- and [3′-32P]-end labeled hairpin DNAs was
performed by incubating the hairpin DNAs (~30000 cpm) with 5 μM Fe2+ and 5 μM
bleomycin A5 at 25 oC for 30 min in a solution containing 10 μL of 2 mM MgCl2 and 10
mM Na cacodylate, pH 7.0. Two μL of native gel loading buffer containing 0.25%
bromophenol blue, 0.25% xylene cyanol and 40% D-sucrose were added to the reaction
mixture, which was separated on a 20% native polyacrylamide gel (200 V, 16 h, 4 °C ).
Double-strand cleavage sites were identified by visualizing gels using a phosphorimager.
2.4.4. n-Butylamine Treatment of Hairpin DNA 8.
Bleomycin cleavage reactions of [5′-32P]-end and [3′-32P]-end labeled DNA 8
were further treated with 2 mM n-butylamine and incubated at 25 oC for 10 min. The
supernatants were removed under diminished pressure and, DNA pellets were washed
with 10 μL of deionized water. The final solutions were mixed with 2 μL of native gel
47
loading buffer containing 0.25% bromophenol blue, 0.25% xylene cyanol and 40% D-
sucrose and separated on 20% native polyacrylamide gels (200 V, 16 h, 4 °C).
2.4.5. Maxam-Gilbert Sequencing Reaction.65
Ten µL of [5′-32P]- and [3′-32P]-end labeled DNAs (~50000 cpm) were treated
with 25 µL of formic acid and incubated at 25 °C for 4-5 min. The reactions were
stopped by treatment with 200 µL of 0.3 M NaOAc, pH 7.0, 0.1 mM EDTA, and 25
µg/mL tRNA. The resulting solutions were mixed with 700 μL of ethanol and the DNAs
were precipitated. The DNA pellets were washed twice with 70% ethanol, and the pellets
were resuspended in 75 µL of 10% piperidine. The reaction mixtures were incubated at
90 °C for 30 min, and the cooled supernatants were concentrated under diminished
pressure. The DNA pellets were washed with small amounts of water to remove residual
piperidine and mixed with denaturing loading buffer containing 80% formamide, 2 mM
EDTA, 1% bromophenol blue and 1% xylene cyanol. The combined solutions were
heated at 90 oC for 10 min and used as the sequencing lanes to compare [5′-32P]-end and
[3′-32P]-end labeled DNAs on denaturing polyacrylamide gels.
2.4.6. Denaturing Gel Electrophoresis of DNA Cleavage Products.
The [5′-32P]-end and [3′-32P]-end labeled double-strand DNA cleavage bands
visualized by native gel electrophoresis were excised from the gels and purified by
ethanol precipitation and then mixed with 5 μL of denaturing gel loading buffer
containing 80% formamide, 2 mM EDTA, 1% bromophenol blue and 1% xylene cyanol.
Following heating at 90 oC for 10 min, five-µL aliquots of the final solutions were chilled

48
on ice and separated on a 16% denaturing polyacrylamide gels containing 16% urea,
along with 2 μL of [5′-32P]- and [3′-32P]-end labeled Maxam-Gilbert sequencing lanes to
determine the sequences of the cleavage sites. The gels were visualized using a
phosphorimager.
49
CHAPTER 3
EFFECT OF ABERRANT CYTIDINE METHYLATION ON BLEOMYCIN
INTERACTION WITH DNA
3.1. Introduction
Cytidine methylation is a key factor in epigenetic gene regulation as well as
cancer biogenesis. Characterized by its dynamic nature,66 the methylation pattern changes
in cancer cells and is marked by global hypo-methylation,67,68 although localized CpG-
cytidine hypermethylation has been reported in some cancers.69-74 Genomic cytidine
hypomethylation, as related to cancer, holds the promise of additional information about
the nature of interactions between DNA and DNA-binding therapeutic antitumor agents
such as bleomycin. The role of bleomycin as a therapeutic agent, related to the treatment
of cancer, has been discussed in Chapter 1.75-77 As illustrated in Chapter 2, the anti-tumor
activity of bleomycin has been attributed to the sequence selective cleavage of DNAs and
RNAs mediated by activated Fe•BLM.17,18,78 Although highly efficient for single strand
cleavages, the cytotoxicity of bleomycin is largely derived from a more potent form of
sequence specific double-strand DNA (dsDNA) cleavage.
Recent studies involving the use of hairpin DNAs strongly bound by bleomycin
A5 revealed that 10-20 percent of all bleomycin induced DNA cleavages can lead to
double-strand cleavages, with an appearance at G-pyrimidine (GC or GT) sites in almost
every reported case.54,56 As demonstrated in the literature, the reduction of bleomycin
induced strand scission upon methylation of the substrate DNA provided a good starting
point to understand the basis of the potency of bleomycin as a tumor cell killing
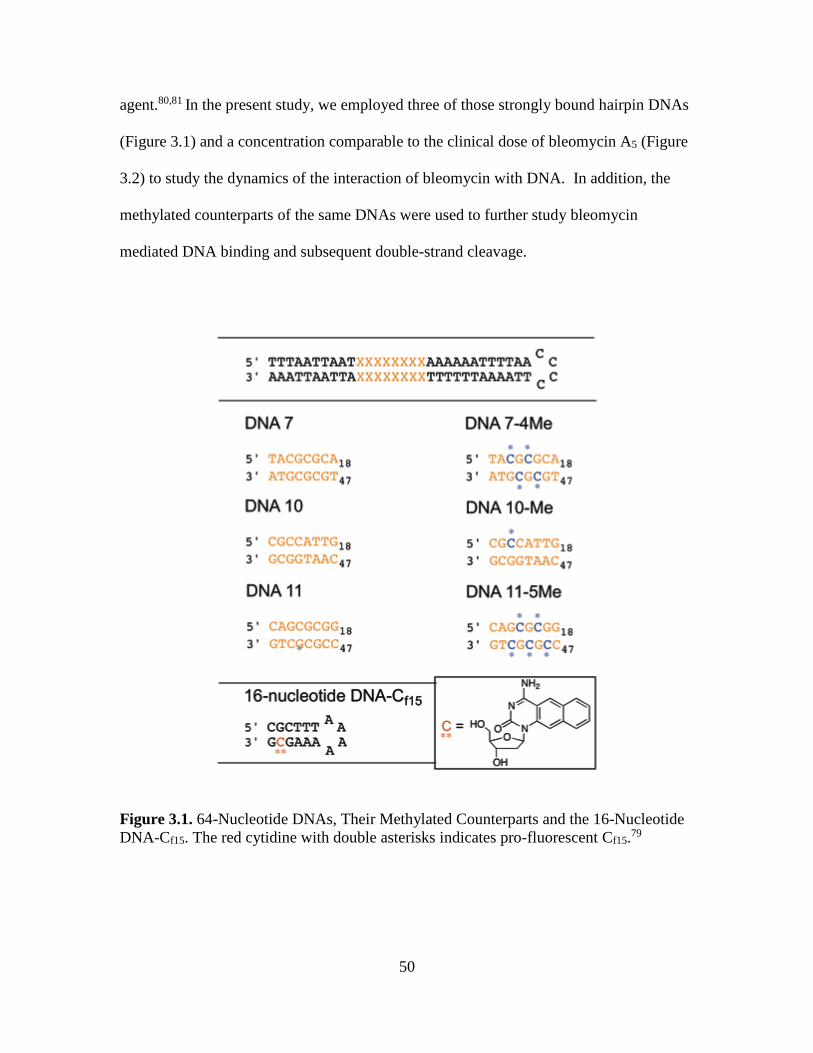
50
agent.80,81 In the present study, we employed three of those strongly bound hairpin DNAs
(Figure 3.1) and a concentration comparable to the clinical dose of bleomycin A5 (Figure
3.2) to study the dynamics of the interaction of bleomycin with DNA. In addition, the
methylated counterparts of the same DNAs were used to further study bleomycin
mediated DNA binding and subsequent double-strand cleavage.
Figure 3.1. 64-Nucleotide DNAs, Their Methylated Counterparts and the 16-Nucleotide
DNA-Cf15. The red cytidine with double asterisks indicates pro-fluorescent Cf15.79
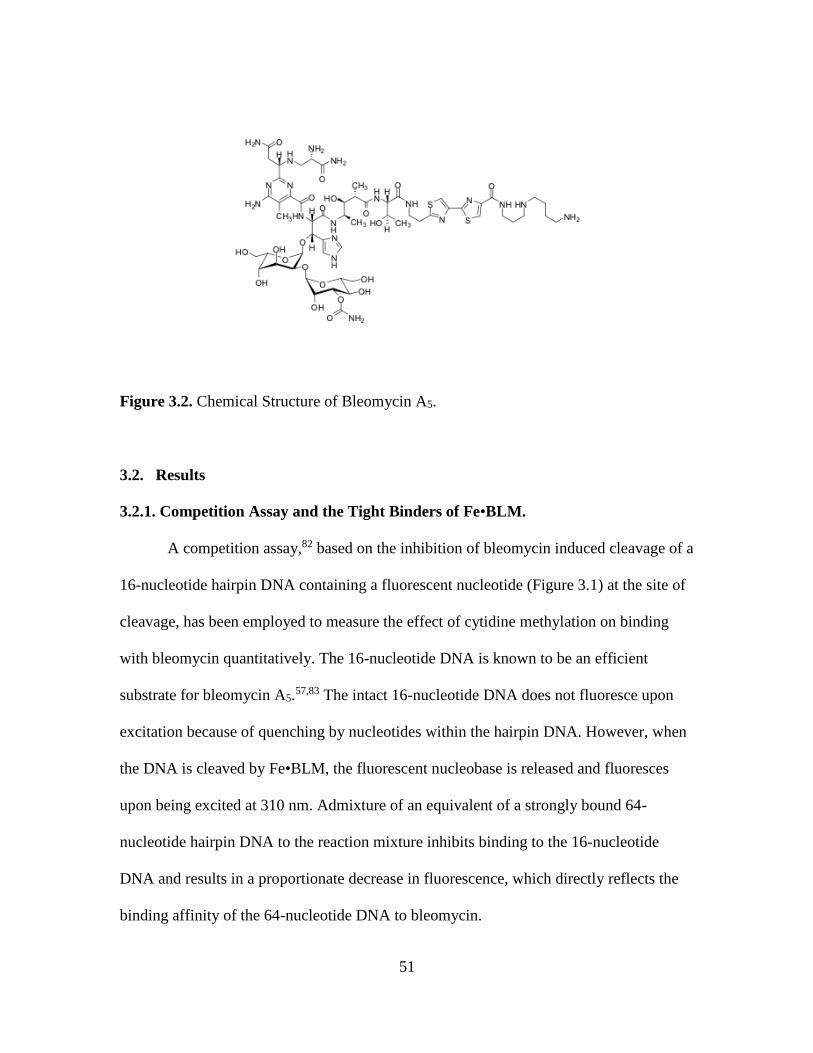
51
Figure 3.2. Chemical Structure of Bleomycin A5.
3.2. Results
3.2.1. Competition Assay and the Tight Binders of Fe•BLM.
A competition assay,82 based on the inhibition of bleomycin induced cleavage of a
16-nucleotide hairpin DNA containing a fluorescent nucleotide (Figure 3.1) at the site of
cleavage, has been employed to measure the effect of cytidine methylation on binding
with bleomycin quantitatively. The 16-nucleotide DNA is known to be an efficient
substrate for bleomycin A5.57,83 The intact 16-nucleotide DNA does not fluoresce upon
excitation because of quenching by nucleotides within the hairpin DNA. However, when
the DNA is cleaved by Fe•BLM, the fluorescent nucleobase is released and fluoresces
upon being excited at 310 nm. Admixture of an equivalent of a strongly bound 64-
nucleotide hairpin DNA to the reaction mixture inhibits binding to the 16-nucleotide
DNA and results in a proportionate decrease in fluorescence, which directly reflects the
binding affinity of the 64-nucleotide DNA to bleomycin.
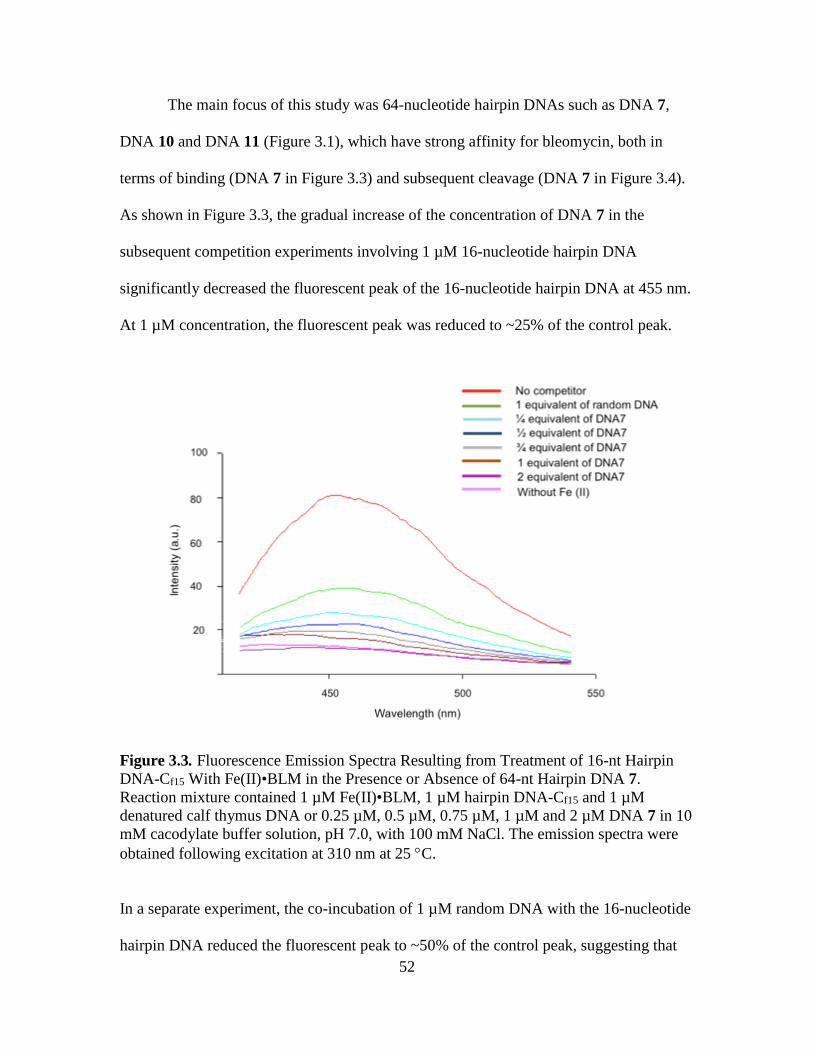
52
The main focus of this study was 64-nucleotide hairpin DNAs such as DNA 7,
DNA 10 and DNA 11 (Figure 3.1), which have strong affinity for bleomycin, both in
terms of binding (DNA 7 in Figure 3.3) and subsequent cleavage (DNA 7 in Figure 3.4).
As shown in Figure 3.3, the gradual increase of the concentration of DNA 7 in the
subsequent competition experiments involving 1 µM 16-nucleotide hairpin DNA
significantly decreased the fluorescent peak of the 16-nucleotide hairpin DNA at 455 nm.
At 1 µM concentration, the fluorescent peak was reduced to ~25% of the control peak.
Figure 3.3. Fluorescence Emission Spectra Resulting from Treatment of 16-nt Hairpin
DNA-Cf15 With Fe(II)•BLM in the Presence or Absence of 64-nt Hairpin DNA 7.
Reaction mixture contained 1 µM Fe(II)•BLM, 1 µM hairpin DNA-Cf15 and 1 µM
denatured calf thymus DNA or 0.25 µM, 0.5 µM, 0.75 µM, 1 µM and 2 µM DNA 7 in 10
mM cacodylate buffer solution, pH 7.0, with 100 mM NaCl. The emission spectra were
obtained following excitation at 310 nm at 25 C.
In a separate experiment, the co-incubation of 1 µM random DNA with the 16-nucleotide
hairpin DNA reduced the fluorescent peak to ~50% of the control peak, suggesting that
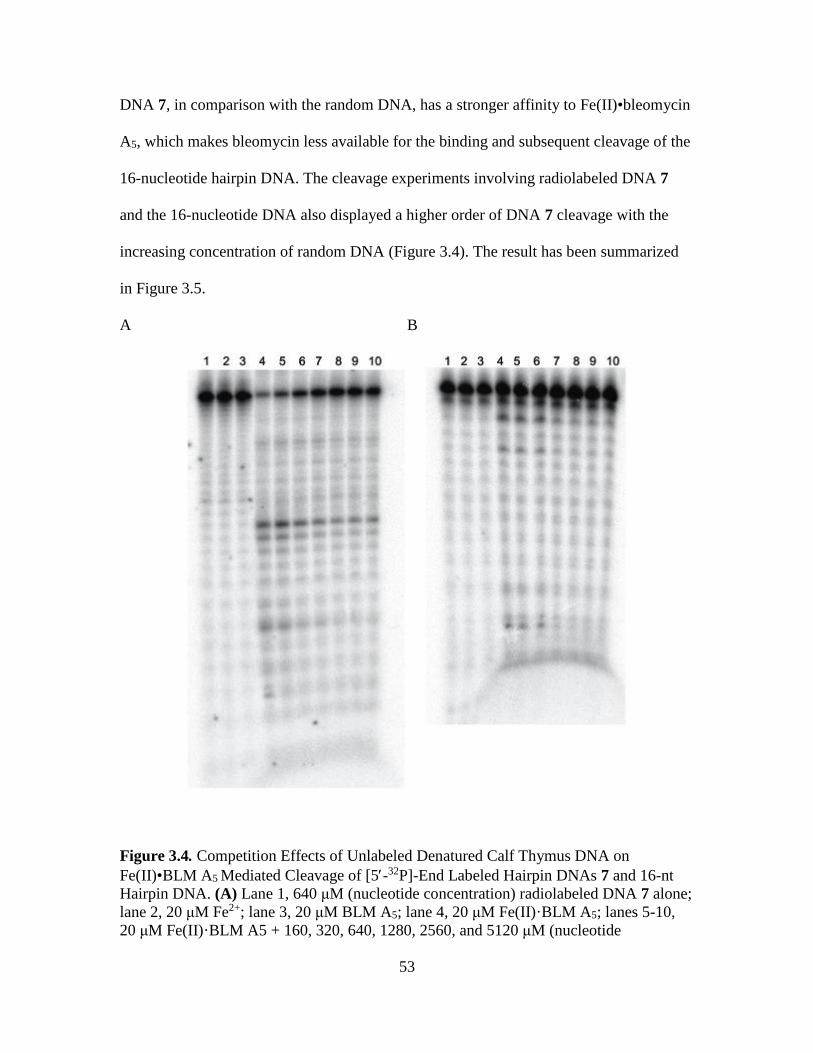
53
DNA 7, in comparison with the random DNA, has a stronger affinity to Fe(II)•bleomycin
A5, which makes bleomycin less available for the binding and subsequent cleavage of the
16-nucleotide hairpin DNA. The cleavage experiments involving radiolabeled DNA 7
and the 16-nucleotide DNA also displayed a higher order of DNA 7 cleavage with the
increasing concentration of random DNA (Figure 3.4). The result has been summarized
in Figure 3.5.
A B
Figure 3.4. Competition Effects of Unlabeled Denatured Calf Thymus DNA on
Fe(II)•BLM A5 Mediated Cleavage of [5-32P]-End Labeled Hairpin DNAs 7 and 16-nt
Hairpin DNA. (A) Lane 1, 640 μM (nucleotide concentration) radiolabeled DNA 7 alone;
lane 2, 20 μM Fe2+; lane 3, 20 μM BLM A5; lane 4, 20 μM Fe(II)·BLM A5; lanes 5-10,
20 μM Fe(II)·BLM A5 + 160, 320, 640, 1280, 2560, and 5120 μM (nucleotide
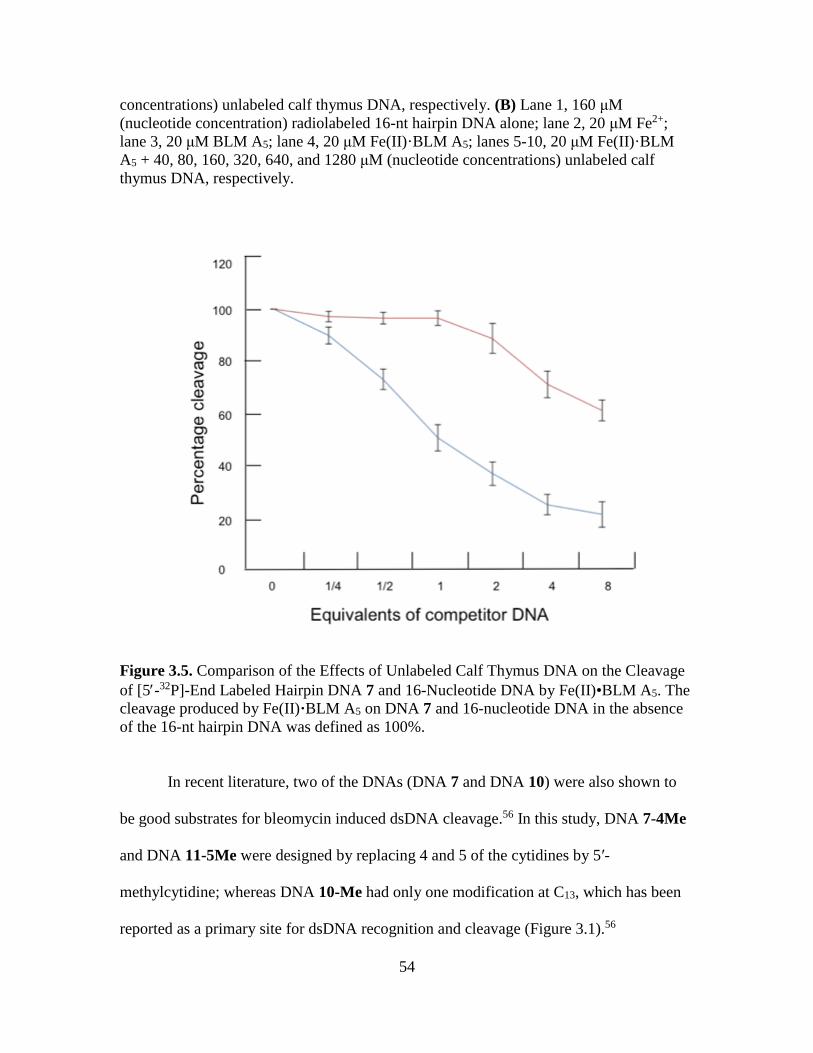
54
concentrations) unlabeled calf thymus DNA, respectively. (B) Lane 1, 160 μM
(nucleotide concentration) radiolabeled 16-nt hairpin DNA alone; lane 2, 20 μM Fe2+;
lane 3, 20 μM BLM A5; lane 4, 20 μM Fe(II)·BLM A5; lanes 5-10, 20 μM Fe(II)·BLM
A5 + 40, 80, 160, 320, 640, and 1280 μM (nucleotide concentrations) unlabeled calf
thymus DNA, respectively.
Figure 3.5. Comparison of the Effects of Unlabeled Calf Thymus DNA on the Cleavage
of [5-32P]-End Labeled Hairpin DNA 7 and 16-Nucleotide DNA by Fe(II)•BLM A5. The
cleavage produced by Fe(II)·BLM A5 on DNA 7 and 16-nucleotide DNA in the absence
of the 16-nt hairpin DNA was defined as 100%.
In recent literature, two of the DNAs (DNA 7 and DNA 10) were also shown to
be good substrates for bleomycin induced dsDNA cleavage.56 In this study, DNA 7-4Me
and DNA 11-5Me were designed by replacing 4 and 5 of the cytidines by 5′-
methylcytidine; whereas DNA 10-Me had only one modification at C13, which has been
reported as a primary site for dsDNA recognition and cleavage (Figure 3.1).56
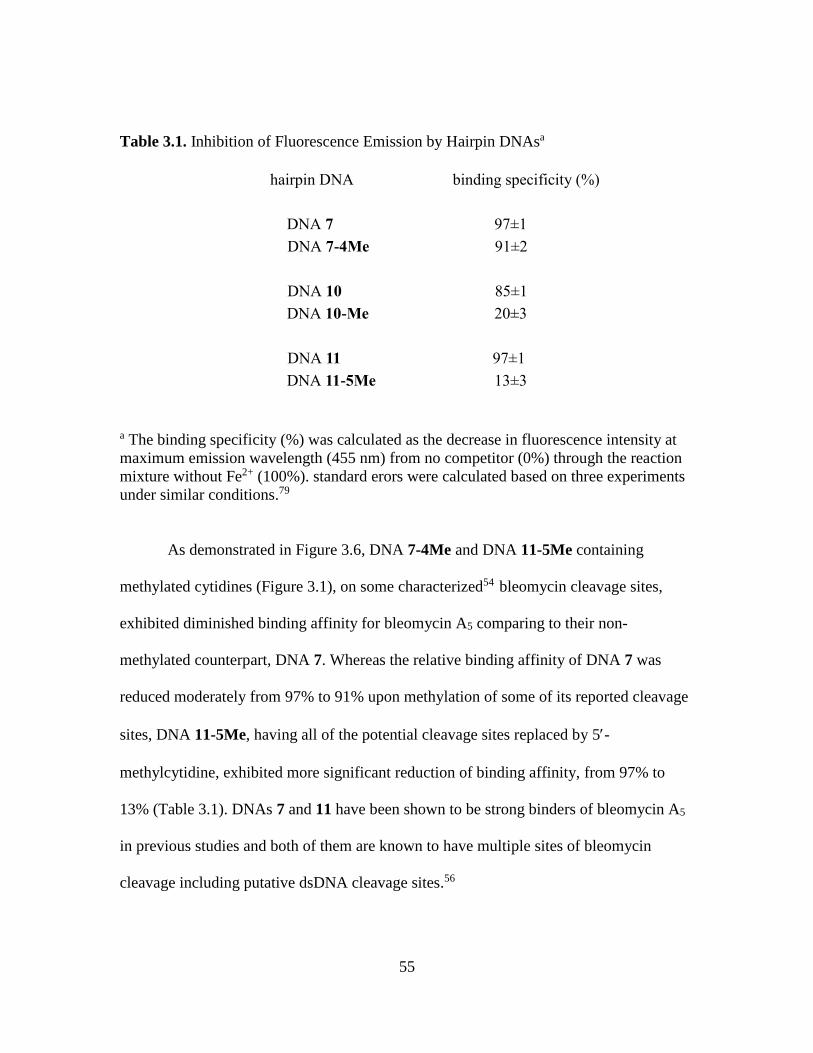
55
Table 3.1. Inhibition of Fluorescence Emission by Hairpin DNAsa
hairpin DNA binding specificity (%)
DNA 7 97±1
DNA 7-4Me 91±2
DNA 10 85±1
DNA 10-Me 20±3
DNA 11 97±1
DNA 11-5Me 13±3
a The binding specificity (%) was calculated as the decrease in fluorescence intensity at
maximum emission wavelength (455 nm) from no competitor (0%) through the reaction
mixture without Fe2+ (100%). standard erors were calculated based on three experiments
under similar conditions.79
As demonstrated in Figure 3.6, DNA 7-4Me and DNA 11-5Me containing
methylated cytidines (Figure 3.1), on some characterized54 bleomycin cleavage sites,
exhibited diminished binding affinity for bleomycin A5 comparing to their non-
methylated counterpart, DNA 7. Whereas the relative binding affinity of DNA 7 was
reduced moderately from 97% to 91% upon methylation of some of its reported cleavage
sites, DNA 11-5Me, having all of the potential cleavage sites replaced by 5-
methylcytidine, exhibited more significant reduction of binding affinity, from 97% to
13% (Table 3.1). DNAs 7 and 11 have been shown to be strong binders of bleomycin A5
in previous studies and both of them are known to have multiple sites of bleomycin
cleavage including putative dsDNA cleavage sites.56
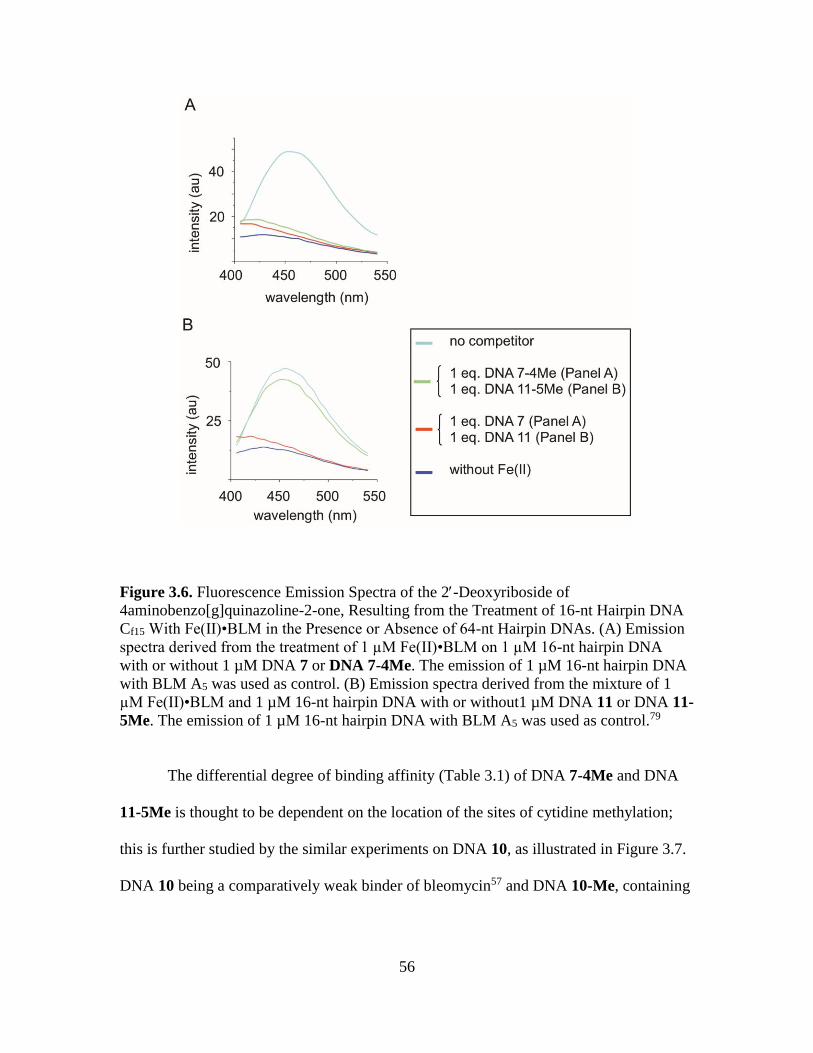
56
Figure 3.6. Fluorescence Emission Spectra of the 2-Deoxyriboside of
4aminobenzo[g]quinazoline-2-one, Resulting from the Treatment of 16-nt Hairpin DNA
Cf15 With Fe(II)•BLM in the Presence or Absence of 64-nt Hairpin DNAs. (A) Emission
spectra derived from the treatment of 1 µM Fe(II)•BLM on 1 µM 16-nt hairpin DNA
with or without 1 µM DNA 7 or DNA 7-4Me. The emission of 1 µM 16-nt hairpin DNA
with BLM A5 was used as control. (B) Emission spectra derived from the mixture of 1
µM Fe(II)•BLM and 1 µM 16-nt hairpin DNA with or without1 µM DNA 11 or DNA 11-
5Me. The emission of 1 µM 16-nt hairpin DNA with BLM A5 was used as control.79
The differential degree of binding affinity (Table 3.1) of DNA 7-4Me and DNA
11-5Me is thought to be dependent on the location of the sites of cytidine methylation;
this is further studied by the similar experiments on DNA 10, as illustrated in Figure 3.7.
DNA 10 being a comparatively weak binder of bleomycin57 and DNA 10-Me, containing
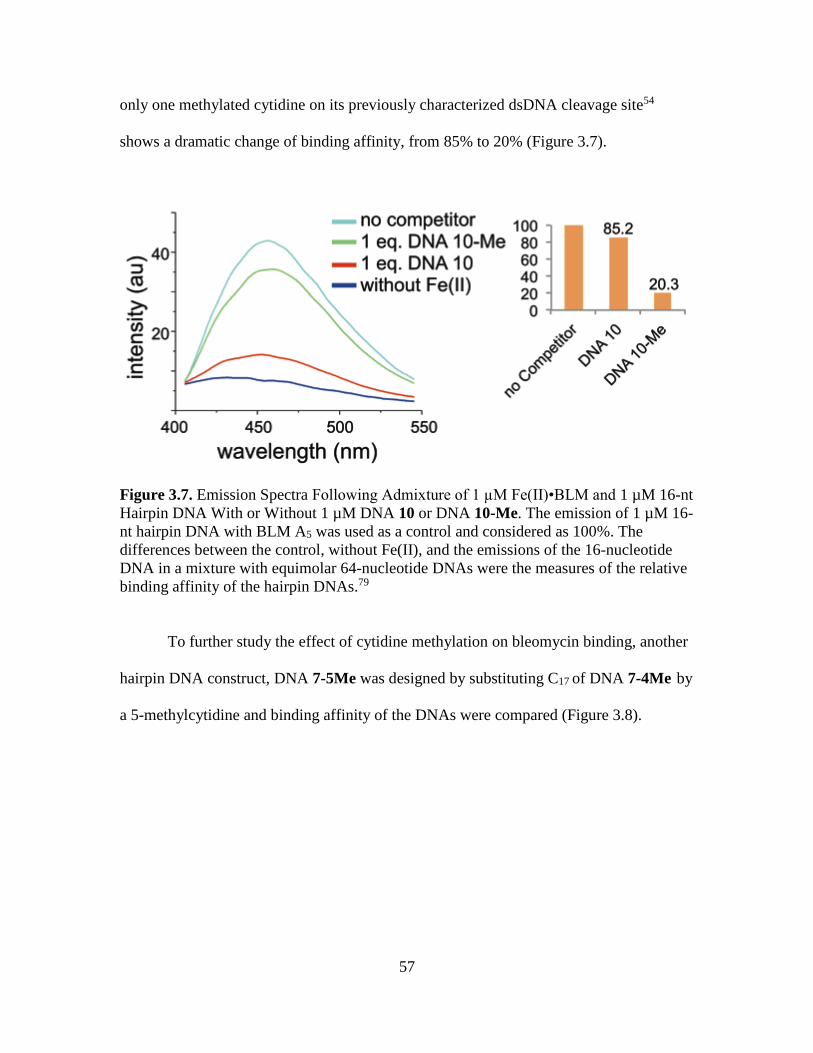
57
only one methylated cytidine on its previously characterized dsDNA cleavage site54
shows a dramatic change of binding affinity, from 85% to 20% (Figure 3.7).
Figure 3.7. Emission Spectra Following Admixture of 1 µM Fe(II)•BLM and 1 µM 16-nt
Hairpin DNA With or Without 1 µM DNA 10 or DNA 10-Me. The emission of 1 µM 16-
nt hairpin DNA with BLM A5 was used as a control and considered as 100%. The
differences between the control, without Fe(II), and the emissions of the 16-nucleotide
DNA in a mixture with equimolar 64-nucleotide DNAs were the measures of the relative
binding affinity of the hairpin DNAs.79
To further study the effect of cytidine methylation on bleomycin binding, another
hairpin DNA construct, DNA 7-5Me was designed by substituting C17 of DNA 7-4Me by
a 5-methylcytidine and binding affinity of the DNAs were compared (Figure 3.8).
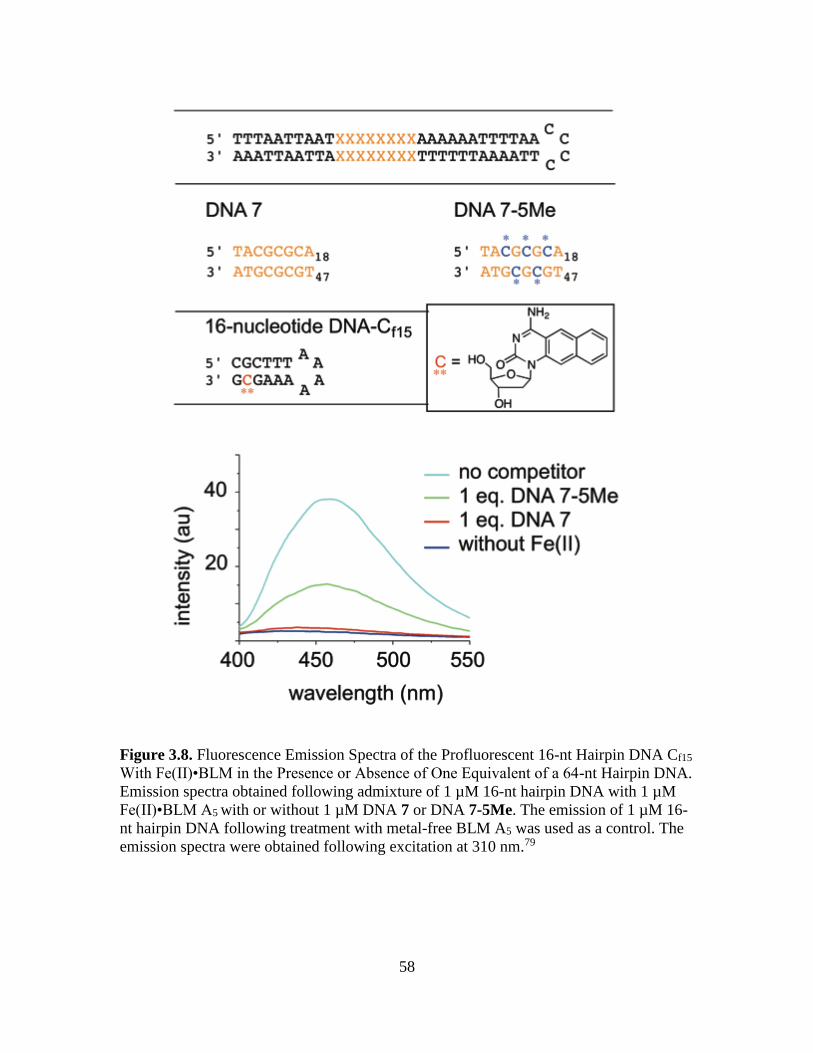
58
Figure 3.8. Fluorescence Emission Spectra of the Profluorescent 16-nt Hairpin DNA Cf15
With Fe(II)•BLM in the Presence or Absence of One Equivalent of a 64-nt Hairpin DNA.
Emission spectra obtained following admixture of 1 µM 16-nt hairpin DNA with 1 µM
Fe(II)•BLM A5 with or without 1 µM DNA 7 or DNA 7-5Me. The emission of 1 µM 16-
nt hairpin DNA following treatment with metal-free BLM A5 was used as a control. The
emission spectra were obtained following excitation at 310 nm.79
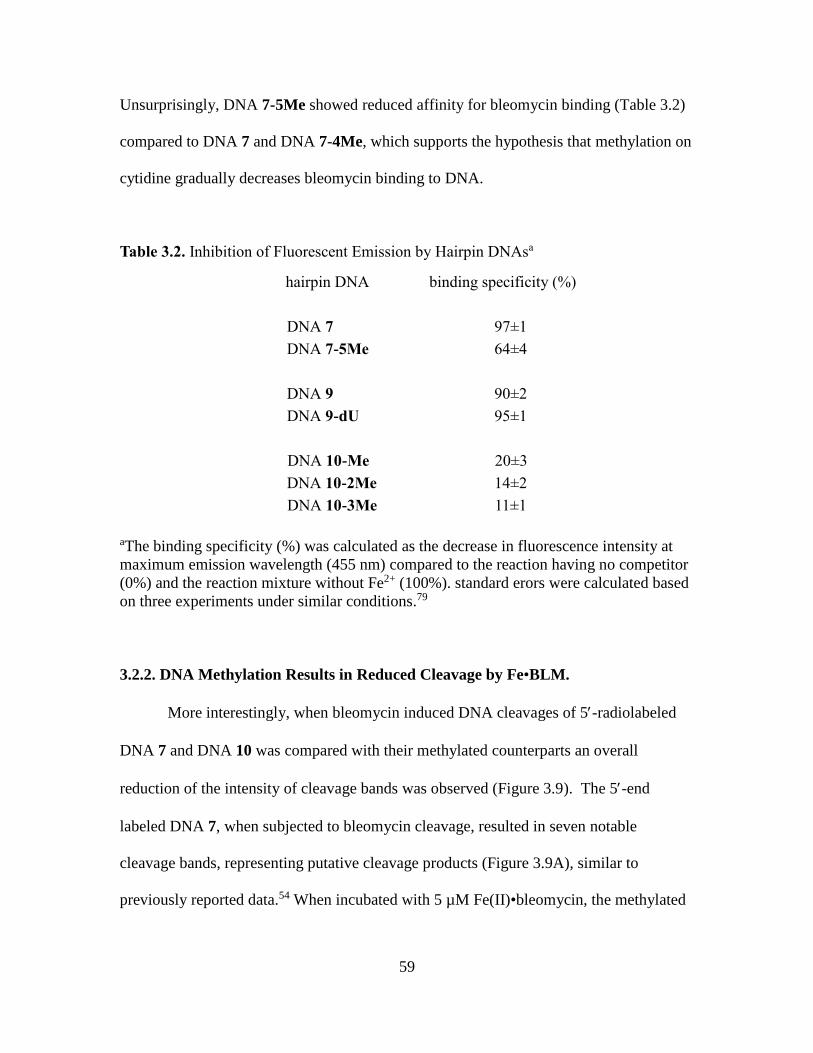
59
Unsurprisingly, DNA 7-5Me showed reduced affinity for bleomycin binding (Table 3.2)
compared to DNA 7 and DNA 7-4Me, which supports the hypothesis that methylation on
cytidine gradually decreases bleomycin binding to DNA.
Table 3.2. Inhibition of Fluorescent Emission by Hairpin DNAsa
hairpin DNA binding specificity (%)
DNA 7 97±1
DNA 7-5Me 64±4
DNA 9 90±2
DNA 9-dU 95±1
DNA 10-Me 20±3
DNA 10-2Me 14±2
DNA 10-3Me 11±1
aThe binding specificity (%) was calculated as the decrease in fluorescence intensity at
maximum emission wavelength (455 nm) compared to the reaction having no competitor
(0%) and the reaction mixture without Fe2+ (100%). standard erors were calculated based
on three experiments under similar conditions.79
3.2.2. DNA Methylation Results in Reduced Cleavage by Fe•BLM.
More interestingly, when bleomycin induced DNA cleavages of 5-radiolabeled
DNA 7 and DNA 10 was compared with their methylated counterparts an overall
reduction of the intensity of cleavage bands was observed (Figure 3.9). The 5-end
labeled DNA 7, when subjected to bleomycin cleavage, resulted in seven notable
cleavage bands, representing putative cleavage products (Figure 3.9A), similar to
previously reported data.54 When incubated with 5 µM Fe(II)•bleomycin, the methylated
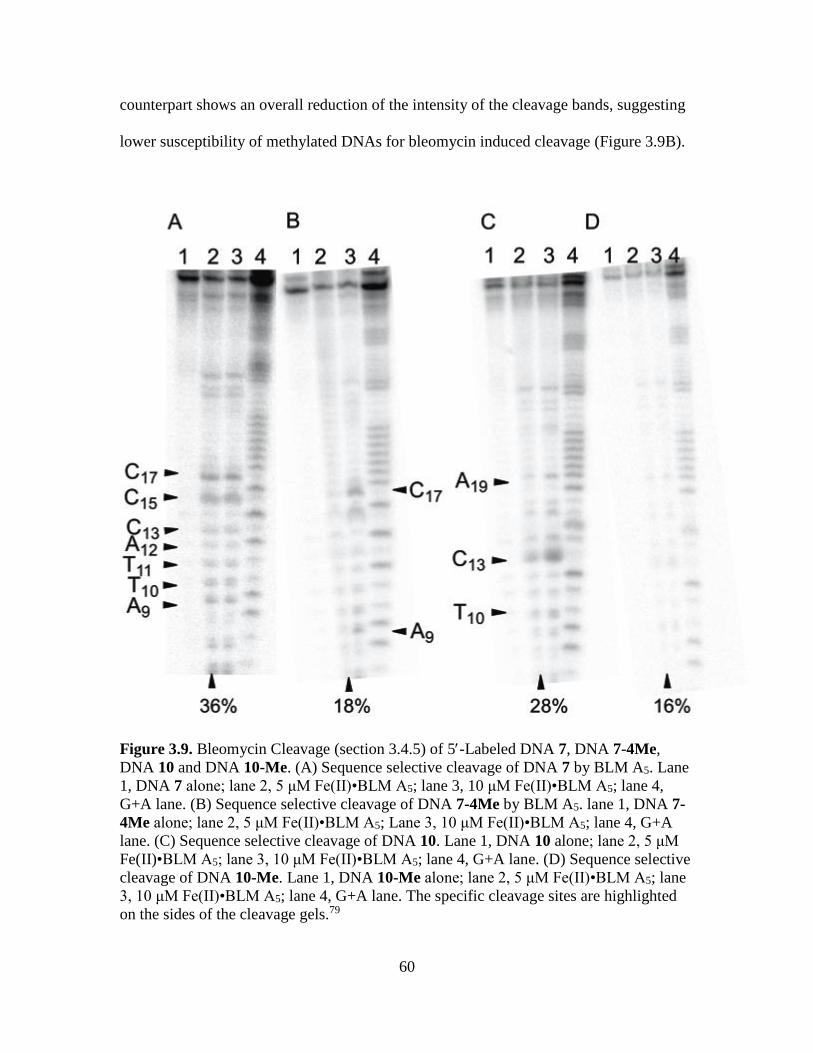
60
counterpart shows an overall reduction of the intensity of the cleavage bands, suggesting
lower susceptibility of methylated DNAs for bleomycin induced cleavage (Figure 3.9B).
Figure 3.9. Bleomycin Cleavage (section 3.4.5) of 5-Labeled DNA 7, DNA 7-4Me,
DNA 10 and DNA 10-Me. (A) Sequence selective cleavage of DNA 7 by BLM A5. Lane
1, DNA 7 alone; lane 2, 5 μM Fe(II)•BLM A5; lane 3, 10 μM Fe(II)•BLM A5; lane 4,
G+A lane. (B) Sequence selective cleavage of DNA 7-4Me by BLM A5. lane 1, DNA 7-
4Me alone; lane 2, 5 μM Fe(II)•BLM A5; Lane 3, 10 μM Fe(II)•BLM A5; lane 4, G+A
lane. (C) Sequence selective cleavage of DNA 10. Lane 1, DNA 10 alone; lane 2, 5 μM
Fe(II)•BLM A5; lane 3, 10 μM Fe(II)•BLM A5; lane 4, G+A lane. (D) Sequence selective
cleavage of DNA 10-Me. Lane 1, DNA 10-Me alone; lane 2, 5 μM Fe(II)•BLM A5; lane
3, 10 μM Fe(II)•BLM A5; lane 4, G+A lane. The specific cleavage sites are highlighted
on the sides of the cleavage gels.79
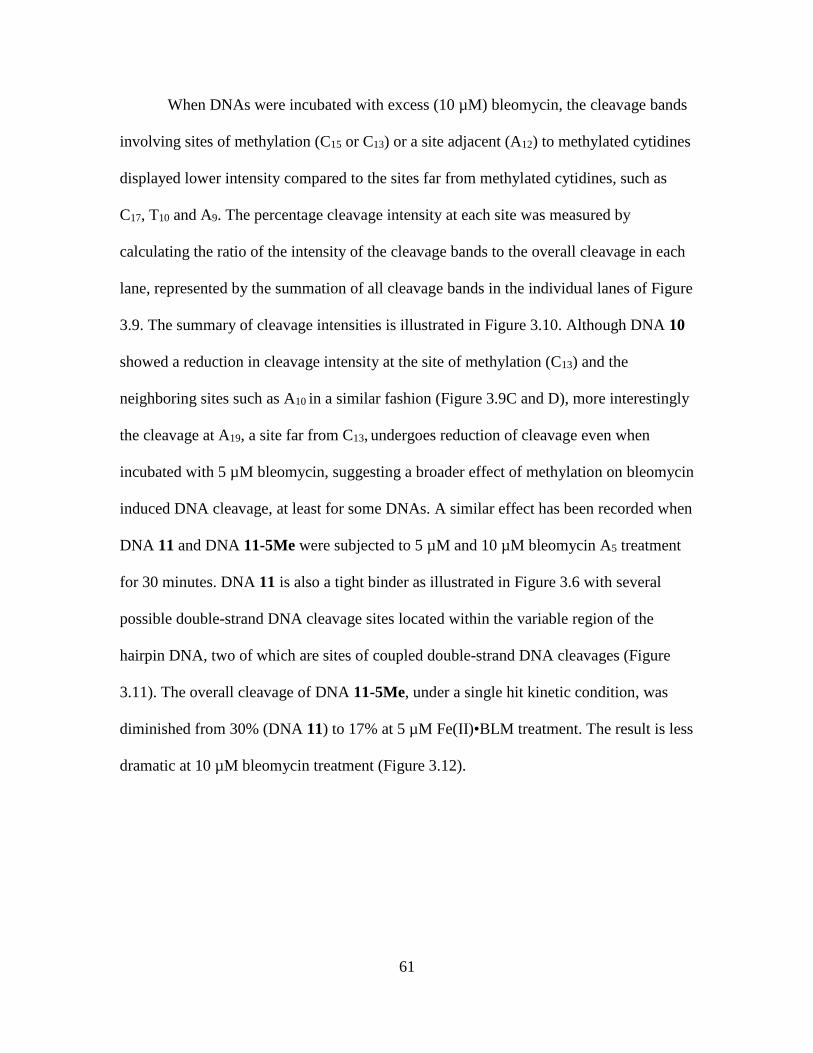
61
When DNAs were incubated with excess (10 µM) bleomycin, the cleavage bands
involving sites of methylation (C15 or C13) or a site adjacent (A12) to methylated cytidines
displayed lower intensity compared to the sites far from methylated cytidines, such as
C17, T10 and A9. The percentage cleavage intensity at each site was measured by
calculating the ratio of the intensity of the cleavage bands to the overall cleavage in each
lane, represented by the summation of all cleavage bands in the individual lanes of Figure
3.9. The summary of cleavage intensities is illustrated in Figure 3.10. Although DNA 10
showed a reduction in cleavage intensity at the site of methylation (C13) and the
neighboring sites such as A10 in a similar fashion (Figure 3.9C and D), more interestingly
the cleavage at A19, a site far from C13, undergoes reduction of cleavage even when
incubated with 5 µM bleomycin, suggesting a broader effect of methylation on bleomycin
induced DNA cleavage, at least for some DNAs. A similar effect has been recorded when
DNA 11 and DNA 11-5Me were subjected to 5 µM and 10 µM bleomycin A5 treatment
for 30 minutes. DNA 11 is also a tight binder as illustrated in Figure 3.6 with several
possible double-strand DNA cleavage sites located within the variable region of the
hairpin DNA, two of which are sites of coupled double-strand DNA cleavages (Figure
3.11). The overall cleavage of DNA 11-5Me, under a single hit kinetic condition, was
diminished from 30% (DNA 11) to 17% at 5 µM Fe(II)•BLM treatment. The result is less
dramatic at 10 µM bleomycin treatment (Figure 3.12).
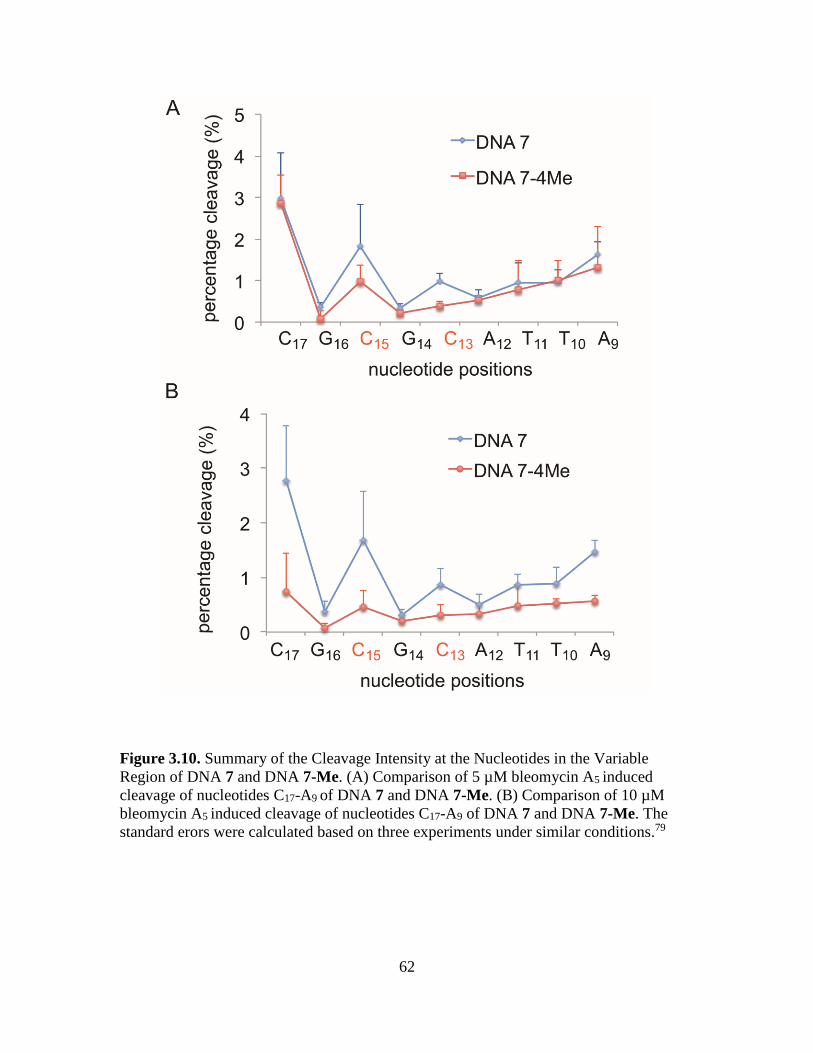
62
Figure 3.10. Summary of the Cleavage Intensity at the Nucleotides in the Variable
Region of DNA 7 and DNA 7-Me. (A) Comparison of 5 µM bleomycin A5 induced
cleavage of nucleotides C17-A9 of DNA 7 and DNA 7-Me. (B) Comparison of 10 µM
bleomycin A5 induced cleavage of nucleotides C17-A9 of DNA 7 and DNA 7-Me. The
standard erors were calculated based on three experiments under similar conditions.79
63
Figure 3.11. Analysis of Fe•Bleomycin Induced Double-Strand Cleavage Sites on
Hairpin DNA 11. (A) Double strand cleavage of [5-32P]-end labeled (lanes 1 and 2) and
[3-32P]-end labeled (lanes 3 and 4) 64-nucleotide hairpin DNA 11 by bleomycin A5.
Lane 1, [5-32P]-end labeled DNA alone; lane 2, 5 µM Fe(II)•BLM A5; lane 3, 5 µM
Fe(II)BLM A5; lane 4, [3-32P]-end labeled DNA alone. (B) Sequencing gel analysis of
bleomycin induced double-strand cleavage sites on [5-32P]-end labeled DNA 11. Each
lane (except lanes 1) corresponds to a numbered cleavage band, shown in (A). Lane 1,
Maxam-Gilbert G+A sequencing lane of [5-32P]-end labeled DNA 11; lane 2, band 2a;
lane 3, band 2b; lane 4, band 2c; lane 5, band 2d; lane 6, band 2e. (C) Sequencing gel
analysis of bleomycin induced double-strand cleavage sites on [3-32P]-end labeled DNA
11. Each lane (except lanes 1) corresponds to a numbered cleavage band, shown in (A).
Lane 1, Maxam-Gilbert G+A sequencing lane of [3-32P]-end labeled DNA 11; lane 2,
band 3a; lane 3, band 3b; lane 4, band 3c; lane 5, band 3d; lane 6, band 3e. (D) Summary
of Fe•bleomycin induced double-strand cleavage sites on hairpin DNAs 11. Orange bases
indicate randomized region of the original hairpin DNA library. Arrows of the same
shape and color indicate paired cleavages. Black arrows correspond to couple double-
strand cleavage events whereas red arrows indicate non-coupled double-strand cleavage
events, which results from two independent single-strand cleavages on opposite strands.
Nucleotides colored in red indicate primary sites of double-strand cleavage.79
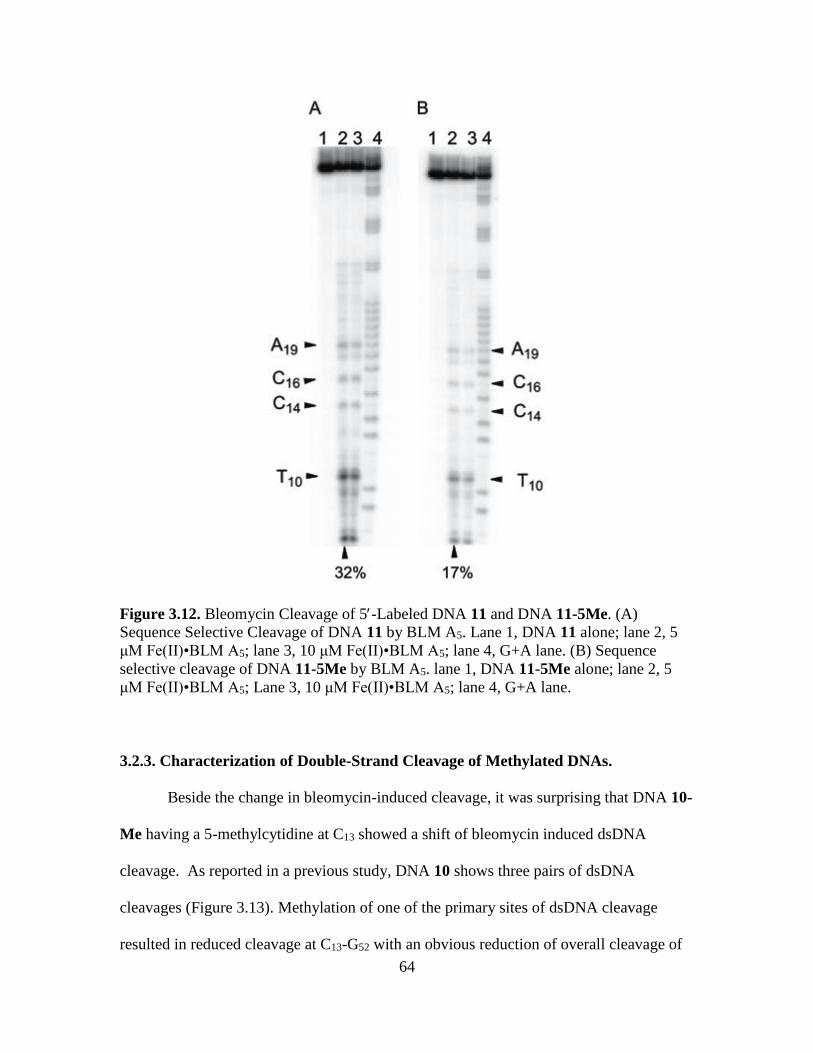
64
Figure 3.12. Bleomycin Cleavage of 5-Labeled DNA 11 and DNA 11-5Me. (A)
Sequence Selective Cleavage of DNA 11 by BLM A5. Lane 1, DNA 11 alone; lane 2, 5
μM Fe(II)•BLM A5; lane 3, 10 μM Fe(II)•BLM A5; lane 4, G+A lane. (B) Sequence
selective cleavage of DNA 11-5Me by BLM A5. lane 1, DNA 11-5Me alone; lane 2, 5
μM Fe(II)•BLM A5; Lane 3, 10 μM Fe(II)•BLM A5; lane 4, G+A lane.
3.2.3. Characterization of Double-Strand Cleavage of Methylated DNAs.
Beside the change in bleomycin-induced cleavage, it was surprising that DNA 10-
Me having a 5-methylcytidine at C13 showed a shift of bleomycin induced dsDNA
cleavage. As reported in a previous study, DNA 10 shows three pairs of dsDNA
cleavages (Figure 3.13). Methylation of one of the primary sites of dsDNA cleavage
resulted in reduced cleavage at C13-G52 with an obvious reduction of overall cleavage of
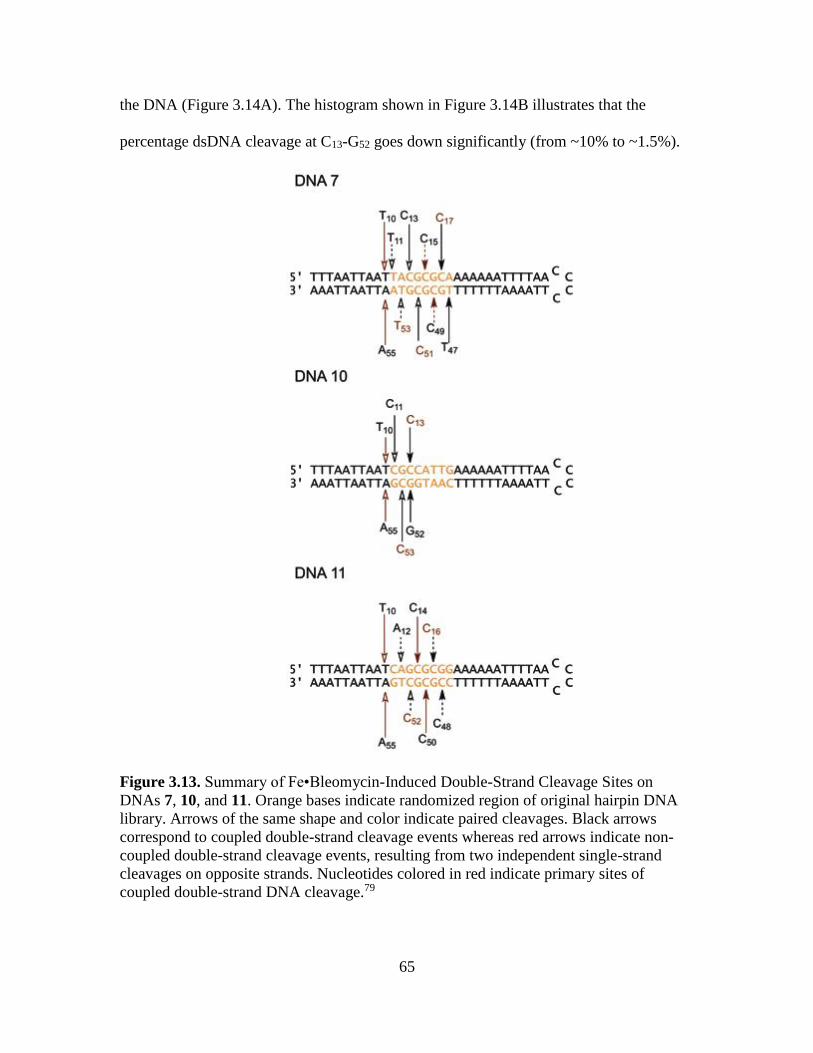
65
the DNA (Figure 3.14A). The histogram shown in Figure 3.14B illustrates that the
percentage dsDNA cleavage at C13-G52 goes down significantly (from ~10% to ~1.5%).
Figure 3.13. Summary of Fe•Bleomycin-Induced Double-Strand Cleavage Sites on
DNAs 7, 10, and 11. Orange bases indicate randomized region of original hairpin DNA
library. Arrows of the same shape and color indicate paired cleavages. Black arrows
correspond to coupled double-strand cleavage events whereas red arrows indicate non-
coupled double-strand cleavage events, resulting from two independent single-strand
cleavages on opposite strands. Nucleotides colored in red indicate primary sites of
coupled double-strand DNA cleavage.79
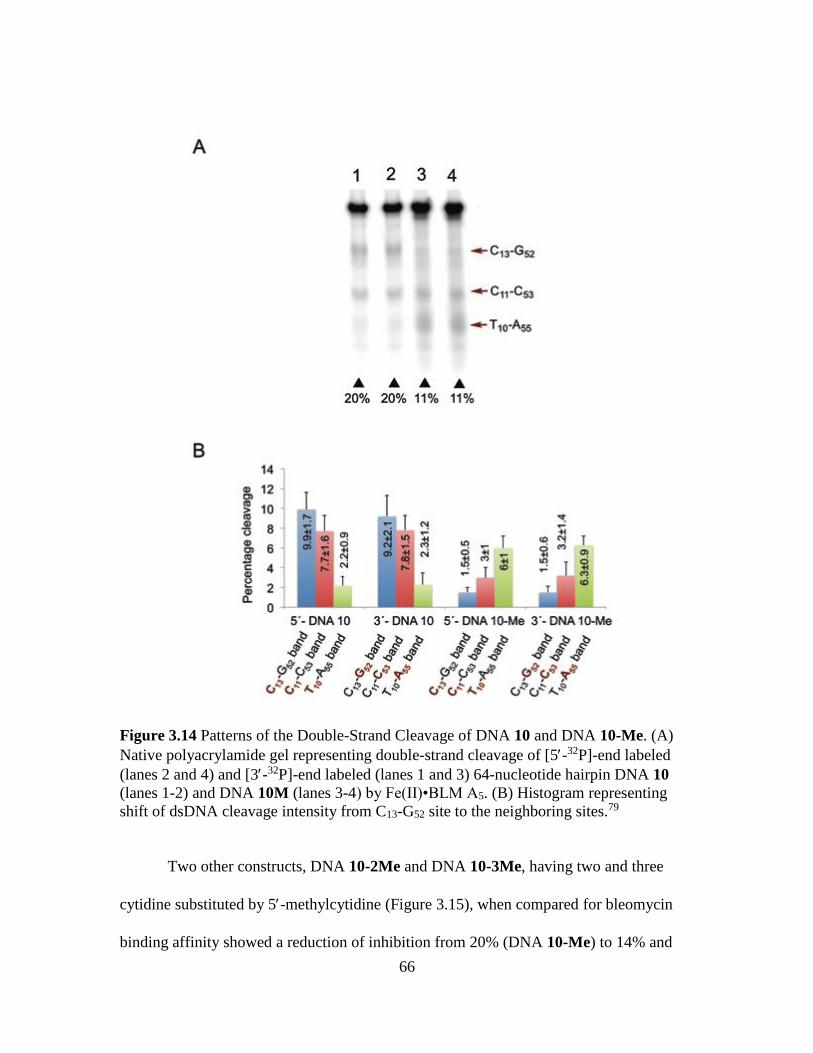
66
Figure 3.14 Patterns of the Double-Strand Cleavage of DNA 10 and DNA 10-Me. (A)
Native polyacrylamide gel representing double-strand cleavage of [5-32P]-end labeled
(lanes 2 and 4) and [3-32P]-end labeled (lanes 1 and 3) 64-nucleotide hairpin DNA 10
(lanes 1-2) and DNA 10M (lanes 3-4) by Fe(II)•BLM A5. (B) Histogram representing
shift of dsDNA cleavage intensity from C13-G52 site to the neighboring sites.79
Two other constructs, DNA 10-2Me and DNA 10-3Me, having two and three
cytidine substituted by 5-methylcytidine (Figure 3.15), when compared for bleomycin
binding affinity showed a reduction of inhibition from 20% (DNA 10-Me) to 14% and
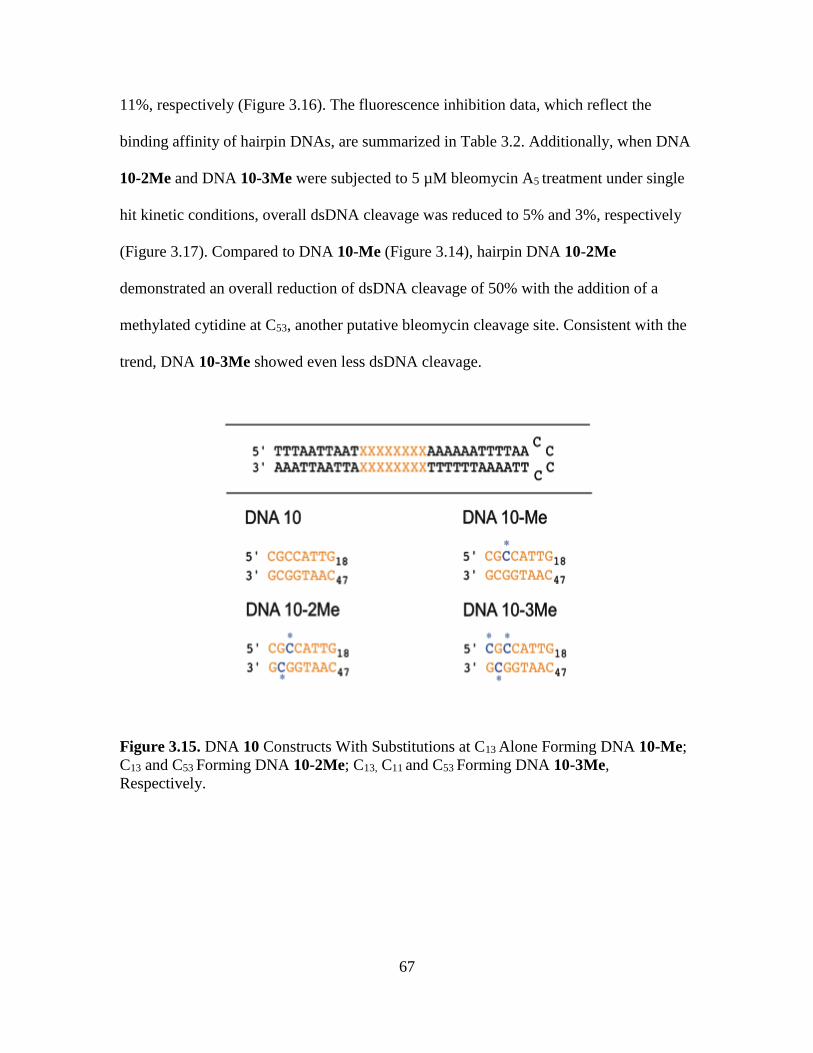
67
11%, respectively (Figure 3.16). The fluorescence inhibition data, which reflect the
binding affinity of hairpin DNAs, are summarized in Table 3.2. Additionally, when DNA
10-2Me and DNA 10-3Me were subjected to 5 µM bleomycin A5 treatment under single
hit kinetic conditions, overall dsDNA cleavage was reduced to 5% and 3%, respectively
(Figure 3.17). Compared to DNA 10-Me (Figure 3.14), hairpin DNA 10-2Me
demonstrated an overall reduction of dsDNA cleavage of 50% with the addition of a
methylated cytidine at C53, another putative bleomycin cleavage site. Consistent with the
trend, DNA 10-3Me showed even less dsDNA cleavage.
Figure 3.15. DNA 10 Constructs With Substitutions at C13 Alone Forming DNA 10-Me;
C13 and C53 Forming DNA 10-2Me; C13, C11 and C53 Forming DNA 10-3Me,
Respectively.

68
Figure 3.16. Fluorescence Emission Spectra of the Profluorescent 16-nt Hairpin DNA
Cf15 With Fe(II)•BLM in the Presence or Absence of One Equivalent of a 64-nt Hairpin
DNA. Emission spectra obtained following treatment of 1 µM 16-nt hairpin DNA with 1
µM Fe(II)•BLM A5 with or without 1 µM DNA 10 and methylated variants of DNA 10,
DNA 10-2Me and DNA 10-3Me . The emission of 1 µM 16-nt hairpin DNA following
treatment with metal-free BLM A5 was used as a control. The emission spectra were
obtained following excitation at 310 nm.79
Table 3.3. Percentage of DNA Cleavage of Hairpin DNAsa
hairpin DNA percentage cleavage (%)
DNA 7 35±3
DNA 7-4Me 16±2
DNA 26±4
DNA 10-Me 16±3
DNA 11 33±3
DNA 11-5Me 15±4
DNA 9 20±1
DNA 9-dU 27±2
aThe percentage cleavage for 5 µM bleomycin treatment was calculated as the ratio of the
intensity of cleavage bands to the overall intensity of the hairpin DNA loaded in each
well of denaturing polyacrylamide gel. standard erors were calculated based on three
experiments under similar conditions.79
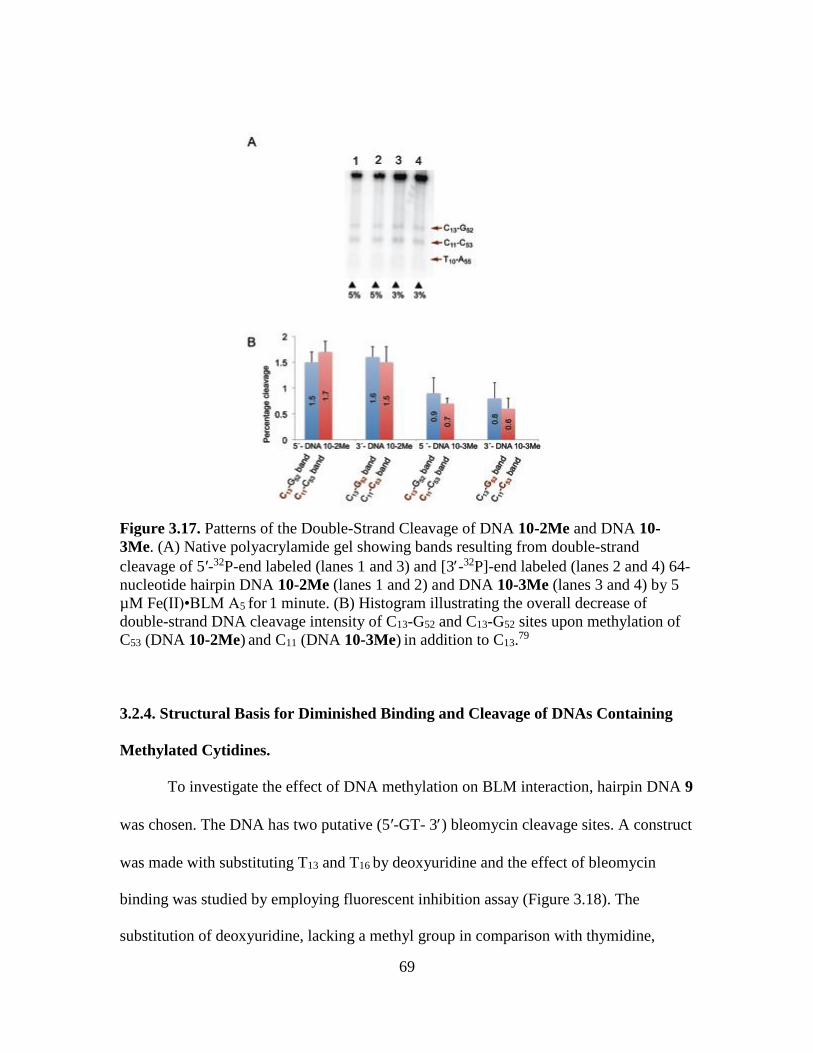
69
Figure 3.17. Patterns of the Double-Strand Cleavage of DNA 10-2Me and DNA 10-
3Me. (A) Native polyacrylamide gel showing bands resulting from double-strand
cleavage of 5′-32P-end labeled (lanes 1 and 3) and [3-32P]-end labeled (lanes 2 and 4) 64-
nucleotide hairpin DNA 10-2Me (lanes 1 and 2) and DNA 10-3Me (lanes 3 and 4) by 5
µM Fe(II)•BLM A5 for 1 minute. (B) Histogram illustrating the overall decrease of
double-strand DNA cleavage intensity of C13-G52 and C13-G52 sites upon methylation of
C53 (DNA 10-2Me) and C11 (DNA 10-3Me) in addition to C13.79
3.2.4. Structural Basis for Diminished Binding and Cleavage of DNAs Containing
Methylated Cytidines.
To investigate the effect of DNA methylation on BLM interaction, hairpin DNA 9
was chosen. The DNA has two putative (5′-GT- 3) bleomycin cleavage sites. A construct
was made with substituting T13 and T16 by deoxyuridine and the effect of bleomycin
binding was studied by employing fluorescent inhibition assay (Figure 3.18). The
substitution of deoxyuridine, lacking a methyl group in comparison with thymidine,
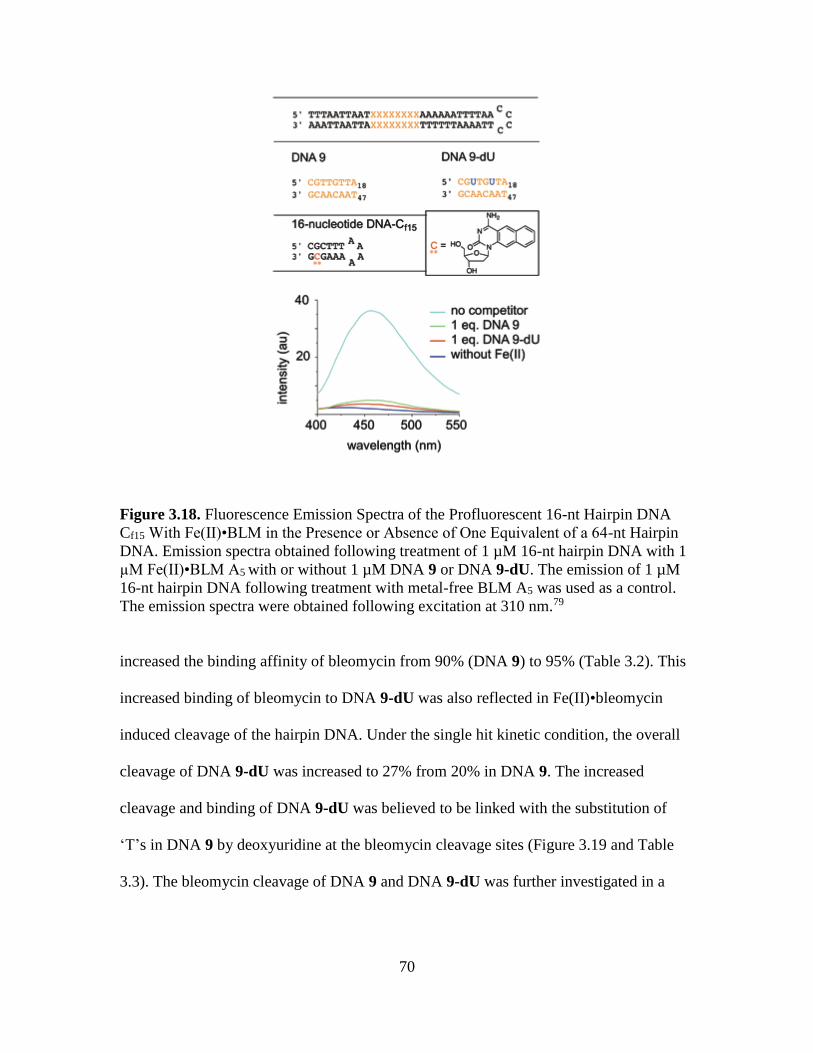
70
Figure 3.18. Fluorescence Emission Spectra of the Profluorescent 16-nt Hairpin DNA
Cf15 With Fe(II)•BLM in the Presence or Absence of One Equivalent of a 64-nt Hairpin
DNA. Emission spectra obtained following treatment of 1 µM 16-nt hairpin DNA with 1
µM Fe(II)•BLM A5 with or without 1 µM DNA 9 or DNA 9-dU. The emission of 1 µM
16-nt hairpin DNA following treatment with metal-free BLM A5 was used as a control.
The emission spectra were obtained following excitation at 310 nm.79
increased the binding affinity of bleomycin from 90% (DNA 9) to 95% (Table 3.2). This
increased binding of bleomycin to DNA 9-dU was also reflected in Fe(II)•bleomycin
induced cleavage of the hairpin DNA. Under the single hit kinetic condition, the overall
cleavage of DNA 9-dU was increased to 27% from 20% in DNA 9. The increased
cleavage and binding of DNA 9-dU was believed to be linked with the substitution of
‘T’s in DNA 9 by deoxyuridine at the bleomycin cleavage sites (Figure 3.19 and Table
3.3). The bleomycin cleavage of DNA 9 and DNA 9-dU was further investigated in a
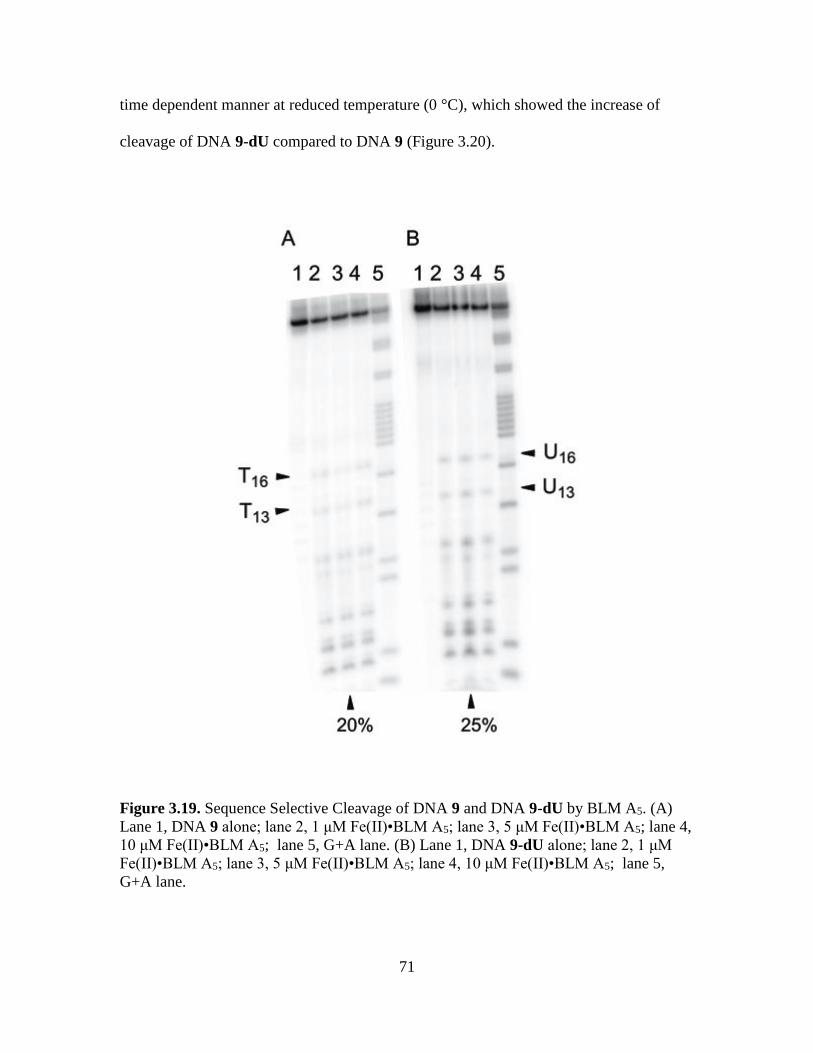
71
time dependent manner at reduced temperature (0 °C), which showed the increase of
cleavage of DNA 9-dU compared to DNA 9 (Figure 3.20).
Figure 3.19. Sequence Selective Cleavage of DNA 9 and DNA 9-dU by BLM A5. (A)
Lane 1, DNA 9 alone; lane 2, 1 μM Fe(II)•BLM A5; lane 3, 5 μM Fe(II)•BLM A5; lane 4,
10 μM Fe(II)•BLM A5; lane 5, G+A lane. (B) Lane 1, DNA 9-dU alone; lane 2, 1 μM
Fe(II)•BLM A5; lane 3, 5 μM Fe(II)•BLM A5; lane 4, 10 μM Fe(II)•BLM A5; lane 5,
G+A lane.
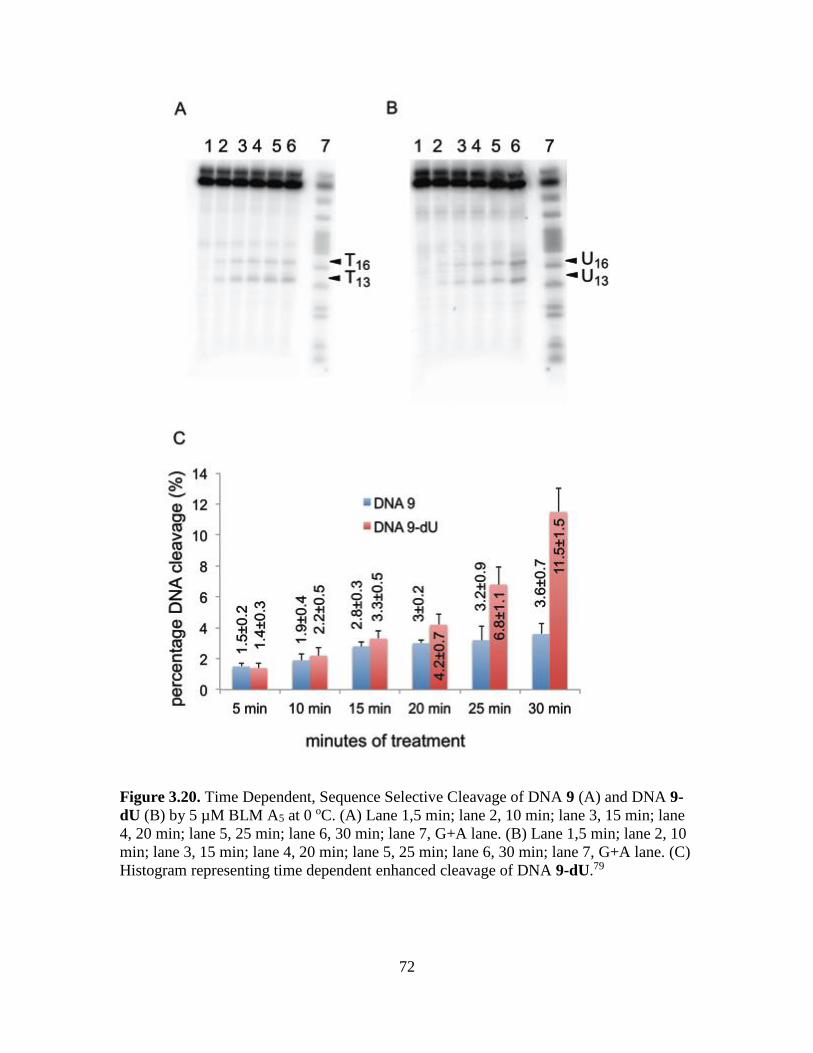
72
Figure 3.20. Time Dependent, Sequence Selective Cleavage of DNA 9 (A) and DNA 9-
dU (B) by 5 µM BLM A5 at 0 oC. (A) Lane 1,5 min; lane 2, 10 min; lane 3, 15 min; lane
4, 20 min; lane 5, 25 min; lane 6, 30 min; lane 7, G+A lane. (B) Lane 1,5 min; lane 2, 10
min; lane 3, 15 min; lane 4, 20 min; lane 5, 25 min; lane 6, 30 min; lane 7, G+A lane. (C)
Histogram representing time dependent enhanced cleavage of DNA 9-dU.79
73
3.3. Discussion
Despite early evidence from the Hecht laboratory supporting the effects of DNA
methylation on DNA cleavage by bleomycin,80,81 no systematic analysis on the effects of
DNA methylation on DNA binding or cleavage has been reported. In this study we
focused on factors that make DNAs amenable to high affinity binding by bleomycin
under conditions of limited drug usage, suggesting the need to consider the role of
naturally occurring DNA modifications. Cytidine methylation is known to affect
nucleosome structure82 and alter gene expression, and the methylation pattern of DNA
changes in many cancers, making it obvious to consider DNA methylation as one
important factor influencing the action of bleomycin in a therapeutic setting.
In recent publications, we have provided evidence suggesting that at low
concentrations, bleomycin has a strong affinity for selected DNAs, and that these are
likely to be bound selectively to bleomycin in a mixture of DNAs.53,57,58,83,84 Further,
these tight binding DNAs undergo a newly characterized type of double-strand cleavage,
which may result in double-strand gaps in duplex DNA.51,54 Given the selective targeting
of tumor cells by BLM,34,85,86 the double-strand gaps in the genome of tumor cells may
provide the basis for the cytotoxic effect of bleomycin. While DNA methylation within
the human genome is abundant in both normal and cancer cells, the alteration of DNA
methylation in cancer cells may plausibly provide additional insights into characteristics
of the targets responsible for selective tumor cell killing by bleomycin.
Not all cytidine methylations had the same impact on bleomycin binding to DNA.
Methylation at a single position (C13) in DNA 10 decreases binding of Fe(II)•BLM A5
considerably but the effect was not greatly enhanced by additional methylations at C53
74
and C11 (Table 3.2). This bis-methylated species (DNA 10-2Me) demonstrated the same
BLM binding specificity as DNA 11-5Me with five methylated cytidines (Table 3.2). In
contrast, DNA 7-4Me having four methylated cytidines had little effect on the binding of
that hairpin DNA, although DNA 7 and DNA 11 exhibited similar affinities for
Fe(II)•BLM A5 (Table 3.1). An addition of a fifth methyl group to DNA 7-4Me at a
known site of double-strand DNA cleavage (C17, Figure 3.8 and Table 3.2) afforded DNA
7-5Me, showed enhanced specificity of bleomycin binding. This suggested that the site of
methylation is important for its effect on Fe•BLM binding.
The same conclusion was reached by observing the effects of cytidine methylation
on Fe•BLM mediated DNA cleavage of DNA 10. As shown in Figures 3.7 and 3.9,
methylation at C13 led to an overall decrease of DNA cleavage (Table 3.3) with an
additional shift of the observed cleavage focus to sites distant from the site of
methylation. This implied that methylation could possibly shift the preferred site of DNA
binding.
There are many examples of the site selective cleavage of BLM involving both
DNA and RNA. When excess Fe(II)•BLM is used with the combination of the B-form
DNAs, the major cleavage sites involve 5′-GT and 5′-GC sequences,17,43 and the 5′-GPy
sequences also appear as the primary sites of cleavage in a coupled double-strand DNA
cleavage event.54 It is believed that Fe•BLM cleavage of DNA is preceded by binding,
which limits cleavage to a subset of DNA and RNA sites bound effectively by Fe•BLM.85
The relatively wide and shallow minor groove of B-form DNA at 5′-GT and 5′-GC
sequences may plausibly favor binding by Fe•BLM. This was further supported by the
fact that Fe•BLM cleaves the duplex domain of a DNA triplex at the junction of 5′-
75
duplex-triplex, where the minor groove is wider and shallower than in canonical B-form
DNA, as suggested by computational modeling.88 Similarly, the cleavage of transfer
RNAs by Fe•BLM was disproportionately enhanced at the junction of single and double-
strand regions, where a structure similar to the minor groove of DNA is expected to be
relatively wide,78 and shown to be sensitive to small changes in tRNA structure.89
As summarized in Tables 3.1 and 3.2, cytidine methylation in hairpin DNAs 7, 10
and 11 led to decreased Fe•BLM binding affinity and diminished DNA cleavage (Table
3.3). Bleomycin mediated DNA cleavage is initiated with the abstraction of a hydrogen
atom from the C4′ position of a deoxyribose sugar in the backbone of the minor groove of
DNA. Given that the methyl group of 5-methylcytidine projects outwards from the major
groove, the decrease of DNA binding and cleavage may not be a direct result of the steric
interaction between the methyl group and Fe•BLM. However, it seems logical to believe
that introduction of one or more methyl groups on the DNA major groove might
compress the DNA minor groove to relieve the induced steric interactions, which
ultimately affects Fe•BLM binding and cleavage in the minor groove. The reported
decrease in flexibility in methylated DNA90-92 may also play a key role in DNA binding
and cleavage by Fe•BLM.
Assuming that the introduction of methyl groups in the major groove of DNA is
the source of reduced cleavage in the DNA minor groove, it is logical to expect that the
removal of a methyl groups might increase Fe•BLM binding and cleavage. DNA binding
and cleavage studies involving hairpin DNAs have been carried out in DNAs having
(per)methylated major grooves, since all of the DNAs in the original hairpin DNA library
had thymidine residues within the randomized 8 base pair region. Hairpin DNA 9 had
76
five thymidine residues and two of which (T13 and T16) are primary sites of double-strand
cleavage.26 Replacement of these thymidines with deoxyuridines afforded DNA 9dU,
which augmented the binding affinity for Fe•BLM (Table 3.2) and demonstrated
increased DNA cleavage products (Table 3.3). Even though the differences in cleavage
involving DNAs 9 and 9-2dU were not large at room temperature, a 2-3 fold increase in
cleavage was noted for DNA 9-2dU after 25-30 minutes at 0 oC, where the rate of DNA
cleavage by Fe•BLM is slower.
The modulation of DNA minor groove width has been reported several times in
the past,93 as a consequence of the binding of proteins94,95 and hairpin polyamide DNA
binders96 to the DNA major groove. The present results offers an idea that Fe•BLM is
sensitive to the dimensions of the minor groove to distinguish even small changes in
geometry associated with the introduction of a methyl group to pyrimidines in the DNA
major groove.
In conclusion, we have demonstrated that methylation of cytidine not only
reduces the overall cleavages mediated by bleomycin but also changes the dsDNA
cleavage pattern. Cytidines, being a part of highly conserved CpG sequences, have direct
involvement in epigenetic gene regulation, developmental processes and cancer
biogenesis.97,98
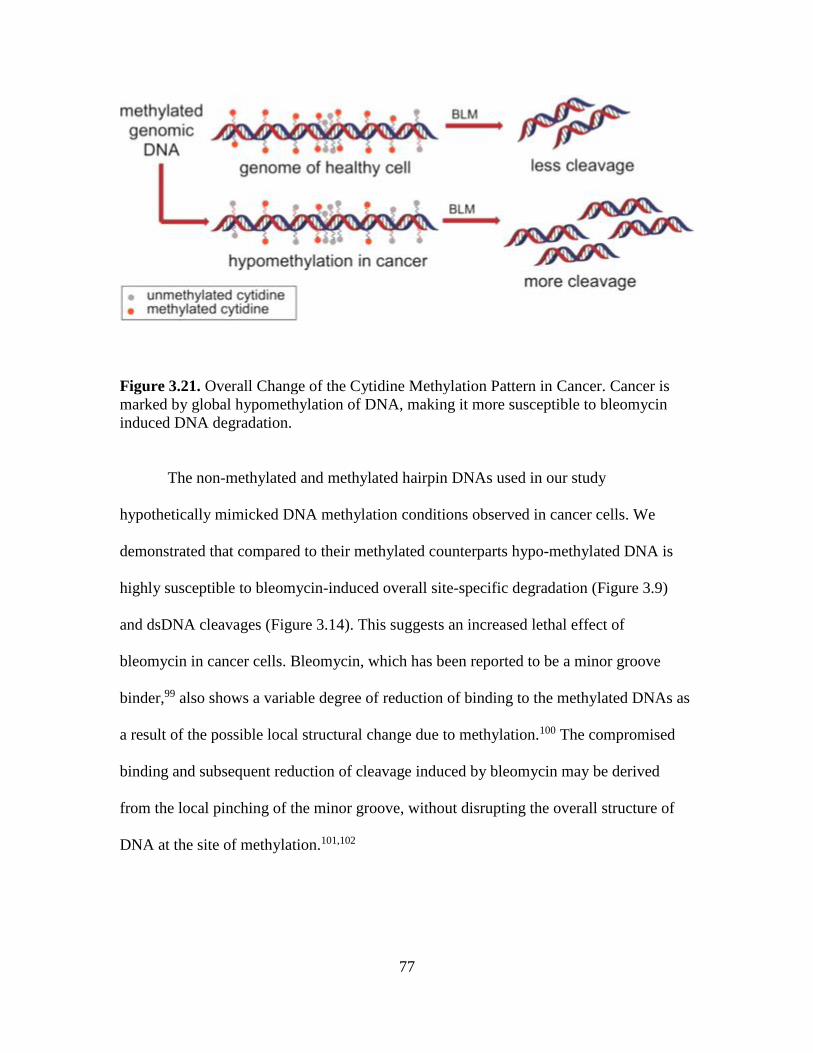
77
Figure 3.21. Overall Change of the Cytidine Methylation Pattern in Cancer. Cancer is
marked by global hypomethylation of DNA, making it more susceptible to bleomycin
induced DNA degradation.
The non-methylated and methylated hairpin DNAs used in our study
hypothetically mimicked DNA methylation conditions observed in cancer cells. We
demonstrated that compared to their methylated counterparts hypo-methylated DNA is
highly susceptible to bleomycin-induced overall site-specific degradation (Figure 3.9)
and dsDNA cleavages (Figure 3.14). This suggests an increased lethal effect of
bleomycin in cancer cells. Bleomycin, which has been reported to be a minor groove
binder,99 also shows a variable degree of reduction of binding to the methylated DNAs as
a result of the possible local structural change due to methylation.100 The compromised
binding and subsequent reduction of cleavage induced by bleomycin may be derived
from the local pinching of the minor groove, without disrupting the overall structure of
DNA at the site of methylation.101,102
78
Summarizing our findings in Figure 3.20, we posit that the potency of bleomycin
as an antitumor agent is affected by DNA methylation, providing a model to explain its
possible enhanced binding and degradation of DNA in cancer cells.
3.4. Experimental
3.4.1. Materials.
T4 polynucleotide kinase was purchased from New England Biolabs.
Recombinant terminal deoxynucleotidyl transferase was obtained from Roche Applied
Science. Radiolabeled nucleotides [γ-32P]-ATP and [α-32P]-cordycepin were purchased
from Perkin Elmer Life Sciences. Fe(NH4)2(SO4)2•6H2O and Chelex 100 were from
Sigma Aldrich. All the synthetic oligonucleotides including the hairpin DNAs were
obtained from Integrated DNA Technologies, Inc. The 16-nucleotide hairpin DNA-Cf15
was purchased from Chemgenes using nucleotide analogue Cf15 synthesized by M. P.
Alam. The 64 nucleotide hairpin DNA 11 was obtained from Chenhong Tang through a
rigorous selection process with the goal of obtaining hairpin DNAs tightly bound to
Fe(III)•BLM A5.
3.4.2. End Labeling and Purification of Hairpin DNAs and Their Methylated
Counterparts.
The hairpin DNAs were 32P-end labeled using a combination of [γ-32P]-ATP and
T4 polynucleotide kinase or [α-32P]-cordycepin and terminal deoxytransferase at the 5′
and 3′-ends, respectively. Ten pmol of 64-nucleotide hairpin DNAs were [5ʹ-32P]-end
labeled by incubation with 20 units of T4 polynucleotide kinase and 0.06 mCi [γ-32P]-
79
ATP (specific activity 6000 Ci (222 TBq)/mmol) in 50 μL (total volume) of 70 mM Tris-
HCl buffer, pH 7.6, containing 10 mM MgCl2 and 5 mM DTT. The reaction mixture was
incubated at 37 °C for 1 h followed by DNA purification by 16% polyacrylamide gel
electrophoresis at 1800 V for 2.5 h. The [3ʹ-32P]-end labeling was done by incubating 10
pmol of hairpin DNA with 20 units of terminal deoxynucleotidyl transferase and 0.06
mCi [α-32P]-ATP (specific activity 6000 Ci (222 TBq)/mmol) in 50 μL (total volume) of
70 mM Tris-HCl buffer, pH 7.6, containing 10 mM MgCl2, 10 mM CoCl2 and 5 mM
DTT. The reaction mixture was incubated at 37 °C for 1 h followed by purification of
DNA by 16% polyacrylamide gel electrophoresis at 1800 V for 2.5 h.
3.4.3. Double-Strand DNA Cleavage of Hairpin DNA 10, 10-Me, 10-2Me and 10-
3Me.
Bleomycin cleavage of 5ʹ and 3ʹ-end labeled hairpin DNAs was performed by
incubating the hairpin DNA (~30000 cpm) with 5 μM Fe2+ and 5 μM bleomycin A5 at 25
°C for 30 min in a 10 µL 10 mM Na cacodylate, pH 7.0 solution containing 2 mM
MgCl2. Two μL of native gel loading buffer containing 0.25% bromophenol blue, 0.25%
xylene cyanol and 40% D-sucrose were added to the reaction mixture, which was
separated on a 20% native polyacrylamide gel (200 V, 16 h, 4 °C ). Double-strand
cleavage sites were identified by visualizing co-migrating bands, using a
phosphorimager.

80
3.4.4. Maxam-Gilbert Sequencing Reaction.65
Ten µL of 5ʹ and 3ʹ-end labeled DNAs (~50000 cpm) were incubated with 25 µL
of formic acid at 25 °C for 5 min. The reactions were mixed with 200 µL of 0.3 M
sodium acetate, 0.1 mM EDTA, and 25 µg/mL E. coli tRNA. The resulting solutions
were immediately mixed with 700 µL ethanol to precipitate the DNAs. The DNA pellets
were washed twice with 70% ethanol, and the pellets were resuspended in 75 µL of 10%
piperidine. The reaction mixtures were incubated at 90 °C for 30 min and then chilled on
ice. The cooled supernatants were concentrated under diminished pressure. The DNA
pellets were washed with small amounts of water to remove residual piperidine and
mixed with denaturing loading buffer containing 80% formamide, 2 mM EDTA, 1%
bromophenol blue and 1% xylene cyanol. The combined solutions were heated at 90 °C
for 10 min and used as the sequencing lanes to compare [5-32P]-end and [3-32P]-end
labeled DNAs on denaturing polyacrylamide gels.
3.4.5. Sequence-Selective Cleavage of Radiolabeled Hairpin DNAs by BLM A5.
[5-32P]-end-labeled hairpin DNA 7, DNA 7-Me, DNA 10 and DNA 10-Me
(~50000 cpm) were incubated with 5 µM or 10 µM FeBLM A5 in a 5 µL reaction,
containing 10 mM Na cacodylate buffer, pH 7.0, for 30 min. Five µL of denaturing gel
loading buffer containing 98% formamide, 2 mM EDTA, 0.25% (w/v) bromophenol
blue, and 0.25% (w/v) xylene cyanol were added to the reaction mixture. The resulting
solutions were heated at 90 °C for 10 min followed by chilling on ice. Five µL of each
sample was loaded onto a denaturing gel (16% polyacrylamide and 7 M urea) along with
2 μL of 5-32P and [3-32P]-end labeled Maxam-Gilbert sequencing lanes to determine the
81
sequences of the cleavage sites. The gels were run at 50 W for 2.5 h. The gels were
visualized using a phosphorimager.
3.4.6. Fluorescence Competition Analysis of Hairpin DNAs.
Five µM 64- nucleotide hairpin DNA solutions were incubated with 5 µM
bleomycin A5 in 10 mM sodium cacodylate buffer solution, pH 7.0, at room temperature
for 20 min. The resulting solution was mixed with equimolar 16-nucleotide hairpin DNA
having Cf at cytidine15 (hairpin DNA-Cf15) and incubated at room temperature for 1 min.
Freshly prepared Fe(NH4)2(SO4)4 was added to the solution to a final concentration of 1
µM. In the final solution 16-nucleotide hairpin DNA, 64-nucleotide hairpin DNAs,
bleomycin and Fe2+ were all present at 1 µM concentration. The solution was maintained
at room temperature for 30 min. The same volume of buffer solution was added to the
control sample without Fe2+ and 64-nucleotide hairpin DNA. The fluorescence emission
was measured at 25 °C. The samples were excited at 310 nm, and the emission signal was
collected from 400 to 550 nm using an excitation slit width of 10 nm and an emission slit
width of 10 nm.
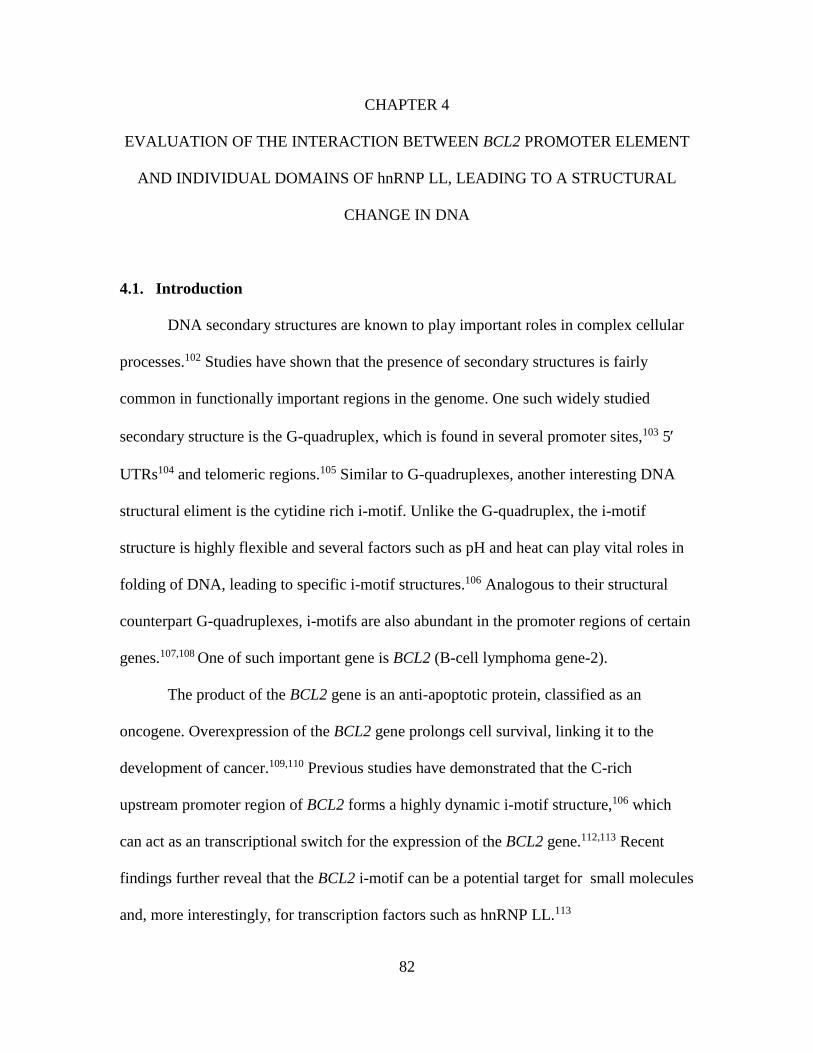
82
CHAPTER 4
EVALUATION OF THE INTERACTION BETWEEN BCL2 PROMOTER ELEMENT
AND INDIVIDUAL DOMAINS OF hnRNP LL, LEADING TO A STRUCTURAL
CHANGE IN DNA
4.1. Introduction
DNA secondary structures are known to play important roles in complex cellular
processes.102 Studies have shown that the presence of secondary structures is fairly
common in functionally important regions in the genome. One such widely studied
secondary structure is the G-quadruplex, which is found in several promoter sites,103 5
UTRs104 and telomeric regions.105 Similar to G-quadruplexes, another interesting DNA
structural eliment is the cytidine rich i-motif. Unlike the G-quadruplex, the i-motif
structure is highly flexible and several factors such as pH and heat can play vital roles in
folding of DNA, leading to specific i-motif structures.106 Analogous to their structural
counterpart G-quadruplexes, i-motifs are also abundant in the promoter regions of certain
genes.107,108 One of such important gene is BCL2 (B-cell lymphoma gene-2).
The product of the BCL2 gene is an anti-apoptotic protein, classified as an
oncogene. Overexpression of the BCL2 gene prolongs cell survival, linking it to the
development of cancer.109,110 Previous studies have demonstrated that the C-rich
upstream promoter region of BCL2 forms a highly dynamic i-motif structure,106 which
can act as an transcriptional switch for the expression of the BCL2 gene.112,113 Recent
findings further reveal that the BCL2 i-motif can be a potential target for small molecules
and, more interestingly, for transcription factors such as hnRNP LL.113
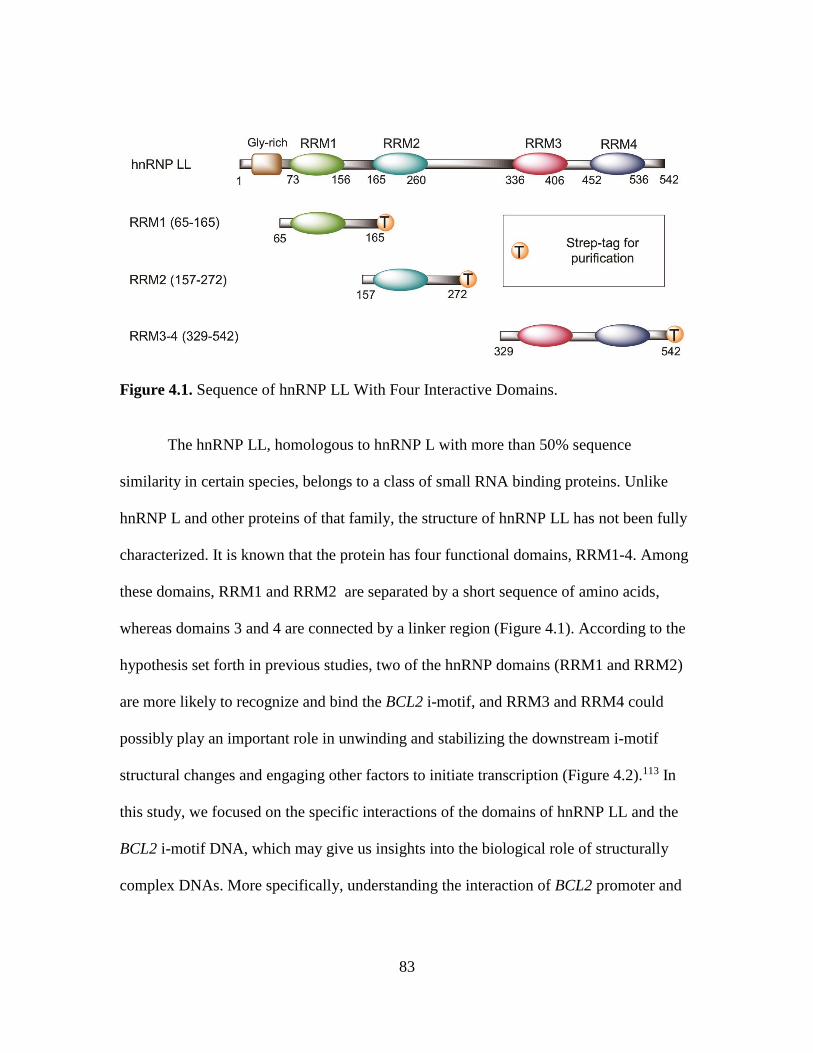
83
Figure 4.1. Sequence of hnRNP LL With Four Interactive Domains.
The hnRNP LL, homologous to hnRNP L with more than 50% sequence
similarity in certain species, belongs to a class of small RNA binding proteins. Unlike
hnRNP L and other proteins of that family, the structure of hnRNP LL has not been fully
characterized. It is known that the protein has four functional domains, RRM1-4. Among
these domains, RRM1 and RRM2 are separated by a short sequence of amino acids,
whereas domains 3 and 4 are connected by a linker region (Figure 4.1). According to the
hypothesis set forth in previous studies, two of the hnRNP domains (RRM1 and RRM2)
are more likely to recognize and bind the BCL2 i-motif, and RRM3 and RRM4 could
possibly play an important role in unwinding and stabilizing the downstream i-motif
structural changes and engaging other factors to initiate transcription (Figure 4.2).113 In
this study, we focused on the specific interactions of the domains of hnRNP LL and the
BCL2 i-motif DNA, which may give us insights into the biological role of structurally
complex DNAs. More specifically, understanding the interaction of BCL2 promoter and
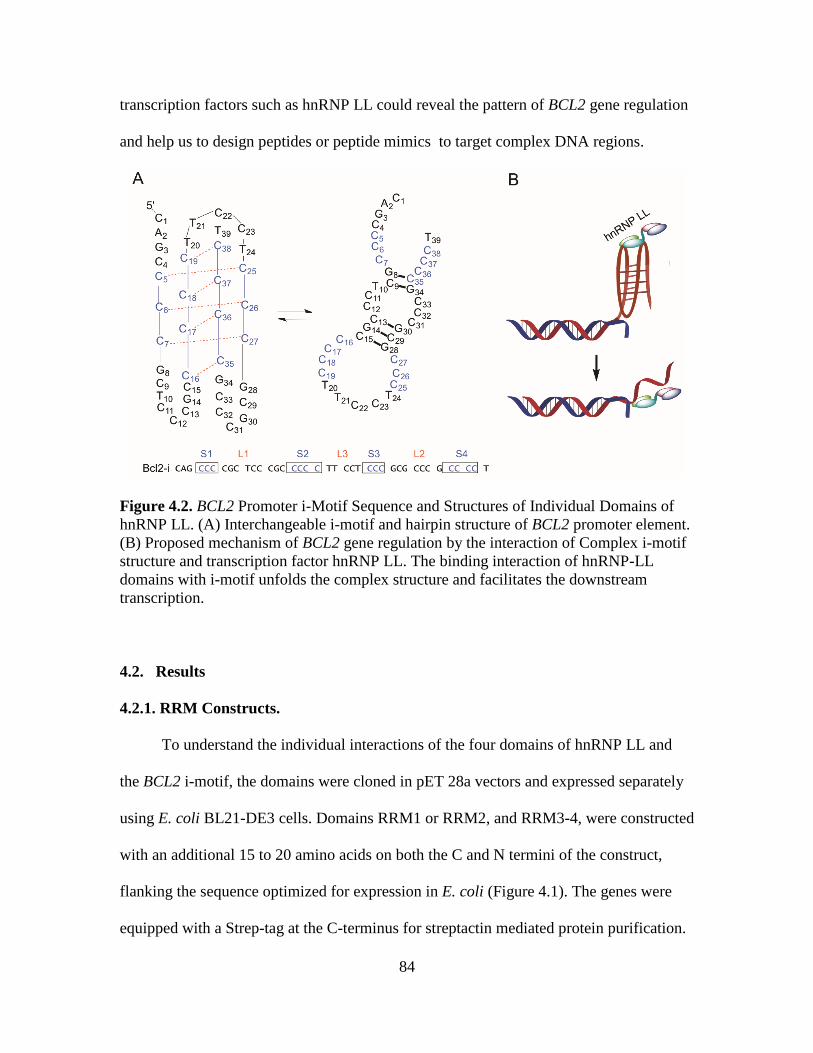
84
transcription factors such as hnRNP LL could reveal the pattern of BCL2 gene regulation
and help us to design peptides or peptide mimics to target complex DNA regions.
Figure 4.2. BCL2 Promoter i-Motif Sequence and Structures of Individual Domains of
hnRNP LL. (A) Interchangeable i-motif and hairpin structure of BCL2 promoter element.
(B) Proposed mechanism of BCL2 gene regulation by the interaction of Complex i-motif
structure and transcription factor hnRNP LL. The binding interaction of hnRNP-LL
domains with i-motif unfolds the complex structure and facilitates the downstream
transcription.
4.2. Results
4.2.1. RRM Constructs.
To understand the individual interactions of the four domains of hnRNP LL and
the BCL2 i-motif, the domains were cloned in pET 28a vectors and expressed separately
using E. coli BL21-DE3 cells. Domains RRM1 or RRM2, and RRM3-4, were constructed
with an additional 15 to 20 amino acids on both the C and N termini of the construct,
flanking the sequence optimized for expression in E. coli (Figure 4.1). The genes were
equipped with a Strep-tag at the C-terminus for streptactin mediated protein purification.
85
The domain structures as illustrated in Figure 4.3 were determined by sequence
homology interpretation based on other well characterized homologous proteins of the
family.
Figure 4.3. Predicted Structures of RRM1, RRM2 and RRM3-4 Based on Sequence H-
Homology With Other Members of That Protein Family.
The three-dimensional structure of RRM1 was modeled with reference to the solution
structure of N-terminus mouse protein BAB28521 (PDB ID: 1WEX). Similarly, the
structure of RRM2 was predicted in reference with the solution structure of mouse
hnRNP LL RRM2 (PDB ID: 2E5I), whereas RRM3-4 was modeled based on the crystal
structure of human hnRNP L (PDB ID: 3TO8).
4.2.2. Study of the Binding Interaction Between Domains and i-Motif.
The binding interactions between each of the three constructs containing the four
domains of hnRNP LL and the i-motif were studied by employing a gel shift assay. As
postulated in previous studies, RRM1 and RRM2 showed strong binding to the DNA
(Figure 4.4A and B) when the DNA to hnRNP LL domains molar ratio was varied from 1
to 8 equivalents. Furthermore, both domains were shown to interact with the i-motif
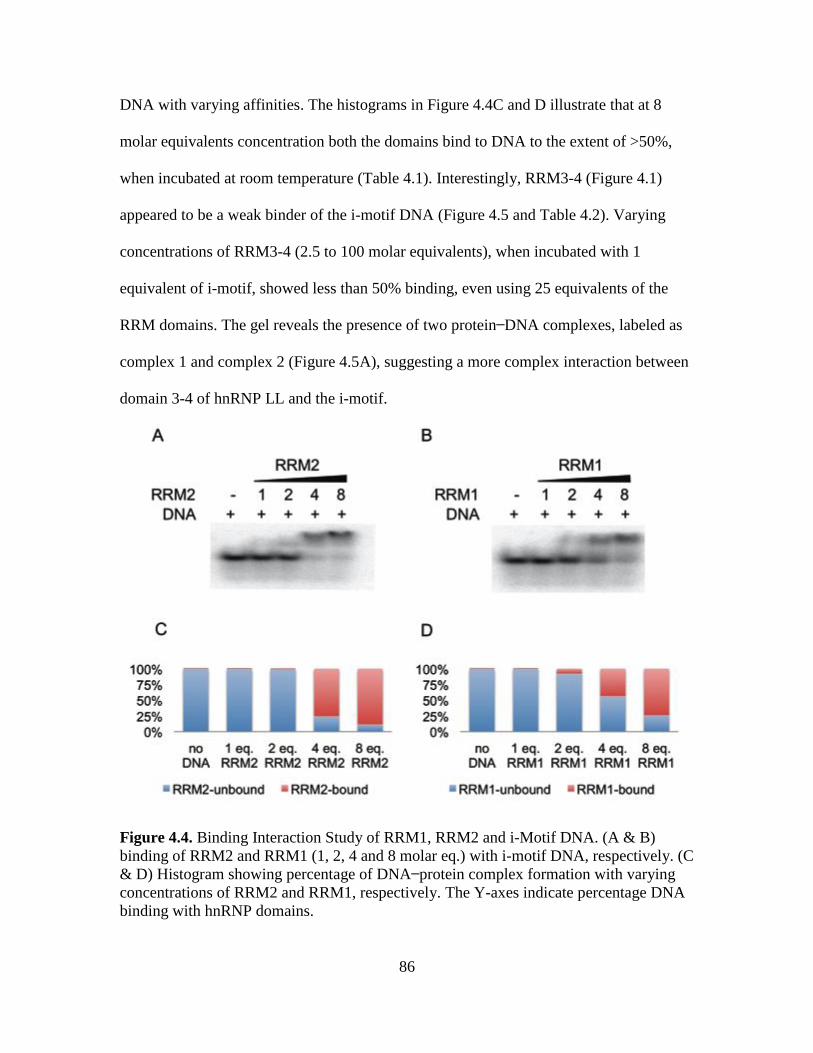
86
DNA with varying affinities. The histograms in Figure 4.4C and D illustrate that at 8
molar equivalents concentration both the domains bind to DNA to the extent of >50%,
when incubated at room temperature (Table 4.1). Interestingly, RRM3-4 (Figure 4.1)
appeared to be a weak binder of the i-motif DNA (Figure 4.5 and Table 4.2). Varying
concentrations of RRM3-4 (2.5 to 100 molar equivalents), when incubated with 1
equivalent of i-motif, showed less than 50% binding, even using 25 equivalents of the
RRM domains. The gel reveals the presence of two protein DNA complexes, labeled as
complex 1 and complex 2 (Figure 4.5A), suggesting a more complex interaction between
domain 3-4 of hnRNP LL and the i-motif.
Figure 4.4. Binding Interaction Study of RRM1, RRM2 and i-Motif DNA. (A & B)
binding of RRM2 and RRM1 (1, 2, 4 and 8 molar eq.) with i-motif DNA, respectively. (C
& D) Histogram showing percentage of DNA protein complex formation with varying
concentrations of RRM2 and RRM1, respectively. The Y-axes indicate percentage DNA
binding with hnRNP domains.
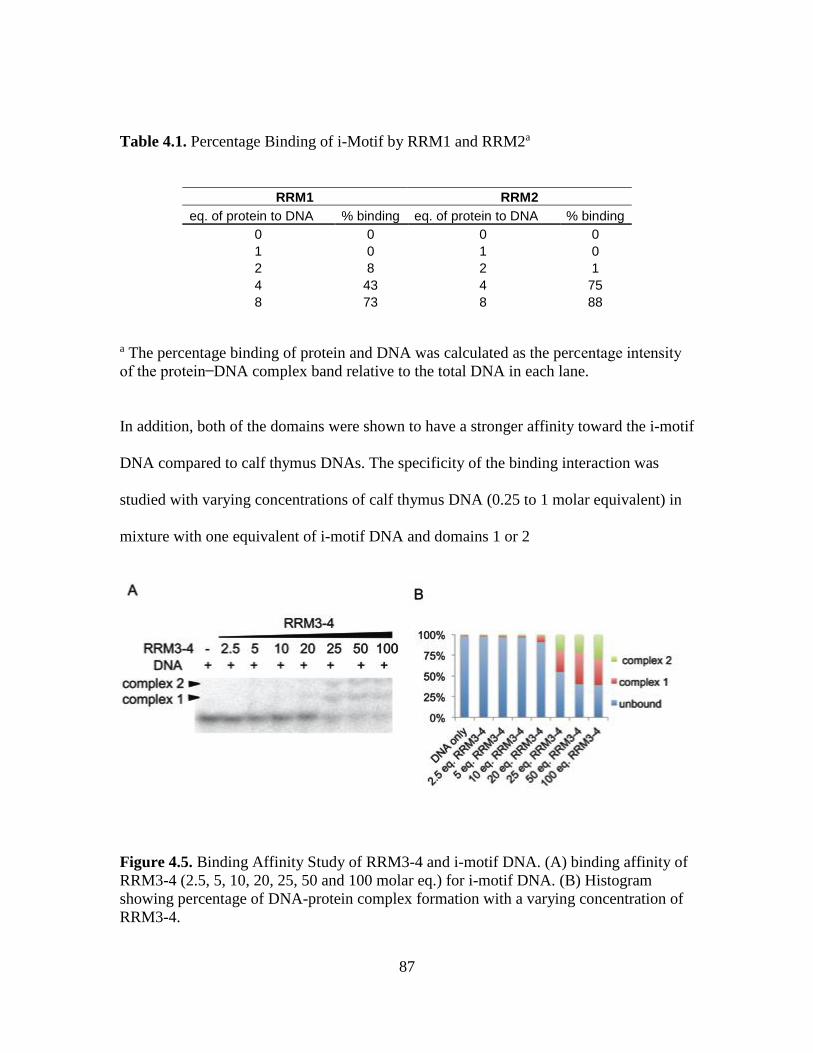
87
Table 4.1. Percentage Binding of i-Motif by RRM1 and RRM2a
RRM1 RRM2
eq. of protein to DNA % binding eq. of protein to DNA % binding
0 0 0 0
1 0 1 0
2 8 2 1
4 43 4 75
8 73 8 88
a The percentage binding of protein and DNA was calculated as the percentage intensity
of the protein DNA complex band relative to the total DNA in each lane.
In addition, both of the domains were shown to have a stronger affinity toward the i-motif
DNA compared to calf thymus DNAs. The specificity of the binding interaction was
studied with varying concentrations of calf thymus DNA (0.25 to 1 molar equivalent) in
mixture with one equivalent of i-motif DNA and domains 1 or 2
Figure 4.5. Binding Affinity Study of RRM3-4 and i-motif DNA. (A) binding affinity of
RRM3-4 (2.5, 5, 10, 20, 25, 50 and 100 molar eq.) for i-motif DNA. (B) Histogram
showing percentage of DNA-protein complex formation with a varying concentration of
RRM3-4.
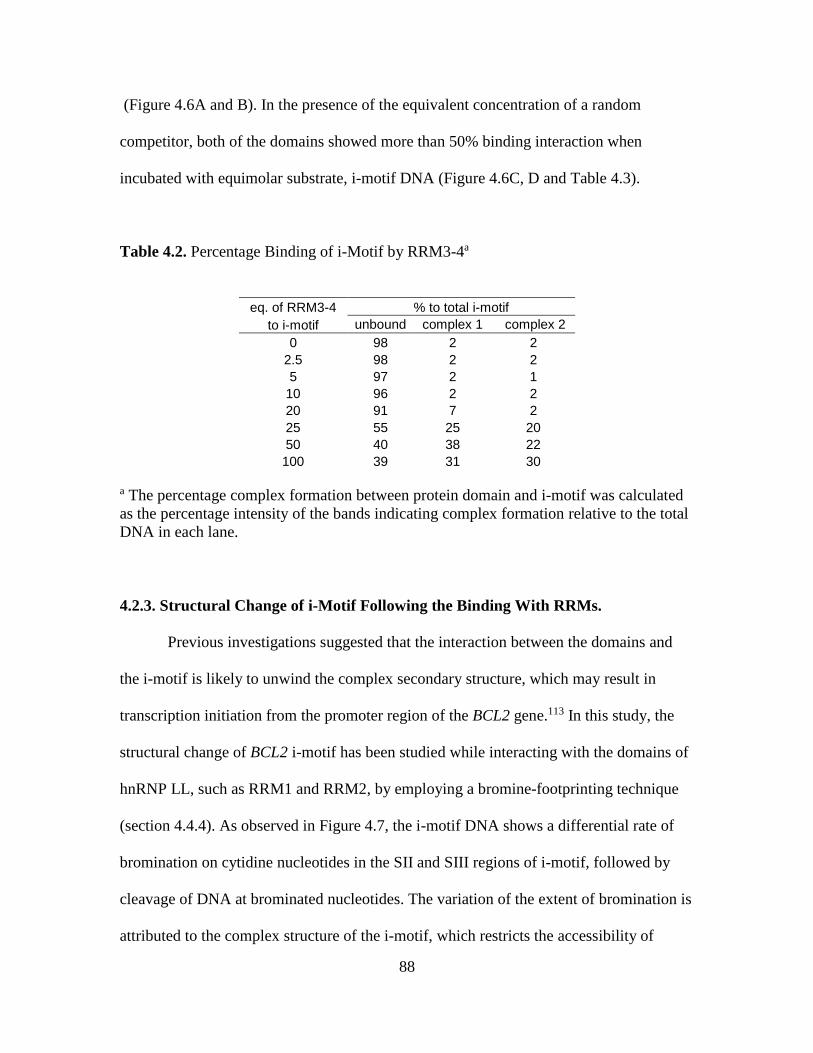
88
(Figure 4.6A and B). In the presence of the equivalent concentration of a random
competitor, both of the domains showed more than 50% binding interaction when
incubated with equimolar substrate, i-motif DNA (Figure 4.6C, D and Table 4.3).
Table 4.2. Percentage Binding of i-Motif by RRM3-4a
eq. of RRM3-4 % to total i-motif
to i-motif unbound complex 1 complex 2
0 98 2 2
2.5 98 2 2
5 97 2 1
10 96 2 2
20 91 7 2
25 55 25 20
50 40 38 22
100 39 31 30
a The percentage complex formation between protein domain and i-motif was calculated
as the percentage intensity of the bands indicating complex formation relative to the total
DNA in each lane.
4.2.3. Structural Change of i-Motif Following the Binding With RRMs.
Previous investigations suggested that the interaction between the domains and
the i-motif is likely to unwind the complex secondary structure, which may result in
transcription initiation from the promoter region of the BCL2 gene.113 In this study, the
structural change of BCL2 i-motif has been studied while interacting with the domains of
hnRNP LL, such as RRM1 and RRM2, by employing a bromine-footprinting technique
(section 4.4.4). As observed in Figure 4.7, the i-motif DNA shows a differential rate of
bromination on cytidine nucleotides in the SII and SIII regions of i-motif, followed by
cleavage of DNA at brominated nucleotides. The variation of the extent of bromination is
attributed to the complex structure of the i-motif, which restricts the accessibility of
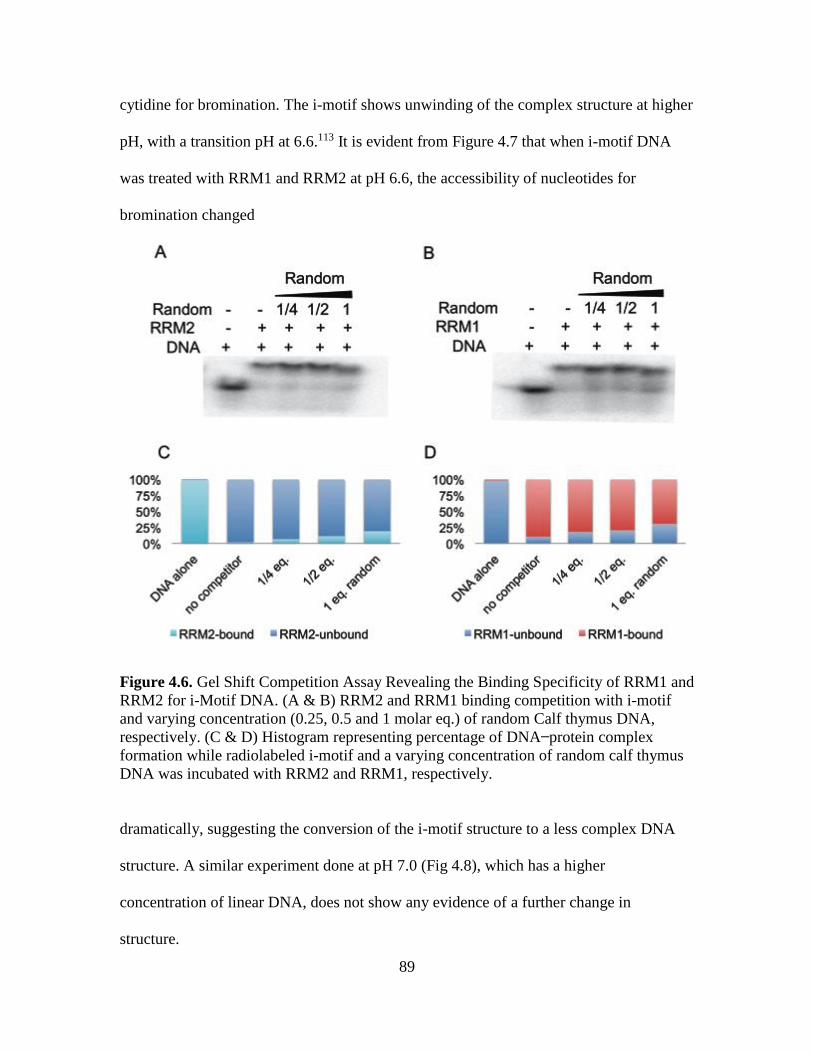
89
cytidine for bromination. The i-motif shows unwinding of the complex structure at higher
pH, with a transition pH at 6.6.113 It is evident from Figure 4.7 that when i-motif DNA
was treated with RRM1 and RRM2 at pH 6.6, the accessibility of nucleotides for
bromination changed
Figure 4.6. Gel Shift Competition Assay Revealing the Binding Specificity of RRM1 and
RRM2 for i-Motif DNA. (A & B) RRM2 and RRM1 binding competition with i-motif
and varying concentration (0.25, 0.5 and 1 molar eq.) of random Calf thymus DNA,
respectively. (C & D) Histogram representing percentage of DNA protein complex
formation while radiolabeled i-motif and a varying concentration of random calf thymus
DNA was incubated with RRM2 and RRM1, respectively.
dramatically, suggesting the conversion of the i-motif structure to a less complex DNA
structure. A similar experiment done at pH 7.0 (Fig 4.8), which has a higher
concentration of linear DNA, does not show any evidence of a further change in
structure.
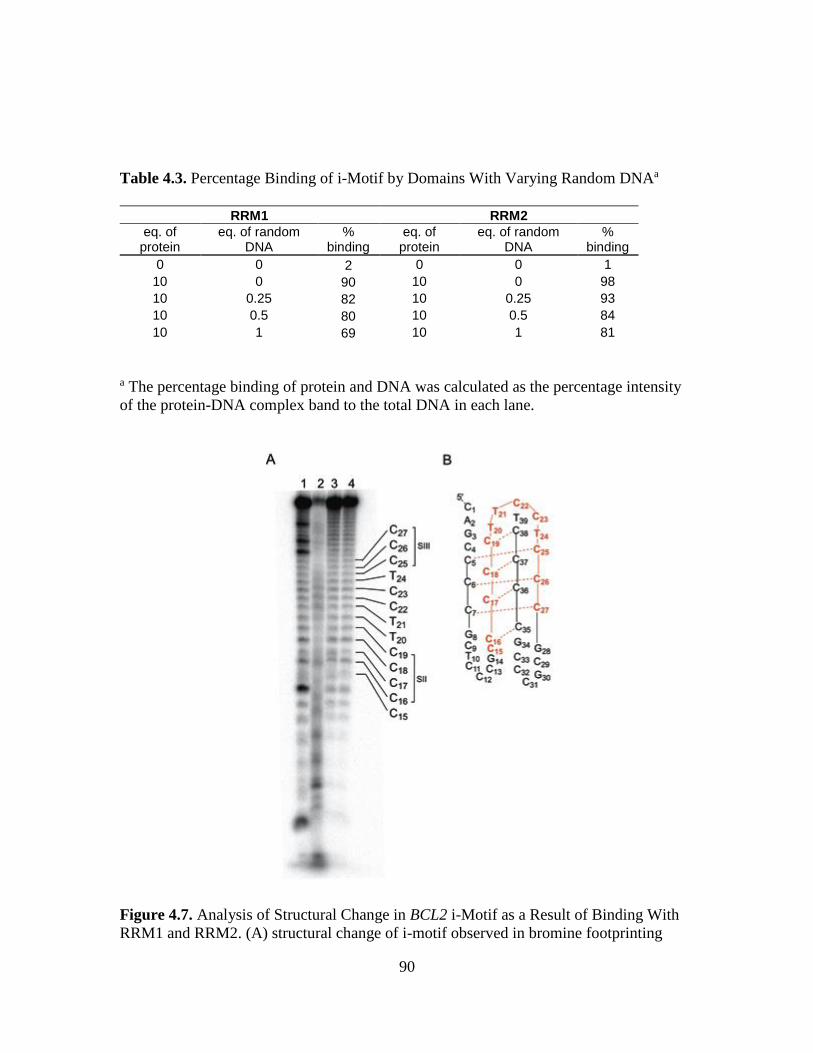
90
Table 4.3. Percentage Binding of i-Motif by Domains With Varying Random DNAa
RRM1 RRM2
eq. of protein
eq. of random DNA
% binding
eq. of protein
eq. of random DNA
% binding
0 0 2 0 0 1
10 0 90 10 0 98
10 0.25 82 10 0.25 93
10 0.5 80 10 0.5 84
10 1 69 10 1 81
a The percentage binding of protein and DNA was calculated as the percentage intensity
of the protein-DNA complex band to the total DNA in each lane.
Figure 4.7. Analysis of Structural Change in BCL2 i-Motif as a Result of Binding With
RRM1 and RRM2. (A) structural change of i-motif observed in bromine footprinting
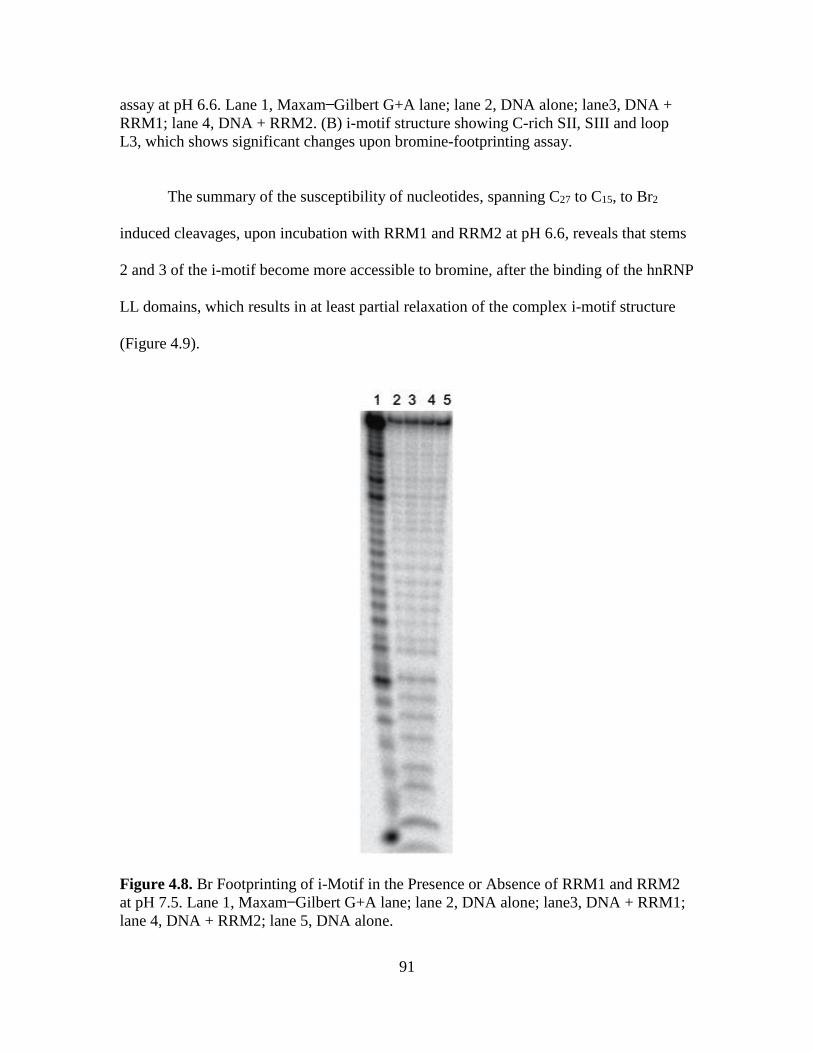
91
assay at pH 6.6. Lane 1, Maxam Gilbert G+A lane; lane 2, DNA alone; lane3, DNA +
RRM1; lane 4, DNA + RRM2. (B) i-motif structure showing C-rich SII, SIII and loop
L3, which shows significant changes upon bromine-footprinting assay.
The summary of the susceptibility of nucleotides, spanning C27 to C15, to Br2
induced cleavages, upon incubation with RRM1 and RRM2 at pH 6.6, reveals that stems
2 and 3 of the i-motif become more accessible to bromine, after the binding of the hnRNP
LL domains, which results in at least partial relaxation of the complex i-motif structure
(Figure 4.9).
Figure 4.8. Br Footprinting of i-Motif in the Presence or Absence of RRM1 and RRM2
at pH 7.5. Lane 1, Maxam Gilbert G+A lane; lane 2, DNA alone; lane3, DNA + RRM1;
lane 4, DNA + RRM2; lane 5, DNA alone.
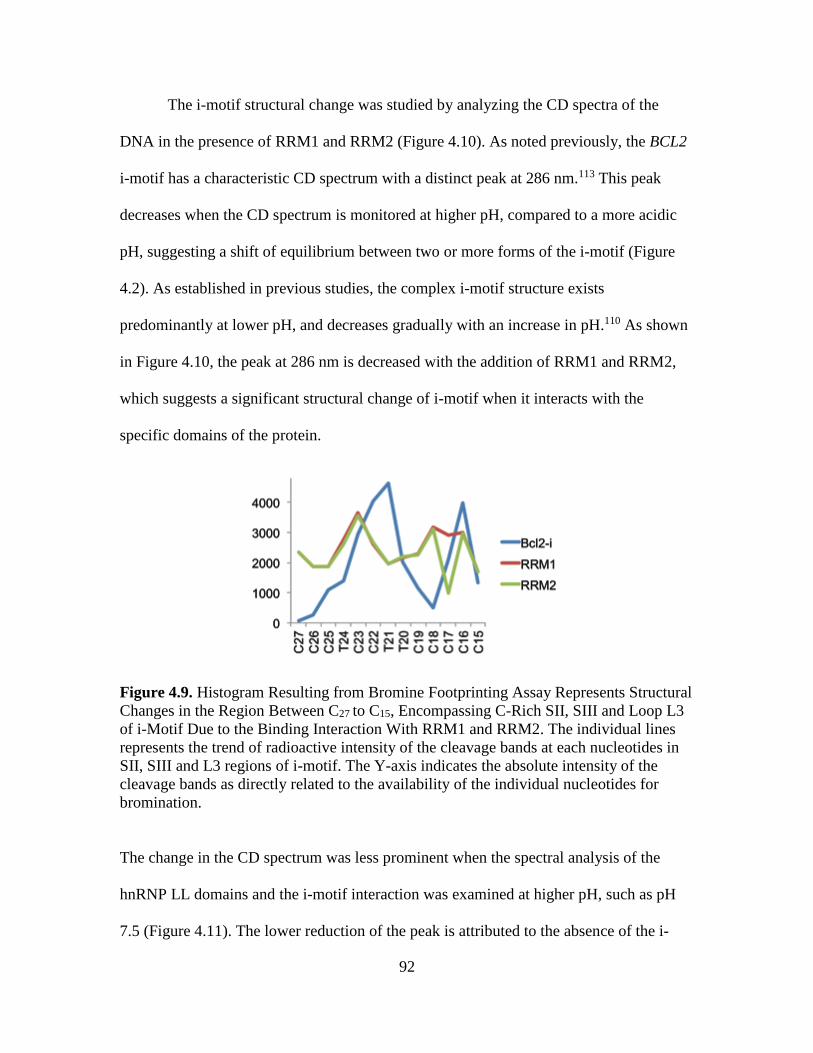
92
The i-motif structural change was studied by analyzing the CD spectra of the
DNA in the presence of RRM1 and RRM2 (Figure 4.10). As noted previously, the BCL2
i-motif has a characteristic CD spectrum with a distinct peak at 286 nm.113 This peak
decreases when the CD spectrum is monitored at higher pH, compared to a more acidic
pH, suggesting a shift of equilibrium between two or more forms of the i-motif (Figure
4.2). As established in previous studies, the complex i-motif structure exists
predominantly at lower pH, and decreases gradually with an increase in pH.110 As shown
in Figure 4.10, the peak at 286 nm is decreased with the addition of RRM1 and RRM2,
which suggests a significant structural change of i-motif when it interacts with the
specific domains of the protein.
Figure 4.9. Histogram Resulting from Bromine Footprinting Assay Represents Structural
Changes in the Region Between C27 to C15, Encompassing C-Rich SII, SIII and Loop L3
of i-Motif Due to the Binding Interaction With RRM1 and RRM2. The individual lines
represents the trend of radioactive intensity of the cleavage bands at each nucleotides in
SII, SIII and L3 regions of i-motif. The Y-axis indicates the absolute intensity of the
cleavage bands as directly related to the availability of the individual nucleotides for
bromination.
The change in the CD spectrum was less prominent when the spectral analysis of the
hnRNP LL domains and the i-motif interaction was examined at higher pH, such as pH
7.5 (Figure 4.11). The lower reduction of the peak is attributed to the absence of the i-
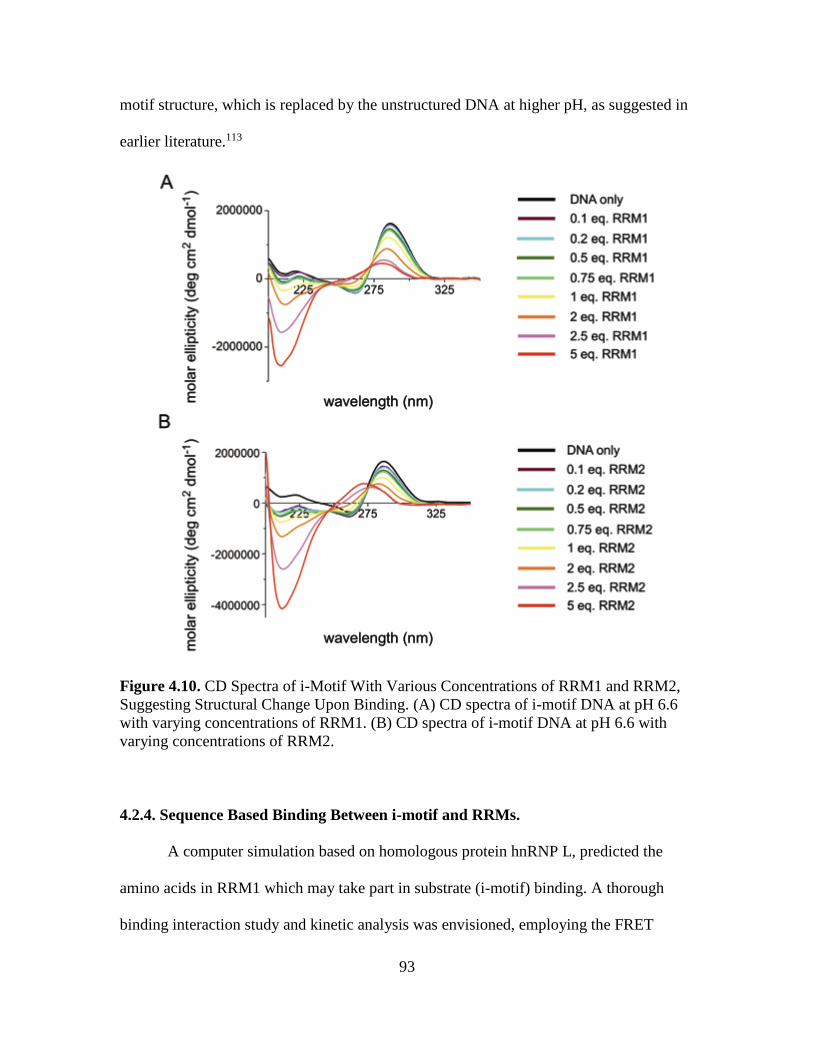
93
motif structure, which is replaced by the unstructured DNA at higher pH, as suggested in
earlier literature.113
Figure 4.10. CD Spectra of i-Motif With Various Concentrations of RRM1 and RRM2,
Suggesting Structural Change Upon Binding. (A) CD spectra of i-motif DNA at pH 6.6
with varying concentrations of RRM1. (B) CD spectra of i-motif DNA at pH 6.6 with
varying concentrations of RRM2.
4.2.4. Sequence Based Binding Between i-motif and RRMs.
A computer simulation based on homologous protein hnRNP L, predicted the
amino acids in RRM1 which may take part in substrate (i-motif) binding. A thorough
binding interaction study and kinetic analysis was envisioned, employing the FRET

94
technique. In previous studies, the lateral loops 1 and 2 of the i-motif DNA (Figure 4.2)
were found to interact with RRM1 and RRM2.113 In order to determine which region of
the i-motif interacts with RRM1 and RRM2, several modified i-motif DNAs were
synthesized (Figure 4.12) and their binding interactions with RRM1 and RRM2 were
studied (Figure 4.13).
Figure 4.11. CD Spectra of i-Motif and RRM1 (A), RRM2 (B) Interaction at pH 7.5.
The CD spectra of the modified i-motifs reveals that a point mutation in the C-
rich i-motif stem did not alter the equilibrium between the i-motif structures, which is
evident in a small reduction of the i-motif peak at 286 (Figure 4.12A). Interestingly, the
mutations in the loop structures of the DNA reveal that the nucleotide sequences of the
L1 and L2 loops are essential for i-motif structure whereas loop L3 plays a less important
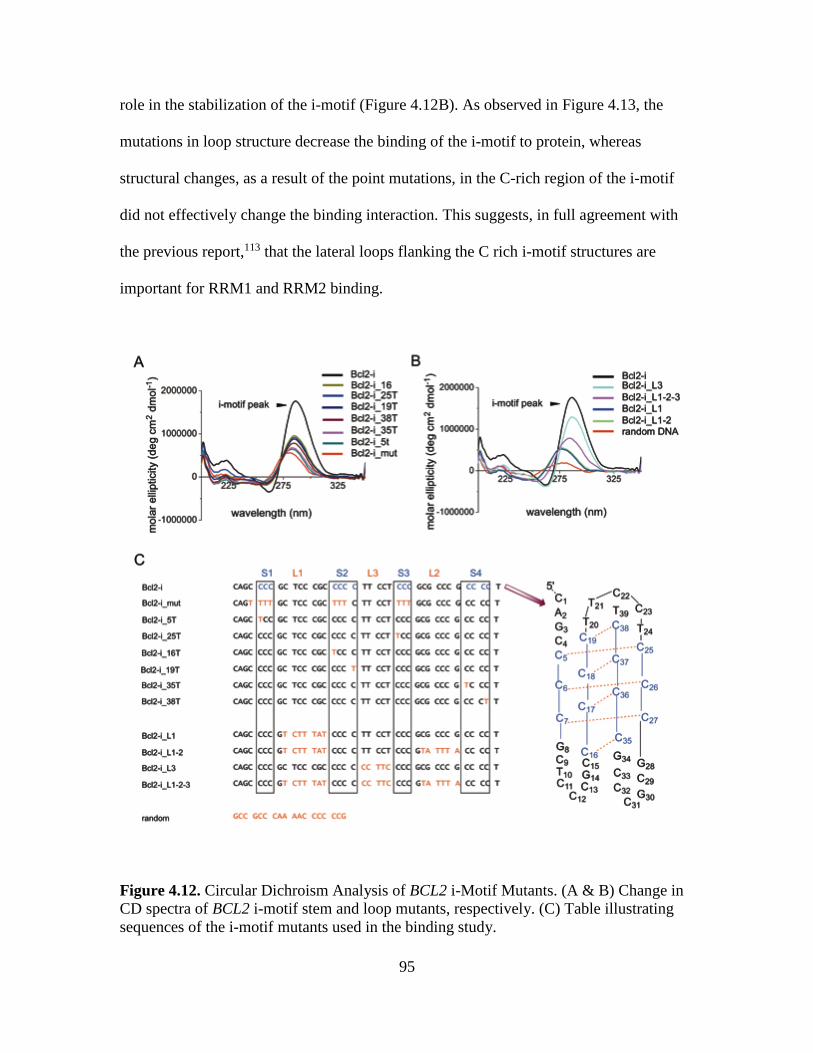
95
role in the stabilization of the i-motif (Figure 4.12B). As observed in Figure 4.13, the
mutations in loop structure decrease the binding of the i-motif to protein, whereas
structural changes, as a result of the point mutations, in the C-rich region of the i-motif
did not effectively change the binding interaction. This suggests, in full agreement with
the previous report,113 that the lateral loops flanking the C rich i-motif structures are
important for RRM1 and RRM2 binding.
Figure 4.12. Circular Dichroism Analysis of BCL2 i-Motif Mutants. (A & B) Change in
CD spectra of BCL2 i-motif stem and loop mutants, respectively. (C) Table illustrating
sequences of the i-motif mutants used in the binding study.
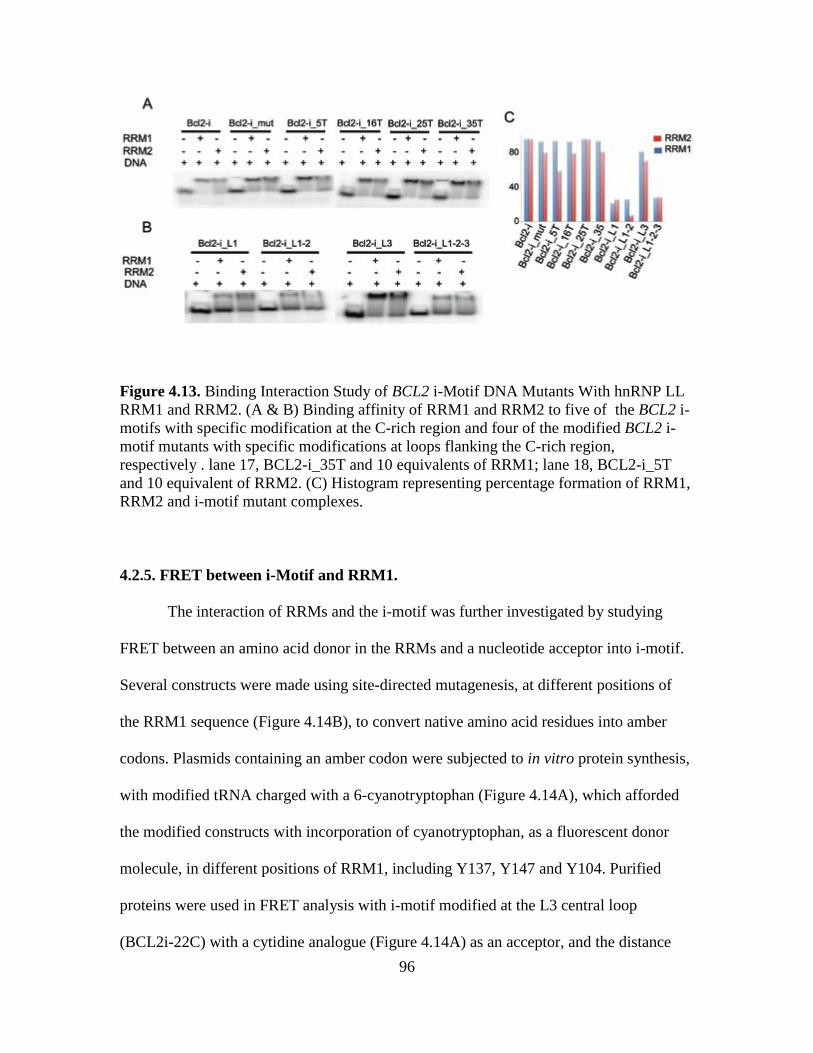
96
Figure 4.13. Binding Interaction Study of BCL2 i-Motif DNA Mutants With hnRNP LL
RRM1 and RRM2. (A & B) Binding affinity of RRM1 and RRM2 to five of the BCL2 i-
motifs with specific modification at the C-rich region and four of the modified BCL2 i-
motif mutants with specific modifications at loops flanking the C-rich region,
respectively . lane 17, BCL2-i_35T and 10 equivalents of RRM1; lane 18, BCL2-i_5T
and 10 equivalent of RRM2. (C) Histogram representing percentage formation of RRM1,
RRM2 and i-motif mutant complexes.
4.2.5. FRET between i-Motif and RRM1.
The interaction of RRMs and the i-motif was further investigated by studying
FRET between an amino acid donor in the RRMs and a nucleotide acceptor into i-motif.
Several constructs were made using site-directed mutagenesis, at different positions of
the RRM1 sequence (Figure 4.14B), to convert native amino acid residues into amber
codons. Plasmids containing an amber codon were subjected to in vitro protein synthesis,
with modified tRNA charged with a 6-cyanotryptophan (Figure 4.14A), which afforded
the modified constructs with incorporation of cyanotryptophan, as a fluorescent donor
molecule, in different positions of RRM1, including Y137, Y147 and Y104. Purified
proteins were used in FRET analysis with i-motif modified at the L3 central loop
(BCL2i-22C) with a cytidine analogue (Figure 4.14A) as an acceptor, and the distance
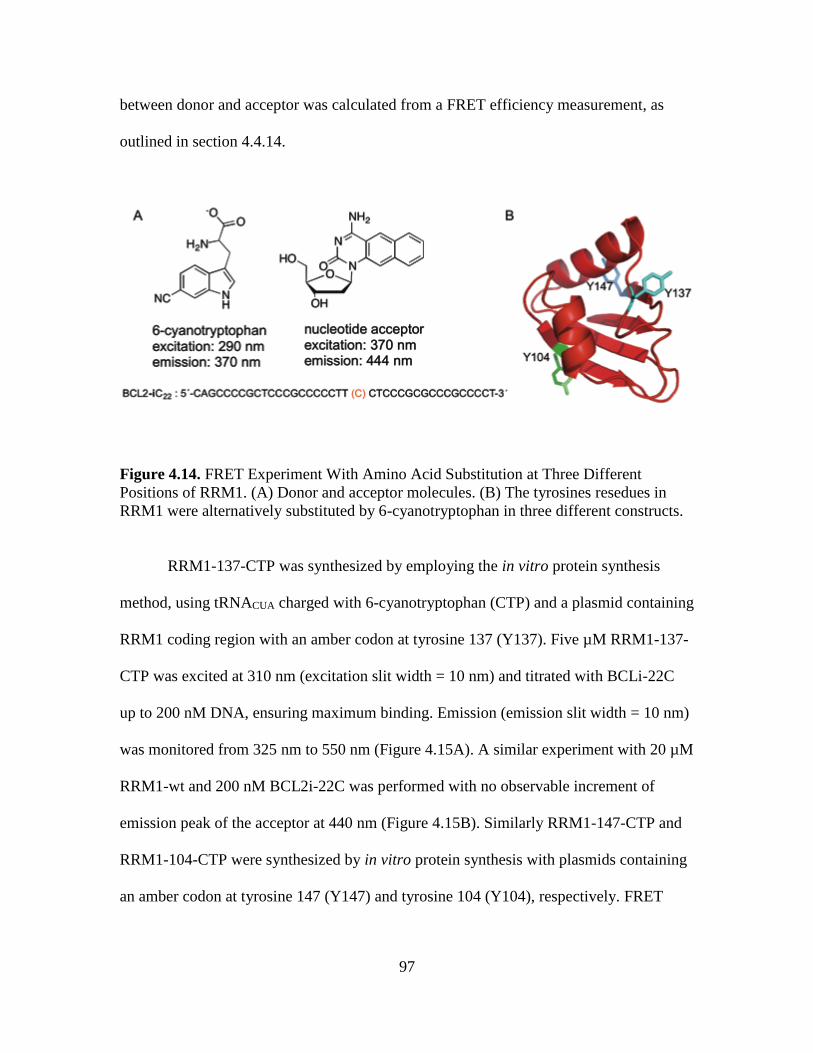
97
between donor and acceptor was calculated from a FRET efficiency measurement, as
outlined in section 4.4.14.
Figure 4.14. FRET Experiment With Amino Acid Substitution at Three Different
Positions of RRM1. (A) Donor and acceptor molecules. (B) The tyrosines resedues in
RRM1 were alternatively substituted by 6-cyanotryptophan in three different constructs.
RRM1-137-CTP was synthesized by employing the in vitro protein synthesis
method, using tRNACUA charged with 6-cyanotryptophan (CTP) and a plasmid containing
RRM1 coding region with an amber codon at tyrosine 137 (Y137). Five µM RRM1-137-
CTP was excited at 310 nm (excitation slit width = 10 nm) and titrated with BCLi-22C
up to 200 nM DNA, ensuring maximum binding. Emission (emission slit width = 10 nm)
was monitored from 325 nm to 550 nm (Figure 4.15A). A similar experiment with 20 µM
RRM1-wt and 200 nM BCL2i-22C was performed with no observable increment of
emission peak of the acceptor at 440 nm (Figure 4.15B). Similarly RRM1-147-CTP and
RRM1-104-CTP were synthesized by in vitro protein synthesis with plasmids containing
an amber codon at tyrosine 147 (Y147) and tyrosine 104 (Y104), respectively. FRET
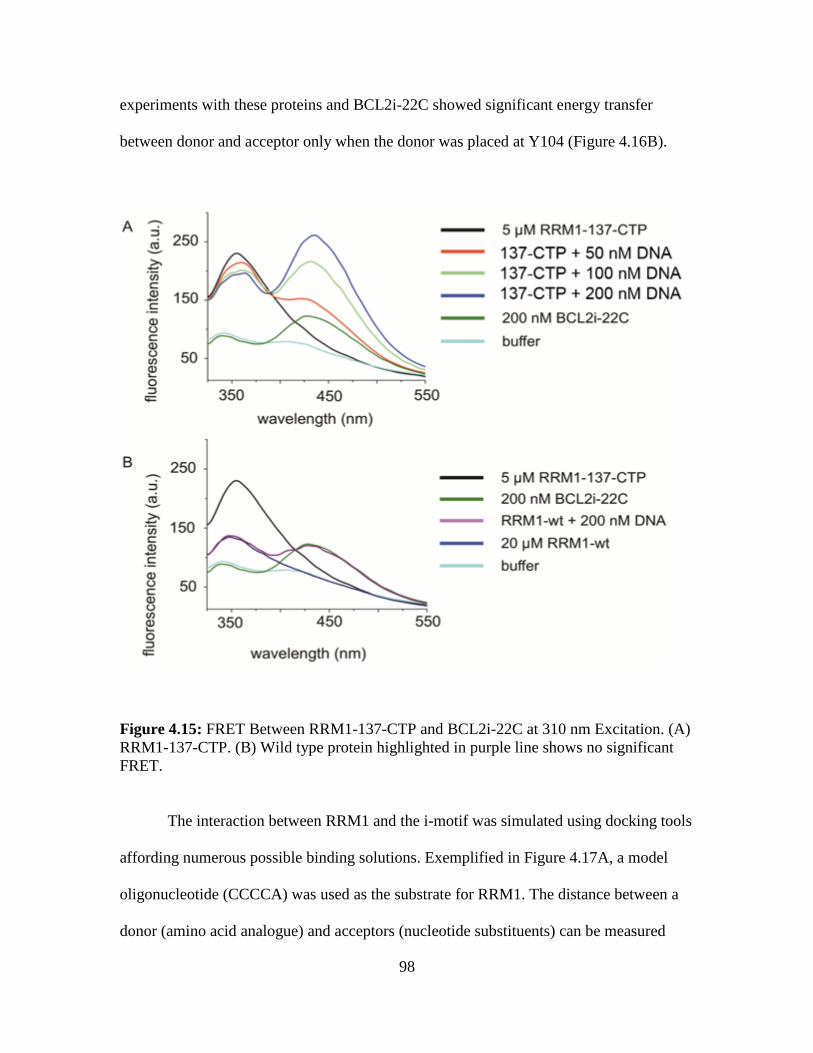
98
experiments with these proteins and BCL2i-22C showed significant energy transfer
between donor and acceptor only when the donor was placed at Y104 (Figure 4.16B).
Figure 4.15: FRET Between RRM1-137-CTP and BCL2i-22C at 310 nm Excitation. (A)
RRM1-137-CTP. (B) Wild type protein highlighted in purple line shows no significant
FRET.
The interaction between RRM1 and the i-motif was simulated using docking tools
affording numerous possible binding solutions. Exemplified in Figure 4.17A, a model
oligonucleotide (CCCCA) was used as the substrate for RRM1. The distance between a
donor (amino acid analogue) and acceptors (nucleotide substituents) can be measured
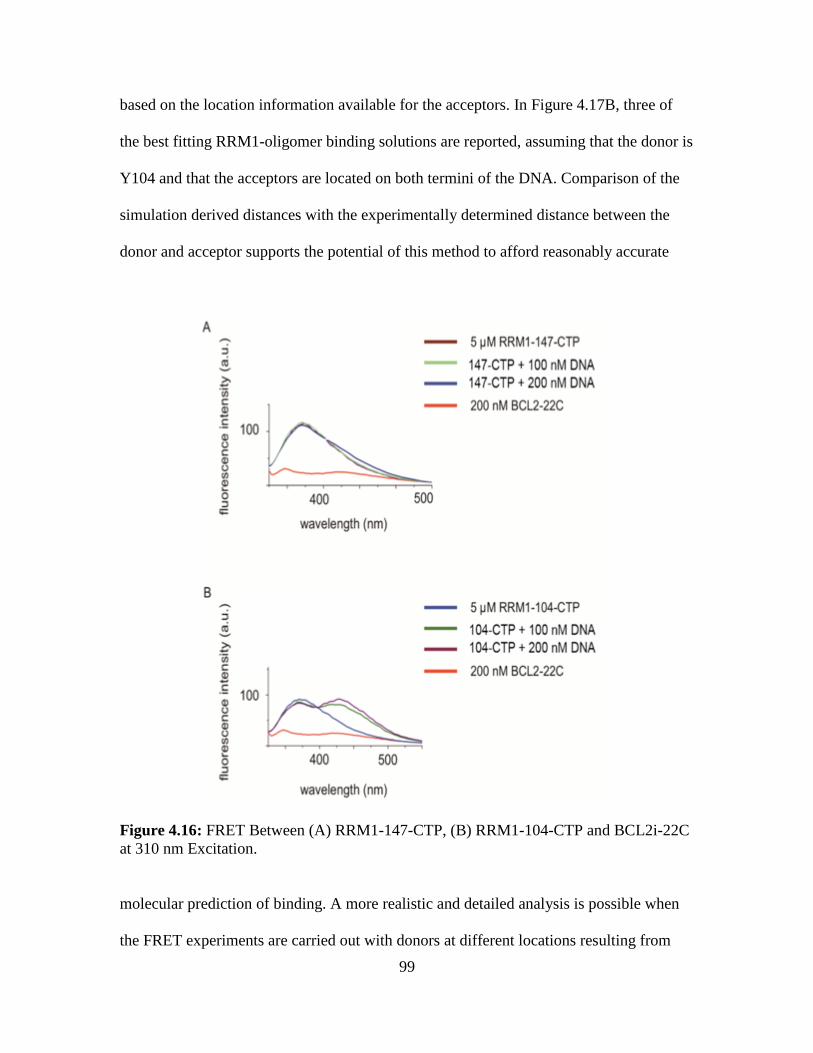
99
based on the location information available for the acceptors. In Figure 4.17B, three of
the best fitting RRM1-oligomer binding solutions are reported, assuming that the donor is
Y104 and that the acceptors are located on both termini of the DNA. Comparison of the
simulation derived distances with the experimentally determined distance between the
donor and acceptor supports the potential of this method to afford reasonably accurate
Figure 4.16: FRET Between (A) RRM1-147-CTP, (B) RRM1-104-CTP and BCL2i-22C
at 310 nm Excitation.
molecular prediction of binding. A more realistic and detailed analysis is possible when
the FRET experiments are carried out with donors at different locations resulting from
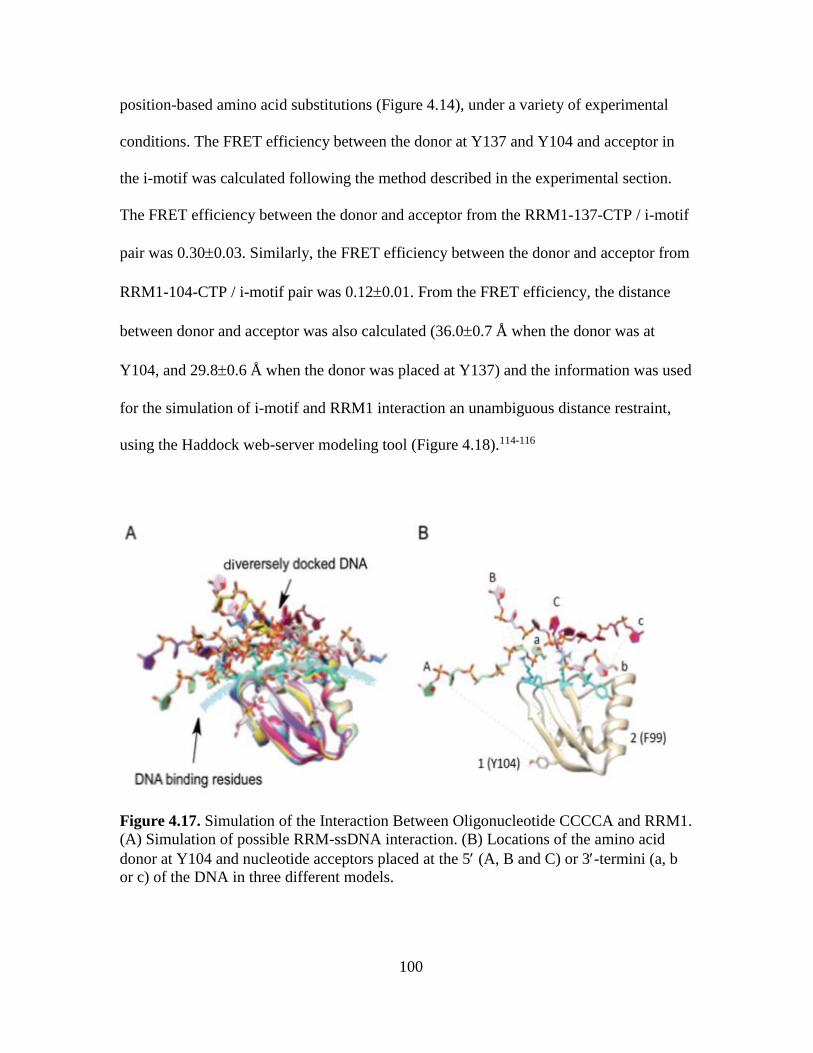
100
position-based amino acid substitutions (Figure 4.14), under a variety of experimental
conditions. The FRET efficiency between the donor at Y137 and Y104 and acceptor in
the i-motif was calculated following the method described in the experimental section.
The FRET efficiency between the donor and acceptor from the RRM1-137-CTP / i-motif
pair was 0.300.03. Similarly, the FRET efficiency between the donor and acceptor from
RRM1-104-CTP / i-motif pair was 0.120.01. From the FRET efficiency, the distance
between donor and acceptor was also calculated (36.00.7 Å when the donor was at
Y104, and 29.80.6 Å when the donor was placed at Y137) and the information was used
for the simulation of i-motif and RRM1 interaction an unambiguous distance restraint,
using the Haddock web-server modeling tool (Figure 4.18).114-116
Figure 4.17. Simulation of the Interaction Between Oligonucleotide CCCCA and RRM1.
(A) Simulation of possible RRM-ssDNA interaction. (B) Locations of the amino acid
donor at Y104 and nucleotide acceptors placed at the 5 (A, B and C) or 3-termini (a, b
or c) of the DNA in three different models.

101
4.3. Discussion
In this study BCL2 i-motif DNA has been shown to interact with at least two of
the individual domains of hnRNP LL (Figure 4.4). The binding interaction also imposed
considerable change in the structure of the BCL2 i-motif (Figures 4.7 and 4.10). As
shown in Figure 4.4 domains 1 and 2 bind to i-motif DNA with higher affinity, in
comparison with RRM3-4. A comparative study (Figure 4.4C and D) suggests that
RRM2 may have a higher affinity of binding to the i-motif than RRM1, analogous to
domains 2 and 1 of hnRNP L, respectively. Interestingly, domain 2 of hnRNP L has also
been reported to have higher binding affinity toward specific RNA substrates in previous
studies.117 In a combination of the i-motif DNA mixed with calf thymus DNA (Figure
4.5A and B), RRM1 and RRM2 showed a moderately higher binding affinity for the i-
motif DNA. Both domains bind selectively to the i-motif when incubated with an
equimolar mixture of i-motif and random DNA, suggesting the existence of a potential
recognition motif within the oligonucleotide sequence of the i-motif.
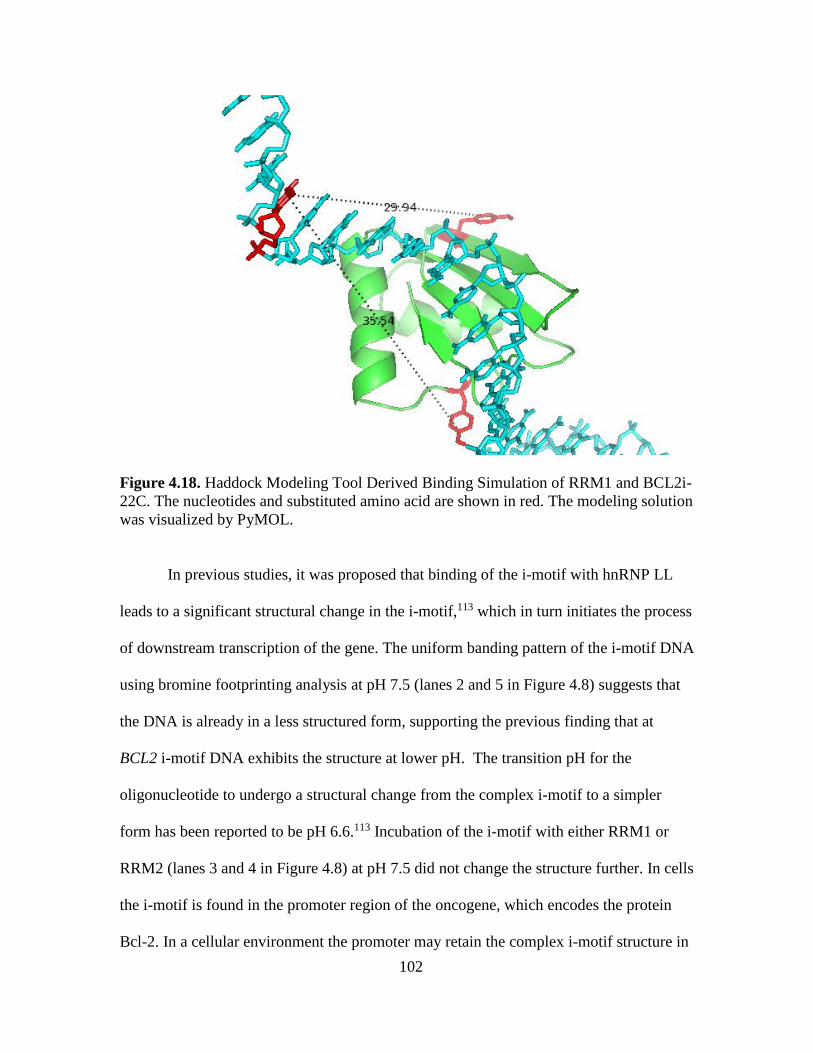
102
Figure 4.18. Haddock Modeling Tool Derived Binding Simulation of RRM1 and BCL2i-
22C. The nucleotides and substituted amino acid are shown in red. The modeling solution
was visualized by PyMOL.
In previous studies, it was proposed that binding of the i-motif with hnRNP LL
leads to a significant structural change in the i-motif,113 which in turn initiates the process
of downstream transcription of the gene. The uniform banding pattern of the i-motif DNA
using bromine footprinting analysis at pH 7.5 (lanes 2 and 5 in Figure 4.8) suggests that
the DNA is already in a less structured form, supporting the previous finding that at
BCL2 i-motif DNA exhibits the structure at lower pH. The transition pH for the
oligonucleotide to undergo a structural change from the complex i-motif to a simpler
form has been reported to be pH 6.6.113 Incubation of the i-motif with either RRM1 or
RRM2 (lanes 3 and 4 in Figure 4.8) at pH 7.5 did not change the structure further. In cells
the i-motif is found in the promoter region of the oncogene, which encodes the protein
Bcl-2. In a cellular environment the promoter may retain the complex i-motif structure in
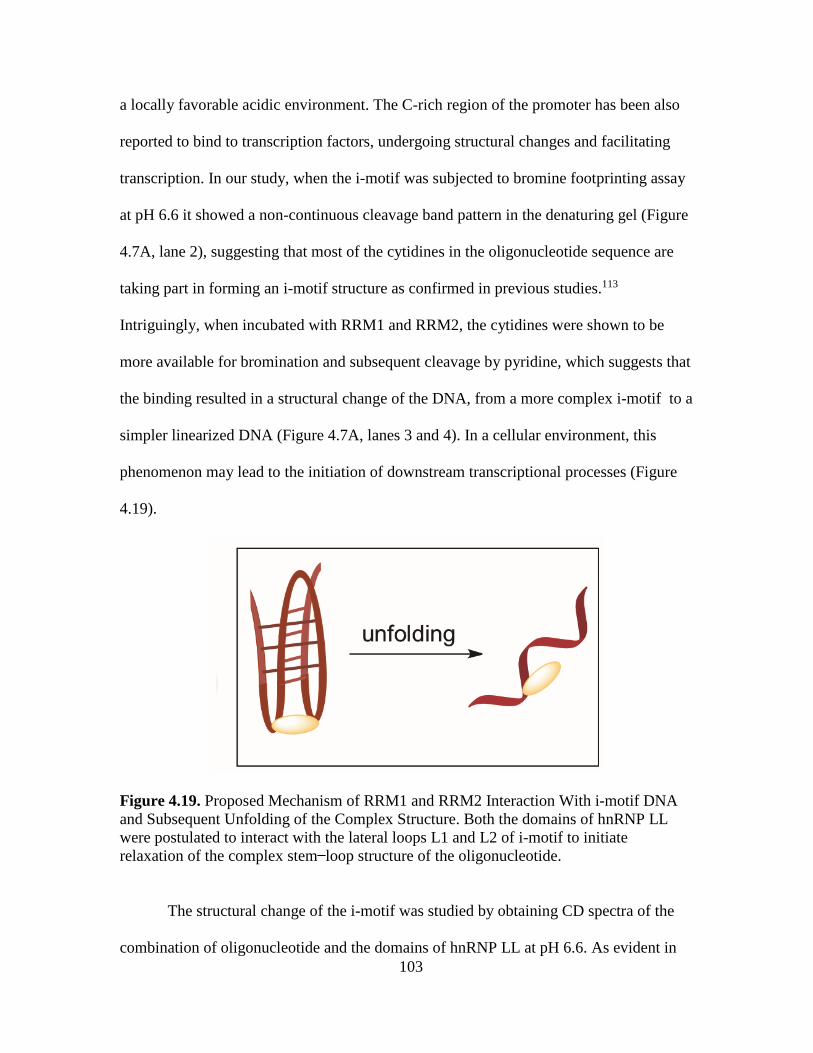
103
a locally favorable acidic environment. The C-rich region of the promoter has been also
reported to bind to transcription factors, undergoing structural changes and facilitating
transcription. In our study, when the i-motif was subjected to bromine footprinting assay
at pH 6.6 it showed a non-continuous cleavage band pattern in the denaturing gel (Figure
4.7A, lane 2), suggesting that most of the cytidines in the oligonucleotide sequence are
taking part in forming an i-motif structure as confirmed in previous studies.113
Intriguingly, when incubated with RRM1 and RRM2, the cytidines were shown to be
more available for bromination and subsequent cleavage by pyridine, which suggests that
the binding resulted in a structural change of the DNA, from a more complex i-motif to a
simpler linearized DNA (Figure 4.7A, lanes 3 and 4). In a cellular environment, this
phenomenon may lead to the initiation of downstream transcriptional processes (Figure
4.19).
Figure 4.19. Proposed Mechanism of RRM1 and RRM2 Interaction With i-motif DNA
and Subsequent Unfolding of the Complex Structure. Both the domains of hnRNP LL
were postulated to interact with the lateral loops L1 and L2 of i-motif to initiate
relaxation of the complex stem loop structure of the oligonucleotide.
The structural change of the i-motif was studied by obtaining CD spectra of the
combination of oligonucleotide and the domains of hnRNP LL at pH 6.6. As evident in
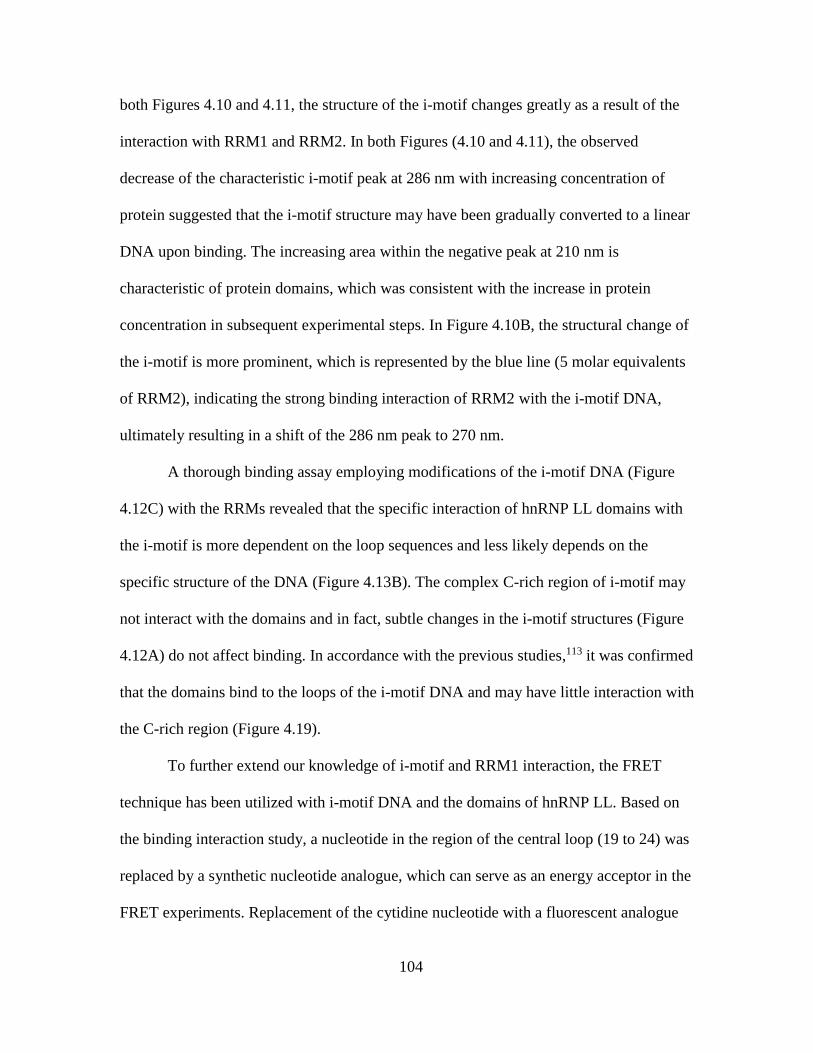
104
both Figures 4.10 and 4.11, the structure of the i-motif changes greatly as a result of the
interaction with RRM1 and RRM2. In both Figures (4.10 and 4.11), the observed
decrease of the characteristic i-motif peak at 286 nm with increasing concentration of
protein suggested that the i-motif structure may have been gradually converted to a linear
DNA upon binding. The increasing area within the negative peak at 210 nm is
characteristic of protein domains, which was consistent with the increase in protein
concentration in subsequent experimental steps. In Figure 4.10B, the structural change of
the i-motif is more prominent, which is represented by the blue line (5 molar equivalents
of RRM2), indicating the strong binding interaction of RRM2 with the i-motif DNA,
ultimately resulting in a shift of the 286 nm peak to 270 nm.
A thorough binding assay employing modifications of the i-motif DNA (Figure
4.12C) with the RRMs revealed that the specific interaction of hnRNP LL domains with
the i-motif is more dependent on the loop sequences and less likely depends on the
specific structure of the DNA (Figure 4.13B). The complex C-rich region of i-motif may
not interact with the domains and in fact, subtle changes in the i-motif structures (Figure
4.12A) do not affect binding. In accordance with the previous studies,113 it was confirmed
that the domains bind to the loops of the i-motif DNA and may have little interaction with
the C-rich region (Figure 4.19).
To further extend our knowledge of i-motif and RRM1 interaction, the FRET
technique has been utilized with i-motif DNA and the domains of hnRNP LL. Based on
the binding interaction study, a nucleotide in the region of the central loop (19 to 24) was
replaced by a synthetic nucleotide analogue, which can serve as an energy acceptor in the
FRET experiments. Replacement of the cytidine nucleotide with a fluorescent analogue
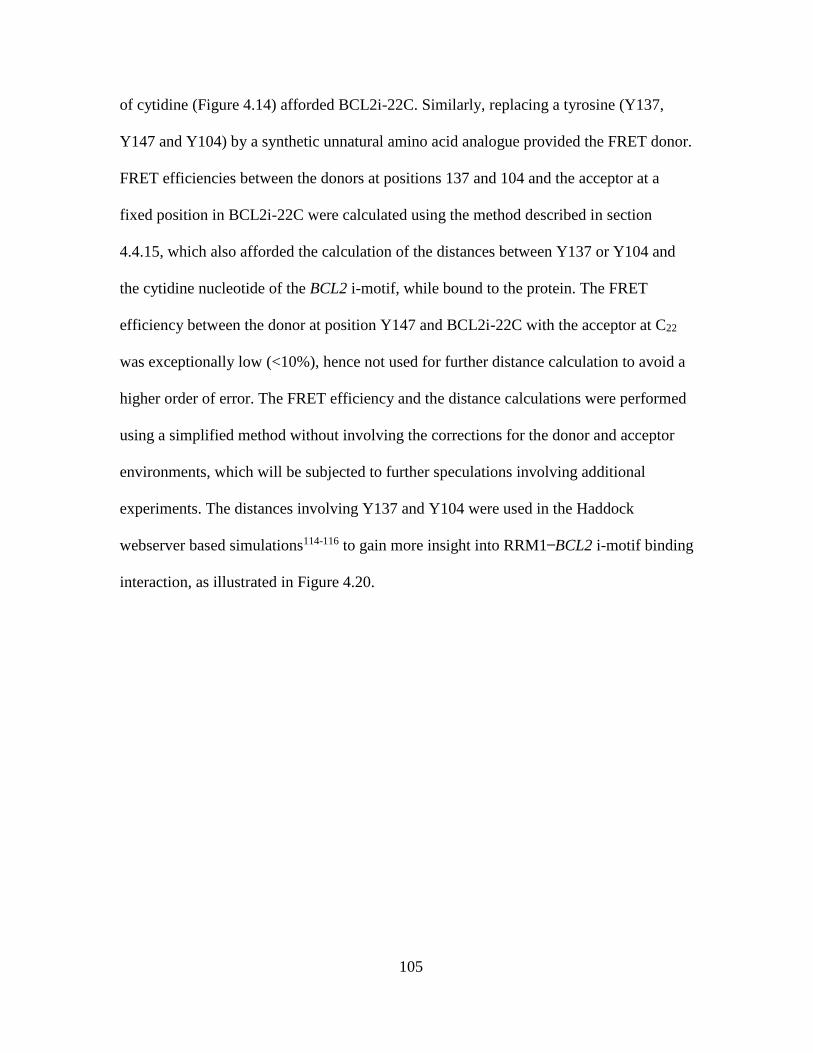
105
of cytidine (Figure 4.14) afforded BCL2i-22C. Similarly, replacing a tyrosine (Y137,
Y147 and Y104) by a synthetic unnatural amino acid analogue provided the FRET donor.
FRET efficiencies between the donors at positions 137 and 104 and the acceptor at a
fixed position in BCL2i-22C were calculated using the method described in section
4.4.15, which also afforded the calculation of the distances between Y137 or Y104 and
the cytidine nucleotide of the BCL2 i-motif, while bound to the protein. The FRET
efficiency between the donor at position Y147 and BCL2i-22C with the acceptor at C22
was exceptionally low (<10%), hence not used for further distance calculation to avoid a
higher order of error. The FRET efficiency and the distance calculations were performed
using a simplified method without involving the corrections for the donor and acceptor
environments, which will be subjected to further speculations involving additional
experiments. The distances involving Y137 and Y104 were used in the Haddock
webserver based simulations114-116 to gain more insight into RRM1 BCL2 i-motif binding
interaction, as illustrated in Figure 4.20.
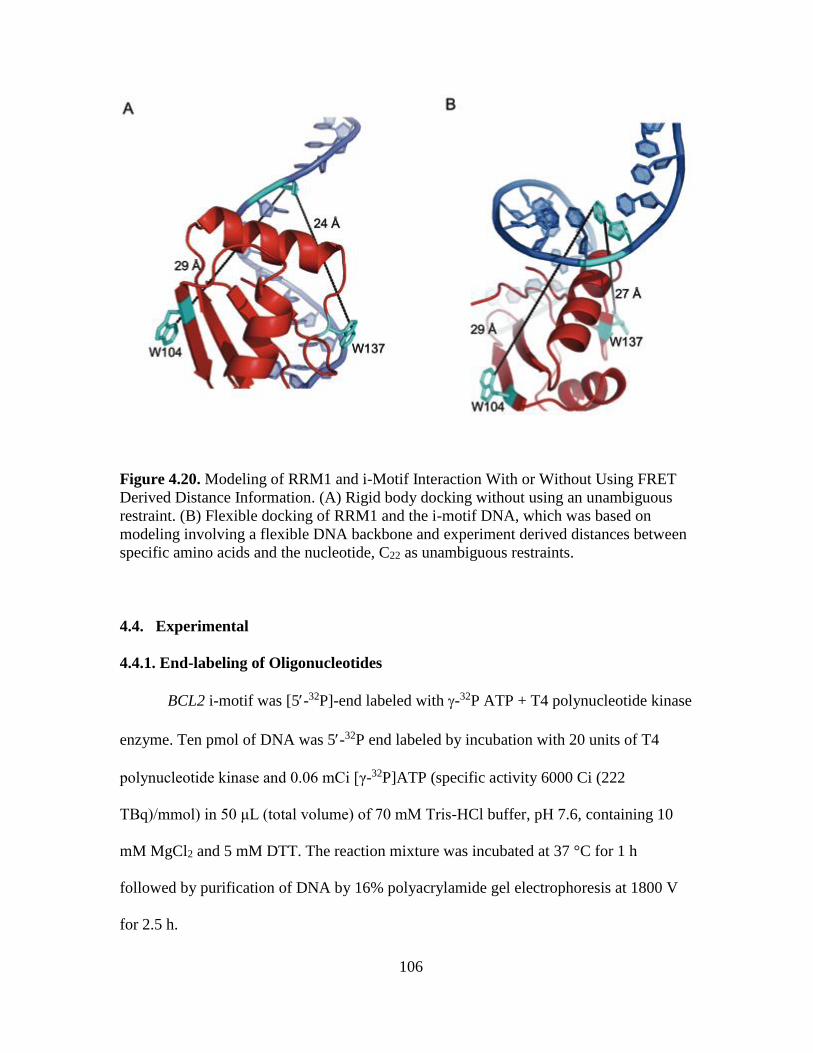
106
Figure 4.20. Modeling of RRM1 and i-Motif Interaction With or Without Using FRET
Derived Distance Information. (A) Rigid body docking without using an unambiguous
restraint. (B) Flexible docking of RRM1 and the i-motif DNA, which was based on
modeling involving a flexible DNA backbone and experiment derived distances between
specific amino acids and the nucleotide, C22 as unambiguous restraints.
4.4. Experimental
4.4.1. End-labeling of Oligonucleotides
BCL2 i-motif was [5-32P]-end labeled with -32P ATP + T4 polynucleotide kinase
enzyme. Ten pmol of DNA was 5-32P end labeled by incubation with 20 units of T4
polynucleotide kinase and 0.06 mCi [γ-32P]ATP (specific activity 6000 Ci (222
TBq)/mmol) in 50 μL (total volume) of 70 mM Tris-HCl buffer, pH 7.6, containing 10
mM MgCl2 and 5 mM DTT. The reaction mixture was incubated at 37 °C for 1 h
followed by purification of DNA by 16% polyacrylamide gel electrophoresis at 1800 V
for 2.5 h.
107
4.4.2. Maxam-Gilbert Sequencing Reaction65
Ten µL of labeled DNA solution (~50000 cpm) was treated with 25 µL of formic
acid and incubated at 25 °C for 4-5 min. The reaction was stopped by treatment with 200
µL of 0.3 M sodium acetate, pH 7.0 mixed with 0.1 mM EDTA and 25 µg/mL tRNA.
The resulting solution was containing 700 μL of ethanol and the DNA was precipitated.
The DNA pellet was purified by ethanol precipitation and resuspended in 75 µL of 10%
piperidine. The reaction mixture was incubated at 90 °C for 30 minutes, cooled down and
the supernatant was removed under diminished pressure. The DNA pellet was washed
and mixed with denaturing loading buffer containing 80% formamide, 2 mM EDTA, 1%
bromophenol blue and 1% xylene cyanol, then heated at 90 °C for 10 min and stored in
20 °C.
4.4.3. Electrophoretic Mobility Shift Assay
The BCL2 i-motif and each of the mutants mentioned in Table 1 were [5-32P]-end
labeled as noted above. These constructs were prepared in 50 mM Tris buffer with 100
mM NaCl at pH 7.0. One µL (10000 cpm) of each of those DNAs were mixed with 10
µM non-radioactive oligonucleotide counterparts. Ten pmol of each of those DNAs were
then incubated with 2.5, 5, 7.5 on 10 pmol of RRM1 or RRM2 for 15 min at room
temperature. The DNA protein mixtures were subjected to 12% non denaturing gel
electrophoresis at 80 V for 1.5 h. The resulting bands were visualized using a
phosphorimager.
108
4.4.4. Bromine FootPrinting Assay
The bromine footprinting assay protocol was adapted from the previous
procedure.106 BCL2 i-motif was [5-32P]-end labeled as described previously. Ten pmol of
the purified DNA was incubated with bromine formed in situ by mixing a 50 mM
solution of KBr and KHSO5 for 20 min at room temperature in a total volume of 20 µL.
The reaction was terminated by the addition of 200 µL of 0.3 M sodium acetate
containing 10 mg/mL calf thymus DNA and 700 µL of cold ethanol. The reaction
mixture was incubated in 80 °C for 20 min and the DNA pellet was purified by
additional ethanol purification steps. The DNA pellet was resuspended in 70 µL of 10%
piperidine. The reaction mixture was incubated at 90 °C for 30 min, cooled and the
supernatant was removed under diminished pressure. The DNA pellet was washed with
water and mixed with denaturing loading buffer containing 80% formamide, 2 mM
EDTA, 1% bromophenol blue and 1% xylene cyanol, then heated at 90 °C for 10 min and
resolved in a denaturing polyacrylamide gel.
4.4.5. Circular Dichroism
CD experiments were performed based on the potocol described in literature.106
The spectral data was collected using a Jasco-810 spectropolarimeter and a quartz cell of
1.0 mm path length. Spectra were obtained at a scanning speed of 100 nm/min with a
response time of 1 sec, over a wavelength range of 200-350 nm. For each scan, the data
was recorded six times, avaraged, smoothed and baseline corrected to eliminate the signal
contribution from buffer. The oligonucleotides were dissolved in 50 mM Tris buffer (pH
6.6 and 7.0) containing 100 mM NaCl at a concentration of 5 µM. RRM1 and RRM2
109
were prepared in same buffer at 50 µM concentration. For binding interaction studies, CD
spectra were obtained after incubating DNA and protein at room temperature for 15 min.
4.4.6. Mutagenesis and Subcloning
Three PCR (Polymerase Chain Reaction) site-directed mutagenesis procedure
were carried out using NEB Q5 Mutagenesis kit. The forward and reverse primers for
each PCR mutagenesis are listed in the Appendix. NEB base changer web-tool was used
to design the primers, in order to incorporate an amber codon (TAG) at either Y137 or
Y104 and Y147. PCR reactions were performed in 25 L reaction mixtures, following
the procedure described in the kit manual. Each reaction mixture contained 25 ng wild-
type template RRM1, encoded in a pET 28a vector, 125 ng of forward and reverse
primers, 10 nmol of dNTPs, 2.5 units of DNA polymerase in 35 mM Tris-HCl at pH 8.0
containing 12 mM potassium acetate, 5mM DTT and 0.05% Triton X-100 in 0.05 mM
EDTA. A combination of the forward and reverse primers, 137-Forward and 137-Reverse
or 104-Forward and 104-Reverse were used for the synthesis of RRM1-137TAG and
RRM1-104TAG, respectively, whereas, 147-Forward and 147-Reverse were used for the
synthesis of RRM1-147TAG. The products were ligated with the Q5 ligase master mix
and transformed in DH5 E. coli cells. Purified plasmids were verified by sequencing.
The product plasmids were the RRM1 constructs with a TAG codon at position 137 or
104 and 147.

110
4.4.7. Competent Cell Preparation.
A stock of DH5 competent cells was made for transformation, following the
Invitrogen competent cell preparation protocol. The preparation was carefully done at
4 °C in a sterile environment. A 250 mL LB culture produced a stock of 21.4 mL cells
in 97 tubes of 220 uL aliquots. The transformation efficiency of the cells was 2.73X10⁷
when checked with pUC19 vectors.
4.4.8. NVOC protected aminoacyl Dinucleotide Preparation.
Crude aminoacylated pdCpA samples were dissolved in DMSO. The
concentration of the resulting solution was checked by measuring the absorbance of the
dinucleotide, at 260 nm wavelength and was found to be 96 ABS (absorbance unit). The
pdCpA solutions were used for tRNA ligation to a final concentration of 5.0 ABS.
4.4.9. Transcription of 74-Nucleotide tRNA and Purification
The plasmid pYRNA8, which encodes a 74-nucleotide tRNA (tRNA-COH) was
transformed into DH5 cells and a single colony was picked for overnight growth in 500
mL LB media supplemented with 100 µg/mL ampicillin. The harvested cells were used
for large-scale plasmid extraction following the Promega maxiprep-kit protocol. The
Plasmid concentration was measured by checking the absorbance at 260 nm and a stock
of 1 µg/mL solution was prepared by dissolving the plasmid in water.

111
4.4.10. Digestion of pYRNA8 Plasmid with FokI
The pYRNA8 was completely linearized for the subsequent activity of the T7
RNA polymerase. The plasmid was digested using FokI restriction endonuclease. The
linear DNA was separated from protein impurities and purified by Phenol Chloroform
extraction followed by ethanol precipitation. The digested product was run in a 1%
agarose gel along with undigested plasmid as a control. The fastest migrating band was
collected and purified. The DNA fragment containing 74-nucleotide tRNA, being
expressed under a T7 promoter, was subjected to in vitro transcription. The conventional
ampliscribe T7 transcription protocol was followed and based on previous data; a high
yield of 74-nucleotide RNA was obtained with an additional use of 500 µg GMP in the
transcription buffer.
4.4.11. Purification of tRNA by DEAE Sephadex Chromatography
After transcription, the reaction mixture was precipitated by the addition of 40 µL
of 3M NaOAc at pH 5.0 and 1.3 mL of cold EtOH, then washed with 70% EtOH . The
product was air dried and dissolved in 300 µL of 0.1 M NaOAc, pH 5.0. The solution was
loaded onto 800 µL of Sephadex resin, equilibrated with the same buffer mentioned
above and eluted with a step gradient of NaCl [0-0.9 M]. The fractions were purified and
analyzed by electrophoresis on an 8% PAA Urea [polyacrylamide urea] gel at pH 8.4
(TBE buffer) for 1h at 100 V. The tRNA was used in a ligation reaction with
aminoacylated pdCpA in the presence of ATP and T4 RNA ligase.
112
4.4.12. Ligation of tRNA-COH with Aminoacyl-pdCpA and NVOC Deprotection
Suppressor tRNA aminoacylation was carried out in 100 mL (total volume) of
100 mM HEPES buffer (4-(2-hydroxyethyl)-1-piperazineethanesulfonic acid), pH 7.5,
containing 2.0 mM ATP, 15 mM MgCl2, 100 μg of suppressor tRNA-COH, 5.0 A260 units
of NVOC-protected 6-cyanotryptophanyl-pdCpA, 15% DMSO and 200 units of T4 RNA
ligase. After incubation at 37 oC for 1 hour, the reaction was quenched by the addition of
10 μL of 3 M NaOAc, pH 5.2, followed by 300 μL of ethanol. The reaction mixture was
incubated at –20 oC for 30 minutes, then centrifuged at 15,000 × g at 4 oC for 30 minutes.
The supernatant was carefully decanted and the tRNA pellet was washed with 100 μL of
70% ethanol and dissolved in 30 μL of RNase free H2O. The NVOC-protected 6-
cyanotryptophanyl-tRNA was cooled to 2 oC and irradiated with a 500 W mercury-xenon
lamp for 5 minutes.
4.4.13. S-30 Preparation
S-30 systems from E. coli BL-21 (DE-3) containing rrnB genes were prepared by
procedure described in literature.118,119 Cells were grown at 31 °C in LB medium,
supplemented with ampicillin (100g/L), until the optical density at 600 nm was 1.0. The
cell solution was then diluted 10 times with LB medium and IPTG (500 g) and growth
was continued until the optical density was 2.0. The cells were harvested and lysed by
egg lysozyme (150 g/g of cells). Finally, the S-30 extract was dialyzed, aliquoted in 100
L micro-centrifuge tubes and stored at -80 °C.
113
4.4.14. In vitro Protein Synthesis and Amber Suppression.
Circular DNA plasmid containing the gene of interest can be transcribed and
translated in one single reaction as long as the T7 polymerase is present. The
transcription and translation reactions are done in one tube, i.e. termed as a “coupled”
system. The procedure is also referred to as “in vitro translation”.118 Reactions were
carried out following a standard procedure developed in the Hecht Laboratory118 in 10 L
reaction mixtures, with 600 ng plasmid containing the gene for the relevant protein, in 35
mM Tris acetate, pH 7.4, 190 mM potassium glutamate, 30 mM ammonium acetate, 2
mM DTT, 0.2 g/L aminoacyl tRNA, 3.5% polyethylene glycol (PEG)-6000, 20 g/L
folinic acid, 20 mM ATP and GTP, 5 mM CTP and UTP, 100 mM mixture of amino
acids, 0.1-0.4 l/L of S-30 preparation and 100 M (0.5 Ci/l) of 35S-methionine.
In the suppression analysis with a plasmid containing a TAG codon,
aminoacylated tRNAs were added to the reaction mixtue up to a concentration of 0.3
g/L. Reactions were incubated at 37 °C for one hour. Purification of the protein was
done following the Strep-Tactin manufacturer’s protocol (Iba-Lifesciences). Reaction
yields were analyzed by visualizing the protein band in a 15% Tris-glycine SDS-PAGE
gel and quantification of protein was done by imagephosphor software. In vivo protein
expression was done by adding IPTG to an E. coli BL-21 (DE-3) cell culture after 3
hours, containing RRM1, RRM2 or RRM3-4 plasmids. The cultures were incubated
overnight at 37 °C, followed by the addition of rifampicin (1 µg/mL) and incubation for
another 12-16 hours before lysing the cells by sonication. The separation of proteins from
the cellular debris was performed by centrifugation at 4000 rpm. The supernatant was
114
filtered and loaded directly on a Strep-Tactin column. The protein was eluted with 50
mM PBS buffer.
4.4.15. FRET Experiment
The FRET efficiency between donor and acceptor was measured in
experimentally by gradual addition of DNA to 5 µM RRM1 solution at pH 4.5. The
protein was incubated with the DNA for 5 min and then excited at 310 nm. Emission was
measured immediately in the range of 325-550 nm. The emission profiles of the donors
(RRM1-137-CTP, RRM1-104-CTP) and the donor acceptor complexes were normalized,
integrated and fitted using the equation, E= IA/(IA+ID), where E is the FRET efficiency; IA
and ID are the integrated intensities of the donor in unbound and bound forms,
respectively. The distance between donor and acceptor was calculated by fitting FRET
efficiency in the equation, R= R0*((1-E)/E)1/6, where R0 is the Förster radius. R0 value
was calculated by Poulami Talukder to be 26 Å using the method described in
‘Introduction to Fluoroscence’ by David Jamesons.120
4.4.16. Graphical Modeling and Simulation of DNA Protein Interaction
RRM1 was modeled based on homology modeling using Modeller.121,122 The
fluorescence data was individually baseline corrected, normalized, integrated and used
for FRET efficiency calculations using statistical data processing software, Origin 8. The
FRET efficiency and distances between donors and acceptor were calculated using the
method described in the previous section. A pdb file for the 39-nucleotide long i-motif
was generated using the Make-NA algorithm.123 The DNA binding residues in RRM1

115
were found using DP-bind web-tool.124,125 The predicted active residues were R105,
G106, F134, K135, R136, Q137, Q165, F168, N170, Y171. Based on the current study
and the previously reported results,113 the active residues of i-motif were found to be in
loop L1 and L3 (lateral loops). The binding pockets on RRM1 were scanned by
Patchdock web-tool for favorable binding interactions,126,127 which is followed by the
rigid body docking, using Hex-docking algorithm.128,129 The data was confirmed by the
Haddock docking algorithm (Figure 4.20 A), using active residues as ‘ambiguous-binding
restraints’.114-116 Furthermore, the dynamic docking was performed using Haddock expert
interface (~24 hours processing time for each pair), considering flexible regions of
protein and DNA, solvent factors, polar-nonpolar interactions, energy minimization,
hydrogen bonding and backbone conformational restraints. The FRET experiment
derived data was used as unambiguous restraints for dynamic modeling (Figure 4.20B).
The represented data was the best model from a library of over 1000 virtual modeling
results. The molecules were visualized and virtual mutations were done using PyMol130
software.
116
REFERENCES
1. Jemal, A.; Siegel, R.; Xu, J.; Ward, E. CA Cancer J. Clin. 2010, 60, 277.
2. Fletcher, R. H.; BMC Med. 2009, 7, 18.
3. Krieger, N.; Quesenberry Jr, C.; Peng, T.; Horn-Ross, P.; Stewart, S.;
Brown, S.; Swallen, K.; Guillermo, T.; Suh, D.; Alvarez-Martinez, L.; Ward, F.
Cancer Cause Control 1999. 10, 525.
4. Greenlee, R. T.; Murray, T.; Bolden, S.; Wingo, P. A.; CA-Cancer J.
Clin.2000, 50, 7.
5. Huerta, E.; Grey, N.; CA Cancer J. Clin. 2007, 57, 72.
6. Claus, E.; Risch, N. J.; Thompson, W. D. Am. J. Epidemiol. 1989, 131, 961.
7. Perera, F. P. Science 1997, 278, 1068.
8. Bell, D.; Taylor, J. A.; Paulson, D. F.; Robertson, C. N.; Mohler, J. L.; Lucier,
G. W. J. Natl. Cancer Inst. 1993, 85, 1159.
9. Sasco, A. J.; Secretan, M. B.; Straif, K. Lung Cancer 2004, 45, S3.
10. Carbone, D. Am. J. Med. Sci. 1992, 93, S13.
11. Anand, P.; Kunnumakkara, A. B.; Kunnumakara, A. B.; Sundaram, C.;
Harikumar, K. B.; Tharakan, S. T.; Lai, O. S.; Sung, B.; Aggarwal, B. B.
Pharm. Res. 2008, 25, 2097.
12. Pjura, P. E.; Grzeskowiak, K.; Dickerson, R. E. J. Mol. Biol. 1987, 197, 257.
13. Canals, A.; Purciolas, M.; Aymamı′, J.; Coll, M. Acta Crystallogr. D Biol.
Crystallogr. 2005, 61,1009.
14. Sappal, D. S.; McClendon, A. K.; Fleming, J. A.; Thoroddsen, V.; Connolly, K.;
Reimer, C.; Blackman, R. K.; Bulawa, C. E.; Osheroff, N.; Charlton, P. Mol
Cancer Ther. 2004, 3, 47.
15. Palchaudhuri, R.; Hergenrother, P. J. Current Opin. Biotechnol. 2007, 18, 497.
16. Sausville, E. A.; Peisach, J.; Horwitz, S. B. Biochemistry 1978, 17, 2740.
17. Burger, R. M. Chem. Rev. 1998, 98, 1153.
117
18. Carter, B. J.; de Vroom, E.; Long, E. C.; van der Marel, G. A.; van Boom, J. H.;
Hecht, S. M. Proc. Natl. Acad. Sci. U.S.A. 1990, 87, 9373 .
19. Galm, U.; Hager, M. H.; Van Lanen, S. G.; Ju, J. Thorson, J. S.; Shen, B. Chem.
Rev. 2005, 105, 739.
20. Umezawa, H.; Suhara, Y.; Takita, T.; Maeda, K. J. Antibiot. 1966, 19, 210.
21. Lin, F. T.; Li, D. D.; Yang, X. P.; Li, Q.; Xue, Y. C.; Zhen, Y. S. Chin. J.
Oncol. 1979,1, 161.
22. Zheng, J. W.; Yang, X. J.; Wang, Y. A.; He, Y.; Ye, W. M.; Zhang, Z. Y. Oral
Oncol. 2009, 45, 872.
23. Xu, H. Z.; Zhang, H. Y. Acta Pharm Sinica 1980, 15, 609.
24. Shou, B. Q.; Mao, Z.; Zhang, S. L.; Yang, Z. West China J. Stomatal. 2009, 27,
572.
25. Hoet, P. H. M.; Nemery, B. Am. J. Physiol. Lung. Cell. Mol. Physiol. 2000, 278,
417.
26. Galm, U.; Wednt-Pienkowski, E.; Wang, L.; George, N. P.; Oh, T.; Yi, F.; Tao,
M.; Coughlin, J. M.; Shen, B. Mol. Biosyst. 2009, 5, 77.
27. Claussen, C. A.; Long, E. C. Chem. Rev. 1999, 99, 2797.
28. Aoyagi, Y.; Katano, K.; Suguna, H.; Primeau, J.; Chang, L. H.; Hecht, S. M. J.
Am. Chem. Soc. 1982, 104, 5537.
29. Takita, T.; Umezawa, Y.; Saito, S.; Morishima, H.; Naganawa, H.; Umezawa,
H. Tsuchiya, T.; Miyake, T.; Kageyama, S.; Umezawa, S.; Muraoka, Y.;
Suzuki, M.; Otsuka, M., Narita, M.; Kobayashi, S.; Ohno, M. Tetrahedron Lett.
1982, 23, 521.
30. Boger, D. L.; Honda, T.; Dang, Q. J. Am. Chem. Soc. 1994, 116, 5619.
31. Leitheiser, C. J.; Smith, K. L.; Rishel, M. J.; Hashimoto, S.; Konishi, K.;
Thomas, C. J.; Li, C.; McCormick, M. M.; Hecht, S. M. J. Am. Chem. Soc.
2003, 125, 8218.
32. Goodwin, K. D.; Lewis, M. A.; Long, E. C.; Gordiadis, M. M. Proc. Natl. Acad.
Sci. 2008, 105, 5052.
33. Sugiyama, H.; Ehrenfeld, G. M.; Shipley, J. B.; Kilkuski, R. E.; Chang, L.-H.;
118
Hecht, S. M. J. Nat. Prod. 1985, 48, 869.
34. Bhattacharya, C.; Yu, Z.; Rishel, M. J.; Hecht, S. M. Biochemistry 2014, 53,
3264.
35. Buda, F.; Karawajczyk, A. Mol. Sim. 2006, 32, 1233.
36. Carter, B. J.; Murty, V. S.; Reddy, K. S.; Wang, S.-N.; Hecht, S. M. J. Biol.
Chem. 1990, 265, 4193.
37. Rishel, M. J.; Thomas, C. J.; Tao, Z.-F.; Vialas, C.; Leithesiser, C. J.; Hecht, S.
M. J. Am. Chem. Soc. 2003, 125, 10194.
38. Boger, D. L.; Menezes, R. F.; Dang, Q.; Yang, W. Bioorg. Med. Chem. Lett.
1992, 2, 162.
39. Carter, B. J.; Reddy, K. S.; Hecht, S. M. Tetrahedron 1991, 47, 2463.
40. Henichart, J; Bernier, J.; Helbecque, N.; Houssin, R. Nucleic Acids Research
1985, 13, 6703.
41. Hamamichi, N.; Natrajan, A.; Hecht. S. M. J. Am. Chem. Soc. 1992, 114, 6278.
42. Thomas, C. J.; McCormick, M. M.; Vialas, C.; Tao, Z.-F.; Leitheiser, C. J.;
Rishel, M. J.; Xu, X.; Hecht, S. M. J. Am. Chem. Soc. 2002, 124, 3875.
43. Stubbe, J.; Kozarich, J. W. Chem. Rev. 1987, 87, 1107.
44. Muller, W. E. G.; Yamazaki, Z.; Breter, H.-J.; Zahn, R. K. Eur. J. Bichem.
1972, 31, 518.
45. Haidle, C. W.; Bearden, J., Jr. Biochem. Biophys. Res. Commun. 1975, 65, 815.
133
46. Krishnamoorthy, C. R.; Vanderwall, D. E.; Kozarich, J. W.; Stubbe, J. J. Am.
Chem. Soc. 1988, 110, 2008.
47. Sugiyama, H.; Xu, C.; Murugesan, N.; Hecht, S. M. J. Am. Chem. Soc. 1985,
107, 4104.
48. Aso, M.; Kondo, M.; Suemune, H.; Hecht, S. M. J. Am. Chem. Soc. 1990, 112,
4058.
49. Thesis of Dr. Ryan Schmaltz, University of Virginia 2013.
50. Hecht, S. M. J. Nat. Prod. 2000, 63, 158.
119
51. Povirk, L. F.; Han, Y.-H.; Steighner, R. J. Biochemistry 1989, 28, 5808.
52. Keck, M. V.; Manderville, R. A.; Hecht, S. M. J. Am. Chem. Soc. 2001, 123,
8690.
53. Giroux, R. A.; Sidney M. Hecht, S. M. J. Am. Chem. Soc. 2010, 132, 16987.
54. Segerman, Z. J.; Roy, B.; Hecht, S. M. Biochemistry 2013, 52, 5315.
55. Hecht, S. M. Acc. Chem. Res. 1986, 19, 383.
56. Roy, B.; Hecht, S. M. J. Am. Chem. Soc. 2014, 136, 4382.
57. Ma, Q.; Akiyama, Y.; Xu, Z.; Konishi, K.; Hecht, S. M. J. Am. Chem. Soc.,
2009, 131, 2013.
58. Bozeman, T. C.; Nanjunda, R.; Tang, C.; Liu, Y.; Segerman, Z. J.; Zaleski, P.
A.; Wilson, W. D.; Hecht, S. M. J. Am. Chem. Soc., 2012, 134, 17842.
59. Povirk, L. F.; Houlgrave, C. W. Biochemistry 1988, 27, 3850.
60. Steighner, R. J.; Povirk, L. F. Proc. Natl. Acad. Sci. U.S.A. 1990, 87, 8350.
61. Povirk, L. F.; Bennett, R. A. O.; Wang. P.; Swerdlow, P. S.; Austin, M. J. F. J.
Mol. Biol. 1994, 243, 216.
62. Keller, T. J.; Oppenheimer, N. J. J. Biol. Chem. 1987, 262, 15144.
63. Absalon, M. J.; Kozarich, J. W.; Stubbe, J. Biochemistry 1995, 34, 2065.
64. Absalon, M. J.; Wu. W.; Kozarich, J. W.; Stubbe, J. Biochemistry 1995, 34,
2076.
65. Maxam, A. M.; Gilbert, W. Methods Enzymol. 1980, 65, 499
66. Bird, A. Genes & Dev. 2002, 16, 6.
67. Ogishima, T.; Shiina, H.; Breault, J. E.; Terashima, M.; Honda, S.; Enokida, H.;
Urakami, S.; Tokizane, T.; Kawakami, T.; Ribeiro-Filho, L. A.; Fujime, M.;
Kane, C. J.; Carroll, P. R.; Igawa, M.; Dahiya, R. Oncogene 2005, 24, 6765.
68. Robertson, K. D.; Jones, P. A. Carcinogenesis 2000, 21, 461.
69. Teodoridis, J. M.; Strathdee, G.; Brown, R. Drug Resistance Updates 2004, 7,
267.
120
70. Ogishima, T.; Shiina, H.; Breault, J. E.; Terashima, M.; Honda, S.; Enokida, H.;
Urakami, S.; Tokizane, T.; Kawakami, T.; Ribeiro-Filho, L. A.; Fujime, M.;
Kane, C. J.; Carroll, P. R.; Igawa, M.; Dahiya, R. Oncogene 2005, 24, 6765.
71. Øster, B.; Linnet, L.; Christensen, L. L.; Thorsen, K.; Ongen, H.; Dermitzakis,
E. T.; Sandoval, J.; Moran, S.; Esteller, M.; Hansen, T. F.; Lamy, P.; Laurberg,
S.; Ørntoft, T. F.; Andersen, C. L. cancer. Int. J. Cancer 2013, 132, 2303.
72. Bird, A. P. Nature 1986, 321, 209.
73. Esteller, M. Nat Rev. Genet. 2007, 8, 286.
74. Robertson, K. D. Oncogene 2002, 21, 5361.
75. Umezawa, H. J. Antibiot. 1977, 30, 138.
76. Umezawa, H. Tanpakushitsu Kakusan Koso 1978, 23, 657.
77. Umezawa, H. Antibiot. Chemother. 1978, 23, 76.
78. Holmes, C. E.; Carter, B. J.; Hecht, S. M. Biochemistry 1993, 32, 4293.
79. Roy, B.; Tang, C.; Alam, M. P.; Hecht, S. M. Biochemistry 2014, 53, 6103.
80. Long, E. C.; Hecht, S. M.; Marel, C. A. V. D.; Booms, J. H. V. J. Am. Chem.
Soc. 1990, 112, 5212.
81. Hertzberg, R. P.; Caranfa, M. J.; Hecht, S. M. Biochemistry 1985, 25, 5286.
82. Lee, J. Y; Lee, T.-H. J. Am. Chem. Soc. 2012, 134, 173.
83. Akiyama, Y.; Ma, Q.; Edgar, E.; Laikhter, A.; Hecht, S. M. J. Am. Chem. Soc.
2008, 130, 9650.
84. Akiyama, Y.; Ma, Q.; Edgar, E.; Laikhter, A.; Hecht, S. M. Org. Lett. 2008, 10,
2127.
85. Chapuis, J.-C.; Schmaltz, R. M.; Tsosie, K. S.; Belohlavek, M.; Hecht, S. M. J.
Am. Chem. Soc. 2009, 131, 2438.
86. Yu, Z.; Schmaltz, R. M.; Bozeman, T. C.; Paul, R.; Rishel, M. J.; Tsosie, K. S.;
Hecht, S. M. J. Am. Chem. Soc. 2013, 135, 2883.
87. Kozarich, J. W.; Worth, L. Jr.; Frank, B. L.; Christner, D. F.; Vanderwall, D. E.;
Stubbe, J. Science 1989, 245, 1396.
121
88. Kane, S. A.; Hecht, S. M.; Sun, J.-S.; Garestier, T.; Hélène, C. Biochemistry
1995, 34, 16715.
89. Holmes, C. E.; Abraham, A. T.; Hecht, S. M.; Florentz, C.; Giegé, R. Nucleic
Acids Res. 1996, 24, 3399.
90. Geahigan, K. B.; Meints, G. A.; Hatcher, M. E.; Orban, J.; Drobny, G. P.
Biochemistry 2000, 39, 4939.
91. Derreumaux, S.; Chaoui, M.; Tevanian, G.; Fermandjian, S. Nucleic Acids Res.
2001, 29, 2314.
92. Nathan, D.; Crothers, D. M. J. Mol. Biol. 2002, 316, 7.
93. Burkhoff, A. M.; Tullius, T. D. Cell 1987, 48, 935.
94. Moretti, R.; Donato, L. J.; Brezinski, M. L.; Stafford, R. L.; Hoff, H.; Thorson,
J. S.; Dervan, P. B.; Ansari, A. Z. ACS Chem. Biol. 2008, 3, 220.
95. Hancock, S. P.; Ghane, T.; Cascio, D.; Rohs, R.; Di Felice, R.; Johnson, R. C.
Nucleic Acids Res. 2013, 41, 6750.
96. Pilch, D. S.; Poklar, N.; Gelfand, C. A.; Law, S. M.; Breslauer, K. J.; Baird, E.
E.; Dervan, P. B. Proc. Natl. Acad. Sci. U.S.A. 1996, 93, 8306.
97. Jones, P. A.; Baylin, S. B. Cell 2007, 128, 683.
98. Kelly, T.; Jones, P. Proc. Natl. Acad. Sci. U.S.A. 2010, 107, 3.
99. Kristie D.; Goodwin, K. D.; Lewis, M. A.; Long, E. C.; Georgiadis, M. M.
Proc. Natl. Acad. Sci. 2008, 105, 5052.
100. Lefebvre, A.; Mauffret, O.; El Antri, S.; Monnot, M.; Lescot, E.; Fermandjian,
S. Eur. J. Biochem. 1995, 229, 44.
101. Marcourt, L.; Cordier, C.; Couesnon, T.; Dodin, G. S. Eur. J. Biochem. 1999,
265, 1032.
102. Bochman, M. L.; Paeshke, K.; Zakian, V. A. Nat. Rev.Genet. 2012, 13, 770.
103. Huppert, J. L.; Bugut, A.; Kumari, S.; Balasubramanian, S. Nucleic Acids Res.
2008, 36, 6260.
104. Huppert, J. L.; Balasubramanian, S. Nucleic Acids Res. 2005, 33, 2908.
122
105. Niedle, S. FEBS J. 2010, 277, 1118.
106. Kendrick, S.; Akiama, Y.; Hecht, S. M.; Hurley, L. H. J. Am. Chem. Soc. 2009,
48, 17667.
107. Siddiqui-Jain, A.; Grand, C. L.; Bearss, D. J.; Hurley, L. H. Proc. Natl. Acad.
Sci. USA 2002, 99, 11593.
108. Bejugam, M.; Seqitz, S.; Shirude, P. S.; Rodrigues, R.; Shahid, R.;
Balasubramanian, S. J. Am. Chem. Soc. 2007, 129, 12926.
109. Reed, J. C.; Kitada, S.; Takayama, S.; Miyashita, T. Ann. Oncol. 1994, 5, S61.
110. Schmitt, C. A.; Lowe, S. W. Blood Cells, Molecules, Deseases 2001, 27, 206.
111. Vaux, D. L.; Cory, S.; Adams, J. M. Nature 1988, 335, 440.
112. Kendrick, S.; Kang, Huan-J.; Madathil, M. M.; Alam, M. P.; Agarwal, P.;
Gokhale, V.; Yang, D.; Hecht, S. M.; Hurley, L. H. J. Am. Chem. Soc. 2014.
136, 4161.
113. Kang, Hyun-J.; Kendrick, S.; Hecht, S. M.; Hurley, L. H. J. Am. Chem. Soc.
2014. 136, 4172.
114. Dominguez, C.; Boelens, R.; and Bonvin, A. M. J. J. J. Am. Chem. Soc. 2003,
125, 1731.
115. De Vries, S. J.; Van Dijk, A. D. J.; Krzeminski, M.; Van-Dijk, M.; Thureau, A.;
Hsu, V.; Wassenaar, T.; Bonvin, A. M. J. J. Proteins: Struc. Funct. &
Bioinformatic 2007, 69, 726.
116. De Vries, S. J.; Van Dijk, M.; Bonvin, A. M. J. J. Nature Protocols 2010, 5,
883.
117. Thesis of Dr. Inna Grishina, University of Geissen 2010.
118. Short III, G. F.; Golovine, S. Y.; Hecht, S. M. Biochemistry 1999, 38, 8808.
119. Dedkova, L. M.; Fahmi, N. E.; Golovine, S. Y.; Hecht, S. M. Biochemistry
2006, 45, 15541.
120. Jameson, D. M. Introduction to Fluorescence; CRC Press, Taylor and Francis
Group: Boca Raton, 2014, 8, 145.
123
121. Eswar, N.; Marti-Renom, M. A.; Webb, B.; Madhusudhan, M. S.; Shen, D. E.
M.; Pieper, U.; Sali, A. Current Protocols in Bioinformatics; John Wiley &
Sons, Inc., 2006, 15, 1.
122. Marti-Renom, M.A.; Stuart, A.; Fiser, A.; Sánchez, R.; Melo, F.; Sali. A.; Annu.
Rev. Biophys. Biomol. Struct. 2000, 29, 291.
123. Arnott, S.; Hukins, D.W.L.; Dover, S.D.; Fuller, W.; Hodgson, A.R. J.Mol.
Biol. 1973, 81, 107.
124. Hwang, S.; Gou, Z.; Kuznetsov, I. B. Bioinformatics 2007, 23, 634-636.
125. Kuznetsov, I. B.; Gou, Z.; Li, R.; Hwang, S. Bioinformatics 2006, 64, 19.
126. Duhovny, D.; Nussinov, R.; Wolfson, H. J. Proceedings of the 2'nd Workshop
on Algorithms in Bioinformatics(WABI) Rome, Italy, Lecture Notes in Computer
Science 2002, 2452, 185.
127. Schneidman-Duhovny, D.; Inbar, Y.; Nussinov, R.; Wolfson, H. J. Nucl. Acids.
Res. 2005, 33, 363.
128. Ghoorah, A. W.; Smail-Tabbone, M.; Devignes, M. D.; Ritchie, D. W.
Bioinformatics 2013.
129. Ritchie, D. W.; Venkatraman, V. Bioinformatics, 2010, 26, 2398.
130. The PyMOL Molecular Graphics System, Version 1.2r3pre, Schrödinger, LLC.

124
APPENDIX A
DNA AND PROTEIN SEQUENCES OF THE RRM CONSTRUCTS
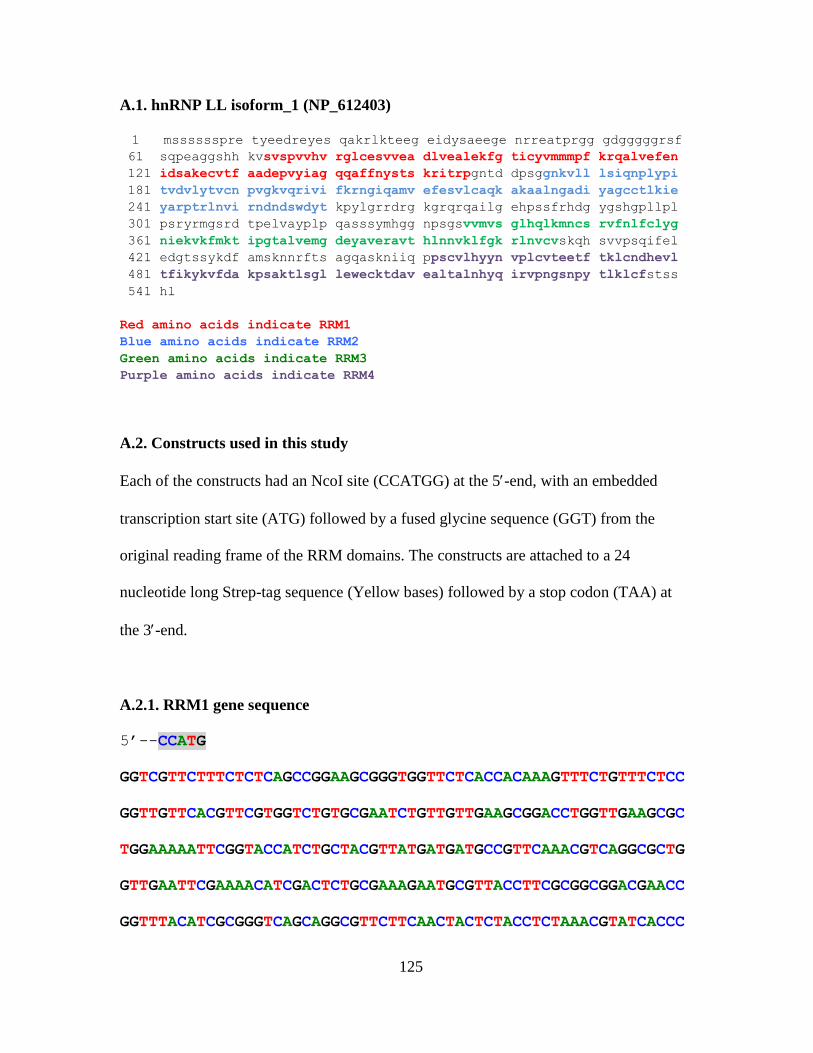
125
A.1. hnRNP LL isoform_1 (NP_612403)
1 msssssspre tyeedreyes qakrlkteeg eidysaeege nrreatprgg gdgggggrsf
61 sqpeaggshh kvsvspvvhv rglcesvvea dlvealekfg ticyvmmmpf krqalvefen
121 idsakecvtf aadepvyiag qqaffnysts kritrpgntd dpsggnkvll lsiqnplypi
181 tvdvlytvcn pvgkvqrivi fkrngiqamv efesvlcaqk akaalngadi yagcctlkie
241 yarptrlnvi rndndswdyt kpylgrrdrg kgrqrqailg ehpssfrhdg ygshgpllpl
301 psryrmgsrd tpelvayplp qasssymhgg npsgsvvmvs glhqlkmncs rvfnlfclyg
361 niekvkfmkt ipgtalvemg deyaveravt hlnnvklfgk rlnvcvskqh svvpsqifel
421 edgtssykdf amsknnrfts agqaskniiq ppscvlhyyn vplcvteetf tklcndhevl
481 tfikykvfda kpsaktlsgl lewecktdav ealtalnhyq irvpngsnpy tlklcfstss
541 hl
Red amino acids indicate RRM1
Blue amino acids indicate RRM2
Green amino acids indicate RRM3
Purple amino acids indicate RRM4
A.2. Constructs used in this study
Each of the constructs had an NcoI site (CCATGG) at the 5-end, with an embedded
transcription start site (ATG) followed by a fused glycine sequence (GGT) from the
original reading frame of the RRM domains. The constructs are attached to a 24
nucleotide long Strep-tag sequence (Yellow bases) followed by a stop codon (TAA) at
the 3-end.
A.2.1. RRM1 gene sequence
5’--CCATG
GGTCGTTCTTTCTCTCAGCCGGAAGCGGGTGGTTCTCACCACAAAGTTTCTGTTTCTCC
GGTTGTTCACGTTCGTGGTCTGTGCGAATCTGTTGTTGAAGCGGACCTGGTTGAAGCGC
TGGAAAAATTCGGTACCATCTGCTACGTTATGATGATGCCGTTCAAACGTCAGGCGCTG
GTTGAATTCGAAAACATCGACTCTGCGAAAGAATGCGTTACCTTCGCGGCGGACGAACC
GGTTTACATCGCGGGTCAGCAGGCGTTCTTCAACTACTCTACCTCTAAACGTATCACCC
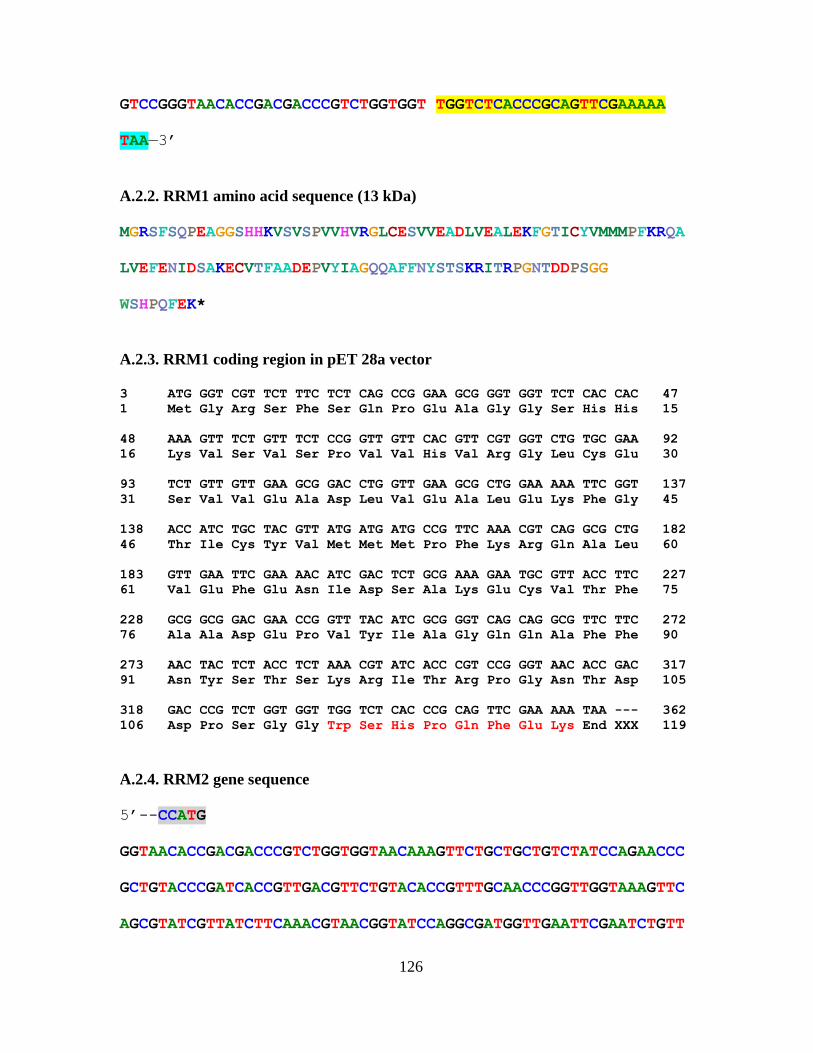
126
GTCCGGGTAACACCGACGACCCGTCTGGTGGT TGGTCTCACCCGCAGTTCGAAAAA
TAA—3’
A.2.2. RRM1 amino acid sequence (13 kDa)
MGRSFSQPEAGGSHHKVSVSPVVHVRGLCESVVEADLVEALEKFGTICYVMMMPFKRQA
LVEFENIDSAKECVTFAADEPVYIAGQQAFFNYSTSKRITRPGNTDDPSGG
WSHPQFEK*
A.2.3. RRM1 coding region in pET 28a vector
3 ATG GGT CGT TCT TTC TCT CAG CCG GAA GCG GGT GGT TCT CAC CAC 47
1 Met Gly Arg Ser Phe Ser Gln Pro Glu Ala Gly Gly Ser His His 15
48 AAA GTT TCT GTT TCT CCG GTT GTT CAC GTT CGT GGT CTG TGC GAA 92
16 Lys Val Ser Val Ser Pro Val Val His Val Arg Gly Leu Cys Glu 30
93 TCT GTT GTT GAA GCG GAC CTG GTT GAA GCG CTG GAA AAA TTC GGT 137
31 Ser Val Val Glu Ala Asp Leu Val Glu Ala Leu Glu Lys Phe Gly 45
138 ACC ATC TGC TAC GTT ATG ATG ATG CCG TTC AAA CGT CAG GCG CTG 182
46 Thr Ile Cys Tyr Val Met Met Met Pro Phe Lys Arg Gln Ala Leu 60
183 GTT GAA TTC GAA AAC ATC GAC TCT GCG AAA GAA TGC GTT ACC TTC 227
61 Val Glu Phe Glu Asn Ile Asp Ser Ala Lys Glu Cys Val Thr Phe 75
228 GCG GCG GAC GAA CCG GTT TAC ATC GCG GGT CAG CAG GCG TTC TTC 272
76 Ala Ala Asp Glu Pro Val Tyr Ile Ala Gly Gln Gln Ala Phe Phe 90
273 AAC TAC TCT ACC TCT AAA CGT ATC ACC CGT CCG GGT AAC ACC GAC 317
91 Asn Tyr Ser Thr Ser Lys Arg Ile Thr Arg Pro Gly Asn Thr Asp 105
318 GAC CCG TCT GGT GGT TGG TCT CAC CCG CAG TTC GAA AAA TAA --- 362
106 Asp Pro Ser Gly Gly Trp Ser His Pro Gln Phe Glu Lys End XXX 119
A.2.4. RRM2 gene sequence
5’--CCATG
GGTAACACCGACGACCCGTCTGGTGGTAACAAAGTTCTGCTGCTGTCTATCCAGAACCC
GCTGTACCCGATCACCGTTGACGTTCTGTACACCGTTTGCAACCCGGTTGGTAAAGTTC
AGCGTATCGTTATCTTCAAACGTAACGGTATCCAGGCGATGGTTGAATTCGAATCTGTT

127
CTGTGCGCGCAGAAAGCGAAAGCGGCGCTGAACGGTGCGGACATCTACGCGGGTTGCTG
CACCCTGAAAATCGAATACGCGCGTCCGACCCGTCTGAACGTTATCCGTAACGACAACG
ACTCTTGGGACTACACCAAACCGTACCTGGGTCGTCGTGACCGTGGTAAAGGT
TGGTCTCACCCGCAGTTCGAAAAA TAA—3’
A.2.5. RRM2 amino acid sequence (16 kDa)
MGNTDDPSGGNKVLLLSIQNPLYPITVDVLYTVCNPVGKVQRIVIFKRNGIQAMVEFES
VLCAQKAKAALNGADIYAGCCTLKIEYARPTRLNVIRNDNDSWDYTKPYLGRRDRGKG
WSHPQFEK*
A.2.6. RRM2 coding region in pET 28a vector. 3 ATG GGT AAC ACC GAC GAC CCG TCT GGT GGT AAC AAA GTT CTG CTG 47
1 Met Gly Asn Thr Asp Asp Pro Ser Gly Gly Asn Lys Val Leu Leu 15
48 CTG TCT ATC CAG AAC CCG CTG TAC CCG ATC ACC GTT GAC GTT CTG 92
16 Leu Ser Ile Gln Asn Pro Leu Tyr Pro Ile Thr Val Asp Val Leu 30
93 TAC ACC GTT TGC AAC CCG GTT GGT AAA GTT CAG CGT ATC GTT ATC 137
31 Tyr Thr Val Cys Asn Pro Val Gly Lys Val Gln Arg Ile Val Ile 45
138 TTC AAA CGT AAC GGT ATC CAG GCG ATG GTT GAA TTC GAA TCT GTT 182
46 Phe Lys Arg Asn Gly Ile Gln Ala Met Val Glu Phe Glu Ser Val 60
183 CTG TGC GCG CAG AAA GCG AAA GCG GCG CTG AAC GGT GCG GAC ATC 227
61 Leu Cys Ala Gln Lys Ala Lys Ala Ala Leu Asn Gly Ala Asp Ile 75
228 TAC GCG GGT TGC TGC ACC CTG AAA ATC GAA TAC GCG CGT CCG ACC 272
76 Tyr Ala Gly Cys Cys Thr Leu Lys Ile Glu Tyr Ala Arg Pro Thr 90
273 CGT CTG AAC GTT ATC CGT AAC GAC AAC GAC TCT TGG GAC TAC ACC 317
91 Arg Leu Asn Val Ile Arg Asn Asp Asn Asp Ser Trp Asp Tyr Thr 105
318 AAA CCG TAC CTG GGT CGT CGT GAC CGT GGT AAA GGT TGG TCT CAC 362
106 Lys Pro Tyr Leu Gly Arg Arg Asp Arg Gly Lys Gly Trp Ser His 120
363 CCG CAG TTC GAA AAA TAA --- 383
121 Pro Gln Phe Glu Lys End XXX 126
A.2.7. RRM3-4 gene sequence
5’--CCATG
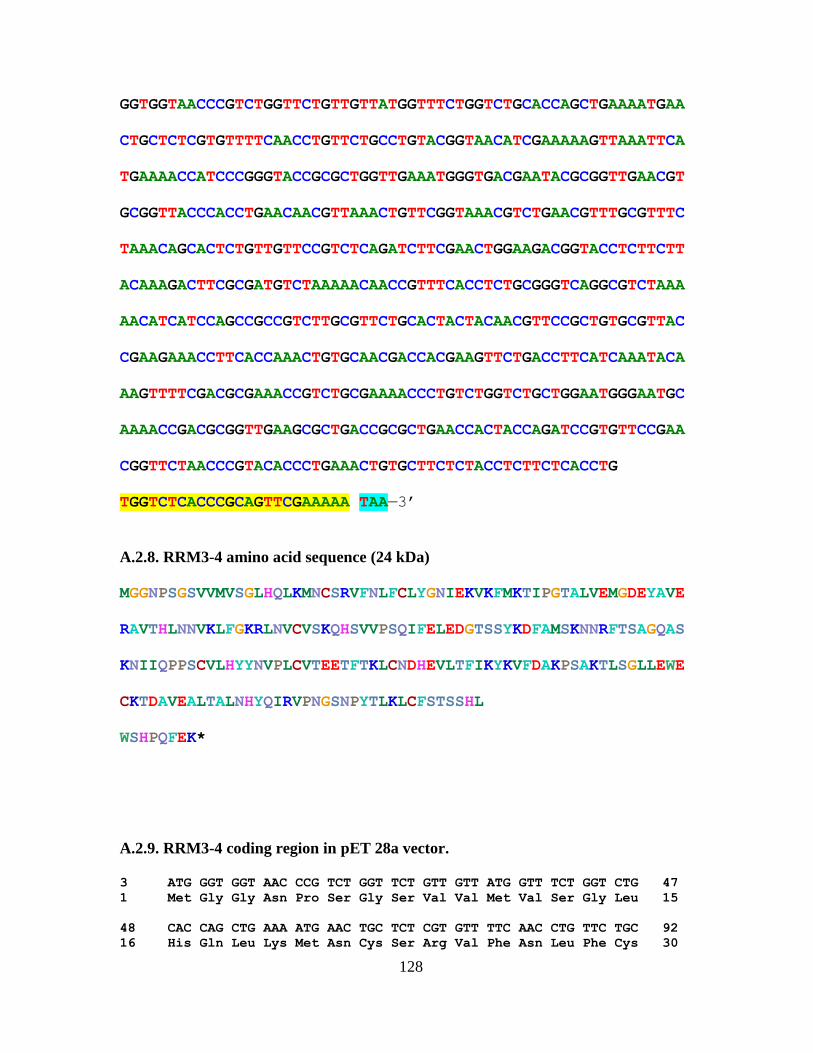
128
GGTGGTAACCCGTCTGGTTCTGTTGTTATGGTTTCTGGTCTGCACCAGCTGAAAATGAA
CTGCTCTCGTGTTTTCAACCTGTTCTGCCTGTACGGTAACATCGAAAAAGTTAAATTCA
TGAAAACCATCCCGGGTACCGCGCTGGTTGAAATGGGTGACGAATACGCGGTTGAACGT
GCGGTTACCCACCTGAACAACGTTAAACTGTTCGGTAAACGTCTGAACGTTTGCGTTTC
TAAACAGCACTCTGTTGTTCCGTCTCAGATCTTCGAACTGGAAGACGGTACCTCTTCTT
ACAAAGACTTCGCGATGTCTAAAAACAACCGTTTCACCTCTGCGGGTCAGGCGTCTAAA
AACATCATCCAGCCGCCGTCTTGCGTTCTGCACTACTACAACGTTCCGCTGTGCGTTAC
CGAAGAAACCTTCACCAAACTGTGCAACGACCACGAAGTTCTGACCTTCATCAAATACA
AAGTTTTCGACGCGAAACCGTCTGCGAAAACCCTGTCTGGTCTGCTGGAATGGGAATGC
AAAACCGACGCGGTTGAAGCGCTGACCGCGCTGAACCACTACCAGATCCGTGTTCCGAA
CGGTTCTAACCCGTACACCCTGAAACTGTGCTTCTCTACCTCTTCTCACCTG
TGGTCTCACCCGCAGTTCGAAAAA TAA—3’
A.2.8. RRM3-4 amino acid sequence (24 kDa)
MGGNPSGSVVMVSGLHQLKMNCSRVFNLFCLYGNIEKVKFMKTIPGTALVEMGDEYAVE
RAVTHLNNVKLFGKRLNVCVSKQHSVVPSQIFELEDGTSSYKDFAMSKNNRFTSAGQAS
KNIIQPPSCVLHYYNVPLCVTEETFTKLCNDHEVLTFIKYKVFDAKPSAKTLSGLLEWE
CKTDAVEALTALNHYQIRVPNGSNPYTLKLCFSTSSHL
WSHPQFEK*
A.2.9. RRM3-4 coding region in pET 28a vector.
3 ATG GGT GGT AAC CCG TCT GGT TCT GTT GTT ATG GTT TCT GGT CTG 47
1 Met Gly Gly Asn Pro Ser Gly Ser Val Val Met Val Ser Gly Leu 15
48 CAC CAG CTG AAA ATG AAC TGC TCT CGT GTT TTC AAC CTG TTC TGC 92
16 His Gln Leu Lys Met Asn Cys Ser Arg Val Phe Asn Leu Phe Cys 30
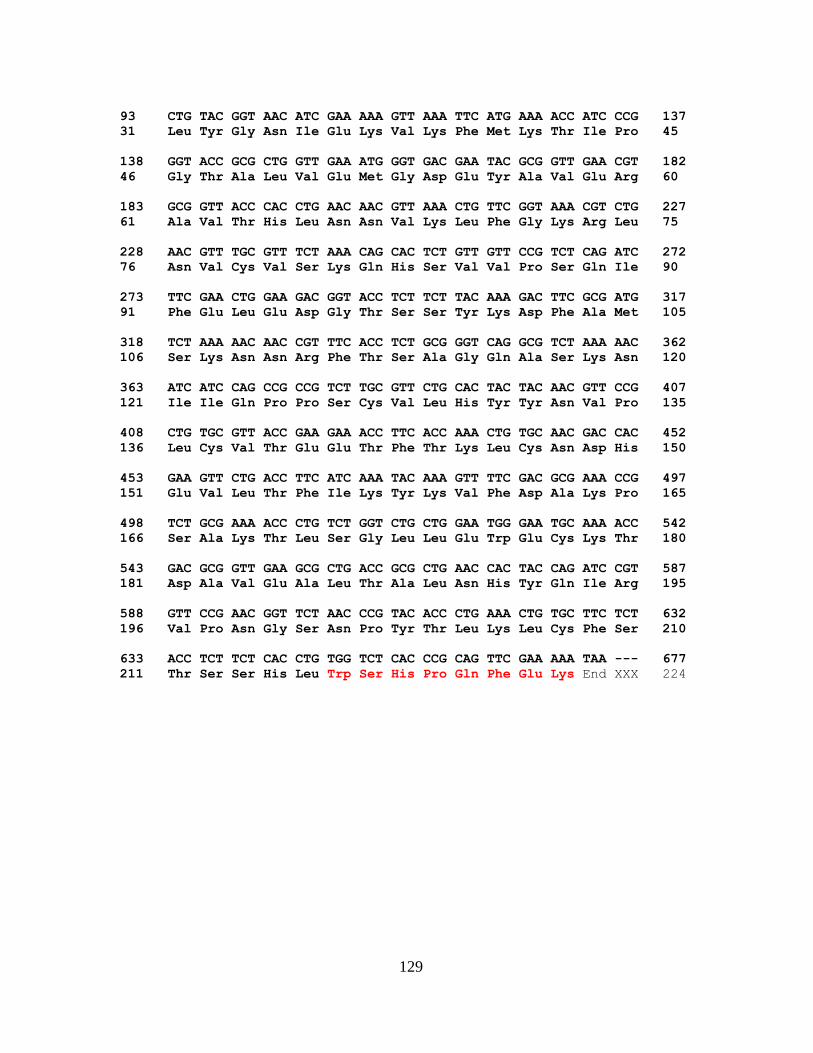
129
93 CTG TAC GGT AAC ATC GAA AAA GTT AAA TTC ATG AAA ACC ATC CCG 137
31 Leu Tyr Gly Asn Ile Glu Lys Val Lys Phe Met Lys Thr Ile Pro 45
138 GGT ACC GCG CTG GTT GAA ATG GGT GAC GAA TAC GCG GTT GAA CGT 182
46 Gly Thr Ala Leu Val Glu Met Gly Asp Glu Tyr Ala Val Glu Arg 60
183 GCG GTT ACC CAC CTG AAC AAC GTT AAA CTG TTC GGT AAA CGT CTG 227
61 Ala Val Thr His Leu Asn Asn Val Lys Leu Phe Gly Lys Arg Leu 75
228 AAC GTT TGC GTT TCT AAA CAG CAC TCT GTT GTT CCG TCT CAG ATC 272
76 Asn Val Cys Val Ser Lys Gln His Ser Val Val Pro Ser Gln Ile 90
273 TTC GAA CTG GAA GAC GGT ACC TCT TCT TAC AAA GAC TTC GCG ATG 317
91 Phe Glu Leu Glu Asp Gly Thr Ser Ser Tyr Lys Asp Phe Ala Met 105
318 TCT AAA AAC AAC CGT TTC ACC TCT GCG GGT CAG GCG TCT AAA AAC 362
106 Ser Lys Asn Asn Arg Phe Thr Ser Ala Gly Gln Ala Ser Lys Asn 120
363 ATC ATC CAG CCG CCG TCT TGC GTT CTG CAC TAC TAC AAC GTT CCG 407
121 Ile Ile Gln Pro Pro Ser Cys Val Leu His Tyr Tyr Asn Val Pro 135
408 CTG TGC GTT ACC GAA GAA ACC TTC ACC AAA CTG TGC AAC GAC CAC 452
136 Leu Cys Val Thr Glu Glu Thr Phe Thr Lys Leu Cys Asn Asp His 150
453 GAA GTT CTG ACC TTC ATC AAA TAC AAA GTT TTC GAC GCG AAA CCG 497
151 Glu Val Leu Thr Phe Ile Lys Tyr Lys Val Phe Asp Ala Lys Pro 165
498 TCT GCG AAA ACC CTG TCT GGT CTG CTG GAA TGG GAA TGC AAA ACC 542
166 Ser Ala Lys Thr Leu Ser Gly Leu Leu Glu Trp Glu Cys Lys Thr 180
543 GAC GCG GTT GAA GCG CTG ACC GCG CTG AAC CAC TAC CAG ATC CGT 587
181 Asp Ala Val Glu Ala Leu Thr Ala Leu Asn His Tyr Gln Ile Arg 195
588 GTT CCG AAC GGT TCT AAC CCG TAC ACC CTG AAA CTG TGC TTC TCT 632
196 Val Pro Asn Gly Ser Asn Pro Tyr Thr Leu Lys Leu Cys Phe Ser 210
633 ACC TCT TCT CAC CTG TGG TCT CAC CCG CAG TTC GAA AAA TAA --- 677
211 Thr Ser Ser His Leu Trp Ser His Pro Gln Phe Glu Lys End XXX 224

130
APPENDIX B
LIST OF PRIMERS FOR RRM1 MUTAGENESIS
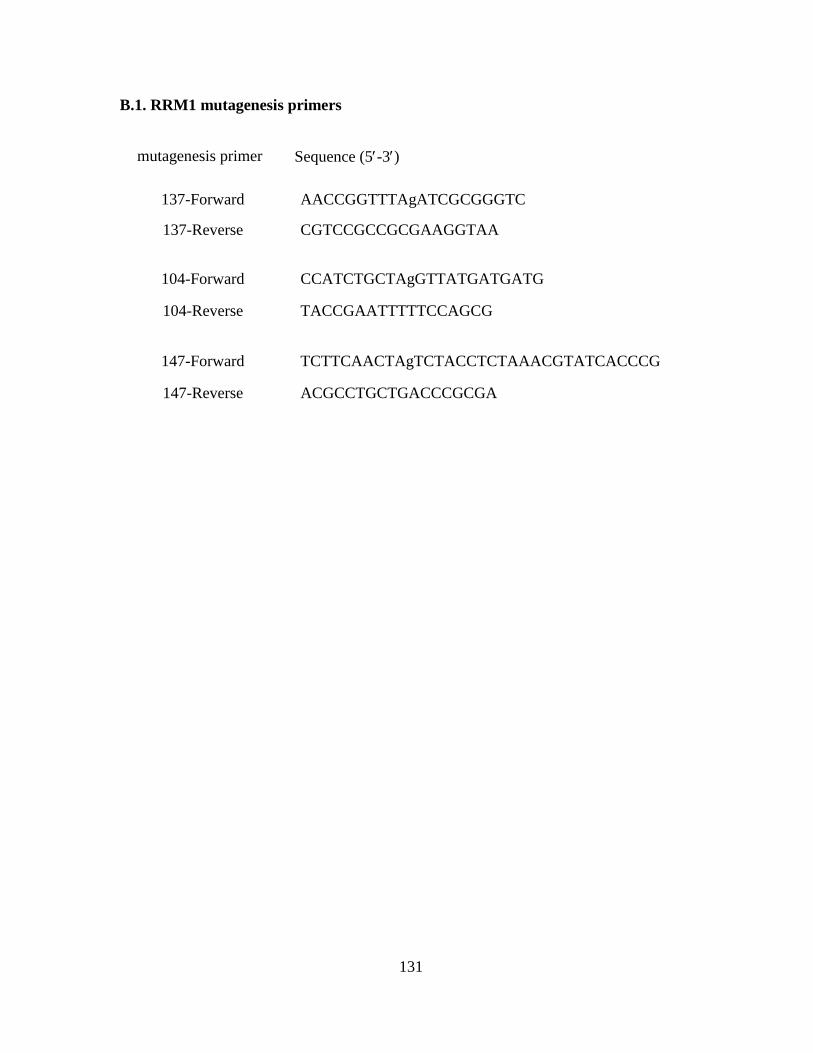
131
B.1. RRM1 mutagenesis primers
mutagenesis primer Sequence (5-3)
137-Forward AACCGGTTTAgATCGCGGGTC
137-Reverse
CGTCCGCCGCGAAGGTAA
104-Forward CCATCTGCTAgGTTATGATGATG
104-Reverse
TACCGAATTTTTCCAGCG
147-Forward TCTTCAACTAgTCTACCTCTAAACGTATCACCCG
147-Reverse
ACGCCTGCTGACCCGCGA