Embed Size (px)
Citation preview

1
KINGS OF CAPITALAN INVESTMENT STRATEGY FROM MARCELLUS INVESTMENT MANAGERS
Private & Confidential.
Contact:[email protected]

22
INDIA’S FINANCIAL SERVICES SECTOR HAS BEEN
HAMMERED OVER THE PAST 7 YEARS
Private & Confidential.
India’s banking sector was suffering with rising NPAs even before the Covid-19 crisis hit us
18,000
22,000
26,000
30,000
1-Feb-20 11-Feb-20 21-Feb-20 2-Mar-20 12-Mar-20 22-Mar-20 1-Apr-20
Bank Nifty is down 39% during 1st Feb to 1st April
Bank Nifty
The Covid-19 lockdown has made the situation worse by putting further pressure on weak lenders
- Dec 2016, The Indian Express
- Sep 2018, The Indian Express
- July 2019, The Mint
- Mar 2020, The Indian Express
- Dec 2018, The Economic TimesSource: RBI
Source: NSE
- Apr 2020, Financial Times
- Apr 2020, Business Today
- Apr 2020, Business Standard
- Mar 2020, Financial express
- Apr 2020, Economic Times
3%4% 4%
8%
9%
11%
9%8%
0%
2%
4%
6%
8%
10%
12%
FY13 FY14 FY15 FY16 FY17 FY18 FY19 FY20
Banking sector GNPA%

33
HOWEVER, INVESTING IN HIGH QUALITY FINANCIAL STOCKS
DURING A CRISIS PROVES TO BE HIGHLY REWARDING
2008-09 global financial crisis
Invest when the Bank Nifty is at its lowest
Invest 3 months before the Bank Nifty
is at its lowest
Bank Nifty Nifty50 Bank Nifty Nifty50
1 yr return 164% 96% 101% 80%
3 yr CAGR returns 45% 28% 23% 19%
5 yr CAGR returns 28% 20% 21% 17%
Late 90s & early 2000s NBFC crisis
Invest when the Bank Nifty is at its lowest
Invest 3 months before the Bank Nifty
is at its lowest
Bank Nifty Nifty50 Bank Nifty Nifty50
1 yr return 35% 11% 11% -3%
3 yr CAGR returns 49% 26% 32% 12%
5 yr CAGR returns 46% 33% 30% 22%
Bank Nifty delivered 3- yr
CAGR of 23% even if inv. 3 months
before the bottom
Bank Nifty delivered 3- yrCAGR of 32% even if inv. 3
months before the bottom
? - Sep 2008, Wall Street Journal
- Apr 2009, Reuters
Note: During the 2008-09 crisis, the Bank Nifty was at its lowest on 9th Mar, 2009; Source: NSE
Note: During the NBFC crisis, the Bank Nifty was at its lowest on 24th Sep, 2001; Source: NSE
Extreme negativity during a crisis provide opportunities to long term investors
- Nov 2008, The Mint
Source: NSE - Sep 2018, CNBC
- Oct 2013, Wall Street Journal0
5,000
10,000
15,000
20,000
25,000
30,000
35,000
Jul-
00
Jul-
02
Jul-
04
Jul-
06
Jul-
08
Jul-
10
Jul-
12
Jul-
14
Jul-
16
Jul-
18
Jul-
20
Bank Nifty vs. Nifty
Nifty 50 Bank Nifty

44Private & Confidential.
THREE QUESTIONS THAT NEED TO BE ANSWERED
Question 1: How does one know that the crisis is
bottoming out?
Question 3: How does one know when to sell?
Question 2: Even if the crisis is bottoming out, how does
one select the right Financial Services stocks to
invest in?
18,000
22,000
26,000
30,000
Bank Nifty since 1st Feb, 2020
Bank Nifty
Growth? Value?
Management?
Governance?
Challenger?Leader?
Brand?
Source: NSE

55Private & Confidential.
THE FOUNDATIONS OF INDIA’S ECONOMIC RECOVERY ARE IN
PLACE
• Four times in four decades – a strong economic recovery in India has been preceded by a congruence of three events –a) US recession b) alongside Falling US bond yields c) Falling oil prices
• All ingredients now in place for sustained recovery in Indian earnings growth over the next few years:a) Cheap oil b) Cheap money c) GST implementation d) Corporate tax rate cuts
• The Financial Services sector is a leveraged play on the Indian economy and hence will benefit most from the recovery. However, aswe will see in the coming slides, certain companies will benefit more than the others
-
2
4
6
8
10
12
14
16
0
20
40
60
80
100
120
140
160
1983 1985 1987 1989 1991 1993 1995 1997 1999 2001 2003 2005 2007 2009 2011 2013 2015 2017 2019
US 1
0 year b
on
d yield
(%)
Bre
nt
cru
de
oil
pri
ce (
$ p
er b
arre
l)
Brent crude oil price (US$ per barrel)(LHS), US 10 year bond yield (%)(RHS), increase in Indian Real GDP growth rate shaded in green and negative US Real GDP growth rate shaded in grey
Improvement in India's Real GDP growth phase Negative US Real GDP growth phase
Crude Oil Price ($ per barrel) (LHS) US 10 year bond yield (%) (RHS)
?
Source: Marcellus Investment Managers, Bloomberg

66
0%
5%
10%
15%
20%
25%
30%
35%
0%
2%
4%
6%
8%
10%
12%
14%
16%
Ban
kin
g se
cto
r G
NP
A%
Banking sector GNPA% Banking sector advances growth%
Private & Confidential.
A LONG TERM HISTORICAL VIEW OF INDIAN CREDIT CYCLES
SUGGESTS THAT CREDIT GROWTH RECOVERY IS INEVITABLE
RecoveryCrisisBoomCrisis
CRB Capital goes bust, hundreds of NBFCs shut down
GFC – poor quality lenders
suffer mostPhase of high growth and low
NPAs – all lenders flourish
As economy recovers good
lenders rapidly gain market share
NFBCs and HFCs start growing
rapidly
RecoveryAs economy
recovers good lenders rapidly
gain market share
Boom Crisis
ILFS and NBFC crisis now combined with
a pandemic
What is certainly clear is that again and again, countries, banks, individuals, and firms take on excessive debt in good times withoutenough awareness of the risks that will follow when the inevitable recession hits. This time may seem different, but all too often adeeper look shows it is not… More money has been lost because of four words than at the point of a gun. Those words are ‘This time isdifferent.’ – Carmen Reinhart and Kenneth Rogoff, ‘This Time Is Different: Eight Centuries of Financial Folly’ (2009)
• As illustrated in the exhibit above, every credit crisis in India has been followed by a period of recovery and eventually rapid growth• History has taught us that recovery of India’s credit growth and as a result the growth of India’s banking sector is inevitable no matter
how gloomy the picture might look sitting in the middle of a crisis• However, it is important to note that not all lenders are able to survive a crisis or come out of a crisis without long term
ramifications. It is therefore important to build a handpicked portfolio of high quality financial companies
Source: RBI

77Private & Confidential.
GOOD QUALITY LENDERS TEND TO GAIN MARKET SHARE
POST A CRISIS
Winners in the financials sector: There are only two factors to take a call on:a) will the lender be able to survive through the crisis without any bail-outs?; andb) will the lender have enough strength on the liabilities side of the balance sheet on the other side of the crisis tohelp accelerate loan book growth and lead the consolidation of market share once the crisis is behind us?A. The well-funded lenders are able to absorb any NPA blow and therefore are amongst the 'last men standing’B. Once India’s COVID-19 outbreak is over, competition will reduce for well-funded lenders and
a) Their loan book growth will accelerate because of their best quality liabilities franchiseb) Their NPA ratios will fall materiallyc) NIMs will expand as these lenders will be able to pick and choose borrowers
C. As point B above is implemented, P/E multiples compression will fully reverse and earnings will grow at anaccelerated pace
FY96 FY97 FY98 FY99 FY00 FY01 FY02 FY03 FY04 FY06 FY07 FY08 FY09 FY10 FY11 FY12 FY13 FY14
PAT growth% 34% 27% 18% 14% 20% 18% 22% 19% 23% PAT growth% 31% 31% 39% 41% 31% 33% 32% 30% 26%
Loan bk growth% 27% 20% 22% 18% 22% 31% 30% 26% 29% Loan bk growth% 37% 34% 35% 56% 27% 27% 22% 23% 26%
NIM% 3.3% 3.7% 3.0% 2.4% 2.2% 2.4% 2.8% 3.0% 3.2% NIM% 3.6% 4.0% 4.1% 4.2% 3.9% 4.1% 4.1% 4.2% 4.0%
GNPA% 0.5% 0.7% 1.0% 0.9% 0.8% 0.9% 1.0% 1.2% GNPA% 1.5% 1.4% 1.4% 2.0% 1.4% 1.1% 1.0% 1.0% 1.0%
P/E ratio 20.1 13.6 13.1 8.1 11.3 13.8 14.4 11.7 18.7 P/E ratio 27.8 26.6 29.4 18.3 30 27.8 23.6 22.1 21.2
RoE% 17% 16% 17% 18% 20% 21% 23% 24% 27% RoE% 16% 19% 18% 17% 17% 17% 19% 21% 19%
Performance of HDFC Ltd. during the NBFC crisis of the late 1990s
Source: Marcellus Investment Managers, Ace Equity
Performance of HDFC Bank during the 2008-09 global financial crisis
Source: Marcellus Investment Managers, Ace Equity; Note: Adjusting for the CBOP merger, FY09 PAT growth would have been 34% and
advances growth would have been 38%

88
Portfolio of 10 to 14 financial
companies
Forensic Accounting Screen - Eliminate companies with sub-par accounting
The universe: All financial stocks including banks, NBFCs, general
insurers, life insurers, brokers and asset managers
Use of proprietary capital allocation models spanning the past 6 years of
data
3rd party/channel checks, management meetings
Typically avoid ‘Zone of thuggery’ candidates
(refer next slide)
Corroborating ‘management version’ with channel feedbacks
+ independent views on governance/capital allocation
Detailed analysis of annual reports and published financials
THE MARCELLUS INVESTMENT FUNNEL FOR INVESTING IN
GREAT FRANCHISES
Run forensic filter on the 93
stocks
Note: Mkt cap of companies is as on 27th Nov, 2020
65 stocks remain, Median mkt cap of Rs. 14,452 Cr
23 stocks, median mkt. cap of Rs. 31,860 Cr
Source: Ace Equity
12 stock portfolio, median mkt. cap of Rs. 60,012 Cr
Universe of 95 financial stocks with median mkt cap of Rs.
10,191 Cr

99
A few of our forensic ratiosMethodology11 accounting ratios covering income statement (revenue/ earningsmanipulation), balance sheet (correct representation ofassets/liabilities), NPA recognition and audit quality checks.
Six years of historical consolidated financials.
First rank stocks on each of the 11 ratios individually (someexamples outlined in the table on the right). These ranks thencumulated across parameters to give a final pecking order onaccounting quality for stocks.
Selection of these ratios has been inspired by Howard M. Schilit’slegendary forensic accounting book ‘Financial Shenanigans’.
20%
6% 7%
-11% -10% -12% -11%
-24%-28%
-23%
-40%
-30%
-20%
-10%
0%
10%
20%
30%
D1 D2 D3 D4 D5 D6 D7 D8 D9 D10
Shar
e p
rice
re
turn
s %
CY16-CY19 CAGR
Zone of Quality
Zone of Thuggery
Zone of Opacity
11%
53%
-15%
3%10%
-21%-8%
-32% -35%-25%
-50%
-30%
-10%
10%
30%
50%
70%
CY16 CY17 CY18 CY19 CY16-19CAGR
Shar
e p
rice
re
turn
s %
Zone of Quality Zone of Thuggery
Quality wins and wins big over the long term
Checks Ratio
Income Statement
1) Fee income as a % of net int. income2) Volatility in net interest income yields
Balance Sheet
1) Contingent liability as % of networth2) NPA volatility
Auditor Growth in auditors’ remuneration to growth in net interest income
Private & Confidential.
FORENSIC ACCOUNTING TO IDENTIFY COMPANIES WITH CLEAN
ACCOUNTING PROVES TO BE HIGHLY REWARDING
Strong correlation between accounting quality andshareholders’ returns
Source: Marcellus Investment Managers, NSE Source: Marcellus Investment Managers, NSE
23x for Yes Bank vs. 4x
for Kotak
54% for Yes Bank vs. 28% for Kotak
1010
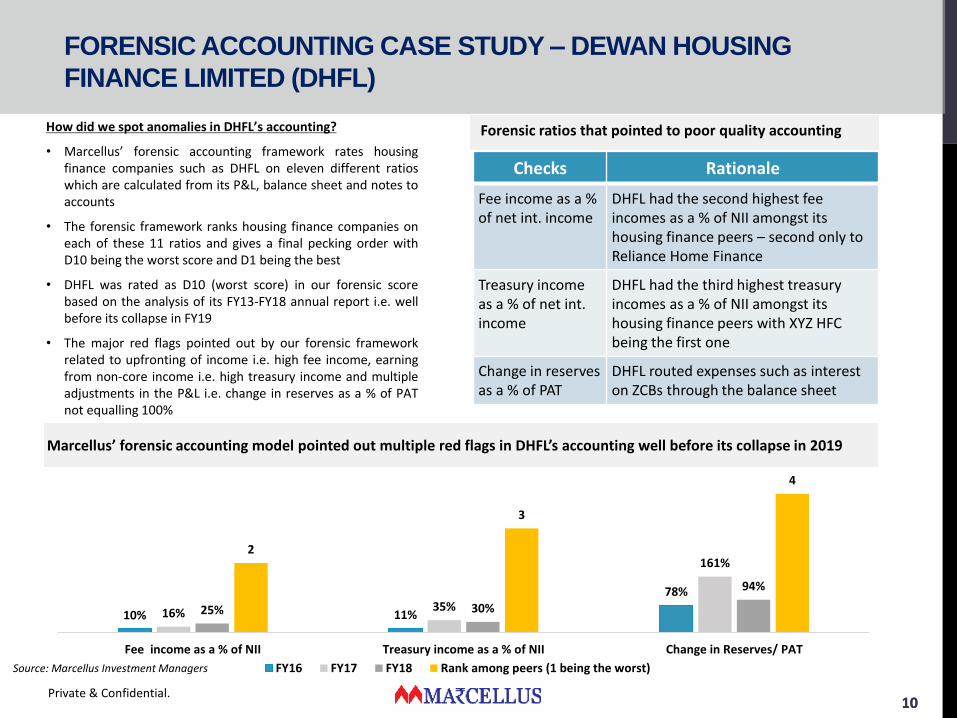
Forensic ratios that pointed to poor quality accountingHow did we spot anomalies in DHFL’s accounting?
• Marcellus’ forensic accounting framework rates housingfinance companies such as DHFL on eleven different ratioswhich are calculated from its P&L, balance sheet and notes toaccounts
• The forensic framework ranks housing finance companies oneach of these 11 ratios and gives a final pecking order withD10 being the worst score and D1 being the best
• DHFL was rated as D10 (worst score) in our forensic scorebased on the analysis of its FY13-FY18 annual report i.e. wellbefore its collapse in FY19
• The major red flags pointed out by our forensic frameworkrelated to upfronting of income i.e. high fee income, earningfrom non-core income i.e. high treasury income and multipleadjustments in the P&L i.e. change in reserves as a % of PATnot equalling 100%
10% 11%
78%
16% 35%
161%
25% 30%
94%
2
3
4
Fee income as a % of NII Treasury income as a % of NII Change in Reserves/ PAT
FY16 FY17 FY18 Rank among peers (1 being the worst)
Checks Rationale
Fee income as a % of net int. income
DHFL had the second highest fee incomes as a % of NII amongst its housing finance peers – second only to Reliance Home Finance
Treasury income as a % of net int. income
DHFL had the third highest treasury incomes as a % of NII amongst its housing finance peers with XYZ HFC being the first one
Change in reserves as a % of PAT
DHFL routed expenses such as interest on ZCBs through the balance sheet
Private & Confidential.
Marcellus’ forensic accounting model pointed out multiple red flags in DHFL’s accounting well before its collapse in 2019
Source: Marcellus Investment Managers
FORENSIC ACCOUNTING CASE STUDY – DEWAN HOUSING
FINANCE LIMITED (DHFL)

1111Private & Confidential.
OUR KINGS OF CAPITAL PORTFOLIO WILL SPAN THE ENTIRE
FINANCIAL SERVICES SECTOR
Lenders – long track record of prudent
credit underwriting, smart capital
allocation and good corporate governance
Life insurers – large distribution footprint,
customer centric product innovation
and an effective actuarial risk management
framework
General insurers –focus on long term
profitability and return on equity and a track
record of conservative underwriting across
cycles
Asset managers/ brokers – moated
business models and strong pricing power
10 to 14 portfolio companies of
Marcellus’ Kings of Capital Portfolio
• We will create a portfolio of 10 to 14 high quality financial companies with clean books of accounts, a long historical trackrecord of profitable growth and promoters with prudent capital allocation skills
• To benefit from the financialization of Indian household savings over the next decade, the portfolio will consist of the fullspectrum of financial service providers – lenders (banks, NBFCs and housing finance companies), life insurers, generalinsurers and asset managers/brokers
• Financial companies are leveraged businesses and hence the impact of poor accounting quality is magnified. By virtue ofMarcellus’ intense focus on accounting quality and corporate governance, we have a good chance of avoiding extremedownfalls (see slide 13 for more details)
• A portfolio of financial companies which have a long historical track record of profitable growth and prudent capitalallocation, will stand to benefit from the demise of the public sector institutions across the financial landscape andacceleration in market share gains caused by the multiple disruptions caused in the financial industry over the past few years
1212Private & Confidential.
INSURERS, ASSET MANAGERS AND BROKERS ADD
RESILIENCE TO THE PORTFOLIO – FY20 IS A GOOD EXAMPLE
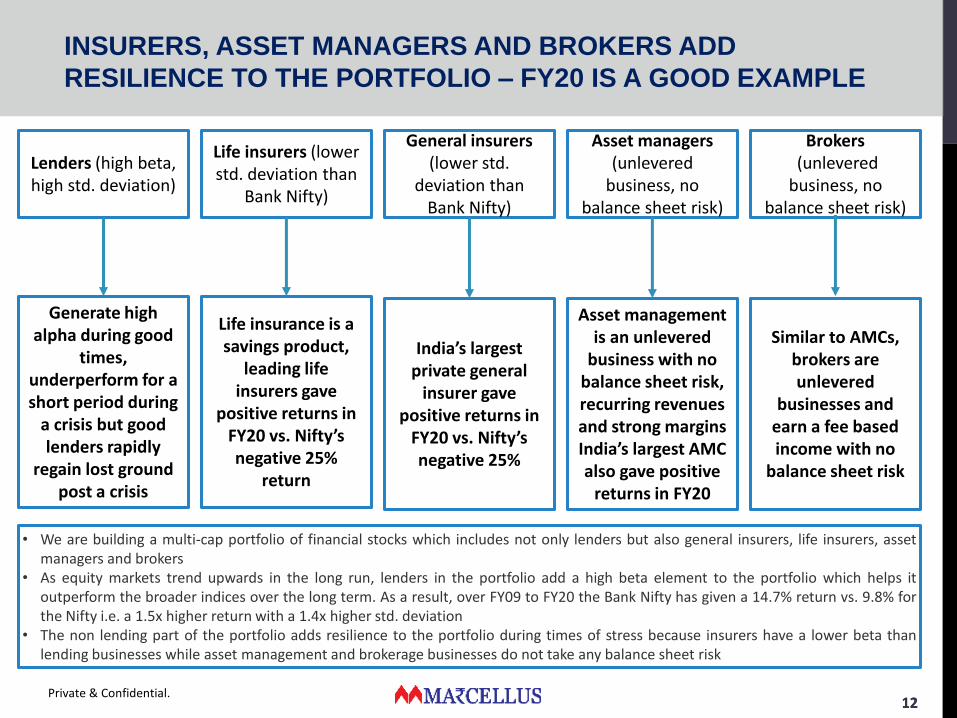
• We are building a multi-cap portfolio of financial stocks which includes not only lenders but also general insurers, life insurers, assetmanagers and brokers
• As equity markets trend upwards in the long run, lenders in the portfolio add a high beta element to the portfolio which helps itoutperform the broader indices over the long term. As a result, over FY09 to FY20 the Bank Nifty has given a 14.7% return vs. 9.8% forthe Nifty i.e. a 1.5x higher return with a 1.4x higher std. deviation
• The non lending part of the portfolio adds resilience to the portfolio during times of stress because insurers have a lower beta thanlending businesses while asset management and brokerage businesses do not take any balance sheet risk
Lenders (high beta, high std. deviation)
Life insurers (lower std. deviation than
Bank Nifty)
General insurers (lower std.
deviation than Bank Nifty)
Asset managers (unlevered
business, no balance sheet risk)
Brokers (unlevered
business, no balance sheet risk)
Generate high alpha during good
times, underperform for a short period during
a crisis but good lenders rapidly
regain lost ground post a crisis
Life insurance is a savings product,
leading life insurers gave
positive returns in FY20 vs. Nifty’s negative 25%
return
India’s largest private general
insurer gave positive returns in
FY20 vs. Nifty’s negative 25%
Asset management is an unlevered
business with no balance sheet risk, recurring revenues and strong margins India’s largest AMC also gave positive
returns in FY20
Similar to AMCs, brokers are unlevered
businesses and earn a fee based income with no
balance sheet risk
1313Private & Confidential.
A PORTFOLIO OF LENDERS AND NON LENDERS GENERATE
ALPHA ALONG WITH BETTER SHARPE RATIOS
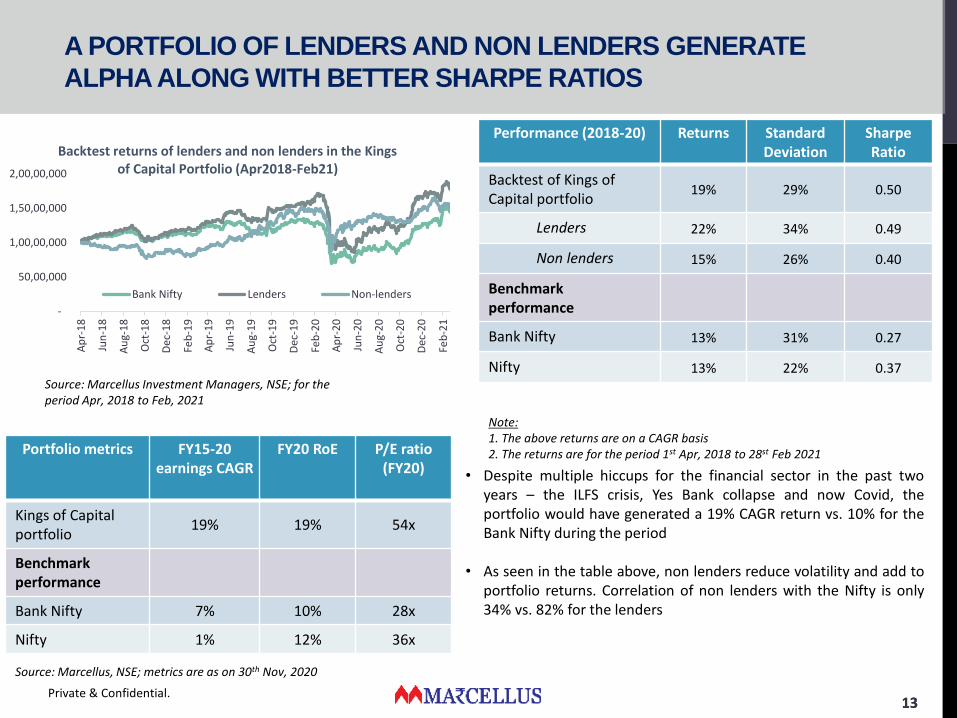
Note:1. The above returns are on a CAGR basis2. The returns are for the period 1st Apr, 2018 to 28st Feb 2021
• Despite multiple hiccups for the financial sector in the past twoyears – the ILFS crisis, Yes Bank collapse and now Covid, theportfolio would have generated a 19% CAGR return vs. 10% for theBank Nifty during the period
• As seen in the table above, non lenders reduce volatility and add toportfolio returns. Correlation of non lenders with the Nifty is only34% vs. 82% for the lenders
Source: Marcellus Investment Managers, NSE; for the period Apr, 2018 to Feb, 2021
Portfolio metrics FY15-20 earnings CAGR
FY20 RoE P/E ratio (FY20)
Kings of Capital portfolio
19% 19% 54x
Benchmark performance
Bank Nifty 7% 10% 28x
Nifty 1% 12% 36x
Source: Marcellus, NSE; metrics are as on 30th Nov, 2020
Performance (2018-20) Returns Standard Deviation
Sharpe Ratio
Backtest of Kings of Capital portfolio
19% 29% 0.50
Lenders 22% 34% 0.49
Non lenders 15% 26% 0.40
Benchmark performance
Bank Nifty 13% 31% 0.27
Nifty 13% 22% 0.37
-
50,00,000
1,00,00,000
1,50,00,000
2,00,00,000
Ap
r-1
8
Jun
-18
Au
g-1
8
Oct
-18
Dec
-18
Feb
-19
Ap
r-1
9
Jun
-19
Au
g-1
9
Oct
-19
Dec
-19
Feb
-20
Ap
r-2
0
Jun
-20
Au
g-2
0
Oct
-20
Dec
-20
Feb
-21
Backtest returns of lenders and non lenders in the Kings of Capital Portfolio (Apr2018-Feb21)
Bank Nifty Lenders Non-lenders

1414Private & Confidential.
HOW DO WE KNOW WHEN TO SELL? (1/2)
We plan to sell when:• The next raging economic boom is upon us – usually 3 to 4 years after a crisis• Banks and NBFCs start raising money through IPOs and QIPs again• NBFCs start borrowing from the CP market on a large scale and poor-quality banks and NBFCs start growing rapidly
2008-09 global financial crisis
Invest when the Bank Nifty is at its lowest
Invest 3 months before the Bank Nifty is at its
lowest
Bank Nifty Nifty50 Bank Nifty Nifty50
1 yr return 164% 96% 101% 80%
3 yr CAGR returns 45% 28% 23% 19%
5 yr CAGR returns 28% 20% 21% 17%
Late 90s & early 2000s NBFC crisis
Invest when the Bank Nifty is at its lowest
Invest 3 months before the Bank Nifty is at its
lowest
Bank Nifty Nifty50 Bank Nifty Nifty50
1 yr return 35% 11% 11% -3%
3 yr CAGR returns 49% 26% 32% 12%
5 yr CAGR returns 46% 33% 30% 22%
Investing during a crisis proves to be very lucrative..
…and exiting 3 to 4 years after a crisis is prudent capital allocation..
Source: NSE
2008-09 global financial crisis
Exit 4 years after investing in Bank Nifty at
its lowest point
Exit 4 years after investing in Bank Nifty 3 months before its lowest
point
Bank Nifty Nifty50 Bank Nifty Nifty50
1 yr return post exit -1% 10% -2% 8%
3 yr CAGR returns 8% 8% 11% 9%
Late 90s & early 2000s NBFC crisis
Exit 4 years after investing in Bank Nifty at
its lowest point
Exit 4 years after investing in Bank Nifty 3 months before its lowest
point
Bank Nifty Nifty50 Bank Nifty Nifty50
1 yr return 13% 42% 5% 39%
3 yr CAGR returns 12% 19% 15% 25%
Note: During the 2008-09 crisis, the Bank Nifty was at its lowest on 9th Mar, 2009
Note: During the NBFC crisis, the Bank Nifty was at its lowest on 24th Sep, 2001

1515
-60%
-10%
40%
90%
140%
0
20
40
60
80
100
120
20
07
20
08
20
09
20
10
20
11
20
12
20
13
20
14
20
15
20
16
20
17
20
18
20
19
20
20
Cal
end
ar y
ear
Ban
k N
ifty
ret
urn
s
No
. of
IPO
s d
uri
ng
the
year
No. of IPOs Average no. of IPOs in a year Bank Nifty return
Private & Confidential.
HOW DO WE KNOW WHEN TO SELL? (2/2)
Years which see a large number of IPOs are signs of a raging bull market and are a good time to exit financial stocks
Narrowing of spread between commercial paper and treasury bond yields are a good SELL sign
Year No. of IPOs Next 1-yr Bank Nifty return
2007 108 -51%
2010 66 -28%
2017 38 7%
Investors could have avoided the two most severeBank Nifty drawdowns in the past decade by followingthe simple strategy of exiting financial stocks duringyears which see a large number of IPOs
0
5,000
10,000
15,000
20,000
25,000
30,000
35,000
-1
0
1
2
3
4
5
6
7
8
Ap
r-0
6
Ap
r-0
7
Ap
r-0
8
Ap
r-0
9
Ap
r-1
0
Ap
r-1
1
Ap
r-1
2
Ap
r-1
3
Ap
r-1
4
Ap
r-1
5
Ap
r-1
6
Ap
r-1
7
Ap
r-1
8
Ban
k N
ifty
ind
ex
% s
pre
ad b
etw
een
T-
bill
s an
d C
P
yiel
d
% Spread between CP index and T-bill index Bank Nifty
Year Min. CP and T-bill spread
during the yr*
Next 1-yr Bank Nifty return
2007 -0.04% -51%
2010 -0.47% -28%
2017 0.47% 7%
Similarly, 3 instances in the past decade where narrowing spreads between Commercial Paper (CP) and Treasury yields were a clear SELL sign
Source: Bloomberg
Source: SEBI, NSE
Sell
Sell
SELL
SELL
SELL
* This is the minimum spread between commercial paper yield and treasury bill yield during the calendar year
Sell

1616
“We had been showing ALM data for the pastfive years. Two years ago, nobody paid muchattention to it, so we pushed it back as anannexure in our presentations. Now wheninvestors ask for it, I tell myself, ‘Thank God, Idid not treat ALM as an annexure to mybusiness model”— Rajeev Jain, MD, Bajaj Financeo Found a niche, differentiated business
opportunity in consumer durable financing10 years ago. Today, more than 70% of allconsumer durables financing in India isdone by Bajaj Finance
o Focus on high velocity, small ticket sizelending with turnaround times andcustomer convenience as thedifferentiation rather than interest rates
o Ability to switch gears across productsbased on data driven risk and underwritingmodels. Completely stopped constructionequipment financing in 2014 due to mutedRoE and profitability prospects
Source: Company financial reports & analyst reportsAbove data is purely for information purposes and does not construe to be an offer or solicitation of an offer to buy/sell any securities nor is to be construed as research.
Private & Confidential.
CASE STUDY: BAJAJ FINANCE (BIG DATA IS BARRIER TO ENTRY)
Indicators FY08 FY20 CAGR
AUM (Rs. Cr) 2,478 1,47,153 41%
PBT (Rs. Cr) 30 7,322 58%
RoA 0.9% 4.1%
RoE 3.2% 20.2%
NNPA 7.05% 0.65%
Key Performance Matrices: Bajaj Finance (FY 2008 -20)

1717Private & Confidential.
‘We are going to position ourselves as a world-class financial institution. We want to do things that are comparable to the best in the world. The ability to scale up is hard. So the best model for us is concentrated India, diversified financial services, and through this, we can get significant scale on an Indian platform.’ — Uday Kotak, MD & CEO, Kotak Mahindra Banko Conservative approach to lending without any concentrated bets on a sector or troubled corporate groups has
helped them come out stronger through multiple credit cycles o HDFC Bank has focussed on processes. Kotak on the other hand has been built with a strong entrepreneurial
culture. As seen in the chart above, smart capital allocation calls have led to shareholder wealth creationo Have been able to achieve an all-time high CASA ratio of 56% at a time when many financial institutions are
struggling to raise depositsSource: Company financial reports, analyst reports, NSEAbove data is purely for information purposes and does not construe to be an offer or solicitation of an offer to buy/sell any securities nor is to be construed as research.
CASE STUDY: KOTAK MAHINDRA BANK (PERFECTION IN
CAPITAL ALLOCATION)
JV with Ford
Credit
Equity JV with
Goldman
Life insurance JV
with Old Mutual Got
banking
license Ford exits
Launch of
811
Merger
with ING
VysyaAggressive
corporate
lending foray
CASA at
56%Rs. 5,800
Crore QIP
Rs. 1,600
Crore QIPGoldman
exits
0
500
1,000
1,500
2,000
2,500
Mar
-95
Oct
-95
May
-96
Dec
-96
Jul-
97
Feb
-98
Sep
-98
Ap
r-9
9
No
v-9
9
Jun
-00
Jan
-01
Au
g-0
1
Mar
-02
Oct
-02
May
-03
Dec
-03
Jul-
04
Feb
-05
Sep
-05
Ap
r-0
6
No
v-0
6
Jun
-07
Jan
-08
Au
g-0
8
Mar
-09
Oct
-09
May
-10
Dec
-10
Jul-
11
Feb
-12
Sep
-12
Ap
r-1
3
No
v-1
3
Jun
-14
Jan
-15
Au
g-1
5
Mar
-16
Oct
-16
May
-17
Dec
-17
Jul-
18
Feb
-19
Sep
-19
Ap
r-2
0
Kotak Mahindra Bank Share Price Return

1818
“When we came here, we had foreign bankswith products and services and nationalizedbanks with brand and money — and we saidwe will bring both together.”— Aditya Puri, MD, HDFC Bank
o Strategic focus on building a low-costfranchise – first to build low cost CASAfranchise, first to introduce “at parcheques” for cooperative banks in returnof these banks keeping interest freedeposits with HDFC Bank.
o Heavy focus from 2000 on building amarket leading position retail franchise –pioneer in mobile banking.
o Learns from others’ mistakes beforeventuring in any new segment - startedpushing credit card business post Lehmancrisis and is now the market leader insegment.
Source: Company financial reports, analyst reports, NSEAbove data is purely for information purposes and does not construe to be an offer or solicitation of an offer to buy/sell any securities nor is to be construed as research.
Private & Confidential.
CASE STUDY: HDFC BANK (THE SOP BANK)
Indicators HDFC BankICICIBank
AXIS Bank
Net Interest Margins 4.4 % 3.3 % 3.3 %
Gross NPA to Gross Advances 1.1 % 6.3 % 4.6 %
Avg. ROAs 1.9 % 1.0 % 0.8 %
Avg. ROEs 17.7 % 9.4 % 8.5 %
Key Performance Matrices: HDFC Bank vs Peers (FY 2015 -20)
Share Price (rebased to 100) over 10 Years- HDFC Bank vs Peers
-
100
200
300
400
500
600
700
800
Mar
-10
Au
g-1
0
Jan
-11
Jun
-11
No
v-1
1
Ap
r-1
2
Sep
-12
Feb
-13
Jul-
13
Dec
-13
May
-14
Oct
-14
Mar
-15
Au
g-1
5
Jan
-16
Jun
-16
No
v-1
6
Ap
r-1
7
Sep
-17
Feb
-18
Jul-
18
Dec
-18
May
-19
Oct
-19
Mar
-20
Au
g-2
0
Axis Bank Ltd. HDFC Bank ICICI Bank

1919Private & Confidential.
LIVE PORTFOLIO PERFORMANCE (AS ON 31ST MARCH, 2021)
All returns are absolute returns, net of fees and expenses and calculated by using TWRR method
Under the TWRR method of calculating portfolio performance the initial performance looks optically lower in an upward trending market because of large inflows on a relatively small AUM. As on 31st March, the first customer of the Kings of Capital PMS had generated returns of 31.4% vs 50.7% for the Bank Nifty since inception.
At Marcellus we don’t believe in timing the market and hence deploy the money into our strategies as soon asthe investor transfers the funds to us. However, we do recognise the emotional aspect of loss aversion in theshort term and have launched STP (Systematic Transfer Plan) plan using which clients can stagger theirinvestment in tranches spread over 5 months. For more details please refer to our FAQshttps://marcellus.in/wp-content/uploads/2020/11/STP-FAQs.pdf
Past Performance is not indicative of future performance of the Strategy. The data presented above is not verified by SEBI
-0.3% 0.3%
-4.9%
6.8%
21.2%
3.3%-6.1%
7.6%
-1.4%
26.8%
-2.1%
9.8%
-9.7%
11.4%
23.9%
5.6%
-2.2%
13.9%
-4.3%
50.7%
-2.0%3.0%
-1.2%
3.7%
11.4%
7.8%
-2.5%
6.7%1.2%
30.9%
-20%
-10%
0%
10%
20%
30%
40%
50%
60%
Jul-20 Aug-20 Sep-20 Oct-20 Nov-20 Dec-20 Jan-21 Feb-21 Mar-21 Sinceinception(28th Jul,
2020)Kings of Capital PMS Bank Nifty Nifty
2020
Marcellus offers the Kings of Capital Portfolio in a PMS construct with zero entry/ exit load andwith no lock-in.
Clients who are onboarded through intermediaries/distributors can choose from one of the followingtwo fee structures:
• Option 1 (fixed fee model): 2.5% p.a. fixed fees and zero performance fees
• Option 2 (hybrid model): 1.5% p.a. fixed fees and performance fees of 15% profit share over ahurdle of 10% without catchup
Clients also have the option to be onboarded directly (without intermediaries/ distributors). Suchclients can choose from the following fee structures:
• Option 1 (fixed fee model): 2.0% p.a. fixed fees and zero performance fees
• Option 2 (hybrid model): 1.25% p.a. fixed fees and performance fees of 15% profit share over ahurdle of 10% without catchup
High watermark applies for performance fees
Minimum investment: INR 50 lakhs
Private & Confidential.
FUND STRUCTURE

2121
KCP FACTSHEET (1/2)
Fund Details
Strategy Name Kings Of Capital
Fund Manager Tej Shah
AUM In INR Crs 373
Category Multi-Cap
BenchmarkBank Nifty 50 Total Return
Index
Top 4 Holdings (accounts for ~50% of allocation)
HDFC Bank Lenders
Bajaj Finance Lenders
Kotak Mahindra Lenders
HDFC Life Non-Lenders
Market-Cap Wise Allocation
Large-Cap 83.5%
Mid-Cap 12%
Small-Cap 3.5%
Cash 1%
67%
33%
1%
Lenders
Non-Lenders
Cash
Sector Wise Allocation
Portfolio Metrics
Wtd Avg Market Cap (INR Cr.) 263,108
Portfolio P/E (FY20) 64.8x
Churn Ratio (YTD FY21) 3.5%
Std Dev (Back Test Apr18-Mar21) 28%
Sharpe Ratio (Back Test Apr18-
Mar21)0.48

2222
KCP FACTSHEET (2/2)
* Based on NAV's rebased to 100
0
20
40
60
80
100
120
140
160
180
29-Jul-2020 29-Aug-2020 29-Sep-2020 29-Oct-2020 29-Nov-2020 29-Dec-2020 29-Jan-2021 28-Feb-2021 31-Mar-2021
NAV Comparison
KCP PMS NIFTY BANK TRI

2323
Saurabh Mukherjea, CFA - Chief Investment Officer
Pramod Gubbi, CFA – Head of Sales
Rakshit Ranjan, CFA – Fund Manager
Saurabh is the former CEO of Ambit Capital and played a key role in Ambit’s rise as a broker and a wealthmanager. When Saurabh left Ambit in June 2018, assets under advisory were $800mn. In London, Saurabh wasthe co-founder of Clear Capital, a small cap equity research firm which he and his co-founders created in 2003and sold in 2008. In 2017, upon SEBI’s invitation, he joined SEBI’s Asset Management Advisory Committee. In2019, Saurabh was part of the five man Expert Committee created by SEBI to upgrade & update the PMSregulations. Saurabh has written three bestselling books: Gurus of Chaos (2014), The Unusual Billionaires(2016) and “Coffee Can Investing: The low risk route to stupendous wealth” (2018). Saurabh was educated atthe London School of Economics where he earned a BSc in Economics (with First Class Honours) and MSc inEconomics (with distinction in Macro & Microeconomics).
Pramod is Head of Sales in Marcellus and manages the sales & marketing efforts of the firm. He also sits onInvestment Committee that discusses and approves investment strategies of the firm. Pramod was previouslythe MD & Head of Institutional Equities at Ambit Capital. Prior to that Pramod, served as the head of Ambit’sSingapore office. Before joining Ambit, Pramod worked across sales and research functions at Clear Capital.Besides being a technology analyst, Pramod has served in technology firms such as HCL Technologies andPhilips Semiconductors. Pramod did his B.Tech from Regional Engineering College, Surathkal and has a Post-graduate Diploma in Management from the Indian Institute of Management – Ahmedabad.
Rakshit is a Portfolio Manager at Marcellus Investment Managers. He spent 6 years (2005-2011) covering UKequities with Lloyds Bank (Director, Institutional Equity Research) and Execution Noble (Sector Lead analyst).During these six years, he was ranked amongst the top-3 UK Insurance analysts (Thomson Reuters Extelsurvey) in the mid-cap space. Since 2011, Rakshit led Ambit Capital’s consumer research franchise which gotvoted as No.1 for Discretionary Consumer and within top-3 for Consumer Staples in 2015 and 2016. Helaunched Ambit’s Coffee Can PMS in Mar’17 and managed it till Dec’18. Under his management, Ambit’sCoffee Can PMS was one of India’s top performing equity products during 2018. Rakshit has a B.Tech fromIIT (Delhi).
Private & Confidential.
TEAM MARCELLUS (1/3)

2424
Ashvin Shetty, CFA – Fund Manager
Ashvin is a Portfolio Manager at Marcellus Investment Managers. Ashvin has more than 10 years of experiencein equity research. He led the coverage on automobile sector at Ambit Capital from 2010 to 2017. He wasranked in Starmine Analyst Awards 2013 and 2016 for his stock picking abilities during this stint. He thereafterworked as a senior analyst for Ambit’s Mid and Small cap PMS funds till November 2018. Prior to joiningAmbit, he worked with Execution Noble as an analyst covering consumer and media space. He has also workedwith KPMG’s and Deloitte’s statutory audit departments from 2004 to 2007 gaining extensive experienceacross Indian accounting standards and financial statement analysis. Ashvin is a BCom graduate from NarseeMonjee College (Mumbai). He is a qualified Chartered Accountant (ICAI India) and Chartered Financial Analyst(CFA Institute, USA).
Tej Shah, CFA – Fund Manager
Tej is a Portfolio Manager at Marcellus. Prior to joining Marcellus, Tej worked at Mayfield, a Silicon Valleyheadquartered venture capital fund which manages $3Bn globally and $220Mn in India. Tej spent 2 years as apart of Mayfield India’s investment team covering multiple sectors and being at the centre of India’s evolvingventure ecosystem. Prior to Mayfield, Tej was a part of the equity and capital markets team of Ambit Capitalwhere he was involved in the end to end execution of IPOs, QIPs and buybacks. Tej is a Chartered Accountantand has cleared all levels of the CFA exam. He holds a B. Com degree from Ahmedabad University.
Private & Confidential.
TEAM MARCELLUS (2/3)
Salil Desai – Portfolio CounsellorSalil joins Marcellus from Premji Invest, India’s largest family office by assets under management, where hespent 6 years as a senior member of the team that managed ~US$2bn in listed equities. Prior to that, Salilworked for IDFC Securities, a prominent equity brokerage in Mumbai, where he came to be known as one ofIndia’s leading analysts for core economy sectors. Over a career spanning 12 years in equities, he has trackedmultiple sectors, including industrials, infrastructure, utilities, insurance, cement, metals and logistics. Salil is aChartered Accountant and a Post Graduate Diploma in Business Management from NMIMS, Mumbai. Hecompleted his graduation in Commerce from Mumbai University

2525
Sudhanshu Nahta – Portfolio Counsellor
Prior to joining Marcellus, Sudhanshu was Executive Assistant to the CEO at Ambit Capital and worked in theInstitutional Equities’ Strategy team. He has also worked with KPMG in the statutory audit team from 2013 to2016 gaining extensive experience across Indian accounting standards, financial control systems and financialstatement analysis & reviews.Sudhanshu is a qualified Chartered Accountant and a CFA Level 3 candidate. He has completed his graduationin Commerce from Mumbai University
Nitesh Bhadani – Director, Sales
In his 6 years stint in Ambit Private Ltd, Nitesh worked across Institutional Equities and Investment Bankingdivision of the firm. Prior to that Nitesh worked in the investment team of private equity firm SAIF Partners inGurgaon. Before joining SAIF, Nitesh worked as equity research analyst in CRISIL and used to track the IndianTelecom & Cement sector.Nitesh is a Chartered Accountant and MBA from the Indian School of Business – Hyderabad.
Private & Confidential.
TEAM MARCELLUS (2/3)
Manish Hemnani – COO & Head, Client RelationsManish comes from quantitative data analytics and research background, and has more than 12 years ofexperience working with banks and financial institutions across east-Asia, India and Europe.Prior to founding Marcellus, he founded Crosstab Limited (2011), a London based quantitative data analyticsoutfit. Prior to that he worked with a Mumbai based boutique analytics consulting firm. Manish holds an MBAfrom University of Warwick – Warwick Business School (UK).
2626Private & Confidential.
APPENDIX
2727Private & Confidential.
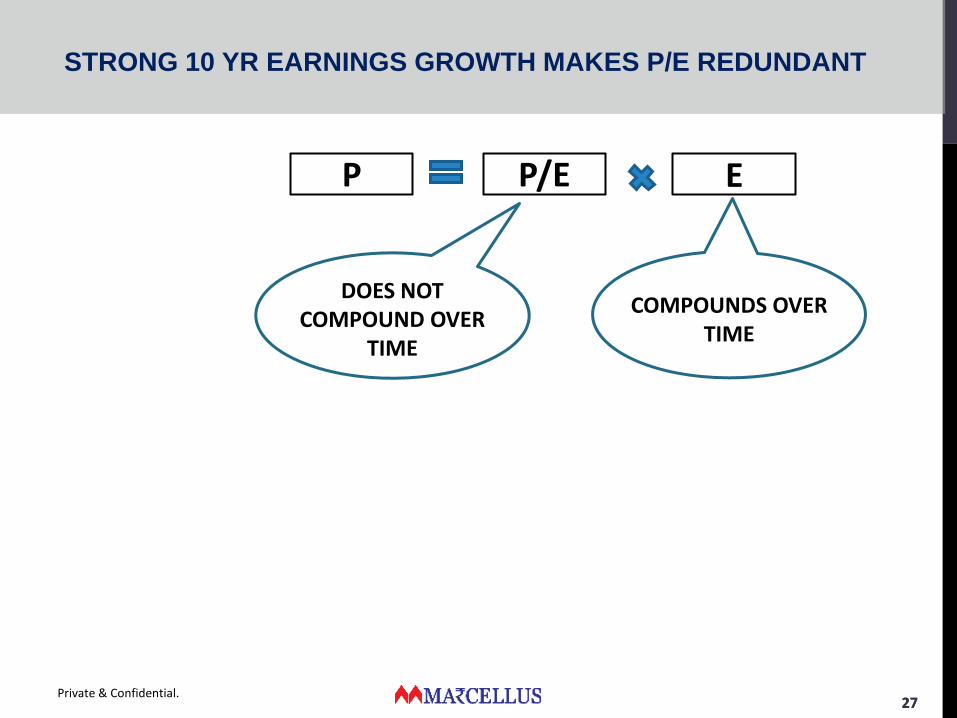
P/E EP
DOES NOT COMPOUND OVER
TIME
COMPOUNDS OVER TIME
STRONG 10 YR EARNINGS GROWTH MAKES P/E REDUNDANT

2828Private & Confidential.
P/E EP
+7% 0%+7%
-7% 0%-7%
+7% 12%+19%
-7% 12%+5%
+7% 25%+32%
-7% 25%+18%
P/E doubles
P/E doubles
P/E doubles
P/E halves
P/E halves
P/E halves
A for Airlines (e.g. Telcos)
B for Buffett (e.g. Maruti, HUL)
C for MARCELLUS’ CONSISTENT COMPOUNDERS (e.g. Asian Paints, HDFC Bank)
STRONG 10 YR EARNINGS GROWTH MAKES P/E REDUNDANT

2929
FINANCIALIZATION OF INDIAN HOUSEHOLD SAVINGS IS WELL
UNDERWAY
1,413
467 395235 189 137 124 116 87 78 50 48 30 29 25 1
-12 -26
36%
7%
17%
10% 9%
16%
3%
8% 7% 9%
15%
4% 2%
10%
2%
7%
0% -1% -1%
-10%
0%
10%
20%
30%
40%
-200
300
800
1,300
1,800
2,300
2,800
3,300
3,800
Savi
ngs
(%
of
GD
P)
Ho
use
ho
ld S
avin
gs (
$B
n)
Savings (USD Bn) Household Savings (% of GDP)
India has the 3rd largest household savings globally…
…which are rapidly moving from physical to financial assets…
31% 33% 37% 36%45%
37% 38%
69% 68% 63% 64%55%
63% 61%
0%
20%
40%
60%
80%
100%
FY2012 FY2013 FY2014 FY2015 FY2016 FY2017 FY2018
Financial Savings Non financial savings
Private & Confidential.
Source: RBI
• Though India has the 3rd largest household savings globally, this wealth has beenlocked up in gold and real estate since generations. This is unusual in the globalcontext and especially so for a young population
• The gains from reallocation of household wealth to financial assets over the nextdecade will accrue to:
1. Lenders – Banks which will be able to gain deposits and then act as efficientdistributors of credit will benefit. From the perspective of Indian households, asimple shift to organised lenders will increase annual incomes by 2%-4%
2. Life insurers – Indian household finance landscape is distinctive through the neartotal absence of pension wealth. A large section of the Indian population has nottaken any active steps to financially secure their retirement. Life insurers which areable to offer customer centric products along with strong risk managementframeworks will benefit
3. General Insurers: With the increasing awareness of health insurance, generalinsurers which are able to underwrite well across cycles will benefit
4. Asset Managers/brokers: Indian households can benefit greatly by reallocatingassets from gold and real estate to financial markets. As per the RBI HouseholdFinance Survey, annual household incomes can move up between 1% to 5% just byreallocation of wealth held in the form of gold to financial assets
3030
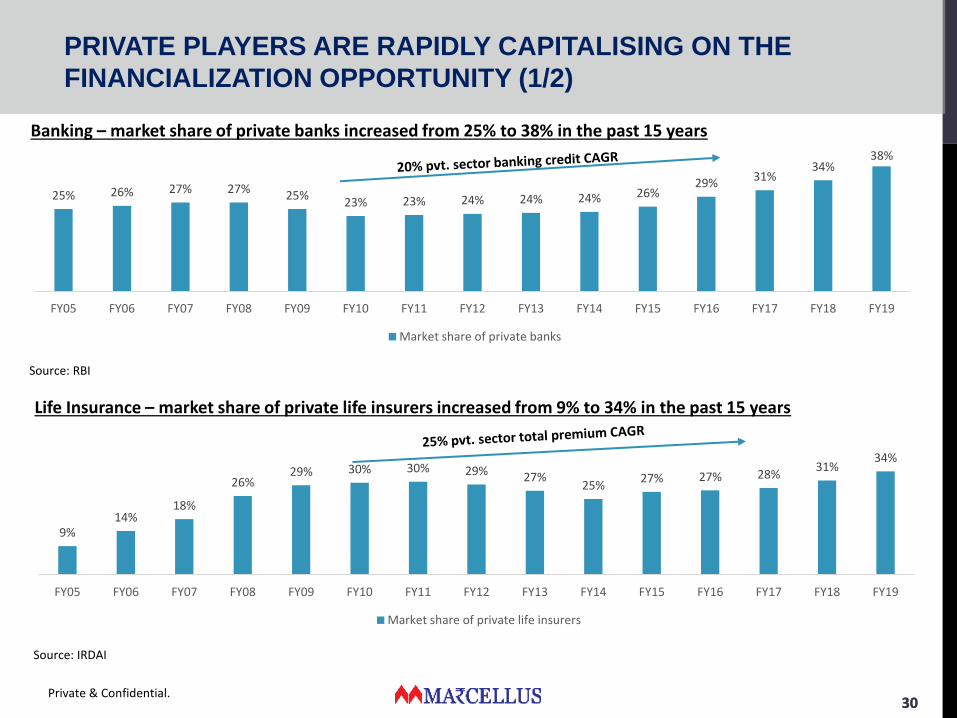
PRIVATE PLAYERS ARE RAPIDLY CAPITALISING ON THE
FINANCIALIZATION OPPORTUNITY (1/2)
Banking – market share of private banks increased from 25% to 38% in the past 15 years
Private & Confidential.
Source: IRDAI
25% 26% 27% 27% 25%23% 23% 24% 24% 24% 26%
29% 31%34%
38%
FY05 FY06 FY07 FY08 FY09 FY10 FY11 FY12 FY13 FY14 FY15 FY16 FY17 FY18 FY19
Market share of private banks
Source: RBI
Life Insurance – market share of private life insurers increased from 9% to 34% in the past 15 years
9%14%
18%
26%29% 30% 30% 29% 27%
25%27% 27% 28%
31%34%
FY05 FY06 FY07 FY08 FY09 FY10 FY11 FY12 FY13 FY14 FY15 FY16 FY17 FY18 FY19
Market share of private life insurers

3131
86%88%
85%84%
89%90% 91% 91% 91% 91% 91% 92% 93%
75%
80%
85%
90%
95%
FY07 FY08 FY09 FY10 FY11 FY12 FY13 FY14 FY15 FY16 FY17 FY18 FY19
Market share of private asset managers
PRIVATE PLAYERS ARE RAPIDLY CAPITALISING ON THE
FINANCIALIZATION OPPORTUNITY (2/2)
General Insurance – market share of private general insurers increased from 20% to 55% in the past 15 years
Private & Confidential.
20%27%
35%40% 41% 41% 41% 42% 43%
50% 50%46% 47% 49%
55%
FY05 FY06 FY07 FY08 FY09 FY10 FY11 FY12 FY13 FY14 FY15 FY16 FY17 FY18 FY19
Market share of private general insurers
Source: AMFI
Asset Management – market share of private asset managers increased from 86% to 93% in the past 12 years
Source: IRDAI

3232Private & Confidential.
50%50%
2009
55%45%
2014
63%
37%
2019
63% of the private life insurance sector premiums are earned by 4 private life insurers
79% of the banking sector’s profits are earned by 4 private sector banks
15%
85%
2009
32%
68%
2014
79%
21%
2019
Market share (based on PAT) of 4 largest pvt. banks Market share of all other players
Market share of 4 largest pvt. life insurers Market share of all other private players
HOWEVER NOT ALL PRIVATE PLAYERS ARE BENEFITTING, PROFITS
ARE GETTING CONSOLIDATED IN THE HANDS OF A FEW PLAYERS
Source: IRDAI, Company financials
Source: RBI, Company financials

3333Private & Confidential.
28%
72%
2009
31%
69%
2014
39%
61%
2019
39% of the industry’s AUM is now managed by 3 AMCs
2/3rd of the profits of the general insurance industry are earned by the 3 private general insurers
22%
78%
2009
24%
76%
2014
67%
33%
2019
HOWEVER NOT ALL PRIVATE PLAYERS ARE BENEFITTING, PROFITS
ARE GETTING CONSOLIDATED IN THE HANDS OF A FEW PLAYERS
Market share (based on PAT) of 3 largest pvt. general insurers Market share of all other players
Market share of the 3 largest pvt. AMCs Market share of all other players
Source: IRDAI, Company financials
Source: AMFI
3434
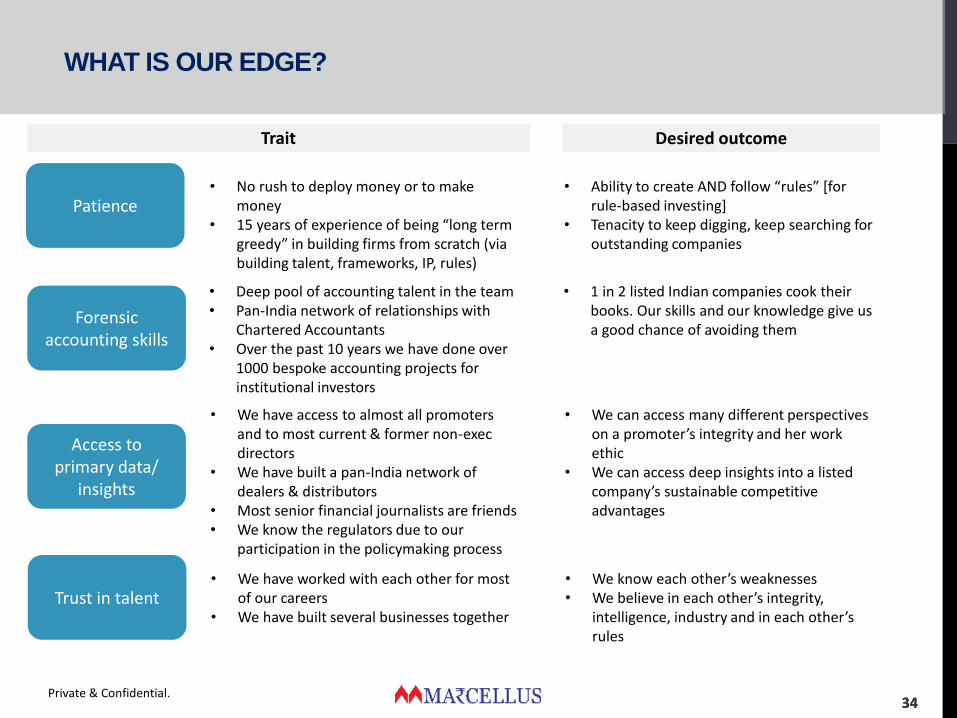
Patience
Forensic accounting skills
Access to primary data/
insights
Trait
• No rush to deploy money or to make money
• 15 years of experience of being “long term greedy” in building firms from scratch (via building talent, frameworks, IP, rules)
Desired outcome
• Ability to create AND follow “rules” [for rule-based investing]
• Tenacity to keep digging, keep searching for outstanding companies
• Deep pool of accounting talent in the team• Pan-India network of relationships with
Chartered Accountants• Over the past 10 years we have done over
1000 bespoke accounting projects for institutional investors
• 1 in 2 listed Indian companies cook their books. Our skills and our knowledge give us a good chance of avoiding them
• We have access to almost all promoters and to most current & former non-exec directors
• We have built a pan-India network of dealers & distributors
• Most senior financial journalists are friends• We know the regulators due to our
participation in the policymaking process
• We can access many different perspectives on a promoter’s integrity and her work ethic
• We can access deep insights into a listed company’s sustainable competitive advantages
Trust in talent• We have worked with each other for most
of our careers• We have built several businesses together
• We know each other’s weaknesses• We believe in each other’s integrity,
intelligence, industry and in each other’s rules
Private & Confidential.
WHAT IS OUR EDGE?

3535
DISCLAIMER
"This document has been made available solely for informational purposes
and is for private circulation only. Neither the transmission of this
document nor the transmission of any information contained herein is
intended to create, and receipt hereof, does not constitute formation of any
relationship between Marcellus Investment Managers Private Limited
(“Marcellus”) and the recipient and shall not entitled the recipient to
circulate, share or rely upon the information contained herein for any other
purpose other than the limited intended purpose only. Marcellus disclaims
any and all liability arising from actions taken or omitted to be taken based
on the contents herein."
Private & Confidential.