Embed Size (px)
Citation preview

An Investor Brief on Impacts that Drive Business Risks:
WHEAT
engagethechain.org
WHEAT
Page 2
• Wheat is a staple of diets around the world. Productiontripled since the 1960s, propelled by global populationgrowth and rising incomes.
• Improvements in yield made it possible for production tokeep pace with rising demand without a significantexpansion in the amount of land used to grow the crop.
• Increased use of irrigation water, pesticides and fertilizerdrove the yield growth in large part, contributing to waterscarcity and water pollution issues.
• Investors should address business risk in the wheat supplychain through direct engagement with their portfoliocompanies and by supporting relevant policies and multi-stakeholder collaborations.
This brief provides a summary of the main environmental and social factorsthat affect wheat production worldwide; however, it spotlights key players in the
U.S. value chain, and provides examples of actions being taken by companiesoperating or headquartered in the U.S.
KEY TAKEAWAYS
COMMODITY OVERVIEW
Wheat is a Significant Staple of Diets Around the World, and is Also Used for Animal Feed and Biofuel
Wheat is the mostly widely grown cereal crop, farmed on more acres than any another commercial crop (nearly 20 percent of all land under cultivation).1
• Wheat makes up 20 percent of the caloriespeople consume worldwide.2
• Slightly more than half of the 2 million bushels of wheat grown in the U.S. is used domestically,with the large majority used for food.3
• About three-quarters of all U.S. grain products,such as bread, pasta, and cookies, are made fromwheat flour.4
• Outside of the U.S., wheat is also regularly used for animal feed. In the European Union, almosthalf of wheat production is used to feed animals.5
• Wheat is the primary feedstock for bioethanolproduction in the EU.6
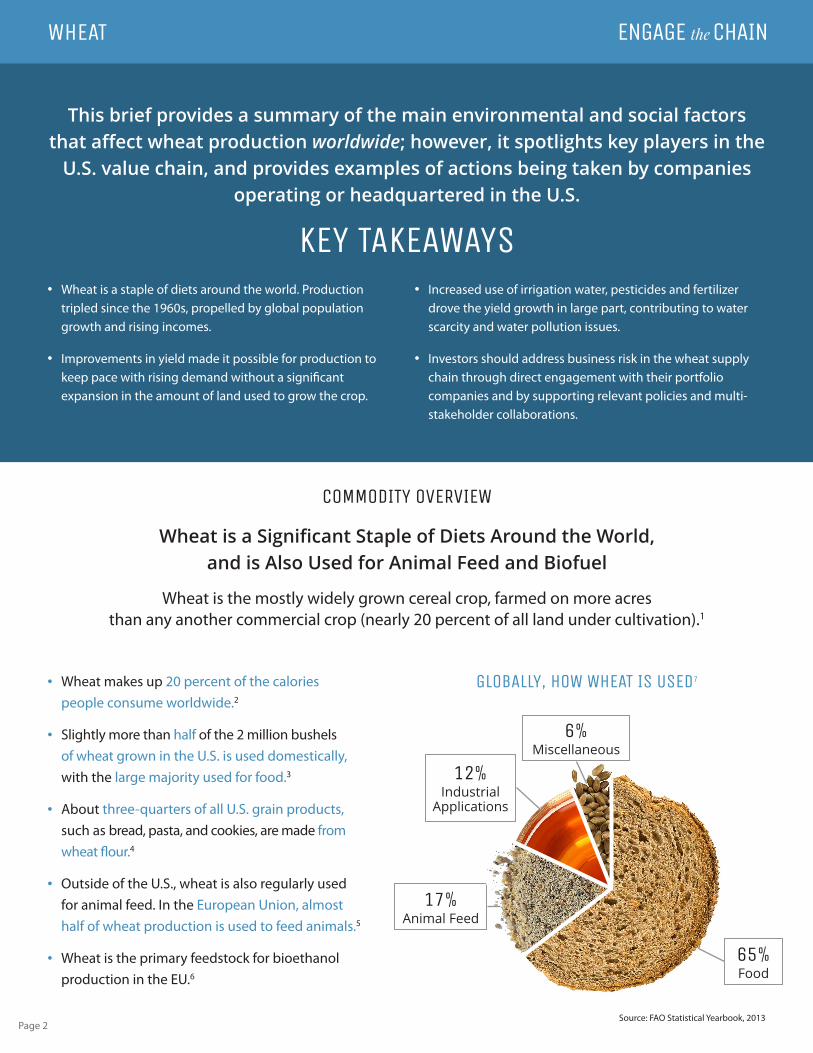
GLOBALLY, HOW WHEAT IS USED7
Source: FAO Statistical Yearbook, 2013
65%Food
17%Animal Feed
12%Industrial Applications
6%Miscellaneous

WHEAT
Page 3
GLOBAL PRODUCTION DATA
Wheat is Produced Around the World, with the Top Five Producing NationsAccounting for About 50 Percent of Total Global Production
696 MILLION METRIC TONSAverage global wheat production, 2011-20139
$174 BILLIONGlobal production value10
23 PERCENTProportion of global production exported11
TOP FIVE PRODUCTION REGIONS8
49%Other
17%China
13%India
7%U.S.
7%Russia7%
France
Rising Incomes and Growing Consumption of Processed Foods are Driving Demand
Global wheat production tripled during the past fiftyyears,12 as the world’s population doubled and risingurbanization and income levels led to a shift to morewheat rich diets. However, the amount of land farmed for wheat didn’t increase, due to improvements in wheatyield per hectare.13 Still, the fertilizer, pesticide andirrigation use that helped propel these yield increases has created water scarcity and pollution issues.
While growth in wheat consumption in developed countrieshas slowed,14 demand for wheat flour (e.g., for wheat-based instant noodles and bakery products) is projectedto increase in developing countries because of risingincomes and population.15,16 Although most wheat isconsumed within the country where it is produced,globally roughly one-fifth of the annual crop is exported.17

WHEAT
Page 4
THE WHEAT VALUE CHAIN
Some Segments in the U.S. Wheat Value Chain are Highly Concentrated
FOODMANUFACTURING ANIMAL FEED/BIOFUELS
WHEAT FLOUR
FOOD RETAILERS & OTHER OUTLETS
MILLING FACILITIES
ELEVATORS & STORAGE
WHEAT FARMS
STAGE OF VALUE CHAIN
AGRICULTURALPRODUCTION
PROCESSING,TRANSPORT, TRADE& DISTRIBUTION
MANUFACTURING
RETAIL &CONSUMPTION
SIMPLIFIED WHEATVALUE CHAIN
SOME KEY COMPANIES IN U.S. FOOD VALUE CHAIN
Seed CompaniesDuPontMonsantoSyngenta
Traders/Distributors/MillersADMArdent MillsBungeCargillLouis Dreyfus
Packaged foodmanufacturers (bakery, breakfastcereal, snack, pasta sectors)Barilla North AmericaBimbo BakeriesFlowers FoodsGeneral MillsKellogg CompanyMondelez InternationalPepsiCoPost Foods
RestaurantsMcDonald’sStarbucksSubwayYum! Brands (Taco Bell,Pizza Hut, KFC)
RetailersAlbertsonsCostcoKroger Walmart
WHEAT
Page 5
SEED COMPANIESMonsanto, DuPont (Pioneer), and Syngenta (headquarteredin Europe) are large publicly traded companies that provideseeds to farmers.
TRADERS AND DISTRIBUTORSArcher Daniels Midland (ADM), Bunge, Cargill (privatelyheld) and Louis Dreyfus Commodities (headquartered in Europe) control much of this link in the supply chain.18
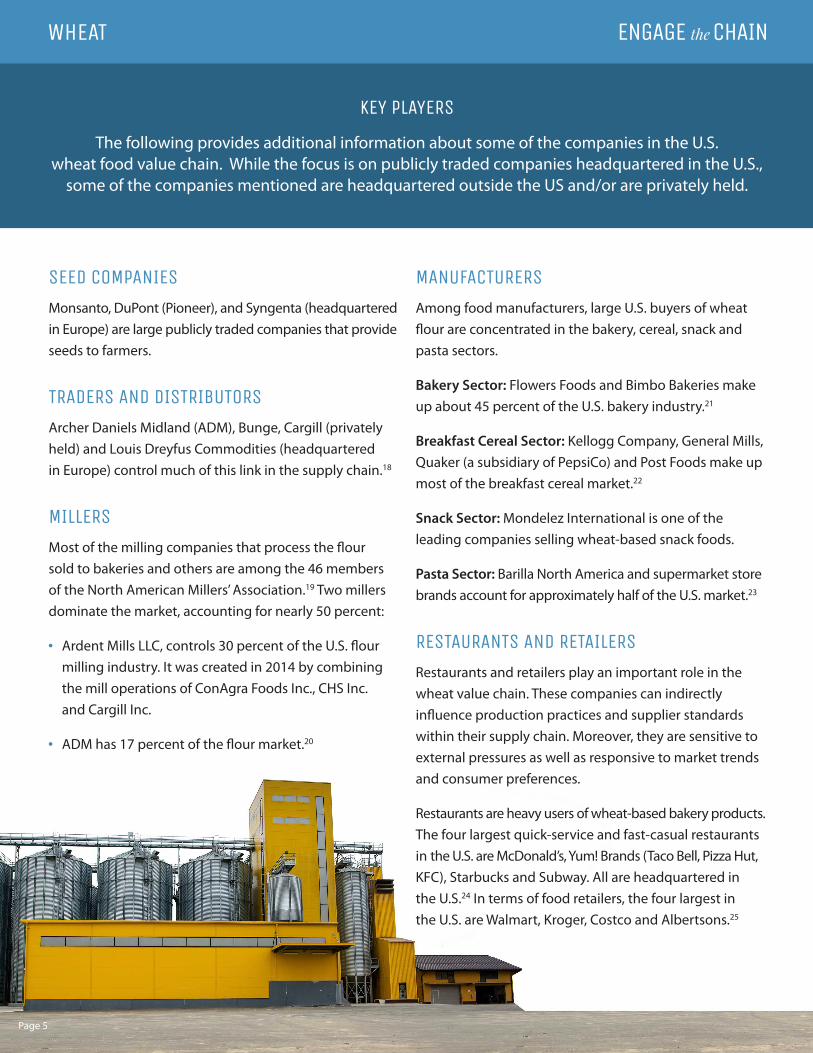
MILLERSMost of the milling companies that process the flour sold to bakeries and others are among the 46 members of the North American Millers’ Association.19 Two millersdominate the market, accounting for nearly 50 percent:
• Ardent Mills LLC, controls 30 percent of the U.S. flourmilling industry. It was created in 2014 by combiningthe mill operations of ConAgra Foods Inc., CHS Inc. and Cargill Inc.
• ADM has 17 percent of the flour market.20
MANUFACTURERSAmong food manufacturers, large U.S. buyers of wheatflour are concentrated in the bakery, cereal, snack andpasta sectors.
Bakery Sector: Flowers Foods and Bimbo Bakeries makeup about 45 percent of the U.S. bakery industry.21
Breakfast Cereal Sector: Kellogg Company, General Mills,Quaker (a subsidiary of PepsiCo) and Post Foods make upmost of the breakfast cereal market.22
Snack Sector: Mondelez International is one of theleading companies selling wheat-based snack foods.
Pasta Sector: Barilla North America and supermarket storebrands account for approximately half of the U.S. market.23
RESTAURANTS AND RETAILERSRestaurants and retailers play an important role in thewheat value chain. These companies can indirectlyinfluence production practices and supplier standardswithin their supply chain. Moreover, they are sensitive toexternal pressures as well as responsive to market trendsand consumer preferences.
Restaurants are heavy users of wheat-based bakery products.The four largest quick-service and fast-casual restaurantsin the U.S. are McDonald’s, Yum! Brands (Taco Bell, Pizza Hut,KFC), Starbucks and Subway. All are headquartered in the U.S.24 In terms of food retailers, the four largest in the U.S. are Walmart, Kroger, Costco and Albertsons.25
KEY PLAYERS
The following provides additional information about some of the companies in the U.S. wheat food value chain. While the focus is on publicly traded companies headquartered in the U.S.,
some of the companies mentioned are headquartered outside the US and/or are privately held.
WHEAT
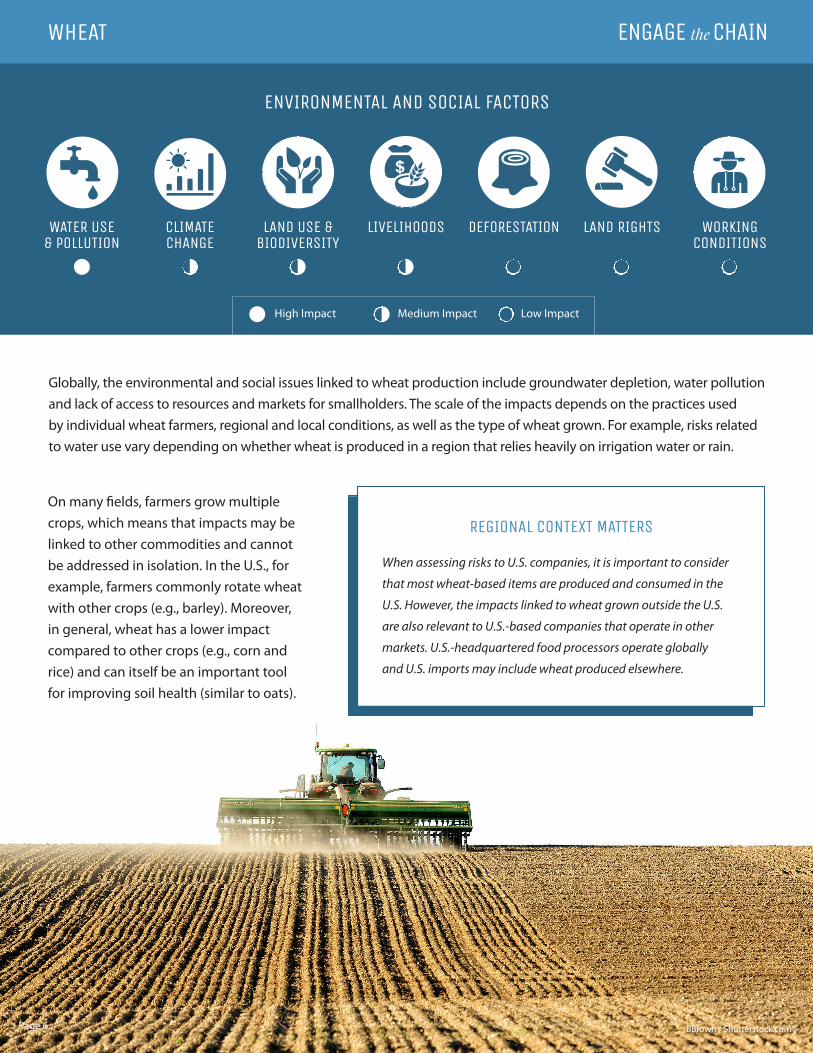
ENVIRONMENTAL AND SOCIAL FACTORS
WATER USE& POLLUTION
CLIMATECHANGE
LAND USE &BIODIVERSITY
LIVELIHOODS DEFORESTATION LAND RIGHTS WORKINGCONDITIONS
High Impact Medium Impact Low Impact
REGIONAL CONTEXT MATTERS
When assessing risks to U.S. companies, it is important to consider
that most wheat-based items are produced and consumed in the
U.S. However, the impacts linked to wheat grown outside the U.S.
are also relevant to U.S.-based companies that operate in other
markets. U.S.-headquartered food processors operate globally
and U.S. imports may include wheat produced elsewhere.
Page 6
Globally, the environmental and social issues linked to wheat production include groundwater depletion, water pollution and lack of access to resources and markets for smallholders. The scale of the impacts depends on the practices used by individual wheat farmers, regional and local conditions, as well as the type of wheat grown. For example, risks related to water use vary depending on whether wheat is produced in a region that relies heavily on irrigation water or rain.
On many fields, farmers grow multiplecrops, which means that impacts may belinked to other commodities and cannotbe addressed in isolation. In the U.S., forexample, farmers commonly rotate wheatwith other crops (e.g., barley). Moreover,in general, wheat has a lower impactcompared to other crops (e.g., corn andrice) and can itself be an important toolfor improving soil health (similar to oats).
BBrown / Shutterstock.com

WHEAT
Page 7
1. WATER USE CONTRIBUTES TO GROUNDWATER DEPLETION
While less water is required to produce a kilogram ofwheat than to produce the same quantity of many othercommodities (e.g., beef, soy), the total demand for waterto grow wheat is high given the significant amount ofland used.26
Globally, more than 40 percent of wheat production isgrown in regions of high or extremely high water stress(e.g., China and India), meaning regions where existingwater supplies face intense competition, and in some casesgrowing regulation.27 Where wheat production relies onirrigation, unsustainable water use can strain groundwatersupplies in areas such as the Ogallala Aquifer in the UnitedStates and the North China Plain in China.28
It Takes
1,619 LITERS OF WATER
To Produce
1 KG WHEAT(Weighted Global Average)29,30
43 PERCENTPercentage of Production in Regions
of Water Stress31
5 PERCENTPercentage of Global Production Irrigated32
2. FARM MANAGEMENT PRACTICES CAN POLLUTE WATER
While adding wheat to a crop rotation builds soil health,because wheat production covers vast farm acreage, the total amount of agrochemicals and fertilizers used issignificant and contributes to impacts. In the U.S., nitratefertilizer is applied to the large majority of acres on whichwheat is grown (over 80 percent in 2009).33 Chemicalsand fertilizer may wash off fields and the run-off cancontribute to “deadzones”34 that are devoid of life, whileleaching to groundwater pollutes the water supply ofcommunities, agriculture and industry. Moreover, highlevels of pesticide applications can harm water qualityand local biodiversity.
3. WHEAT PRODUCTION MAY CONTRIBUTE TO GREENHOUSE GAS EMISSIONS
The use of fuel, inorganic fertilizers and pesticides in wheat production contributes to greenhouse gases that arelinked to climate change. However, using farming practices such as fertilizing crops based on soil tests, reducingsummer fallow frequencies, and rotating cereals with grain legumes in certain regions (semi-arid and rainfed) canlower wheat’s carbon footprint. If these practices are used, it is possible for wheat to sequester more carbon dioxidefrom the atmosphere than is actually emitted during its production.35

WHEAT
Page 8
4. CONVERSION OF NATURAL HABITAT CAN LEAD TO GREENHOUSE GAS EMISSIONS & LOSS OF BIODIVERSITY
Globally wheat production is not a leading driver of natural habitat being converted to cropland. In recent years in the U.S., however, millions of acres of important grasslands in the Great Plains have been converted to wheatproduction, contributing to reductions in biodiversity (e.g., bird populations) and the loss of soil carbon.36
5. SMALLHOLDERS37 LACK OF ACCESS TO RESOURCES & MARKETS LIMITS THEIR PRODUCTIVITY & LIVELIHOODS
In many parts of the world, wheat is grown by smallholders. Average smallholder productivity is typically less thanthat of larger plantations. What’s more, smallholders often face significant challenges accessing markets, and mayrequire additional technical and financial resources to support productivity improvements, shifts in cultivationpractices, and/or record keeping. Increasing the productivity on smallholder farms could in particular help improvesmallholders’ economic and food security.
U.S. SPOTLIGHT
Wheat used in the U.S. is typically produced domestically. Wheat is stored and transported through elevators and
multiple aggregation points (such as rail deliveries to flour mills). This is different from other grains (like corn and
rice) and can make collecting data on wheat growing systems difficult.
Most U.S. wheat is grown in the Great Plains (Kansas is the largest wheat producer in the U. S., followed closely by
North Dakota).38 Nutrient pollution and groundwater depletion are significant concerns in this region, particularly
where wheat is irrigated with groundwater from the Ogallala Aquifer.
In the U.S. between 1980-2011, total wheat production dropped (16 percent) as farmers switched to alternative
crops offering higher returns or took their land out of production. However, yield per planted acre increased (25
percent). Over this timeframe, wheat production in the U.S. became more efficient across five indicators tracked on
a “per bushel” basis, and total resource use decreased as well.39 However, on a per acre basis, resource use increased
in four of those areas, linked to the greater yield per planted acre:40
• Irrigation water applied (+6 percent)
• Energy use (+9 percent)
• Greenhouse gas emissions (+21 percent).
Only soil erosion decreased by 34 percent, with improvements
realized primarily in the first half of the study period.

WHEAT
Page 9
Many players, including buyers, producers, governments,NGOs and communities understand the issues and arecollaborating to ensure the long-term sustainability ofwheat production. Investors should encourage companiesto join these multi-stakeholder efforts to demonstratecommitment and help accelerate progress. When acompany is already involved in such efforts, investorsshould encourage constructive participation and progressin meeting commitments.
Many of the risks affecting wheat production affect othercommodities as well. Multi-stakeholder efforts that addresswheat as well as other commodities include:
• Field to Market Fieldprint ProjectsField to Market: The Alliance for Sustainable Agricultureworks in the U.S. with grower groups, retailers and othersupply chain businesses, along with civil society, academiaand public sector partners to promote continuousimprovement in row-crop production practices usingan outcomes-based approach. Projects in the U.S. arecollecting data on several key science-based indicators,with supply chain members providing support forcontinuous improvement efforts by growers. Its SupplyChain Sustainability Program enables companies to benchmark sustainability performance, catalyzecontinuous improvement and measure and report out on progress against environmental goals.
• Midwest Row Crop CollaborativeAnnounced in 2016, this coalition of companies (Cargill,General Mills, Kellogg Company, Monsanto, PepsiCoand Walmart) and conservation groups (EnvironmentalDefense Fund, The Nature Conservancy and WorldWildlife Fund) is focused on supporting and acceleratingsustainable solutions that address various environmentalimpacts from farming. The coalition will focus on threestates: Illinois, Iowa and Nebraska, which produce nearly44 percent of corn, soy and wheat. This region also sends422 million kilogram/year of nitrogen downstream,which ultimately contributes to the annual Gulf ofMexico dead zone.41
• Saginaw Bay Watershed Regional Conservation PartnershipThis regional partnership in Michigan, which includes theU.S. Department of Agriculture, The Nature Conservancyand the Michigan Agri-Business Association, focuses onimproving farmers’ conservation practices to improve soil and water quality and stem nutrient runoff into theGreat Lakes. Kellogg Company is one of the companiessupporting this effort because the soft white winterwheat (and sugar beets) for its cereal and other productsare grown in this watershed.42
OPPORTUNITIES FOR ACTION
Investors can encourage companies to take the following actions to reduce business risks.
1. JOIN MULTI-STAKEHOLDER SUSTAINABILITY EFFORTS
3. SUPPORT GOVERNMENT POLICIES
Companies can support sustainability policies in producer countries. In the U.S., for example, this includes promotingfunding of voluntary conservation programs to ensure technical and financial assistance is available to producers.
4. ENCOURAGE USE AND DEVELOPMENT OF SUSTAINABILITY STANDARDS
There are no third-party wheat-specific sustainability standards. However, organic standards45 can be applied to wheat production.
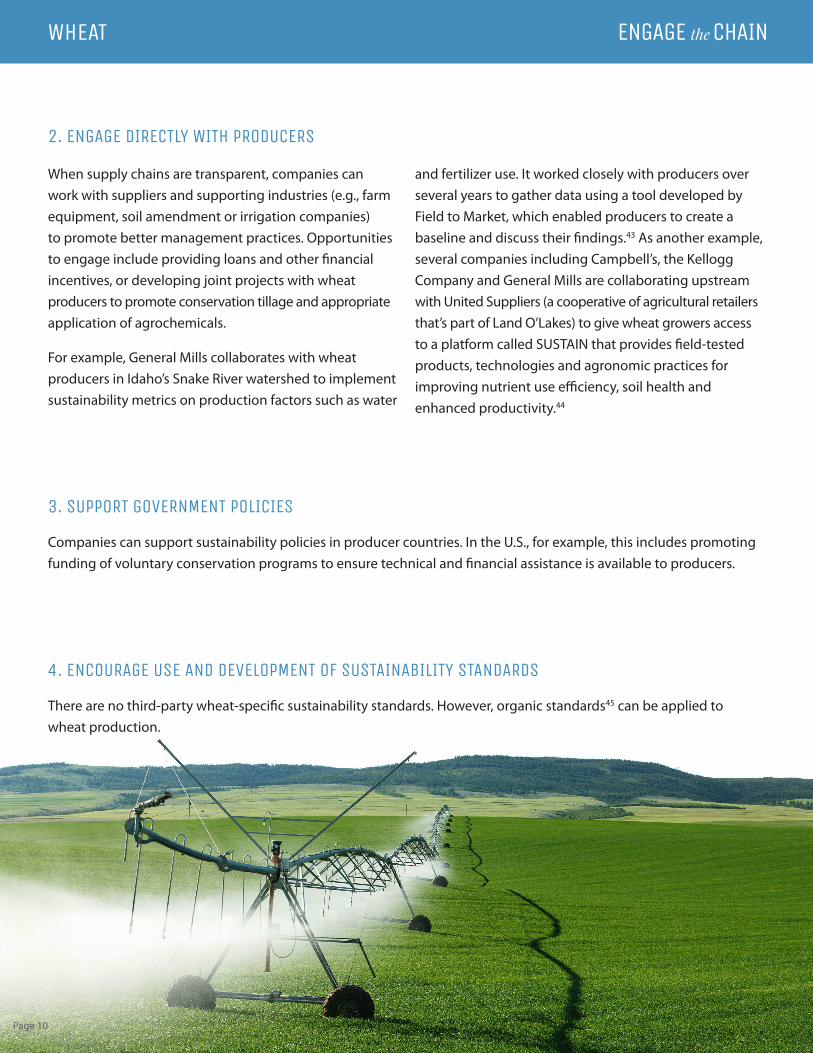
When supply chains are transparent, companies can work with suppliers and supporting industries (e.g., farmequipment, soil amendment or irrigation companies) to promote better management practices. Opportunitiesto engage include providing loans and other financialincentives, or developing joint projects with wheatproducers to promote conservation tillage and appropriateapplication of agrochemicals.
For example, General Mills collaborates with wheatproducers in Idaho’s Snake River watershed to implementsustainability metrics on production factors such as water
and fertilizer use. It worked closely with producers overseveral years to gather data using a tool developed byField to Market, which enabled producers to create abaseline and discuss their findings.43 As another example,several companies including Campbell’s, the KelloggCompany and General Mills are collaborating upstreamwith United Suppliers (a cooperative of agricultural retailersthat’s part of Land O’Lakes) to give wheat growers accessto a platform called SUSTAIN that provides field-testedproducts, technologies and agronomic practices forimproving nutrient use efficiency, soil health andenhanced productivity.44
WHEAT
Page 10
2. ENGAGE DIRECTLY WITH PRODUCERS
WHEAT
Page 11
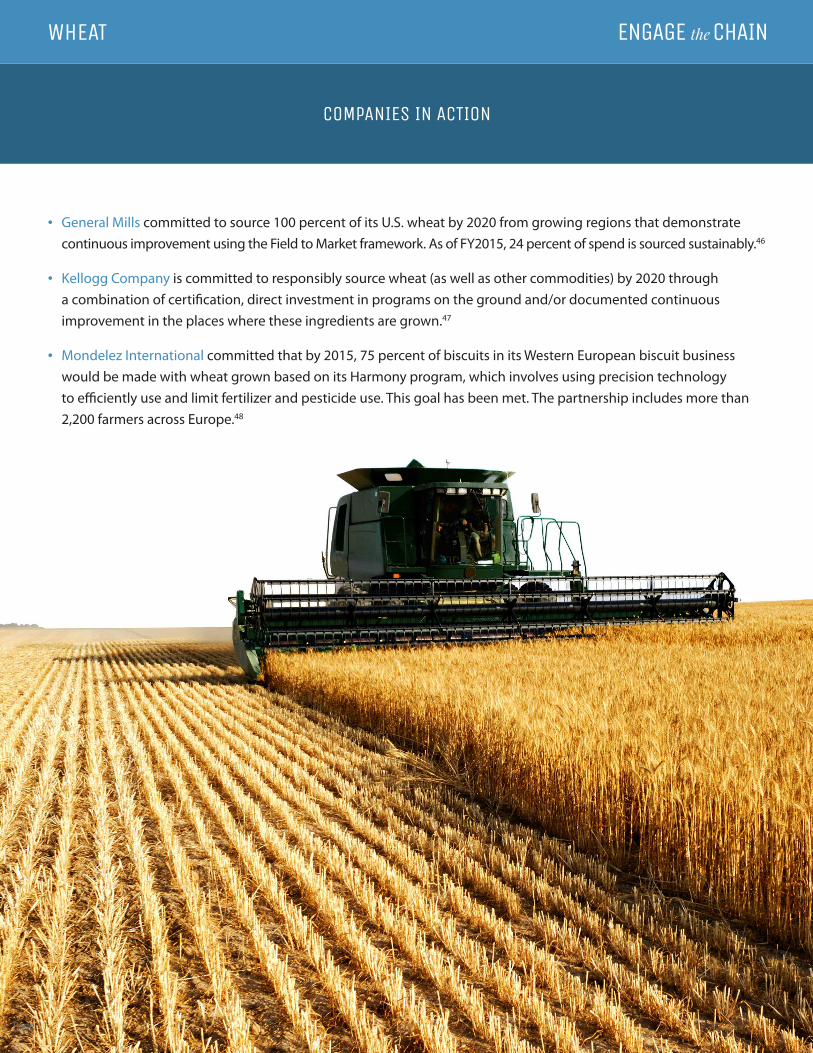
• General Mills committed to source 100 percent of its U.S. wheat by 2020 from growing regions that demonstratecontinuous improvement using the Field to Market framework. As of FY2015, 24 percent of spend is sourced sustainably.46
• Kellogg Company is committed to responsibly source wheat (as well as other commodities) by 2020 through a combination of certification, direct investment in programs on the ground and/or documented continuousimprovement in the places where these ingredients are grown.47
• Mondelez International committed that by 2015, 75 percent of biscuits in its Western European biscuit businesswould be made with wheat grown based on its Harmony program, which involves using precision technology to efficiently use and limit fertilizer and pesticide use. This goal has been met. The partnership includes more than2,200 farmers across Europe.48
COMPANIES IN ACTION

WHEAT
Page 12
• The U.S. Department of Agriculture (USDA) conducts research on multiple commodities, including wheat. Thisincludes data on production and consumption, prices and trade and is published through the Economic ResearchService, Foreign Agricultural Service, and National Agricultural Statistics Service.
• The Sustainability Consortium offers high-level insights and analysis about potential risks and opportunities forsome products made with wheat (e.g., bread).
• The International Maize and Wheat Improvement Center (CIMMYT) provides resources to strengthen nationalagricultural research and extension services in wheat (and corn/maize) growing nations. It partners with researchersand farmers to develop and promote more productive and precise wheat (and corn/maize) farming methods andtools that save money and resources such as soil, water and fertilizer.
• The Plowprint Report (2016) by World Wildlife Fund tracks year-to-year grassland conversion to cropland across thefocal regions of the Mississippi River Basin and Great Plains.
Engage the Chain offers briefs on seven other key commodities, a compelling case for sustainable agriculture and opportunities for action that cut across all types of agricultural commodities.
ADDITIONAL RESOURCES

WHEAT
Page 13
1 International Development Research Centre, Facts & Figures on Food and Biodiversity,http://www.idrc.ca/EN/Resources/Publications/Pages/ArticleDetails.aspx?PublicationID=565
2 National Association of Wheat Growers, “Wheat 101”, Wheat World, http://www.wheatworld.org/wp-content/uploads/Wheat-101.pdf
3 USDA Economic Research Service, U.S. Wheat Supply and Disappearance
4 USDA as noted by Grains of Truth, Wheat Foods Council
5 Feedpedia, Wheat Grain, http://www.feedipedia.org/node/223
6 Food and Agriculture Organization, “Agribusiness Handbook: Wheat Flour”, FAO, Rome,http://www.fao.org/docrep/012/al376e/al376e.pdf
7 Research—the Bayer Scientific Magazine, Accessed at: https://www.research.bayer.com/en/wheat-makers.aspx
8 FAO 2016, FAOSTAT database collections, Food and Agriculture Organization of the United Nations, Rome, Dataaverage of 2011-2013, http://faostat.fao.org
9 FAO 2016, FAOSTAT database collections, Food and Agriculture Organization of the United Nations, Rome, Dataaverage of 2011-2013, http://faostat.fao.org
10 FAO 2016, FAOSTAT database collections, Food and Agriculture Organization of the United Nations, Rome, Dataaverage of 2010-2012 URL: http://faostat.fao.org
11 FAO 2016, FAOSTAT database collections, Food and Agriculture Organization of the United Nations, Rome, Dataaverage of 2010-2012 URL: http://faostat.fao.org
12 1961-2011; from 222 million tonnes to 704 million tonnes
13 Encyclopedia of Earth, Wheat chapter, http://www.ncbi.nlm.nih.gov/pmc/articles/PMC4308074/
14 B.C. Curtis, Wheat in the World, FAO Corporate Document Repository,http://www.fao.org/docrep/006/y4011e/y4011e04.htm
15 USDA Economic Research Service, Wheat Baseline, 2015, https://www.ers.usda.gov/topics/crops/wheat/usda-wheat-baseline-2015-24/
16 USDA Economic Research Service, Wheat Baseline, 2015, https://www.ers.usda.gov/topics/crops/wheat/usda-wheat-baseline-2015-24/
17 B.C. Curtis, Wheat in the World, FAO Corporate Document Repository,http://www.fao.org/docrep/006/y4011e/y4011e04.htm
18 Soyatech, Soy Facts, http://www.soyatech.com/soy_facts.htm
19 North American Millers’ Association, Wheat Milling Process, http://www.namamillers.org/education/wheat-milling-process/
ENDNOTES

WHEAT
Page 14
20 Gregory Meyer and Neil Munshi, “Groups combine to create largest US miller”, The Financial Times, Mar 5th, 2013,https://www.ft.com/content/bdc3e7a6-85ae-11e2-bed4-00144feabdc0
21 Maria Ajit Thomas & Siddharth Cavale, “Acquisitive Flowers seeks bigger slice of U.S. bread market”, ChicagoTribune, Feb 21st, 2013, http://articles.chicagotribune.com/2013-02-21/news/sns-rt-us-flowersfoodsbre91l000-20130221_1_cobblestone-mill-bakeries-bread-industry
22 Jack Linshi, “These two charts show the biggest change in America’s breakfast”, Time, Feb 12th, 2015,http://time.com/3705987/skipping-breakfast-cereal-kellogg/
23 Statista, Sales of the leading 10 spaghetti, macaroni, and pasta brands of the United States in 2013 (in million U.S.dollars), http://www.statista.com/statistics/189677/top-spaghetti-and-macaroni-and-pasta-brands-in-the-united-states/ ; Paul Conley, “The top 10 U.S. pasta brands: Who owns the marketplace in 2013”, Fooddive, Oct 24th, 2013,http://www.fooddive.com/news/the-top-10-us-pasta-brands-who-owns-the-marketplace-in-2013/185340/
24 Note: Ranking is based on 2015 U.S. system-wide sales. Data from: QSR, “The QSR 50”, Aug 2016,https://www.qsrmagazine.com/reports/qsr50-2016-top-50-chart?sort=total_units_in_2015&dir=desc
25 Note: Ranking is based on sales of consumables, as reported in Supermarket News.http://supermarketnews.com/rankings-research/2015-top-75-big-picture
26 Encyclopedia of Earth, Wheat chapter, http://www.ncbi.nlm.nih.gov/pmc/articles/PMC4308074/
27 Ceres, “Feeding Ourselves Thirsty”, Page 25, May 2015
28 Encyclopedia of Earth, “Recharge and Groundwater Use in the North China Plain for Six Irrigated Crops for an ElevenYear Period”, Wheat chapter, http://www.ncbi.nlm.nih.gov/pmc/articles/PMC4308074/
29 Mekonnen, M. M., & Hoekstra, A. Y., “The Green, Blue and Grey Water Footprint of Crops and Derived Crop Products”Twente Water Center, University of Twente, Netherlands, May 25th, 2011, http://wfn.project-platforms.com/Reports/Mekonnen-Hoekstra-2011-WaterFootprintCrops.pdf (crops)
30 Note: Represents the combined “blue” and “green” footprints of wheat
31 World Resources Institute & Aqueduct, Agriculture Exposure to Water Stress,http://www.wri.org/applications/maps/agriculturemap/#x=-9.84&y=24.07&l=2&v=home&d=croplandNote: “Regions of Water Stress" are regions defined by WRI as having "high" or "extremely high" water stress
32 Stefan Siebert & Petra Doll, “Quantifying Blue and Green Virtual Water Contents in Global Crop Production as Wellas Potential Production Losses Without Irrigation,” Journal of Hydrology, 384 (2010) 198–217, Table 5
33 USDA Economic Research Service, ARMS Farm Financial and Crop Production Practices,http://www.ers.usda.gov/data-products/arms-farm-financial-and-crop-production-practices/tailored-reports-crop-production-practices.aspx
34 Note: “Dead zones” are created when a body of water becomes enriched by inorganic plant nutrients, especiallyphosphates and nitrates, and the resulting growth of algae reduces oxygen for aquatic plant and animal life.
35 Gan, Tantai, Et. Al., “Improving Farming Practices Reduces the Carbon Footprint of Spring Wheat Production”, Nov18th, 2014, http://www.nature.com/ncomms/2014/141118/ncomms6012/full/ncomms6012.html; Note: Improving farming practices reduces the carbon footprint of spring wheat production
36 Larkin et al, “Cropland expansion outpaces agricultural and biofuel policies in the United States”, 2015,http://iopscience.iop.org/article/10.1088/1748-9326/10/4/044003/meta
WHEAT
Page 15
37 Note: Most sources define smallholders as growers with a planted area of 50 hectares (just under 125 acres) or less, wherethe farm provides the majority of income to the family and, in turn, the family provides the majority of labor on the farm.
38 Grains of Truth, Wheat Foods Council
39 Note: Total land use (-33 percent), total soil erosion (-57 percent), irrigation water applied (-12 percent), energy use (-26 percent), and greenhouse gas emissions (- 17 percent). Note: For the indicators other than land use, wheat use/impactwere allocated between wheat and straw using an economic allocation method.
40 Field to Market, “Environmental and Socioeconomic Indicators for Measuring Outcomes of On-Farm AgriculturalProduction in the United States”, Summary Report: Second Report (Ver 2), Dec 2012, Available at:www.fieldtomarket.org
41 Keystone Policy Center, Midwest Row Crop Collaborative, https://www.keystone.org/our-work/agriculture/midwest-row-crop-collaborative/
42 Kellogg Company, “2014 Corporate Responsibility Report”, 2014,http://www.kelloggcompany.com/content/dam/kelloggcompanyus/corporate_responsibility/pdf/2015/Kelloggs_CRR_2014_FINAL.pdf
43 Josh Sosland,”Wheat Sustainability Initiative”, World-Grain, Oct 2nd, 2013, http://www.world-grain.com/news/news%20home/features/2013/10/wheat%20sustainability%20initiative.aspx?cck=1
44 Environmental Defense Fund, “Kellogg Company, United Suppliers”, https://www.edf.org/media/kellogg-company-united-suppliers-and-edf-partner-advance-sustainable-agriculture-nebraska
45 Notes: Organic standards are developed at the national and/or regional level through relevant organic standard setting bodies
46 General Mills, “Global Responsibility Report”, Page 38, 2015,http://www.generalmills.com/en/Responsibility/Overview
47 Kellogg Company, Corporate Responsibility Update, 2015-16,https://www.kelloggcompany.com/content/dam/kelloggcompanyus/corporate_responsibility/pdf/2016/Kelloggs_CRR_2015%20FINAL.pdf
48 Mondelez International “2015 Progress Report”, Page 20, 2015, http://www.mondelezinternational.com/well-being/our-progress/~/media/MondelezCorporate/uploads/downloads/cfwbprogressreport.pdf
ABOUT CERES | WWW.CERES.ORG
Ceres is a sustainability nonprofit organization working with the most influential investors and companies to build leadership and drive solutions throughout the economy. Through our powerful networks and advocacy, we tackle the world's biggest sustainability challenges, including climate change, water scarcity and pollution, and human rights abuses.
March 2017