Embed Size (px)
Citation preview
An IRAK1-PIN1 Signalling Axis Drives Intrinsic Tumour Resistance to Radiation Therapy
Peter H. Liu1,2, Richa B. Shah1,2, Yuanyuan Li1,2, Arshi Arora3, Peter Man-Un Ung4, Renuka Raman1,2, Andrej Gorbatenko5, Shingo Kozono6, Xiao Zhen Zhou6, Vincent Brechin1,2,†, John M. Barbaro1,2,‡, Ruth Thompson1,2,§, Richard M. White7, Julio A Aguirre-Ghiso1, John V. Heymach8, Kun Ping Lu6, Jose M. Silva5, Katherine S. Panageas3, Avner Schlessinger4, Robert G. Maki1,2,¶, Heath D. Skinner8, Elisa de Stanchina9, and Samuel Sidi1,2,*
1Department of Medicine, Division of Hematology and Medical Oncology, Tisch Cancer Institute, Icahn School of Medicine at Mount Sinai, New York, NY, USA.
2Department of Cell, Developmental and Regenerative Biology, The Graduate School of Biomedical Sciences, Icahn School of Medicine at Mount Sinai, New York, NY, USA.
3Department of Epidemiology and Biostatistics, Memorial Sloan Kettering Cancer Center, New York, NY, USA.
4Department of Pharmacological Sciences, Icahn School of Medicine at Mount Sinai, New York, NY, USA.
Users may view, print, copy, and download text and data-mine the content in such documents, for the purposes of academic research, subject always to the full Conditions of use:http://www.nature.com/authors/editorial_policies/license.html#terms*Correspondence to: [email protected] Contributions:P.H.L. performed the zebrafish drug screen with the assistance of J.M.B and V.B.; all zebrafish experiments with the exception of TUNEL and caspase-3 assays (V.B.) and p53atgMO, myd88MO, and hIRAK1 WT, K/R and E3A rescue assays (Y.L); and SEA analyses under the supervision of A.S. and S.S. R.B.S performed all cell culture assays with the assistance of P.H.L. and R.T. and analyzed the data with P.H.L, Y.L., and S.S. R.G.M. purchased the radioresistant cell lines and assisted with translational analyses. E.d.S., R.M.W. and S.S. conceived the xenograft study, which was performed by E.d.S. and analyzed by R.R. A.A. performed TCGA analyses under the supervision of K.S.P. and analyzed the data with R.M.W. and S.S. P.M.U.U. performed docking studies under the supervision of A.S. A.G. generated the IRAK1 KO under the supervision of J.M.S. S.K. and X.Z.Z. performed in vitro isomerase assays under the supervision of K.P.L. H.D.S. analyzed PIN1 expression levels in the MDACC HNSCC cohort with J.V.H’s assistance. S.S. conceived the study, supervised the project and wrote the paper.
Competing interests:The authors declare no competing interests.
Addiitonal informationSupplementary information is available for this paper atReprints and permissions information is available at www.nature.com/reprints.Correspondence and requests for materials should be addressed to S.S.
Code AvailabilityAll codes used are referenced in the Methods sections hereabove.
Data AvailabilityWhole-genome expression array data that support the findings of this study have been deposited in the Gene Expression Omnibus (GEO) under accession code GSE67614. The human HNSCC and BRCA data were derived from the TCGA Research Network: http://cancergenome.nih.gov/. The data-set derived from this resource that supports the findings of this study is available in Supplemental Table 4 (see sheet S3). Source data for Figs. 1e, 2b,d, 3c,e-f, 4a-e,g-h,m-n, 5b,d, 6c-j, 7a-d,f-g and Supplementary Figs. 1b, 2a-b, 3, 4a-f,k-l, 5, 6c-n, and 7c-d have been provided as Supplementary Table 4. The full image dataset that supports the findings in Figs. 3e-f has been deposited in Figshare under accession code 10.6084/m9.figshare.7427942. All other data supporting the findings of this study are available from the corresponding author on reasonable request.
HHS Public AccessAuthor manuscriptNat Cell Biol. Author manuscript; available in PMC 2019 July 21.
Published in final edited form as:Nat Cell Biol. 2019 February ; 21(2): 203–213. doi:10.1038/s41556-018-0260-7.
Author M
anuscriptA
uthor Manuscript
Author M
anuscriptA
uthor Manuscript
5Department of Pathology, Tisch Cancer Institute, Icahn School of Medicine at Mount Sinai, New York, NY, USA.
6Cancer Biology Program, Beth Israel Deaconess Medical Center, Harvard Medical School, Boston, MA, USA.
7Department of Cancer Biology and Genetics, Memorial Sloan Kettering Cancer Center, New York, NY, USA.
8Department of Thoracic/Head & Neck Medical Oncology, The University of Texas MD Anderson Cancer Center, Houston, TX, USA.
9Department, Antitumor Assessment Core and Molecular Pharmacology Memorial Sloan Kettering Cancer Center, New York, NY 10065.
†Institute of Molecular and Cellular Biosciences, The University of Tokyo, Tokyo, Japan.
‡Albert Einstein College of Medicine, Bronx, NY, USA.
§Department of Oncology and Metabolism, The University of Sheffield, Sheffield, UK.
¶Hofstra-Northwell School of Medicine and Cold Spring Harbor Laboratory, Hempstead, NY, USA.
Abstract
Drug-based strategies to overcome tumour resistance to radiotherapy (R-RT) remain limited by the
single-agent toxicity of traditional radiosensitizers (e.g., platinums) and a lack of targeted
alternatives. In a screen for compounds that restore radiosensitivity in p53 mutant zebrafish while
tolerated in non-irradiated wild-type animals, we identified the benzimidazole anthelmintic,
oxfendazole. Surprisingly, oxfendazole acts via inhibition of IRAK1, a kinase otherwise involved
in Interleukin-1 and Toll-like receptor (IL-1R/TLR) immune responses. IRAK1 drives R-RT in a
pathway involving IRAK4 and TRAF6 but not the IL-1R/TLR—IRAK adaptor MyD88. Rather
than stimulating NF-κB, radiation-activated IRAK1 acts to prevent apoptosis mediated by the
PIDDosome complex (PIDD/RAIDD/caspase-2). Countering this pathway with IRAK1 inhibitors
suppresses R-RT in tumour models derived from cancers in which TP53 mutations predict R-RT.
Lastly, IRAK1 inhibitors synergize with inhibitors of PIN1, a prolyl isomerase essential for
IRAK1 activation in response to pathogens and, as shown here, ionizing radiation. These data
identify an IRAK1 radiation-response pathway as a rational chemo-RT target.
Introduction
RT delivers cytotoxic DNA breaks to tumor cells while minimizing damage to healthy
tissues, and is given to ~60% of cancer patients over the course of treatment1,2. Current
approaches to overcoming tumor R-RT consist of concurrent systemic chemotherapy with
classical anticancer agents such as genotoxins (e.g., cisplatin, 5-FU) and microtubule
inhibitors (e.g., taxanes). These traditional radiosensitizers primarily act by augmenting
DNA damage levels, thus enhancing cell killing within the field of radiation1–4.
Radiosensitizers can be effective: cisplatin-based chemoradiation therapy (CRT) improves
survival by 10% compared to RT alone in patients with head and neck squamous cell
carcinoma (HNSCC) and is the current standard of care in this cancer5. However, tumors
Liu et al. Page 2
Nat Cell Biol. Author manuscript; available in PMC 2019 July 21.
Author M
anuscriptA
uthor Manuscript
Author M
anuscriptA
uthor Manuscript
recur in a large majority of patients, leading to invariably fatal disease. Further
improvements of CRT have remained limited by the toxicity of radiosensitizers as single-
agents2,3. Moreover, these genotoxic drugs were not designed against –and thus do not
necessarily target– the genetic defects or signaling pathways that drive tumor R-RT.
Devising targeted strategies to supplant these cytotoxic chemotherapies is a current central
focus of NCI’s Radiation Therapy Oncology Group (NCI-RTOG)1 and NCRI’s Clinical and
Translational Radiotherapy Research Working Group (CTRad, UK)2.
A candidate, potentially pervasive mechanism of tumor R-RT is mutation of the p53
transcription factor, which occurs in ~50% of solid tumors6. Cells with mutant p53 fail to
initiate apoptotic or senescence gene-expression programs in response to ionizing radiation
(IR)-induced DNA breaks7–9. In HNSCC10,11, colorectal cancer (CRC)12,13, breast cancer
(BC)14, glioblastoma (GBM)15 and medulloblastoma (MB)16, patients with missense TP53 mutations have markedly worse outcomes following RT or CRT compared to patients with
WT TP53, with declines in recurrence-free or overall survival ranging from ~33% to 100%.
Yet, patients are not stratified by TP53 status and there are currently no drugs reported to
improve RT outcomes in TP53 mutant tumors1,2.
Results
In vivo zebrafish radiosensitizer screen identifies oxfendazole.
To identify such genotype-directed radiosensitizers while accounting for the problem of
systemic toxicity, we developed a whole-animal model of mutant TP53-driven R-RT for use
in unbiased genetic and chemical screens17,18. In this model, zebrafish embryos
homozygous for the M214K (MK) mutation in tp53 display fully penetrant R-RT, as
evidenced by (i) a complete lack of cell death induction in response to IR, a phenotype
scored in 24–48 hours post fertilization (hpf) embryos (Supplementary Fig. 1a-b)17,18; and,
(ii) a complete lack of IR-induced dorsal tail curvatures (DTC), a morphological
manifestation of zebrafish radiosensitivity19 assessable by eye in 96–120 hpf larvae (Fig.
1a). The mutated M214 residue corresponds to M246 in human p53, which maps to the
mutational hot-spot region in the DNA-binding domain and is mutated in >150 human
tumors sequenced thus far6. In a pilot, candidate gene-based screen, we found that inhibitors
of checkpoint kinase 1 (Chk1) such as Gö6976 restore wild-type (WT) levels of IR-induced
cell death in p53MK/MK embryos, with minimal toxicity in the absence of IR (Supplementary
Fig. 1a-b)18. Such potent radiosensitization by Chk1 inhibitor is also evident in the late DTC
assay, whereby Gö6976 restores DTC formation in ~75% of the mutants with no effects in
the absence of IR (Fig. 1a,b and Supplementary Fig. 1d). Gö6976 thus provided a positive
control for large-scale radiosensitizer screens exploiting the morphological DTC phenotype
as readout.
In a screen of 1,151 small molecules (including 640 FDA-approved drugs), we identified
one compound, oxfendazole, which radiosensitized p53MK/MK mutants with both greater
potency and lesser toxicity than Gö6976 (Fig. 1b, Supplementary Fig. 1c-g, and
Supplementary Tables 1 and 2). Importantly, these effects were observed at concentrations
tolerated by non-irradiated WT embryos (Fig. 1c). Radiosensitization by oxfendazole was
retained in mutant p53-depleted p53MK/MK embryos (Supplementary Fig 2a-c); was
Liu et al. Page 3
Nat Cell Biol. Author manuscript; available in PMC 2019 July 21.
Author M
anuscriptA
uthor Manuscript
Author M
anuscriptA
uthor Manuscript
apoptotic in nature, as evidenced by acridine orange, TUNEL and active caspase-3 stains of
48 hpf embryos examined 30 hours post-IR (hpIR) (Fig. 1d); associated with an increase in
DNA damage levels (Supplementary Fig. 2d-e); and was dose- and time-dependent, with
maximal efficacy when administered 0–4 hpIR (Supplementary Fig. 2g-i).
Target discovery for oxfendazole identifies IRAK1.
Oxfendazole is a benzimidazole anthelmintic approved for the treatment of worm infections
in livestock20,21. Because other microtubule inhibitors such as taxanes are commonly used
as radiosensitizers4, we initially considered tubulin inhibition as the mechanism for
oxfendazole-mediated radiosensitization. Unexpectedly, none of seven tubulin-binding
analogs of oxfendazole, including the classic antimitotic nocodazole, could phenocopy the
drug (in vivo SAR shown in Fig. 1e). Specifically, while the analogs could produce DTCs as
efficiently as oxfendazole, none showed any selectivity for IR (with the possible exception
of ricobendazole) and induced DTCs in the mutants regardless of radiation (Fig. 1e). Thus,
tubulin inhibition is unlikely to fully account for, if even involved in, oxfendazole’s
radiosensitizing properties. It is notable in this regard that of all benzimidazoles tested,
oxfendazole and ricobendazole have the lowest affinity for tubulin20.
To identify novel target(s) of oxfendazole whose inhibition might drive radiosensitization,
we used the Similarity Ensemble Approach (SEA) target-prediction algorithm (Fig. 2a)22.
SEA yielded 12 candidate targets, which we then tested for their ability to phenocopy
oxfendazole when inhibited by specific inhibitors in vivo (Figs. 2b and Supplementary Fig.
2j). This analysis identified Interleukin-1 Receptor-Associated Kinases IRAK1 and
IRAK423,24, whose inhibition by IRAK1/4 kinase inhibitor (IRAK1/4i)25 radiosensitized
p53MK/MK embryos with a potency nearing that of oxfendazole (Fig. 2b-d, 3a and
Supplementary Fig. 2j). Kinase-binding and in vitro kinase assays demonstrated oxfendazole
as a selective IRAK1 inhibitor (Fig. 2h and 2i, respectively). The observed Kd (5.8 μM) and
IC50 (38 μM) were consistent with concentrations of oxfendazole that radiosensitize
zebrafish p53MK/MK mutants (Fig. 1e). Docking of oxfendazole onto IRAK4-derived
zebrafish and human IRAK1 models26 predicts drug binding to the ATP-binding site and an
interaction with the hinge region via the benzimidazolyl carbamate moiety, while the
phenylsulfoxide moiety resides in a pocket adjacent to the DFG-motif (Fig. 2e-g).
IRAK1 is known as an effector of IL-1R and TLRs in innate immune signaling27. It acts
through the TRAF6 E3 ubiquitin ligase to stimulate NF-κB, p38/MAPK, JNK and ERK
prosurvival and inflammatory responses to pathogens23,24. IRAK1 had not been previously
implicated in the DNA damage response or cellular response to RT. Yet inspection of The
Cancer Genome Atlas (TCGA) cohort revealed significant overexpression of IRAK1 in
HNSCC and BC patient samples of TP53 mutant genotype compared to WT, as well as
tumors from those BC patients that ultimately received RT as part of their treatment
(Supplementary Fig. 3a,i-j; P < 0.0001, P < 0.0001 and P < 0.05, respectively; Wilcoxon
rank-sum test). We also found that IRAK1 is commonly activated in response to IR in TP53 mutant HNSCC, BC and CRC –derived cell lines, correlating with pronounced R-RT
phenotypes (Fig. 5d,g,h). We thus further investigated IRAK1 as a target for inhibition in
tumor R-RT.
Liu et al. Page 4
Nat Cell Biol. Author manuscript; available in PMC 2019 July 21.
Author M
anuscriptA
uthor Manuscript
Author M
anuscriptA
uthor Manuscript
We first sought to confirm the oxfendazole and IRAK1/4i data with additional IRAK1
inhibitors and gene targeting in zebrafish p53MK/MK embryos, as well as TP53 mutant
human cancer cells. For IRAK1 inhibition, we selected the tyrosine kinase inhibitor R406,
which inhibits IRAK1 with an IC50 of 9.7 nM vs. 150 nM for IRAK428; and Ginsenoside-
Rb1 (Gin-Rb1), a ginseng extract that inhibits IRAK1 but not IRAK4 or IRAK229. Whether
in zebrafish p53MK/MK mutants, HeLa cells (devoid of p53 protein via HPV E6) or TP53 mutant or null human cancer cell lines, genetic or pharmacologic inhibition of IRAK1 was
consistently incompatible with cell survival in the presence of IR but tolerated in the absence
of IR (Figs. 2j, 3a-f, 4a, 5e and Supplementary Fig. 4a-f). Both the zebrafish and human-cell
IRAK1 knockdown models were rescued by WT but not kinase dead30 (KD) human IRAK1
(Figs. 3e-g and 4c). Importantly, overexpression of WT, but not KD, IRAK1 was sufficient
to confer R-RT to otherwise radiosensitive Daoy MB cells (Fig. 4b). Finally, CRISPR/Cas9
gene-editing confirmed the kinase’s essential requirement for cell survival specifically after
IR (Fig. 4d).
IRAK1 drives R-RT independently of its IL-1R/TLR adaptor, MyD88, and canonical downstream pathways.
Both IRAK1’s proximal activator and proximal effector in IL-1R/TLR signaling—IRAK4
and TRAF6, respectively23,24,27—were also required for cell survival after IR (Fig. 4e).
IRAK4 was necessary for IR-induced activation of IRAK1, as assessed by T209
phosphorylation31,32 (Fig. 4f), while an IRAK1 mutant deficient in TRAF6-binding,
IRAK1E3A (E544A/E587A/E706A)33, afforded an only partial rescue of irak1-depleted
p53MK/MK embryos (Fig. 3e-g). By contrast, the adaptor protein MyD88—which bridges
IRAK1/4 to IL-1R/TLRs and is essential for IRAK1/4 activation in innate
immunity23,24,27,34—was dispensable for both IR-induced IRAK1 T209 phosphorylation
and overall R-RT in HeLa cells and p53MK/MK zebrafish (Figs. 4e-i and Supplementary Fig.
4g,k,l). In further contrast with canonical IRAK1 immune signaling: (i) the kinase did not
engage NF-κB, p38/MAPK, JNK or ERK signaling in response to IR (Figure 4j and
Supplementary Fig. 4h); and, (ii) an IRAK1 mutant deficient in NF-κB essential modulator
(NEMO) binding, IRAK1K2R (K134R/K180R)35, restored R-RT in Irak1-depleted
p53MK/MK zebrafish as efficiently as WT IRAK1 (Fig. 3e-g).
IR-activated IRAK1 acts to suppress PIDDosome-mediated apoptosis.
Instead of acting through its aforementioned canonical signaling pathways, we found that
IRAK1 drives survival after IR by preventing PIDDosome (PIDD-RAIDD-caspase-2)
signaling, a DNA damage-inducible apoptotic axis that does not require p53 for activation or
function after IR36–38. Indeed, depletion or deletion of IRAK1 triggered caspase-2 (C2)
maturation in irradiated cells in a PIDD- and RAIDD-dependent manner (Fig. 4k-l and
Supplementary Fig. 4i-j), and IRAK1 inhibitor-mediated radiosensitization was abolished in
PIDD-, RAIDD- and C2-depleted cells36 (Fig. 4m-n). As expected from previous
studies36,39, PIDDosome-mediated radiosensitization associated with increased levels of
DNA damage (Supplementary Fig. 2f). Lastly, IRAK1 inhibition after IR was sufficient to
enable ATM-mediated phosphorylation of the PIDD death domain (PIDDpT788, Figure 4k
and Supplementary Fig. 4i), an event necessary and sufficient for RAIDD recruitment and
PIDDosome formation36. Altogether, the data pointed to an evolutionarily conserved role for
Liu et al. Page 5
Nat Cell Biol. Author manuscript; available in PMC 2019 July 21.
Author M
anuscriptA
uthor Manuscript
Author M
anuscriptA
uthor Manuscript
IRAK1 in protecting cells from IR-induced cell death, acting in a pathway related to, but
genetically distinct from, IL-1R/TLR signaling.
IRAK1 inhibitors restore radiosensitivity in multiple cell models of tumour R-RT.
To evaluate the robustness of the IRAK1-targeting strategy, we analyzed the radiosensitizing
properties of IRAK1 inhibitors across both tumor- and TP53-mutation spectrums. We
assembled a panel of relevant cancer cell lines based on three criteria: cell lines must (i)
originate from a tumor type in which TP53 mutations adversely affect patient survival after
RT or CRT; (ii) contain a non-synonymous mutation in TP53; and (iii) have been previously
demonstrated as radioresistant in clonogenic assays. A search of the Cancer Cell Line
Encyclopedia40 combined with a literature search identified 12 such lines derived from
HNSCC, MB, GBM, CRC and BC (Fig. 5d). We also included MCF7 cells, which while
WT for TP53 display profound resistance to IR due to deletion of CASP341. With the
exception of the MB Daoy line, all selected cell lines confirmed as radioresistant in response
to 2.5, 5 and up to 7.5 Gy IR (Fig. 5b-d and Supplementary Fig. 5, DMSO columns and
corresponding cell viability curves, respectively). We thus screened the panel with the
IRAK1 inhibitors R406 and Gin-Rb1 applied at their respective MTDs, as determined in
HeLa cells (Fig. 5a), as well as a two-fold higher dose. For comparison, we tested cisplatin
(MTD and 2xMTD, as above), whose combination with RT is a standard of care in HNSCC
and is commonly used in CRT of many other cancers2. Cisplatin failed to sensitize any of
the TP53 mutant lines to IR, with only marginal additive effects observed in YD38 and
T98G cells (Fig. 5d and Supplementary Fig. 5). In stark contrast, Gin-Rb1 and R406
radiosensitized up to 10 and 7 of 11 TP53 mutant lines, respectively (Daoy excluded) (Fig.
5d and Supplementary Fig. 5 for corresponding cell viability curves; Supplementary Fig. 4d-
f for select colony assays). MCF7 radioresistance could not be overcome throughout the
screen regardless of drug, drug dose or IR dose. In the great majority of cases,
radiosensitization by the IRAK1 inhibitors occurred in those lines that engaged IRAK1
T209 phosphorylation in response to IR (Fig. 5g-h), and was obtained at drug doses that
were tolerated: (i) in the absence of IR (see 0 Gy data points in Fig. 5d and Supplementary
Fig. 5); and (ii) in irradiated non-tumorigenic fibroblasts (IMR-90) and mammary epithelial
cells (MCF10A) (Fig. 5f and Supplementary Fig. 5). Taken together with the zebrafish and
HeLa data, these results identified IRAK1 as a target for inhibition in cancers with mutant
TP53-driven R-RT.
An additional predicted oxfendazole target, PIN1 isomerase, drives R-RT in zebrafish and tumour-cell models and associates with R-RT in HNSCC.
Upon our analysis of SEA-predicted oxfendazole targets, we noticed that inhibition of one
additional candidate target, the peptidyl-prolyl cis/trans isomerase PIN142, radiosensitized
zebrafish p53MK/MK mutants with similar potency to that of IRAK1/4i (Fig. 2a-b). While in vitro isomerase and thermal shift assays could not immediately confirm PIN1 as an
oxfendazole target (Supplementary Fig. 6a-b), genetic or pharmacologic inhibition of PIN1
did consistently suppress R-RT in zebrafish (Fig. 6a-b and Supplementary Fig. 6c-g), HeLa
cells (Fig. 6c and Supplementary Fig. 6i-j), and HNSCC lines (Fig. 6e-f, Supplementary Fig.
6n for corresponding cell viability curves, and Supplementary Fig. 6j-m for select colony
assays). Like IRAK1, PIN1 was sufficient to force R-RT when overexpressed in
Liu et al. Page 6
Nat Cell Biol. Author manuscript; available in PMC 2019 July 21.
Author M
anuscriptA
uthor Manuscript
Author M
anuscriptA
uthor Manuscript
radiosensitive Daoy cells whereas a catalytically inactive (W34A/K63A) variant43 was less
potent (Fig. 6d). In further support of PIN1 as a driver of tumor R-RT, overexpression of
PIN1 significantly associated with locoregional recurrence (LRR; P=0.006) and reduced
overall survival (OS; P=0.007), but not distant metastases (DM), in HNSCC patients of
TP53 mutant genotype that were treated with post-operative RT at the MD Anderson Cancer
Center11,44 (Fig. 6g-j and Supplemental Table 3). Inspection of the TCGA HNSCC cohort –
whose analysis is however limited by a lack of LRR data45 – revealed significant
upregulation of PIN1 in TP53 mutant tumors that were ultimately treated with RT
(Supplementary Fig. 3f-h).
PIN1 inhibition prevents IR-induced IRAK1 activation and synergizes with IRAK1 inhibitors in vitro and in vivo.
Interestingly, PIN1 plays an essential and direct role in TLR-induced IRAK1 activation46.
Likewise, we found that genetic or pharmacologic inhibition of PIN1 blocked IR-induced
IRAK1 phosphorylation on T209 (Fig 6k-l). We thus tested whether IRAK1 and PIN1
inhibitors synergistically suppress R-RT in our various models. We trialed four combinations
of IRAK1+PIN1 inhibitors, involving the IRAK1 inhibitors Gin-Rb1 and R406 (see above),
and the PIN1 inhibitors epigallocatechin gallate (EGCG), a competitive inhibitor with μM
efficacy shown to bind the PIN1 catalytic site47,48; and buparvaquone, a repurposed
antiparasitic which binds and inhibits PIN1 with nM efficacy49. Each inhibitor was titrated
to a dose that did not decrease HeLa survival as single agent, even after 2.5 or 5 Gy IR.
Under these subtherapeutic conditions, all four combination treatments produced marked
synergistic declines in survival specifically after IR (Fig. 7a; Supplementary Figs. 7a and 7e
for combination indexes). These findings were recapitulated in: p53MK/MK fish (Fig. 7c and
Supplementary Figs. 6h and 7f); TP53 mutant HNSCC cell lines grown in vitro (Fig. 7d and
Supplemental Figs. 7b-d,g) or as tumor xenografts in vivo (Fig. 7e-g and Supplemental Fig.
7h); TP53–/– as well as WT HCT116 cells (Supplementary Fig. 7i); and one of the cell lines
from our radioresistant panel that best resisted IRAK1 inhibitors as single agents (SW480
cells, Supplemental Fig. 7b,g). All four IRAK1i+PIN1i combinations were otherwise
tolerated in IMR90 human fibroblasts, including after up to 7.5 Gy IR (Fig. 7b, left). While
MCF10A mammary epithelial cells showed some sensitivity (Fig. 7b, right), such toxicity
was not further exacerbated by IR and was marginal compared to the levels of tumor-cell
lethality induced by the various drug combinations in the tumorigenic cell lines (e.g.,
compare 5 Gy data points in panel 7b vs. that in Supplemental Fig. 7a-b). Clinical
translation will require extending these studies to additional in vivo tumor models/TP53 alleles, including in immunocompetent mice. Altogether, our data collectively identify
IRAK1 and PIN1 as rational targets in radioresistant cancers with efficacy stemming from
single or low-dose combination treatments.
Discussion
The data presented here show that IRAK1 kinase, a core transducer in innate immune
signaling conserved from flies to man23,24,27, plays an additional conserved role in the cell
survival response to IR. While this pathway involves the IL-1R/TLR pathway members
PIN1, IRAK4 and TRAF6, its MyD88-independence, full reliance on IRAK1 kinase activity,
Liu et al. Page 7
Nat Cell Biol. Author manuscript; available in PMC 2019 July 21.
Author M
anuscriptA
uthor Manuscript
Author M
anuscriptA
uthor Manuscript
partial reliance on TRAF6, and divergent downstream target (the PIDDosome) are
supportive of a distinct stress-response pathway that diverged from, or possibly preceded,
the pathogen response. The pathway may respond to one or more IR-induced primary or
secondary ionization events, including DNA breakage, micronucleation or other occurences
of cytosolic DNA, hydroxyl radicals or other reactive oxygen species, ruptured lipid
bilayers, and/or so-called Danger Associated Molecular Patterns (DAMPs), i.e., DNA or
nuclear proteins released into extracellular space50,51. A key feature of this pathway from a
therapeutic viewpoint is its IR-induced essentiality, whereby pathway inhibition is lethal to
zebrafish or cancer cells exposed to IR but is otherwise tolerated in the absence of IR. Even
germline losses of Irak1 or Pin1 are viable in mice52,53. Thus, IRAK1±PIN1 inhibitor
treatment could lead to improved tumor radiosensitization strategies whereby drug-induced
cytoxicity is restricted to the field of RT with minimal effects in unexposed tissues.
Additionally, the radiosensitzing properties of IRAK1 and PIN1 inhibitors in TP53 mutant
tumor cells are not allele-specific and are largely retained in TP53–/– and WT backgrounds.
This potentially expands the patient population that might benefit from IRAK1±PIN1
inhibitor-based CRT. Lastly, recent reports implicate deregulated IRAK1 and PIN1 in tumor
progression, maintenance and metastasis, via stabilization of mutant p53 itself54 and other
pathways23,32,34,42. Our discovery of these enzymes as drivers of cellular R-RT calls for
further development of IRAK1 and PIN1 inhibitors for therapeutic use.
Methods
Zebrafish Lines and Maintenance
Adult zebrafish were maintained on a 14:10 hour light:dark cycle at 28oC in accordance with
the regulations and policies of the Mount Sinai Institutional Animal Care and Use
Committee. The study is compliant with all relevant ethical regulations regarding zebrafish
research. The progeny of p53M214K/M214K fish were used in most experiments. Wild-type
zebrafish were from the AB line. The TILLING-mediated generation of the p53M214K/M214K
line, including allele designation, has been described17,18.
Zebrafish Drug Screen
Live embryos were dechorionated in pronase (2.0 mg/mL in egg water) for 7 minutes and
rinsed three times in egg water at 17 hpf. At least 15 p53M214K/M214K embryos were then
arrayed into each well of a 24-well plate and treated with drugs from FDA-approved drug
library V1 (Enzo Life Sciences) or proprietary kinase inhibitors (Reddy Lab) at a final
concentration of 20 μg/mL in egg water. In the primary screen, three wells were set aside for
controls: one negative control: p53M214K/M214K + DMSO; two positive controls:
p53M214K/M214K + Gö6956 (1 μM), p53+/+ + DMSO. Plates containing drug-treated
embryos were γ-irradiated at 18 hpf using a 137Cs-irradiator (X-ray IR can also be used but
developmental stage and dose differ, presumably due to low-energy electrons). 6 hours post
IR (hpIR), embryos were washed three times and scored at 72 hpf and 120 hpf for curved
tails and gross morphological changes. If any well lost embryos to necrosis or manipulation
such that less than 12 embryos were left before 120 hpf, that data point was not included in
analysis and the entire condition was repeated. In the secondary screen, set-up was similar
except two 24-well plates were set-up with identical drug treatments identified in the
Liu et al. Page 8
Nat Cell Biol. Author manuscript; available in PMC 2019 July 21.
Author M
anuscriptA
uthor Manuscript
Author M
anuscriptA
uthor Manuscript
primary screen, with embryos randomly assigned to each plate. Phenotyping was identical to
the primary screen. Again, at least 12 embryos were required to survive until 120 hpf for the
data point to be counted and the secondary screen was performed in three independent
experiments. Pictures were obtained of tricaine-anesthetized embryos mounted on 2–3%
methylcellulose and imaged with a Nikon SMZ 1500 fluorescence microscope.
Acridine Orange (AO) Labeling.
Live embryos were dechorionated in pronase (2.0 mg/mL in egg water) for 7 minutes and
rinsed three times in egg water at 17 hpf. After being arrayed and incubated with drugs,
depending on the experiment, embryos were then γ-irradiated at 18hpf using a 137Cs-
irradiator. 6 hours post IR (hpIR), embryos were labeled live with AO at 10mg/mL in egg
water for 20 min, washed three times, and analyzed with ImageJ as previously described18.
Whole-mount TUNEL Staining and Caspase-3 Immunohistochemistry
The TUNEL cell death assay was performed according to manufacturer’s instructions
(ApopTag Fluorescein In Situ Apoptosis Detection Kit) with zebrafish manipulations as
previously described18. Embryos stained for caspase-3 or γH2AX were fixed in 4% PFA
overnight at 4oC and subsequently dehydrated in methanol at −20oC for at least 2 hours.
Embryos were then rehydrated three times 5 min in PBST (1x PBS, 0.1% Tween-20), and
permeabilized by treatment with PDT (PBST + 1% DMSO) supplemented with 0.3% Triton-
X for 20 min. Embryos were treated with blocking solution (PDT supplemented with 10%
heat inactivated FBS) for 30 min before the addition of primary antibody (anti-activated-
Casp-3 1:500, StressGen AAs-103; anti-γH2AX 1:200, Millipore 05–636). Embryos were
incubated in primary antibody overnight at 4oC, rinsed three times 20 min in PDT and then
re-blocked for 30 min in blocking solution before the addition of AlexaFluor-conjugated
secondary antibody (1:250). Immunohistochemistry for TUNEL and caspase-3 labeled
embryos were imaged with a Nikon SMZ 1500 fluorescence microscope.
Immunohistochemistry for γH2AX was imaged with a Leica SP5 DM confocal microscope.
Similarity Ensemble Approach (SEA) Analysis
Chemical compound SMILES formulas were queried with the online SEA search tool
(http://sea.bkslab.org/search/) searching against ChEMBL version 16 Binding 10μM. Results
found benzimidazoles were copied into Microsoft Excel, sorted for duplicates, and color
graded according to E-values.
TCGA Analysis
TCGA datasets for two cancer types (HNSCC, BRCA) were obtained from the Broad
Institute’s Firehose pipeline. Gene expression data was quantile normalized via RSEM and
log2 transformed prior to analyses for IRAK1 and PIN1. TP53 mutation status and radiation
therapy treatment are summarized for each cancer type. Wilcoxon rank-sum test was
performed to test the association between gene (IRAK1, PIN1) expression and TP53 mutation status and receipt of radiation therapy. We further analyzed IRAK1/PIN1
expression in TP53 mutant and WT groups, across patients that received radiotherapy versus
those that did not. Survival comparisons were made via log rank test. Each gene was
Liu et al. Page 9
Nat Cell Biol. Author manuscript; available in PMC 2019 July 21.
Author M
anuscriptA
uthor Manuscript
Author M
anuscriptA
uthor Manuscript
stratified with respect to its median expression across TP53 status to determine any
prognostic association. All analysis was done in R software version 3.4.2 including the
‘survival’ package. Receipt of radiation is a time varying covariate which can confound
survival association through the time it was administered. Date of receipt of radiation is
needed to perform this analysis, which is not included in the TCGA data set55.
Chemicals and Inhibitors
Oxfendazole, fluocinolone, exemestane, cefepime, pranlukast, amiloride, alfacalcidol, and
albendazole were obtained from VWR; amoxapine, ricobendazole, mercazole were obtained
from Sigma-Aldrich; Salmeterol, indomethacin, canthaxanthin, bifonzaole, rapamycin,
mebendazole, fenbendazole, and flubendazole were obtained from Santa Cruz
Biotechnologies; misoprostol was obtained from Thermo Fisher; rebastinib and regorafinib
were obtained from Selleck Chem; Gö6976 was obtained from Calbiochem. Lapatinib,
SB203580, and SB202190 were gifted from Julio Aguirre-Ghiso. Debrafanib, sorafeninb,
and vemurafinib were gifted from Arvin Dar. Recombinant Human IL-1β was from
Peprotech (#200–01B) Doxycycline hyclatedoxycycline hyclate was purchased from
SIGMA (#D9891–1G). Inhibitors used were IRAK1/4 Inhibitor (SIGMA #I5409), R406
(Selleck Chemicals #S2194), Ginsenoside-Rb1 (Abcam ab142646 and J&K Scientific
#112127), Buparvaquone (Santa Cruz Biotechnology sc-210970) and EGCG (SIGMA
#E4268 and #E4143). IRAK1/4 inhibitor was originally discovered in a high-throughput
small-molecule screen for IRAK inhibitors, with IC50 values 300 nM and 200 nM for
IRAK1 and IRAK4 respectively. For 27 other kinases tested during discovery, IC50 values
were >10,000 nM25. Ginsenoside Rb1 was originally isolated from ginseng extract and
identified as a saponin among other components extracted from ginseng. It inhibits IRAK1
in an in vitro kinase assay with an IC50 ~10 μM29, with other reported activities against
PI3K/Akt, ER-β and enhancing the Nrf2/Ho-1 pathway among others. R406 was originally
found to be a SYK inhibitor with a Ki of 30 nM56, though DiscoverX assays (described
above) showed it to also inhibit FLT3, as well as IRAK1 and IRAK4. EGCG was identified
as a polyphenolic compound found in green tea with its earliest effects proposed to be a
protectant against the carcinogenic effects of teleocidin and okadaic acid57. It was later
found to directly bind and inhibit PIN1 with a Ki of 20 μmol/L48. Buparvaquone was derived
from a series of anti-Theileria parva (a cattle parasite) compounds, with its primary proposed
mechanism as inhibiting the parasite cytochrome b. It was recently found to also inhibit
Theileria annulate PIN1 in vitro (no reported IC50 or Kd)49.
In Vitro Kinase-Binding Assays (KINOMEScan)
KINOMEScan assays (DiscoveRx) were performed as follows: Kinase-tagged T7 phage
strains were prepared in an E. coli host derived from the BL21 strain. E. coli were grown to
log-phase and infected with T7 phage and incubated with shaking at 32°C until lysis. The
lysates were centrifuged and filtered to remove cell debris. The remaining kinases were
produced in HEK-293 cells and subsequently tagged with DNA for qPCR detection.
Streptavidin-coated magnetic beads were treated with biotinylated small molecule ligands
for 30 minutes at room temperature to generate affinity resins for kinase assays. The
liganded beads were blocked with excess biotin and washed with blocking buffer (SeaBlock
(Pierce), 1% BSA, 0.05% Tween 20, 1 mM DTT) to remove unbound ligand and to reduce
Liu et al. Page 10
Nat Cell Biol. Author manuscript; available in PMC 2019 July 21.
Author M
anuscriptA
uthor Manuscript
Author M
anuscriptA
uthor Manuscript
nonspecific binding. Binding reactions were assembled by combining kinases, liganded
affinity beads, and test compounds in 1x binding buffer (20% SeaBlock, 0.17x PBS, 0.05%
Tween 20, 6 mM DTT). Test compounds were prepared as 111X stocks in 100% DMSO.
Kds were determined using an 11-point 3-fold compound dilution series with three DMSO
control points. All compounds for Kd measurements are distributed by acoustic transfer
(non-contact dispensing) in 100% DMSO. The compounds were then diluted directly into
the assays such that the final concentration of DMSO was 0.9%. All reactions performed in
polypropylene 384-well plates. Each was a final volume of 0.02 ml. The assay plates were
incubated at room temperature with shaking for 1 hour and the affinity beads were washed
with wash buffer (1x PBS, 0.05% Tween 20). The beads were then re-suspended in elution
buffer (1x PBS, 0.05% Tween 20, 2 μM non-biotinylated affinity ligand) and incubated at
room temperature with shaking for 30 minutes. The kinase concentration in the eluates was
measured by qPCR.
In vitro Kinase Assays
In vitro kinase assays were performed by Reaction Biology Corporation (Malvern, PA).
Briefly, substrate (MBP, 20 μM final) was freshly prepared in reaction buffer (20 mM Hepes
pH 7.5, 10 mM MgCl2, 1 mM EGTA, 0.02% Brij35, 0.02 mg/ml BSA, 0.1 mM Na3VO4, 2
mM DTT, 1% DMSO). 4 nM human IRAK1 kinase was added to the substrate solution,
followed by oxfendazole by Acoustic technology (Echo550; nanoliter range). Samples were
incubated for 20 min at room temperature before addition of 33P-ATP (10 μM final, specific
activity of 10 μCi/μL), the incubated for 2 hr at room temperature. Radioactivity was
detected by filter-binding method. Kinase activity data were expressed as the percent
remaining kinase activity in test samples compared to vehicle (DMSO) reactions.
Oxfendazole was tested in 10-dose IC50 mode in triplicate with 3-fold serial dilution starting
at 200 μM, Control compound staurosporine was tested in 10-dose IC50 mode with 4-fold
serial dilution starting at 20 μM. IC50 values and curve fits were obtained using Prism
(GraphPad Software).
Molecular Docking.
Protein sequences of IRAK1 and IRAK4 catalytic domain were aligned with T-Coffee’s
structure-based alignment mode, Expresso58. IRAK4 x-ray structure (2nru)26 was used as
template for homology modeling of IRAK1. The homology modeling program MODELLER
v9.1559 was used to generate 10 IRAK1 models with an average ZDOPE60 score of −0.64
± 0.06, suggesting that at least 70% of the atoms are within 3.5 A of the native IRAK1
structure. Molecular docking to the IRAK1 models was performed with Glide, using the
Standard Precision mode and a hydrogen-bond constraint at the hinge region. The docking
results from the models were combined to generate the consensus docking result61.
Oxfendazole and analogs are predicted to dock to the ATP-binding site and interact with the
hinge region with the benzimidazolyl carbamate moiety, while the benzylsulfoxyl moiety in
a pocket adjacent to the DFG-motif. Method for zebrafish IRAK1 homology modeling was
the same as for human IRAK1. Default settings were used for Induced-fit Docking of
Oxfendazole. Specifically, the scaling of van der Waals radii for receptor atom was changed
to 0.75 for atoms with charge larger than ±0.15 e62.
Liu et al. Page 11
Nat Cell Biol. Author manuscript; available in PMC 2019 July 21.
Author M
anuscriptA
uthor Manuscript
Author M
anuscriptA
uthor Manuscript
Microinjections into Zebrafish Embryos
Human IRAK1 WT, KD and K134R/K180R were subcloned into the pCS2+ plasmid using
restriction enzymes EcoRI and XhoI. The IRAK1 E3A-pCS2+ construct was generated
using the Q5 site-directed mutagenesis Kit (NEB, #E0552S) to produce the E544A/E587A/
E706A variant63. All plasmids were linearized by Sac2 single enzyme treatment at 37oC for
4 hrs. Digests were stopped by adding 1/20 volume 0.5 M EDTA, 1/10 volume of 3 M Na
acetate and 2 volumes EtOH. Samples were mixed and chilled at −20oC for 15 min, washed
and resuspended in TE buffer. Sense-capped mRNAs were synthesized for injection using
the mMESSAGE mMACHINE SP6 kit (Ambion, #AM1340) followed the manufacturer’s
instructions. mRNA concentrations were determined by Nanodrop and RNA gel. The
following mRNAs were co-injected with irak1 MO during the 1–2 cell stage: 20 pg WT
IRAK1 mRNA, 25–30 pg IRAK1 KD, 25–30 pg K134R/180R or 25–30 pg E3A mutant
mRNAs. zp53-ATG MO64 and zp5364 antibody (Genetex, GTX128135) were kindly
provided by the Jaime Chu. Protein extractions from embryos was performed as previously
described3 and analyzed by western blot as described later below. Morpholino (MOs)
antisense oligonucleotides were obtained from Gene Tools, LLC. Sequences were as
follows:
Standard control (“std”) 5’-CCTCTTACCTCAGTTACAATTTATA-3’
pin1-e1i1 5’-ACTCTCTCTGCTCACTCTGGATGAG-3’
irak1-i5e6 5’-AATCCTGCAACACAACAGCCACATT-3’
irak4-e4i4 5’-GTGAACAGGTAAAGCCTCACAGGAT-3’
zp53-ATG 5’-GCGCCATTGCTTTGCAAGAATTG-3’
myd88 5’-TCTTGACGGACTGGGAAACTC G-3’
MOs were resuspended in sterile water to a stock concentration of 2 mM and delivered into
one-cell stage zebrafish embryos by microinjection at various final concentrations with 0.1%
Phenolred (Sigma).
Sequencing primers for confirming knockdown:
rpp0-F: TAGCCGATCCGCAGACACAC
rpp0-R: CTGAACATCTCGCCCTTCTC
pin1-e1-F: AGAACATCACACGCAGCAAAG
pin1-e3-R: GTGCAAATGAGGCGTCTTCAA
irak1-e1-F: GGGTTATGGACTCGCTTTCA
irak1-e11-R: CATGCGAGGTCTCTTCTTC
Myd88F: TCTTGACGGACTGGGAAACTCG
Liu et al. Page 12
Nat Cell Biol. Author manuscript; available in PMC 2019 July 21.
Author M
anuscriptA
uthor Manuscript
Author M
anuscriptA
uthor Manuscript
Myd88R: GATTTGTAGACGACAGGGATTAGCC
RT-PCR and Protein Extraction from Zebrafish Embryos
Embryonic RNA was isolated from 24–48 hpf embryos (>15 embryos/sample) using a
standard Trizol method (250 μL Trizol (Invitrogen), 50 μL CHCl3, 175 μL isopropanol). One
microgram of purified RNA was used to generate cDNA using the Invitrogen SuperScript
First Strand III RT-PCR kit, with oligo-dT primers. Two micrograms of the cDNA product is
loaded on a 1% agarose gel. Pooled embryo protein lysates were harvested as previously
described18.
Cell Culture and Cell Lines
HeLa, HCT116, CAL27, SAS, BHY, HN, and Detroit562 cell lines were cultured in DMEM
medium (GIBCO) supplemented with 10% fetal bovine serum (FBS) and 1% penicillin/
streptomycin. YD38 cells were cultured in RPMI medium, also supplemented with 10%
FBS and 1% penicillin/streptomycin. Experiments requiring combined drug-treatment and
irradiation were performed as follows: cells were seeded in 10cm plates and grown to 30–
50% confluence. 1 hour before IR, cells were treated with drugs accordingly. Harvesting
lysates for western blotting after IR typically occurred at 24 hpIR, while harvesting cells for
fixation and TUNEL staining occurred after 48 hpIR. CAL27, Detroit562, Daoy, and T98G
cells were obtained from ATCC. SAS cells were purchased from HSRRB, BHY from
DSMZ, and YD38 from KCLB. MDA-MB-231, T47D, and MCF7 cells were kindly
provided by Doris Germain. HeLa stable shPIDD, shRAIDD and shCASP2 cells have been
described36. IMR90 and MCF10A cells were kindly provided by Julio Aguirre-Ghiso. See
Supplementary Table 3 for more details on cell line-specific culture media and protocols.
siRNA transfection, shRNA transduction, DNA transfection and constructs
siRNA transfections were performed using X-tremeGENE siRNA transfection reagent
(Roche) and unless otherwise stated 20nM siRNA according to the manufacturer’s
instructions. Cells were exposed to IR +/− Gö6976 or oxfendazole at 48 hours post-
transfection. Lentiviral shRNA transduction was performed in HeLa cells as previously
described36 with shTRIPZ, shPIN1, and shIRAK1. shPIDD, shRAIDD and shCASP2 HeLa
cells and hairpin sequences have been described36. DNA transfections were performed as
previously described65. Human IRAK1 WT and KD30 were kind gifts from Dr Xiaoxia Li.
IRAK1 Human IRAK1 K134R/K180R in pDEST-515 vector35 was from Jonathan Ashwell.
IRAK1 E3A, derived from WT IRAK1 template, was generated using the Q5 site-directed
mutagenesis Kit (NEB, #E0552S) to produce the E544A/E587A/E706A mutations63.
pBybe-PIN1-WT and pBybe-PIN1-W34K63A have been described66. siRNAs were also
provided by Qiagen and target sequences were:
siIRAK1#5: CCGGGCAATTCAGTTTCTACA
siIRAK1#6: TCCCATCGCCATGCAGATCTA
siIRAK4#6: ATCCTATTAGTCATATATTTA
siMYD88#5: AACTGGAACAGACAAACTATC
Liu et al. Page 13
Nat Cell Biol. Author manuscript; available in PMC 2019 July 21.
Author M
anuscriptA
uthor Manuscript
Author M
anuscriptA
uthor Manuscript
siTRAF6#7: AGGGTACAATACGCCTTACAA
siPIN1#5: GACCGCCAGATTCTCCCTTAA
siPIN1#6: CAGTATTTATTGTTCCCACAA
shRNA clones were purchased from Quiagen and mature antisense sequences were:
shIRAK1: ATTACTCAAGGACAACCTG (V3THS_305359)
shPIN1.1: TGAAGTAGTACACTCGGCC
shPIN1.2: TGGCTGAGCTGCAGTCGCT
CRISPR/Cas9 gene editing
Plasmid lentiCRISPR v2 was digested with BbsI (New England Biolabs Cat. No R0580)
according to manufacturer’s recommendations, briefly: 1μg of plasmid was digested for 1h
at 55°C, then digested plasmid was gel purified using QIAquick Gel Extraction Kit and
eluted in water. sgRNA oligos for cloning were annealed by mixing them in equal 10 μM
concentrations with addition of 1xT4 DNA Ligase Buffer, then mixture was incubated 37oC
30 min, then 95oC 5 min and then ramped down to 25oC at 5oC/min, hybridized oligos
diluted 1:200 with H2O. BbsI digested lentiCRISPR v2 plasmid (50ng) was ligated with 1
μM final concentration oligo duplex using T4 Ligase (NEB Cat. No. M0202) according to
manufacturer’s recommendations and incubated overnight at 4°C. XL-1 blue competent E.
coli were transformed with 1 μl of ligation reaction according to manufacturer’s protocol
(Cat. No. 200249). Single clones were sequence verified using Sanger sequencing.
Lentivirus particles containing sgRNA constructs of IRAK1 were generated by transfecting
Phoenix packaging cells with lentiCRISPR v2 containing IRAK1 sgRNAs and combination
of lentiviral helper plasmids pCMV-dR8.91 and pMD.G at a ratio of 2:1:1, respectively,
jetPEI (101–10N; Polyplus) was used as transfecting agent. 24 hours later media containing
viral particles was collected and concentrated using Lenti-X concentrator according to
manufacturer’s protocol (Clontech Cat. No. 631231). Briefly, 1 volume of Lenti-X
Concentrator mixed with 3 volumes of 0.45μm filtered viral particles containing media.
Solution incubated overnight at 4°C. Then samples centrifuged at 1,500 x g for 45 minutes
at 4°C, supernatant aspirated and pellet resuspended in HeLa and Cal27 cells growth media.
For infection, 2×10⁵ HeLa and Cal27 cells plated into 6-well plates, next day 5μM
polybrene (Millipore Cat. No. tr-1003-g) and 200μl of concentrated viral particles added per
well. Next day media replaced with media containing 1μg/ml puromycin for selection.
IRAK1 sgRNA oligos (5’->3’) were:
sgRNA1:
a. CACCGACACGGTGTATGCTGTGAAG
b. AAACCTTCACAGCATACACCGTGTC
sgRNA2:
Liu et al. Page 14
Nat Cell Biol. Author manuscript; available in PMC 2019 July 21.
Author M
anuscriptA
uthor Manuscript
Author M
anuscriptA
uthor Manuscript
a. CACCGAGGAGTACATCAAGACGGGA
b. AAACTCCCGTCTTGATGTACTCCTC
sgRNA3:
a. CACCGATTTATCCCACAGAAAGACC
b. AAACGGTCTTTCTGTGGGATAAATC
sgRNA4:
a. CACCGGATCAACCGCAACGCCCCGTG
b. AAACCACGGGCGTTGCGGTTGATCC
AlamarBlue Cell Survival Assay
Cells were seeded to 96-well plates at densities ranging from 400–1500 cells/well (see
Supplementary Table 3 for seeding densities). 8 hours after seeding, if experiments were
performed on cells without shRNA previously transfected, drugs were added to the medium,
incubated 1 hour, then irradiated. If shRNA lines were used, cells were treated with 1 μg/ml
doxycycline for 24 hours before irradiation. 3–4 days post IR, cells were incubated with
AlamarBlue (ThermoFisher) at a final concentration of 10%. Absorbance was measured at a
wavelength of 570 nm with a 600 nm reference wavelength. Relative fluorescence (RFU)
was calculated using cell free wells as a control reference and percent survival was
calculated compared to DMSO-treated, non-irradiated controls.
Clonogenic Assay
Single-cell suspensions were seeded into 6-well plates (50–200 cells/well). Drugs were
added to the medium after 8 hours and irradiated in a 137Cs-irradiator. After being cultured
for 14 days, plates were rinsed with PBS, incubated with fixing solution (75% methanol,
25% acetic acid) and stained by 0.5% crystal violet (Sigma-Aldrich, St Louis, MO, USA) in
methanol for 30 min at room temperature. Colonies consisting of at least 50 cells were
scored. Clonogenic assays performed on shRNA transfected lines required refreshing media
with 1 μg/ml doxycycline every 48 hours.
TUNEL Assay (cell lines)
TUNEL assays in HeLa cells were performed using the APO-BRDU kit (BD Biosciences)
as described previously18.
Western Blotting and Antibodies
Whole-cell lysates were prepared in RIPA buffer or 1% NP-40 Buffer (Boston BioProducts).
Lysate (25–200 μg) was added to NuPAGE LDS Sample Buffer (4X) (Invitrogen) and 5% 2-
Mercaptoethanol (Sigma), and samples were incubated at 70°C for 10 min. Samples were
run on a Tris-Acetate gel in MES Running buffer (Invitrogen). After electrophoresis,
samples were transferred for 2 hr (90V, 150–200 mA) to a Nitrocellulose membrane
(Thermo Scientific) using a submerged transfer apparatus (Bio-Rad). Membranes were then
blocked with 5% bovine serum albumin (BSA) in Tris-buffered saline with 0.1% tween
Liu et al. Page 15
Nat Cell Biol. Author manuscript; available in PMC 2019 July 21.
Author M
anuscriptA
uthor Manuscript
Author M
anuscriptA
uthor Manuscript
(TBST) and probed overnight at 4°C with primary antibodies. Membranes were then washed
in TBST and probed with anti-rabbit, -rat, or -mouse (Cell Signaling Technology) HRP-
linked antibodies at a 1:2000–4000 dilution for 1 hr, washed, and placed in SuperSignal
West Pico Chemiluminescent Substrate or SuperSignal West Dura Extended Duration
Substrate (Pierce Biotechnology). The band of interest was then identified with photographic
film. Antibodies were: α-γH2AX (Ser139) (Cell Signaling Technology #9718), α-Chk1
(clone G-4, sc-8408), α-Chk1pSer345 (clone 13303, Cell Signaling Technology #2348), α-
PIDD (anti-LRDD, clone Anto1, Novus Biologicals NBP1–97595), α-RAIDD (clone 4B12,
MBL), α-PIDDpT788 (custom-generated, ref.31), α-caspase-2 (clone 11B4, EMD Millipore
MAB3507), α-IRAK1 (Cell Signaling Technology #4504), α-IRAK1pT209 (Assay Biotech,
#A1074), α-IRAK1pS376 (Genetex, #55332), α-IRAK4 (Cell Signaling Technology
#4363), α-ERKpT202/Y204 (Cell Signaling Technology #4370), α-ERK1/2 (Cell Signaling
Technology #4696), α-p38pT180/Y182 (Cell Signaling Technology #4511), α-p38 (BD
Biosciences #610168), α-JNKpT183/Y185 (Santa Cruz sc-6254), α-IκBα (Cell Signaling
Technology #4814), α-TRAF6 (Santa Cruz sc-8409), α-MyD88 (Cell Signaling #4283), α-
PIN1 (Abcam ab53350), α-actin (Abcam ab8227), α-Chk2 (clone 7, Millipore), α-p-Chk2
(T68) (#2661, Cell Signaling), α-GAPDH (Cell Signaling #2118), α-FLAG (DYKDDDDK
Tag antibody, Cell Signaling Technology #2368),
Immunofluorescence and Confocal Microscopy (Cell Culture)
Hela cells (1 X 10⁵) were seeded on coverslips in 6-well plates, fixed in 1% PFA,
permeabilized in 0.2% Triton X-100, blocked in 1% BSA-PBS, stained with IRAK1
antibody 1:100 and secondary antibody 1:200 (anti-rabbit, Alexa Fluor 488, Invitrogen),
mounted in vectashield with DAPI and sealed with nail polish, as described previously65.
Images were obtained under a 63X NA 1.40 oil objective with an invert confocal microscope
(405 nm, 488 nm; SP5, Leica) and acquired using LAS software.
PPIase assay
The PPIase activity on GST-Pin1, GST-FKBP12, or GST-cyclophilin in response to
compounds were determined using the chymotrypsin coupled PPIase activity assay with the
substrate Suc-Ala-pSer-Pro-Phe-pNA, Suc-Ala-Glu-Pro-Phe-pNA or Suc-Ala-Ala-Pro-Phe-
pNA (50 mM) in buffer containing 35 mM HEPES (pH 7.8), 0.2 mM DTT and 0.1 mg/ml
BSA at 10°C as described previously67. Ki value obtained from PPIase assay is derived from
the Cheng-Prusoff equation [Ki = IC50/ (1 + S/Km)], where Km is the Michaelis constant for
the used substrate, S is the initial concentration of the substrate in the assay, and the IC50
value of the inhibitor, as described67. ATRA (R2625), Cyclosporin A (300224), and FK-506
(F4679) were all from Sigma.
Thermal shift assay
Two micrograms of recombinant PIN1 (VWR) was combined with EGCG, oxfendazole,
buparvaquone, and nocodazole at 100 μM and Protein Thermal Shift Buffer (Applied
Biosciences). Mixtures were incubated at room temperature for 20 minutes, combined with
Thermal Shift dye and subjected to differential scanning fluorimetry68. Melt reactions from
20–90oC in 1.0oC increments were performed using a StepOne Plus instrument (Applied
Biosciences). Fluorescence readings were acquired with excitation and emission
Liu et al. Page 16
Nat Cell Biol. Author manuscript; available in PMC 2019 July 21.
Author M
anuscriptA
uthor Manuscript
Author M
anuscriptA
uthor Manuscript
wavelengths of 580±10 nm and 621±14 nm, respectively. StepOne Plus Protein Thermal
Shift Software (Applied Biosciences) was used to determine the Tm from each fluorescence
profile and the Tm of a first derivative of the fluorescence data at each temperature was used
to calculate ΔTm values.
Quantification of synergistic drug interactions
The synergy experiments were performed in both cell culture AlamarBlue survival and
zebrafish dorsal tail curvature assays as described above. Subtherapeutic doses were chosen
based on dose-response curves with the highest possible dose which produced <10%
decrease in cell viability or <20% dorsal tail curves after IR in cell culture and zebrafish
assays, respectively. This established our maximum tolerated dose (MTD). We then chose a
dose at a five-fold decrease from the MTD and used both doses for synergy experiments,
with one IRAK1 inhibitor and one PIN1 inhibitor. The analysis of synergy was done by the
isobologram and combination-index methods, derived from the Chou-Talalay median-effect
principle using CompuSyn software69.
Clinical samples
Pre-treatment HNSCC tumors were examined. All patients were treated with a complete
surgical resection followed by post-operative RT at MDACC. Tumor characteristics are
shown in Supplementary Table 3. All studies involving human samples were approved by
the MD Anderson Cancer Center Institutional Review Board in accordance with appropriate
ethical regulations regarding research involving patient samples. Patient samples were
collected as part of clinical protocols with appropriate consent. A total of 72 p16 negative
tumors were analyzed for which both p53 status and IRAK1 and PIN1 expression was
available. Ion torrent sequencing was performed as described previously to examine TP53 status44. mRNA expression was examined using llumina HumanWG-6 V3 BeadChip human
whole-genome expression arrays as described previously44. For outcomes analysis, patients
were first placed into two groups (36 in each group) by expression of either IRAK1, IRAK4,
TRAF6 or PIN1 (high vs. low) and then further classified by TP53 status (wild type vs.
mutant). Multivariate analysis of clinical (tumor stage, nodal stage and tumor site) and
mRNA-based (IRAK1, IRAK4, TRAF6 and PIN1) variables potentially affecting
locoregional recurrence (LRR) was performed using forward stepwise Cox regression for the
entire population as well as for the TP53 mutant patients only. Kaplan Meier curves
expressing LRR, time to distant metastasis (DM), disease free survival (DFS), and overall
survival (OS) were generated and log rank statistics were used to determine significance
between groups. R software, SPSS statistical software (v.20), and GraphPad Prism were
used. On multivariate analysis for the entire patient population, no clinical characteristic or
gene examined was associated with LRR following radiation. However, when LRR was
examined in only those patients whose tumors harbor a TP53 mutation, Nodal stage trended
toward (p=0.057) and PIN1 expression was significantly (p=0.018) associated with LRR.
Indeed, 64% of patients with a mutation in TP53 and high levels of PIN1 had a LRR at 5
years, compared to around 25% for patients in all other groups (see Figure 6g, p=0.006).
Liu et al. Page 17
Nat Cell Biol. Author manuscript; available in PMC 2019 July 21.
Author M
anuscriptA
uthor Manuscript
Author M
anuscriptA
uthor Manuscript
Xenograft studies
NSG mice (Jackson Laboratories) were used for in vivo studies and were cared for in
accordance with guidelines approved by the Memorial Sloan-Kettering Cancer Center
Institutional Animal Care and Use Committee and Research Animal Resource Center. The
study is compliant with all relevant ethical regulations regarding mouse research. 6–8 week
old female mice were injected subcutaneously with 2 million SAS cells together with
Matrigel70. Once tumors reached an average volume of 100 mm3 (i.e., 6 days post-
implantation), mice were randomized into four treatment groups: 1. Control (saline); 2.
Localized radiation; 3. Ginsenoside Rb1 + EGCG; 4. Radiation + Ginsenoside Rb1 +
EGCG. Dosing schedule was as follows: Ginsenoside Rb1 20 mg/kg i.p daily x 5 for 3
weeks, EGCG 50 mg/kg i.p QD3 for 3 weeks, localized radiation: 2.5 Gy once on day 1. For
the drug/RT combination arm, RT was delivered 30 min after dosing the mice with Gin-
Rb1+EGCG. Mice were observed daily throughout the treatment period for signs of
morbidity/mortality. Tumors were measured twice weekly using calipers, and volume was
calculated using the formula: length x width2 × 0.52. Body weight was also assessed twice
weekly. After 3 weeks of treatment tumor samples were collected for immunoblot and HIC
analysis.
Stainings of xenograft sections
For IF stainings, paraffin-embedded sections were de-paraffinized, followed by rehydration
and antigen retrieval as described below. Paraffin-embedded tissue sections were kept at 60
degree Celsius in the oven for 15 minutes, followed by slide hydration in xylene and a
graded alcohol series. For antigen retrieval, heat-induced epitope retrieval was performed
using a vegetable steamer by incubating slides in 10 mM citrate buffer for 40 min at 60oC,
followed by a wash in H20 and PBS. Post washes, cell membranes were permeabilized in
0.1% Triton X-100 in PBS for 5 minutes at room temperature. For primary antibody
staining, sections were blocked with 50mM NH4Cl for 15 min at room temperature,
followed by blocking with 3% normal goat serum (NGS) and 3% Bovine Serum Albumin
(BSA) in PBS for 60 min at room temperature. Binding of the primary antibodies against
Cleaved Caspase-3 (Asp175) rabbit antibody (Cell Signaling, catalog no. #9661) and
Vimentin rat antibody (R&D systems, catalog no. MAB2105) was carried out at 4°C
overnight, followed by PBS (2 × 5 min) washes. Prior to secondary antibody staining,
sections were incubated with 3% normal goat serum (NGS) and 3% Bovine Serum Albumin
(BSA) in PBS for 30 min at room temperature. Detection by secondary antibodies -Alexa
Fluor 488 goat anti-rabbit (Invitrogen, catalog no. A11008) and Alexa Fluor 568 goat anti-
rat (Invitrogen, catalog no. A11077) and was carried out at room temperature for 1 h in the
dark. Slides were mounted in Vectashield with DAPI (Vector Laboratories, catalog no.
CB-2000), following PBS (3 × 5 min) washes. The IF stainings were evaluated using a Leica
TCS SP5 II confocal Laser-microscope with DAPI, GFP and RFP filters. 2 sections of each
treated tumor and 3 fields of each tumor section were imaged at 60X magnification. For
Hematoxylin and Eosin stainings, images were acquired using a Leica bright field
microscope at a magnification of 40X.
Liu et al. Page 18
Nat Cell Biol. Author manuscript; available in PMC 2019 July 21.
Author M
anuscriptA
uthor Manuscript
Author M
anuscriptA
uthor Manuscript
Image analysis using Fiji software
Images were analyzed using the open-source processing software Fiji (ImageJ). Vimentin
positive cells were scored for positive cleaved caspase-3 staining. For scoring caspase-3
positive cells, images of samples incubated with secondary antibody, but no primary
antibody were used as background. The brightness and contrast of images was adjusted
relative to primary antibody control stainings, to identify caspase-3 positive cells in all
treated conditions. For this analysis, 3 fields of each tumor section and a total of 12 images,
comprising of 4 tumor samples for each treated condition were analyzed. Total cell numbers
per image were counted and the percentages of caspase-3 positive vimentin cells were
calculated. Graphs were plotted using Excel and p values were calculated using t-test.
Statistics and Reproducibility
With the exception of TCGA and MDACC patient cohort studies (see TCGA Analysis and
MDACC Clinical Samples sections above), paired two-tailed Students t-tests were used to
determine p-values (α = 0.05). The log rank test was used to determine p-values for survival
curves. Data in bar graphs are represented as mean ± SD or ± SEM, as indicated in legends,
and statistical significance was expressed as follows: *, P < 0.05; **, P < 0.005; ***, P <
0.0005; NS, not significant. Embryos from WT or p53MK/MK zebrafish group matings were
randomly allocated into experimental groups for irradiation, injections and/or drug
treatments. Most experiments were carried out at least twice, and the findings of all key
experiments were reliably reproduced. All replicates and precise P values are documented in
Supplementary Table 4, which states the number of independent samples, embryos and
independent experiments.
Supplementary Material
Refer to Web version on PubMed Central for supplementary material.
Acknowledgements:
We thank Eduardo Farias, Ross Cagan, Arvin Dar, Robert Krauss, Jonathan Ashwell, Xiaoxiao Li, Marshall Posner, Premkumar Reddy, Robert De Vita and Roberto Sanchez for helpful comments, technical advice and reagents, and Carlos Franco and Diarles Dominguez for zebrafish care. This work was supported in part by NIH/NCI F30CA186448 (P.H.L.), National Cancer Center NCC CCP postdoctoral fellowship (Y.L.), NIH/NCI P30 CA008748 (K.S.P.), NIH/NCI RO1CA168485 (H.D.S., J.V.H), and NIH/NCI RO1CA178162, JJR Foundation, Pershing Square Sohn Cancer Research Alliance, New York Community Trust and the Searle Scholars Program (S.S.).
References:
1. Lawrence YR, et al. NCI-RTOG translational program strategic guidelines for the early-stage development of radiosensitizers. J Natl Cancer Inst 105, 11–24 (2013). [PubMed: 23231975]
2. Sharma RA, et al. Clinical development of new drug-radiotherapy combinations. Nat Rev Clin Oncol 13, 627–642 (2016). [PubMed: 27245279]
3. Wilson GD, Bentzen SM & Harari PM Biologic basis for combining drugs with radiation. Semin Radiat Oncol 16, 2–9 (2006). [PubMed: 16378901]
4. Golden EB, Formenti SC & Schiff PB Taxanes as radiosensitizers. Anticancer Drugs 25, 502–511 (2014). [PubMed: 24335716]
Liu et al. Page 19
Nat Cell Biol. Author manuscript; available in PMC 2019 July 21.
Author M
anuscriptA
uthor Manuscript
Author M
anuscriptA
uthor Manuscript
5. Adelstein DJ, et al. An intergroup phase III comparison of standard radiation therapy and two schedules of concurrent chemoradiotherapy in patients with unresectable squamous cell head and neck cancer. J Clin Oncol 21, 92–98 (2003). [PubMed: 12506176]
6. Olivier M, et al. The IARC TP53 database: new online mutation analysis and recommendations to users. Hum Mutat 19, 607–614 (2002). [PubMed: 12007217]
7. Igney FH & Krammer PH Death and anti-death: tumour resistance to apoptosis. Nat Rev Cancer 2, 277–288 (2002). [PubMed: 12001989]
8. Vogelstein B, Lane D & Levine AJ Surfing the p53 network. Nature 408, 307–310 (2000). [PubMed: 11099028]
9. Vousden KH & Lu X Live or let die: the cell’s response to p53. Nat Rev Cancer 2, 594–604 (2002). [PubMed: 12154352]
10. Poeta ML, et al. TP53 mutations and survival in squamous-cell carcinoma of the head and neck. N Engl J Med 357, 2552–2561 (2007). [PubMed: 18094376]
11. Skinner HD, et al. TP53 disruptive mutations lead to head and neck cancer treatment failure through inhibition of radiation-induced senescence. Clin Cancer Res 18, 290–300 (2012). [PubMed: 22090360]
12. Nam TK, et al. Molecular prognostic factors in rectal cancer treated by preoperative chemoradiotherapy. Oncol Lett 1, 23–29 (2010). [PubMed: 22966250]
13. Sclafani F, et al. TP53 mutational status and cetuximab benefit in rectal cancer: 5-year results of the EXPERT-C trial. J Natl Cancer Inst 106(2014).
14. Eikesdal HP, Knappskog S, Aas T & Lonning PE TP53 status predicts long-term survival in locally advanced breast cancer after primary chemotherapy. Acta Oncol 53, 1347–1355 (2014). [PubMed: 24909504]
15. Li S, Zhang W, Chen B, Jiang T & Wang Z Prognostic and predictive value of p53 in low MGMT expressing glioblastoma treated with surgery, radiation and adjuvant temozolomide chemotherapy. Neurol Res 32, 690–694 (2010). [PubMed: 19703338]
16. Tabori U, et al. Universal poor survival in children with medulloblastoma harboring somatic TP53 mutations. J Clin Oncol 28, 1345–1350 (2010). [PubMed: 20142599]
17. Berghmans S, et al. tp53 mutant zebrafish develop malignant peripheral nerve sheath tumors. Proc Natl Acad Sci U S A 102, 407–412 (2005). [PubMed: 15630097]
18. Sidi S, et al. Chk1 suppresses a caspase-2 apoptotic response to DNA damage that bypasses p53, Bcl-2, and caspase-3. Cell 133, 864–877 (2008). [PubMed: 18510930]
19. McAleer MF, et al. Novel use of zebrafish as a vertebrate model to screen radiation protectors and sensitizers. Int J Radiat Oncol Biol Phys 61, 10–13 (2005). [PubMed: 15629588]
20. Lacey E Mode of action of benzimidazoles. Parasitol Today 6, 112–115 (1990). [PubMed: 15463312]
21. Prichard RK & Ranjan S Anthelmintics. Vet Parasitol 46, 113–120 (1993). [PubMed: 8484204]
22. Keiser MJ, et al. Relating protein pharmacology by ligand chemistry. Nat Biotechnol 25, 197–206 (2007). [PubMed: 17287757]
23. Jain A, Kaczanowska S & Davila E IL-1 Receptor-Associated Kinase Signaling and Its Role in Inflammation, Cancer Progression, and Therapy Resistance. Front Immunol 5, 553 (2014). [PubMed: 25452754]
24. Janssens S & Beyaert R Functional diversity and regulation of different interleukin-1 receptor-associated kinase (IRAK) family members. Mol Cell 11, 293–302 (2003). [PubMed: 12620219]
25. Powers JP, et al. Discovery and initial SAR of inhibitors of interleukin-1 receptor-associated kinase-4. Bioorg Med Chem Lett 16, 2842–2845 (2006). [PubMed: 16563752]
26. Wang Z, et al. Crystal structures of IRAK-4 kinase in complex with inhibitors: a serine/threonine kinase with tyrosine as a gatekeeper. Structure 14, 1835–1844 (2006). [PubMed: 17161373]
27. O’Neill LA, Golenbock D & Bowie AG The history of Toll-like receptors - redefining innate immunity. Nat Rev Immunol 13, 453–460 (2013). [PubMed: 23681101]
28. Rolf MG, et al. In vitro pharmacological profiling of R406 identifies molecular targets underlying the clinical effects of fostamatinib. Pharmacol Res Perspect 3, e00175 (2015). [PubMed: 26516587]
Liu et al. Page 20
Nat Cell Biol. Author manuscript; available in PMC 2019 July 21.
Author M
anuscriptA
uthor Manuscript
Author M
anuscriptA
uthor Manuscript
29. Joh EH, Lee IA, Jung IH & Kim DH Ginsenoside Rb1 and its metabolite compound K inhibit IRAK-1 activation--the key step of inflammation. Biochem Pharmacol 82, 278–286 (2011). [PubMed: 21600888]
30. Yao J, et al. Interleukin-1 (IL-1)-induced TAK1-dependent Versus MEKK3-dependent NFkappaB activation pathways bifurcate at IL-1 receptor-associated kinase modification. J Biol Chem 282, 6075–6089 (2007). [PubMed: 17197697]
31. Kollewe C, et al. Sequential autophosphorylation steps in the interleukin-1 receptor-associated kinase-1 regulate its availability as an adapter in interleukin-1 signaling. J Biol Chem 279, 5227–5236 (2004). [PubMed: 14625308]
32. Wee ZN, et al. IRAK1 is a therapeutic target that drives breast cancer metastasis and resistance to paclitaxel. Nat Commun 6, 8746 (2015). [PubMed: 26503059]
33. Muroi M & Tanamoto K IRAK-1-mediated negative regulation of Toll-like receptor signaling through proteasome-dependent downregulation of TRAF6. Biochim Biophys Acta 1823, 255–263 (2012). [PubMed: 22033459]
34. Rhyasen GW & Starczynowski DT IRAK signalling in cancer. Br J Cancer 112, 232–237 (2015). [PubMed: 25290089]
35. Conze DB, Wu CJ, Thomas JA, Landstrom A & Ashwell JD Lys63-linked polyubiquitination of IRAK-1 is required for interleukin-1 receptor- and toll-like receptor-mediated NF-kappaB activation. Mol Cell Biol 28, 3538–3547 (2008). [PubMed: 18347055]
36. Ando K, et al. PIDD death-domain phosphorylation by ATM controls prodeath versus prosurvival PIDDosome signaling. Mol Cell 47, 681–693 (2012). [PubMed: 22854598]
37. Sladky V, Schuler F, Fava LL & Villunger A The resurrection of the PIDDosome - emerging roles in the DNA-damage response and centrosome surveillance. J Cell Sci 130, 3779–3787 (2017). [PubMed: 29142064]
38. Tinel A & Tschopp J The PIDDosome, a protein complex implicated in activation of caspase-2 in response to genotoxic stress. Science 304, 843–846 (2004). [PubMed: 15073321]
39. Tinel A, et al. Autoproteolysis of PIDD marks the bifurcation between pro-death caspase-2 and pro-survival NF-kappaB pathway. EMBO J 26, 197–208 (2007). [PubMed: 17159900]
40. Barretina J, et al. The Cancer Cell Line Encyclopedia enables predictive modelling of anticancer drug sensitivity. Nature 483, 603–607 (2012). [PubMed: 22460905]
41. Essmann F, Engels IH, Totzke G, Schulze-Osthoff K & Janicke RU Apoptosis resistance of MCF-7 breast carcinoma cells to ionizing radiation is independent of p53 and cell cycle control but caused by the lack of caspase-3 and a caffeine-inhibitable event. Cancer Res 64, 7065–7072 (2004). [PubMed: 15466201]
42. Lu Z & Hunter T Prolyl isomerase Pin1 in cancer. Cell Res 24, 1033–1049.
43. Wei S, et al. Active Pin1 is a key target of all-trans retinoic acid in acute promyelocytic leukemia and breast cancer. Nat Med 21, 457–466 (2015). [PubMed: 25849135]
44. Skinner HD, et al. Proteomic Profiling Identifies PTK2/FAK as a Driver of Radioresistance in HPV-negative Head and Neck Cancer. Clin Cancer Res 22, 4643–4650 (2016). [PubMed: 27036135]
45. Cancer Genome Atlas N Comprehensive genomic characterization of head and neck squamous cell carcinomas. Nature 517, 576–582 (2015). [PubMed: 25631445]
46. Tun-Kyi A, et al. Essential role for the prolyl isomerase Pin1 in Toll-like receptor signaling and type I interferon-mediated immunity. Nat Immunol 12, 733–741 (2011). [PubMed: 21743479]
47. Moore JD & Potter A Pin1 inhibitors: Pitfalls, progress and cellular pharmacology. Bioorg Med Chem Lett 23, 4283–4291. [PubMed: 23796453]
48. Urusova DV, et al. Epigallocatechin-gallate suppresses tumorigenesis by directly targeting Pin1. Cancer Prev Res (Phila) 4, 1366–1377.
49. Marsolier J, et al. Theileria parasites secrete a prolyl isomerase to maintain host leukocyte transformation. Nature 520, 378–382. [PubMed: 25624101]
50. Candeias SM & Testard I The many interactions between the innate immune system and the response to radiation. Cancer Lett 368, 173–178 (2015). [PubMed: 25681669]
Liu et al. Page 21
Nat Cell Biol. Author manuscript; available in PMC 2019 July 21.
Author M
anuscriptA
uthor Manuscript
Author M
anuscriptA
uthor Manuscript
51. Reisz JA, Bansal N, Qian J, Zhao W & Furdui CM Effects of ionizing radiation on biological molecules--mechanisms of damage and emerging methods of detection. Antioxid Redox Signal 21, 260–292 (2014). [PubMed: 24382094]
52. Thomas JA, et al. Impaired cytokine signaling in mice lacking the IL-1 receptor-associated kinase. J Immunol 163, 978–984 (1999). [PubMed: 10395695]
53. Liou YC, et al. Role of the prolyl isomerase Pin1 in protecting against age-dependent neurodegeneration. Nature 424, 556–561 (2003). [PubMed: 12891359]
54. Girardini JE, et al. A Pin1/mutant p53 axis promotes aggressiveness in breast cancer. Cancer Cell 20, 79–91 (2011). [PubMed: 21741598]
55. Anderson JR, Cain KC & Gelber RD Analysis of survival by tumor response. J Clin Oncol 1, 710–719 (1983). [PubMed: 6668489]
56. Braselmann S, et al. R406, an orally available spleen tyrosine kinase inhibitor blocks fc receptor signaling and reduces immune complex-mediated inflammation. J Pharmacol Exp Ther 319, 998–1008 (2006). [PubMed: 16946104]
57. Fujiki H, et al. Anticarcinogenic effects of (−)-epigallocatechin gallate. Prev Med 21, 503–509 (1992). [PubMed: 1409491]
58. Notredame C, Higgins DG & Heringa J T-Coffee: A novel method for fast and accurate multiple sequence alignment. J Mol Biol 302, 205–217 (2000). [PubMed: 10964570]
59. Sali A & Blundell TL Comparative protein modelling by satisfaction of spatial restraints. J Mol Biol 234, 779–815 (1993). [PubMed: 8254673]
60. Eramian D, Eswar N, Shen MY & Sali A How well can the accuracy of comparative protein structure models be predicted? Protein Sci 17, 1881–1893 (2008). [PubMed: 18832340]
61. Ung PM & Schlessinger A DFGmodel: predicting protein kinase structures in inactive states for structure-based discovery of type-II inhibitors. ACS Chem Biol 10, 269–278 (2015). [PubMed: 25420233]
62. Sherman W, Day T, Jacobson MP, Friesner RA & Farid R Novel procedure for modeling ligand/receptor induced fit effects. J Med Chem 49, 534–553 (2006). [PubMed: 16420040]
63. Ye H, et al. Distinct molecular mechanism for initiating TRAF6 signalling. Nature 418, 443–447 (2002). [PubMed: 12140561]
64. Langheinrich U, Hennen E, Stott G & Vacun G Zebrafish as a model organism for the identification and characterization of drugs and genes affecting p53 signaling. Curr Biol 12, 2023–2028 (2002). [PubMed: 12477391]
65. Thompson R, et al. An Inhibitor of PIDDosome Formation. Mol Cell 58, 767–779 (2015). [PubMed: 25936804]
66. Wei S, et al. Active Pin1 is a key target of all-trans retinoic acid in acute promyelocytic leukemia and breast cancer. Nat Med 21, 457–466. [PubMed: 25849135]
67. Yaffe MB, et al. Sequence-specific and phosphorylation-dependent proline isomerization: a potential mitotic regulatory mechanism. Science 278, 1957–1960 (1997). [PubMed: 9395400]
68. Niesen FH, Berglund H & Vedadi M The use of differential scanning fluorimetry to detect ligand interactions that promote protein stability. Nat Protoc 2, 2212–2221 (2007). [PubMed: 17853878]
69. Chou TC Theoretical basis, experimental design, and computerized simulation of synergism and antagonism in drug combination studies. Pharmacol Rev 58, 621–681 (2006). [PubMed: 16968952]
70. Kawata M, et al. Additive effect of radiosensitization by 2-deoxy-D-glucose delays DNA repair kinetics and suppresses cell proliferation in oral squamous cell carcinoma. J Oral Pathol Med 46, 979–985 (2017). [PubMed: 28640935]
Liu et al. Page 22
Nat Cell Biol. Author manuscript; available in PMC 2019 July 21.
Author M
anuscriptA
uthor Manuscript
Author M
anuscriptA
uthor Manuscript
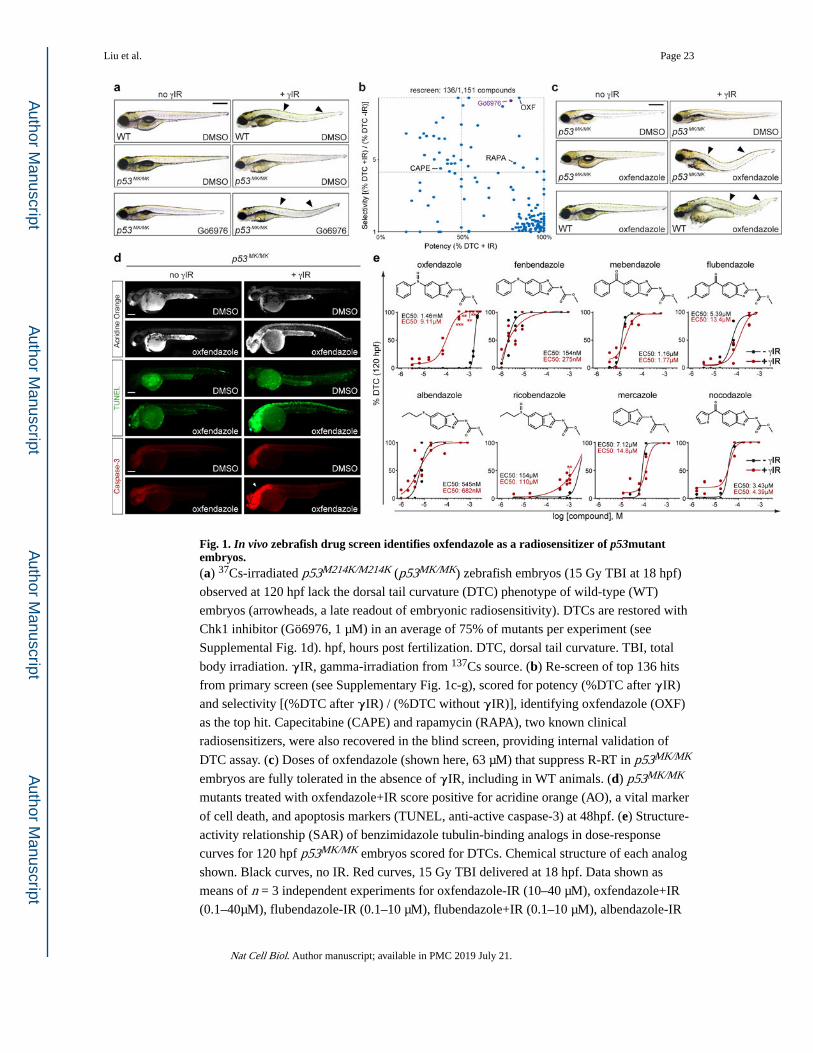
Fig. 1. In vivo zebrafish drug screen identifies oxfendazole as a radiosensitizer of p53mutant embryos.(a) 37Cs-irradiated p53M214K/M214K (p53MK/MK) zebrafish embryos (15 Gy TBI at 18 hpf)
observed at 120 hpf lack the dorsal tail curvature (DTC) phenotype of wild-type (WT)
embryos (arrowheads, a late readout of embryonic radiosensitivity). DTCs are restored with
Chk1 inhibitor (Gö6976, 1 μM) in an average of 75% of mutants per experiment (see
Supplemental Fig. 1d). hpf, hours post fertilization. DTC, dorsal tail curvature. TBI, total
body irradiation. γIR, gamma-irradiation from 137Cs source. (b) Re-screen of top 136 hits
from primary screen (see Supplementary Fig. 1c-g), scored for potency (%DTC after γIR)
and selectivity [(%DTC after γIR) / (%DTC without γIR)], identifying oxfendazole (OXF)
as the top hit. Capecitabine (CAPE) and rapamycin (RAPA), two known clinical
radiosensitizers, were also recovered in the blind screen, providing internal validation of
DTC assay. (c) Doses of oxfendazole (shown here, 63 μM) that suppress R-RT in p53MK/MK
embryos are fully tolerated in the absence of γIR, including in WT animals. (d) p53MK/MK
mutants treated with oxfendazole+IR score positive for acridine orange (AO), a vital marker
of cell death, and apoptosis markers (TUNEL, anti-active caspase-3) at 48hpf. (e) Structure-
activity relationship (SAR) of benzimidazole tubulin-binding analogs in dose-response
curves for 120 hpf p53MK/MK embryos scored for DTCs. Chemical structure of each analog
shown. Black curves, no IR. Red curves, 15 Gy TBI delivered at 18 hpf. Data shown as
means of n = 3 independent experiments for oxfendazole-IR (10–40 μM), oxfendazole+IR
(0.1–40μM), flubendazole-IR (0.1–10 μM), flubendazole+IR (0.1–10 μM), albendazole-IR
Liu et al. Page 23
Nat Cell Biol. Author manuscript; available in PMC 2019 July 21.
Author M
anuscriptA
uthor Manuscript
Author M
anuscriptA
uthor Manuscript
(0.05–0.2 μM), albendazole+IR (0.05–2.0 μM), mebendazole-IR (0.2–2.0 μM), mebendazole
+IR (0.1–2.0 μM), fenbendazole-IR (0.05–0.1 μM), fenbendazole-+R (0.025–0.1 μM),
ricobendazole-IR (20–75 μM), ricobendazole+IR (20–75 μM), mercazole-IR (2 μM),
mercazole+IR (2 μM ); and n = 2 independent experiments for the remaining data points, as
indicated by the dot plots and as detailed in Supplementary Fig. 5, with >21 embryos scored
per experiment; *P < 0.05, **P < 0.005, ***P < 0.0005, two-tailed Student’s t-test (α =
0.05). See Supplementary Table 4 for statistics source data including precise P values. Scale
bars, 0.5 (a,c) and 0.2 (d) mm.
Liu et al. Page 24
Nat Cell Biol. Author manuscript; available in PMC 2019 July 21.
Author M
anuscriptA
uthor Manuscript
Author M
anuscriptA
uthor Manuscript
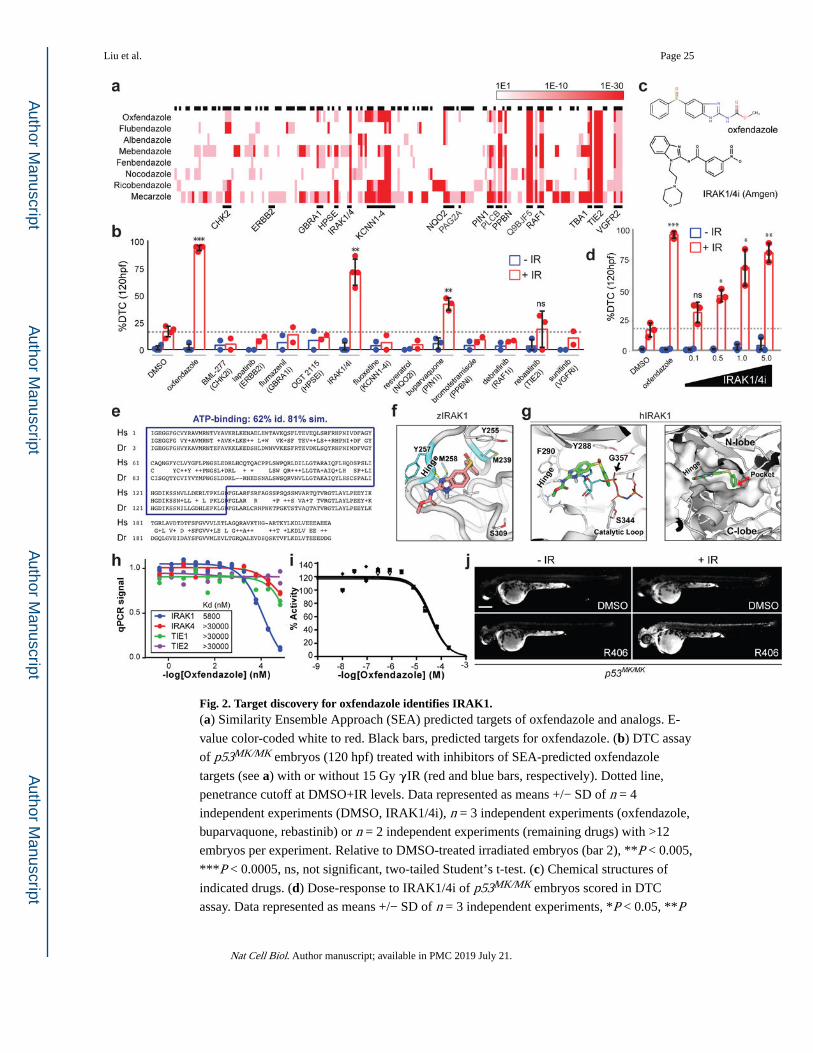
Fig. 2. Target discovery for oxfendazole identifies IRAK1.(a) Similarity Ensemble Approach (SEA) predicted targets of oxfendazole and analogs. E-
value color-coded white to red. Black bars, predicted targets for oxfendazole. (b) DTC assay
of p53MK/MK embryos (120 hpf) treated with inhibitors of SEA-predicted oxfendazole
targets (see a) with or without 15 Gy γIR (red and blue bars, respectively). Dotted line,
penetrance cutoff at DMSO+IR levels. Data represented as means +/− SD of n = 4
independent experiments (DMSO, IRAK1/4i), n = 3 independent experiments (oxfendazole,
buparvaquone, rebastinib) or n = 2 independent experiments (remaining drugs) with >12
embryos per experiment. Relative to DMSO-treated irradiated embryos (bar 2), **P < 0.005,
***P < 0.0005, ns, not significant, two-tailed Student’s t-test. (c) Chemical structures of
indicated drugs. (d) Dose-response to IRAK1/4i of p53MK/MK embryos scored in DTC
assay. Data represented as means +/− SD of n = 3 independent experiments, *P < 0.05, **P
Liu et al. Page 25
Nat Cell Biol. Author manuscript; available in PMC 2019 July 21.
Author M
anuscriptA
uthor Manuscript
Author M
anuscriptA
uthor Manuscript
< 0.005, ***P < 0.0005, n.s., not significant, relative to DMSO-treated irradiated embryos
(bar 2), two-tailed Student’s t-test. (e) Sequence alignment of human (Hs) and zebrafish (Dr)
IRAK1 kinase domains, ATP binding domain boxed in blue. Id, identity, sim., similarity.
(f,g) Induced-fit docking of oxfendazole to ATP-binding site of zebrafish (f) and human (g)
IRAK1 models. Gate-keeper residue: Y255 (Y288 in human). 3 residue changes near
proposed docking pose within binding site highlighted in cyan in zebrafish model: M239,
Y257, and M258 (V272, F290 and L291 in human). (h-i) KINOMEScan in vitro kinase
capture assay for indicated kinases (h) and in vitro kinase assay vs. IRAK1 (i), curved-fit
from 2 and 3 replicates, respectively. (j) IRAK1 inhibitor R406 (40 μg/ml) phenocopies
oxfendazole (see 1d) in AO assay at 48 hpf, with images representative of 2 independent
experiments. See Supplementary Table 4 for statistics source data including precise P values.
Scale bar, 0.2 mm.
Liu et al. Page 26
Nat Cell Biol. Author manuscript; available in PMC 2019 July 21.
Author M
anuscriptA
uthor Manuscript
Author M
anuscriptA
uthor Manuscript
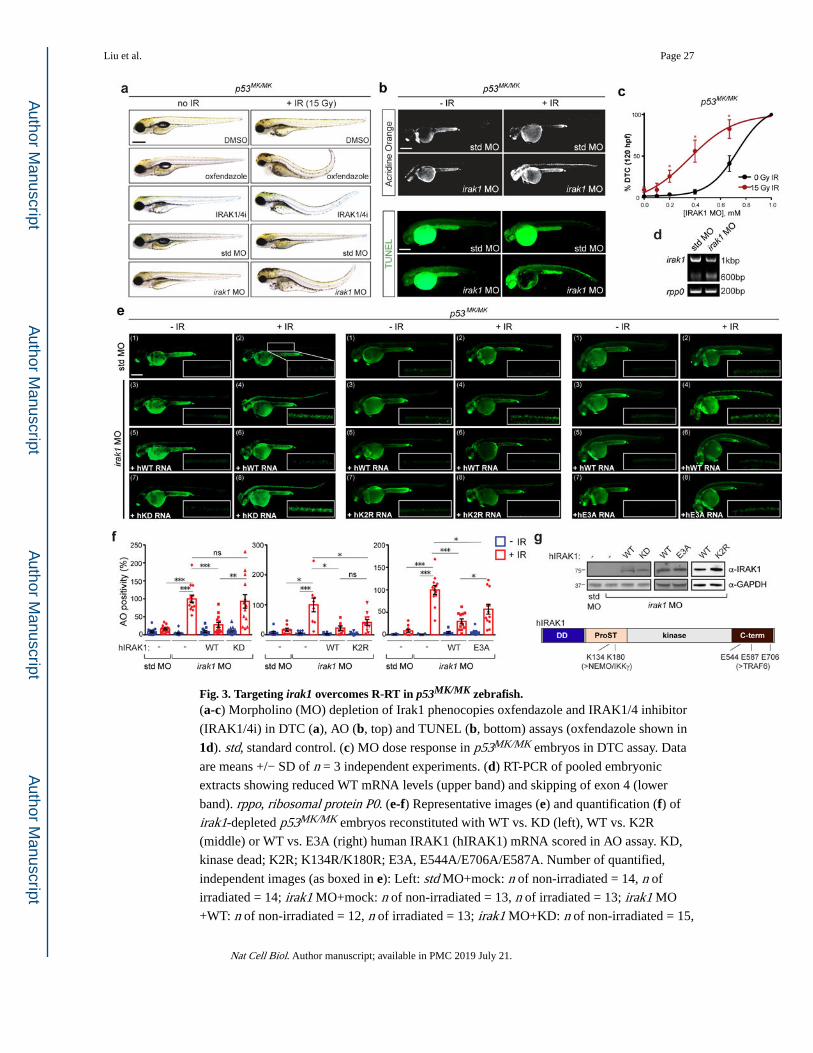
Fig. 3. Targeting irak1 overcomes R-RT in p53MK/MK zebrafish.(a-c) Morpholino (MO) depletion of Irak1 phenocopies oxfendazole and IRAK1/4 inhibitor
(IRAK1/4i) in DTC (a), AO (b, top) and TUNEL (b, bottom) assays (oxfendazole shown in
1d). std, standard control. (c) MO dose response in p53MK/MK embryos in DTC assay. Data
are means +/− SD of n = 3 independent experiments. (d) RT-PCR of pooled embryonic
extracts showing reduced WT mRNA levels (upper band) and skipping of exon 4 (lower
band). rppo, ribosomal protein P0. (e-f) Representative images (e) and quantification (f) of
irak1-depleted p53MK/MK embryos reconstituted with WT vs. KD (left), WT vs. K2R
(middle) or WT vs. E3A (right) human IRAK1 (hIRAK1) mRNA scored in AO assay. KD,
kinase dead; K2R; K134R/K180R; E3A, E544A/E706A/E587A. Number of quantified,
independent images (as boxed in e): Left: std MO+mock: n of non-irradiated = 14, n of
irradiated = 14; irak1 MO+mock: n of non-irradiated = 13, n of irradiated = 13; irak1 MO
+WT: n of non-irradiated = 12, n of irradiated = 13; irak1 MO+KD: n of non-irradiated = 15,
Liu et al. Page 27
Nat Cell Biol. Author manuscript; available in PMC 2019 July 21.
Author M
anuscriptA
uthor Manuscript
Author M
anuscriptA
uthor Manuscript

n of irradiated = 13; Middle: std MO+mock: n of non-irradiated = 9, n of irradiated = 9;
irak1 MO+mock: n of non-irradiated = 9, n of irradiated = 9; irak1 MO+WT: n of non-
irradiated = 8, n of irradiated = 7; irak1 MO+KD: n of non-irradiated = 10, n of irradiated =
11; Right: std MO+mock: n of non-irradiated = 8, n of irradiated = 10; irak1 MO+mock: n of non-irradiated = 7, n of irradiated = 12; irak1 MO+WT: n of non-irradiated = 7, n of
irradiated = 12; irak1 MO+KD: n of non-irradiated = 8, n of irradiated = 12. Raw images of
all embryos and cropped spinal chord areas available at 10.6084/m9.figshare.7427942. (g)
Western blot of embryonic extracts showing hIRAK1 levels and diagram of hIRAK1, with
disrupted residues and interactions shown. All data represented as means +/− SD, *P < 0.05,
**P < 0.005, ***P < 0.0005, ns, not significant, two-tailed Student’s t-test. See
Supplementary Table 4 and Supplementary Fig. 8 for statistics source data including precise
P values and unprocessed immunoblots, respectively. Scale bars, 0.5 (a) and 0.2 (b,e) mm.
Liu et al. Page 28
Nat Cell Biol. Author manuscript; available in PMC 2019 July 21.
Author M
anuscriptA
uthor Manuscript
Author M
anuscriptA
uthor Manuscript
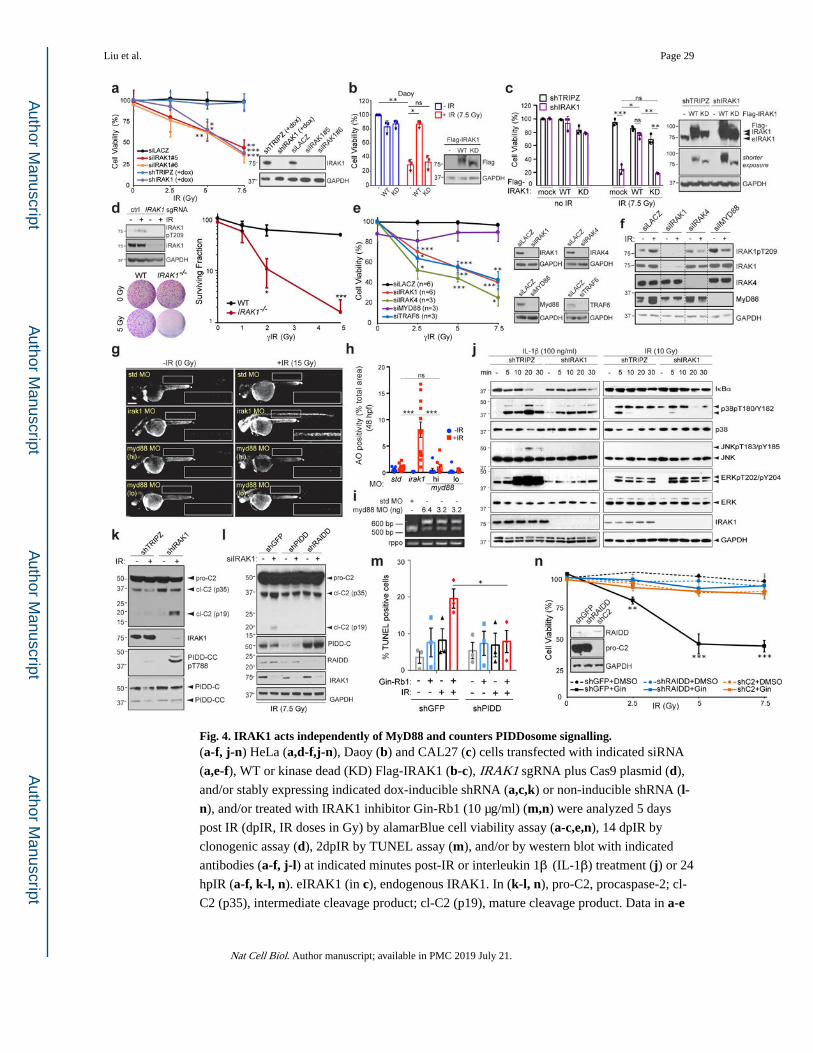
Fig. 4. IRAK1 acts independently of MyD88 and counters PIDDosome signalling.(a-f, j-n) HeLa (a,d-f,j-n), Daoy (b) and CAL27 (c) cells transfected with indicated siRNA
(a,e-f), WT or kinase dead (KD) Flag-IRAK1 (b-c), IRAK1 sgRNA plus Cas9 plasmid (d),
and/or stably expressing indicated dox-inducible shRNA (a,c,k) or non-inducible shRNA (l-n), and/or treated with IRAK1 inhibitor Gin-Rb1 (10 μg/ml) (m,n) were analyzed 5 days
post IR (dpIR, IR doses in Gy) by alamarBlue cell viability assay (a-c,e,n), 14 dpIR by
clonogenic assay (d), 2dpIR by TUNEL assay (m), and/or by western blot with indicated
antibodies (a-f, j-l) at indicated minutes post-IR or interleukin 1β (IL-1β) treatment (j) or 24
hpIR (a-f, k-l, n). eIRAK1 (in c), endogenous IRAK1. In (k-l, n), pro-C2, procaspase-2; cl-
C2 (p35), intermediate cleavage product; cl-C2 (p19), mature cleavage product. Data in a-e
Liu et al. Page 29
Nat Cell Biol. Author manuscript; available in PMC 2019 July 21.
Author M
anuscriptA
uthor Manuscript
Author M
anuscriptA
uthor Manuscript
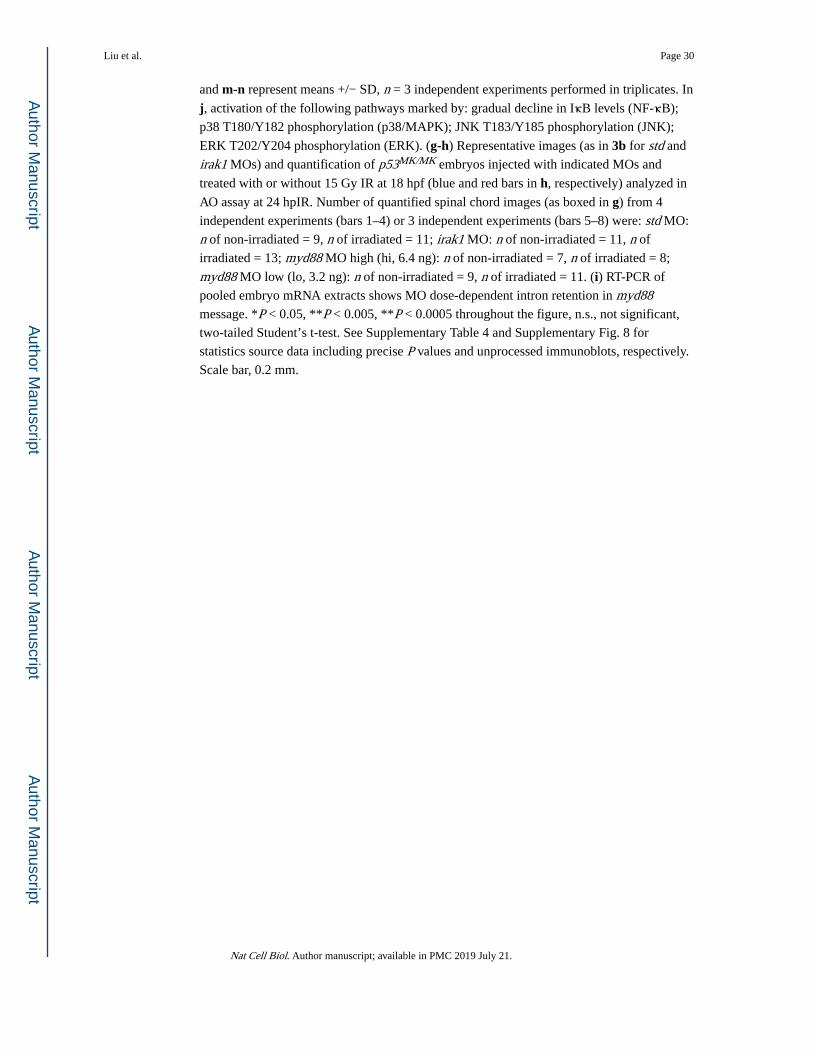
and m-n represent means +/− SD, n = 3 independent experiments performed in triplicates. In
j, activation of the following pathways marked by: gradual decline in IκB levels (NF-κB);
p38 T180/Y182 phosphorylation (p38/MAPK); JNK T183/Y185 phosphorylation (JNK);
ERK T202/Y204 phosphorylation (ERK). (g-h) Representative images (as in 3b for std and
irak1 MOs) and quantification of p53MK/MK embryos injected with indicated MOs and
treated with or without 15 Gy IR at 18 hpf (blue and red bars in h, respectively) analyzed in
AO assay at 24 hpIR. Number of quantified spinal chord images (as boxed in g) from 4
independent experiments (bars 1–4) or 3 independent experiments (bars 5–8) were: std MO:
n of non-irradiated = 9, n of irradiated = 11; irak1 MO: n of non-irradiated = 11, n of
irradiated = 13; myd88 MO high (hi, 6.4 ng): n of non-irradiated = 7, n of irradiated = 8;
myd88 MO low (lo, 3.2 ng): n of non-irradiated = 9, n of irradiated = 11. (i) RT-PCR of
pooled embryo mRNA extracts shows MO dose-dependent intron retention in myd88 message. *P < 0.05, **P < 0.005, **P < 0.0005 throughout the figure, n.s., not significant,
two-tailed Student’s t-test. See Supplementary Table 4 and Supplementary Fig. 8 for
statistics source data including precise P values and unprocessed immunoblots, respectively.
Scale bar, 0.2 mm.
Liu et al. Page 30
Nat Cell Biol. Author manuscript; available in PMC 2019 July 21.
Author M
anuscriptA
uthor Manuscript
Author M
anuscriptA
uthor Manuscript
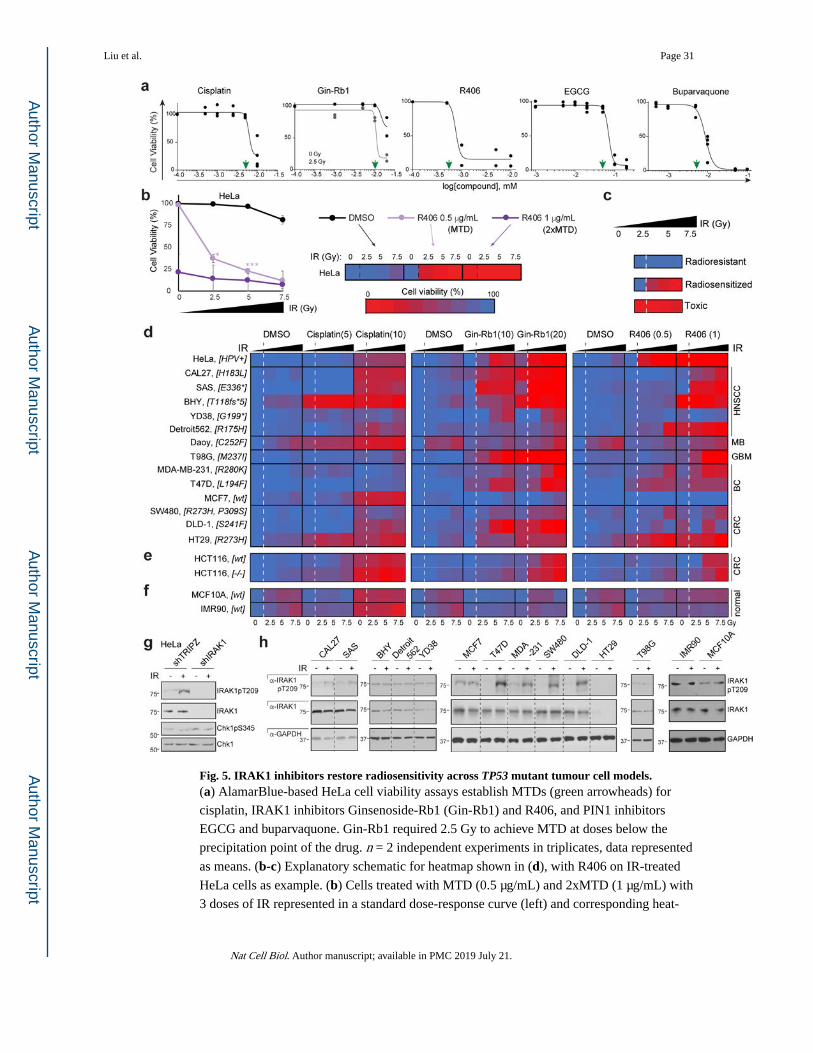
Fig. 5. IRAK1 inhibitors restore radiosensitivity across TP53 mutant tumour cell models.(a) AlamarBlue-based HeLa cell viability assays establish MTDs (green arrowheads) for
cisplatin, IRAK1 inhibitors Ginsenoside-Rb1 (Gin-Rb1) and R406, and PIN1 inhibitors
EGCG and buparvaquone. Gin-Rb1 required 2.5 Gy to achieve MTD at doses below the
precipitation point of the drug. n = 2 independent experiments in triplicates, data represented
as means. (b-c) Explanatory schematic for heatmap shown in (d), with R406 on IR-treated
HeLa cells as example. (b) Cells treated with MTD (0.5 μg/mL) and 2xMTD (1 μg/mL) with
3 doses of IR represented in a standard dose-response curve (left) and corresponding heat-
Liu et al. Page 31
Nat Cell Biol. Author manuscript; available in PMC 2019 July 21.
Author M
anuscriptA
uthor Manuscript
Author M
anuscriptA
uthor Manuscript
map representation (right). Cell viability color code shown from red at 0% to blue at 100%.
Note that this example showcases the three main phenotypic classes observed in the screen
shown in (d): ‘radioresistant’, ‘radiosensitized’, and ‘toxic’ (individually depicted in c). Data
represented as means of n = 3 independent experiments, P < 0.05, **P < 0.005, **P <
0.0005, two-tailed Student’s t-test. Source data available in supplementary Table 4, sheet S5.
(d-f) AlamarBlue-based cell viability heatmaps of radioresistant cancer cell lines (d, cell line
names indicated to the left with TP53 genotype in brackets and tumor of origin to the right),
WT and TP53 null HCT116 cells (e) and normal human cells (MCF10A, IMR90, f) treated
with cisplatin or IRAK1 inhibitors, Gin-Rb1 and R406, at indicated doses (MTD and
2xMTD, μg/ml) and IR (0, 2.5, 5 and 7.5 Gy, as indicated) in n = 3 independent experiments
performed in triplicates. Corresponding survival curves and P values shown in
Supplementary Fig. 5. (g) Indicated HeLa shRNA lines treated with or without IR (10 Gy)
and analyzed by western blot at 24 hpIR. (f) Cell lines as in d treated with or without IR (10
Gy) and analyzed by western blot 24 hpIR. 7 of 9 lines reliably radiosensitized by IRAK1
inhibitors (HeLa, CAL27, SAS, T47D, MDA-MB-231, SW480 and DLD-1, see d) engage
IRAK1 phosphorylation in response to IR while both resistant lines (BHY, MCF7) do not.
See Supplementary Table 4 and Supplementary Fig. 8 for statistics source data including
precise P values and unprocessed immunoblots, respectively.
Liu et al. Page 32
Nat Cell Biol. Author manuscript; available in PMC 2019 July 21.
Author M
anuscriptA
uthor Manuscript
Author M
anuscriptA
uthor Manuscript
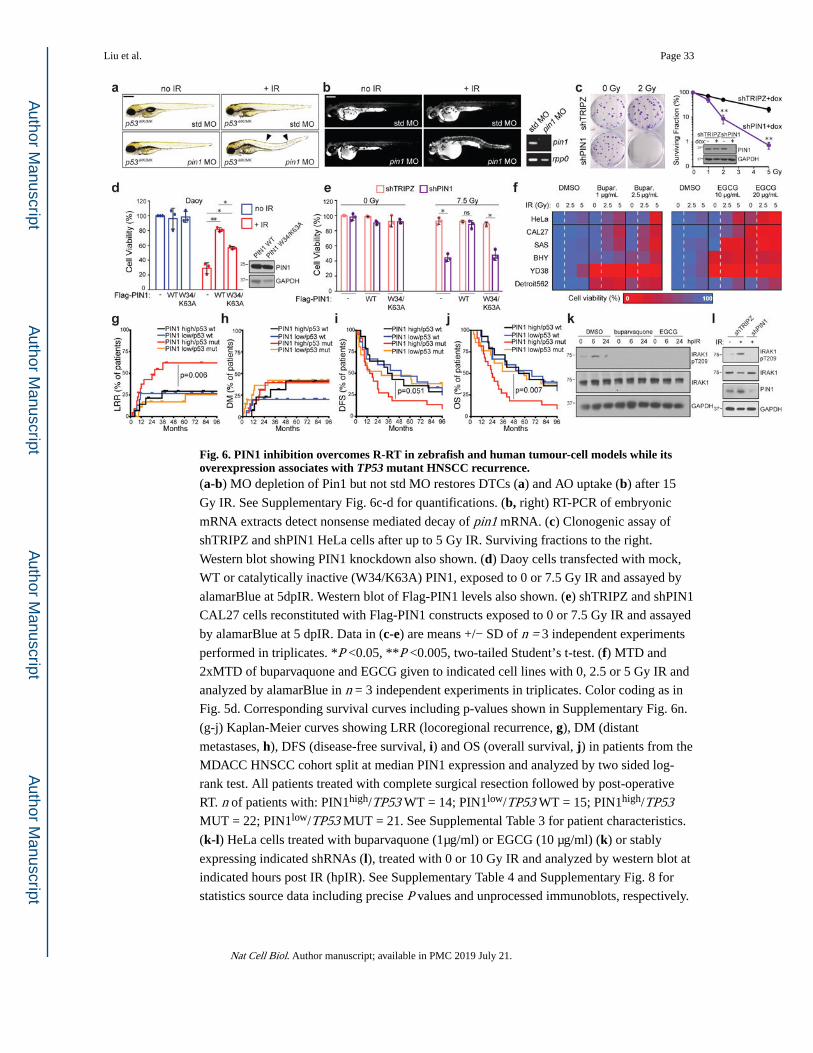
Fig. 6. PIN1 inhibition overcomes R-RT in zebrafish and human tumour-cell models while its overexpression associates with TP53 mutant HNSCC recurrence.(a-b) MO depletion of Pin1 but not std MO restores DTCs (a) and AO uptake (b) after 15
Gy IR. See Supplementary Fig. 6c-d for quantifications. (b, right) RT-PCR of embryonic
mRNA extracts detect nonsense mediated decay of pin1 mRNA. (c) Clonogenic assay of
shTRIPZ and shPIN1 HeLa cells after up to 5 Gy IR. Surviving fractions to the right.
Western blot showing PIN1 knockdown also shown. (d) Daoy cells transfected with mock,
WT or catalytically inactive (W34/K63A) PIN1, exposed to 0 or 7.5 Gy IR and assayed by
alamarBlue at 5dpIR. Western blot of Flag-PIN1 levels also shown. (e) shTRIPZ and shPIN1
CAL27 cells reconstituted with Flag-PIN1 constructs exposed to 0 or 7.5 Gy IR and assayed
by alamarBlue at 5 dpIR. Data in (c-e) are means +/− SD of n = 3 independent experiments
performed in triplicates. *P <0.05, **P <0.005, two-tailed Student’s t-test. (f) MTD and
2xMTD of buparvaquone and EGCG given to indicated cell lines with 0, 2.5 or 5 Gy IR and
analyzed by alamarBlue in n = 3 independent experiments in triplicates. Color coding as in
Fig. 5d. Corresponding survival curves including p-values shown in Supplementary Fig. 6n.
(g-j) Kaplan-Meier curves showing LRR (locoregional recurrence, g), DM (distant
metastases, h), DFS (disease-free survival, i) and OS (overall survival, j) in patients from the
MDACC HNSCC cohort split at median PIN1 expression and analyzed by two sided log-
rank test. All patients treated with complete surgical resection followed by post-operative
RT. n of patients with: PIN1high/TP53 WT = 14; PIN1low/TP53 WT = 15; PIN1high/TP53 MUT = 22; PIN1low/TP53 MUT = 21. See Supplemental Table 3 for patient characteristics.
(k-l) HeLa cells treated with buparvaquone (1μg/ml) or EGCG (10 μg/ml) (k) or stably
expressing indicated shRNAs (l), treated with 0 or 10 Gy IR and analyzed by western blot at
indicated hours post IR (hpIR). See Supplementary Table 4 and Supplementary Fig. 8 for
statistics source data including precise P values and unprocessed immunoblots, respectively.
Liu et al. Page 33
Nat Cell Biol. Author manuscript; available in PMC 2019 July 21.
Author M
anuscriptA
uthor Manuscript
Author M
anuscriptA
uthor Manuscript
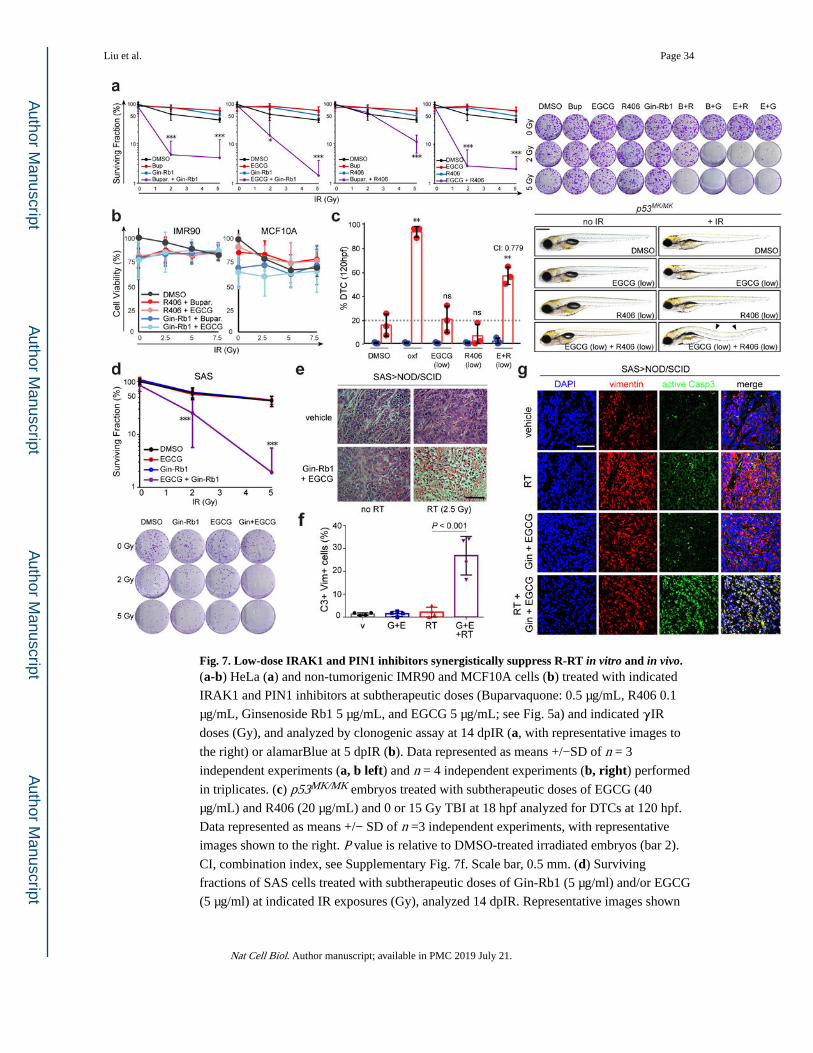
Fig. 7. Low-dose IRAK1 and PIN1 inhibitors synergistically suppress R-RT in vitro and in vivo.(a-b) HeLa (a) and non-tumorigenic IMR90 and MCF10A cells (b) treated with indicated
IRAK1 and PIN1 inhibitors at subtherapeutic doses (Buparvaquone: 0.5 μg/mL, R406 0.1
μg/mL, Ginsenoside Rb1 5 μg/mL, and EGCG 5 μg/mL; see Fig. 5a) and indicated γIR
doses (Gy), and analyzed by clonogenic assay at 14 dpIR (a, with representative images to
the right) or alamarBlue at 5 dpIR (b). Data represented as means +/−SD of n = 3
independent experiments (a, b left) and n = 4 independent experiments (b, right) performed
in triplicates. (c) p53MK/MK embryos treated with subtherapeutic doses of EGCG (40
μg/mL) and R406 (20 μg/mL) and 0 or 15 Gy TBI at 18 hpf analyzed for DTCs at 120 hpf.
Data represented as means +/− SD of n =3 independent experiments, with representative
images shown to the right. P value is relative to DMSO-treated irradiated embryos (bar 2).
CI, combination index, see Supplementary Fig. 7f. Scale bar, 0.5 mm. (d) Surviving
fractions of SAS cells treated with subtherapeutic doses of Gin-Rb1 (5 μg/ml) and/or EGCG
(5 μg/ml) at indicated IR exposures (Gy), analyzed 14 dpIR. Representative images shown
Liu et al. Page 34
Nat Cell Biol. Author manuscript; available in PMC 2019 July 21.
Author M
anuscriptA
uthor Manuscript
Author M
anuscriptA
uthor Manuscript
below. Data represented as means +/−SD of n = 3 independent experiments performed in
triplicates. (e-g) SAS (2. 106 cells)-derived tumor xenografts grown in NOD/SCID mice
with n = 5 animals per indicated group analyzed by haemotoxylin and eosin (H&E) staining
(e) and immunofluorescence confocal microscopy with indicated antibodies (f-g) 24 days
post-implantation. See Methods for detailed implantation, RT, drug delivery and staining
protocols. Scale bars, 100 μm (e) and 80 μm (g). Data in (f) are from the analysis of n = 4
independent samples per group with 3 independent images (as in g) scored per tumor. α-
Vimentin and α-active caspase-3 mark human and apoptotic cells, respectively. Unless
otherwise indicated, data throughout are expressed as means +/− SD, *P < 0.05, **P <
0.005, ***P < 0.0005, ns, not significant, two-tailed Student’s t-test. See Supplementary
Table 4 for statistics source data including precise P values.
Liu et al. Page 35
Nat Cell Biol. Author manuscript; available in PMC 2019 July 21.
Author M
anuscriptA
uthor Manuscript
Author M
anuscriptA
uthor Manuscript