Embed Size (px)
Citation preview
American Institute of Aeronautics and Astronautics
1
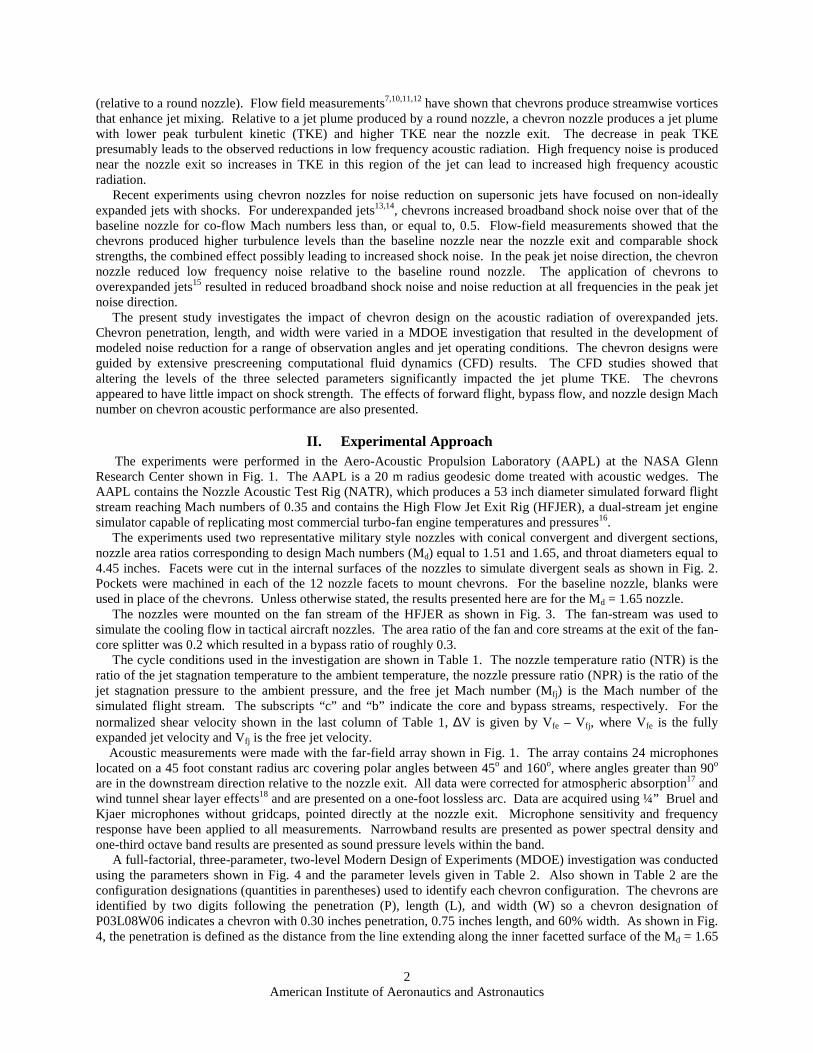
An MDOE Investigation of Chevrons for Supersonic Jet Noise Reduction
Brenda Henderson* and James Bridges† NASA Glenn Research Center, Cleveland, OH
The impact of chevron design on the noise radiated from heated, overexpanded, supersonic jets is presented. The experiments used faceted bi-conic convergent-divergent nozzles with design Mach numbers equal to 1.51 and 1.65. The purpose of the facets was to simulate divergent seals on a military style nozzle. The nozzle throat diameter was equal to 4.5 inches. Modern Design of Experiment (MDOE) techniques were used to investigate the impact of chevron penetration, length, and width on the resulting acoustic radiation. All chevron configurations used 12 chevrons to match the number of facets in the nozzle. Most chevron designs resulted in increased broadband shock noise relative to the baseline nozzle. In the peak jet noise direction, the optimum chevron design reduced peak sound pressure levels by 4 dB relative to the baseline nozzle. The penetration was the parameter having the greatest impact on radiated noise at all observation angles. While increasing chevron penetration decreased acoustic radiation in the peak jet noise direction, broadband shock noise was adversely impacted. Decreasing chevron length increased noise at most observation angles. The impact of chevron width on radiated noise depended on frequency and observation angle.
I. Introduction He application of chevrons (serrations applied to a nozzle trailing edge that protrude into the exhausting flow) to military aircraft is particularly attractive because existing engines can be retrofitted rather than redesigned to
incorporate these devices. At takeoff, high performance tactical aircraft typically have overexpanded, supersonic jet-exhausts that contain noise sources not present in the subsonic exhausts of commercial aircraft engines. As a result, chevrons that have been optimized for noise reduction in commercial aircraft may not perform adequately on tactical aircraft. While a reasonably large number of investigations have studied the impact of chevrons on subsonic jets, similar studies for supersonic flows are limited. The present investigation uses a Modern Design of Experiments (MDOE) approach to explore the impact of chevron design on the acoustic radiation of overexpanded supersonic jets. An overexpanded jet resulting from operating a convergent-divergent nozzle at a stagnation pressure below that corresponding to the nozzle design Mach number contains a quasi-periodic shock cell structure that can persist for several diameters downstream of the nozzle exit. The constructive interference of sound waves produced by the interaction of large-scale jet disturbances with the shock waves within the shock cell structure results in broadband shock noise1,2,3. Shock noise can dominate the acoustic spectra at upstream and broadside observation angles relative to the nozzle exit. Additionally, mixing noise sources are present and are associated with large scale jet disturbances (radiating in the downstream direction) that become very effective noise sources when their phase speeds (relative to the ambient speed of sound) become supersonic4
, and with fine scale turbulence5 (radiating in the upstream direction). Mixing noise sources are also present in subsonic jets but the large-scale disturbances typically have subsonic phase speeds. In subsonic jets, properly designed chevron nozzles produce lower overall acoustic radiation levels than those of a corresponding round nozzle6,7,8,9. Experiments have shown that increasing chevron penetration decreases low frequency noise and often increases high frequency noise (sometimes referred to as high frequency crossover). The number of chevrons also impacts the acoustic radiation but not as significantly as the penetration. Jet shear velocity (the velocity difference between the inner and outer jet streams) impacts chevron acoustic performance with increases in shear velocity increasing low frequency noise reduction but sometimes increasing high frequency noise * Researcher, Acoustics Branch, MS 54-3, 21000 Brookpark Rd., Cleveland, OH 44135. † Reseacher, Acoustics Branch, MS 54-3, 21000 Brookpark Rd., Cleveland, OH 44135, Associate Fellow.
T
16th AIAA/CEAS Aeroacoustics Conference AIAA 2010-3926
This material is declared a work of the U.S. Government and is not subject to copyright protection in the United States.
https://ntrs.nasa.gov/search.jsp?R=20110016032 2018-06-14T10:15:25+00:00Z
American Institute of Aeronautics and Astronautics
2
(relative to a round nozzle). Flow field measurements7,10,11,12 have shown that chevrons produce streamwise vortices that enhance jet mixing. Relative to a jet plume produced by a round nozzle, a chevron nozzle produces a jet plume with lower peak turbulent kinetic (TKE) and higher TKE near the nozzle exit. The decrease in peak TKE presumably leads to the observed reductions in low frequency acoustic radiation. High frequency noise is produced near the nozzle exit so increases in TKE in this region of the jet can lead to increased high frequency acoustic radiation. Recent experiments using chevron nozzles for noise reduction on supersonic jets have focused on non-ideally expanded jets with shocks. For underexpanded jets13,14, chevrons increased broadband shock noise over that of the baseline nozzle for co-flow Mach numbers less than, or equal to, 0.5. Flow-field measurements showed that the chevrons produced higher turbulence levels than the baseline nozzle near the nozzle exit and comparable shock strengths, the combined effect possibly leading to increased shock noise. In the peak jet noise direction, the chevron nozzle reduced low frequency noise relative to the baseline round nozzle. The application of chevrons to overexpanded jets15 resulted in reduced broadband shock noise and noise reduction at all frequencies in the peak jet noise direction. The present study investigates the impact of chevron design on the acoustic radiation of overexpanded jets. Chevron penetration, length, and width were varied in a MDOE investigation that resulted in the development of modeled noise reduction for a range of observation angles and jet operating conditions. The chevron designs were guided by extensive prescreening computational fluid dynamics (CFD) results. The CFD studies showed that altering the levels of the three selected parameters significantly impacted the jet plume TKE. The chevrons appeared to have little impact on shock strength. The effects of forward flight, bypass flow, and nozzle design Mach number on chevron acoustic performance are also presented.
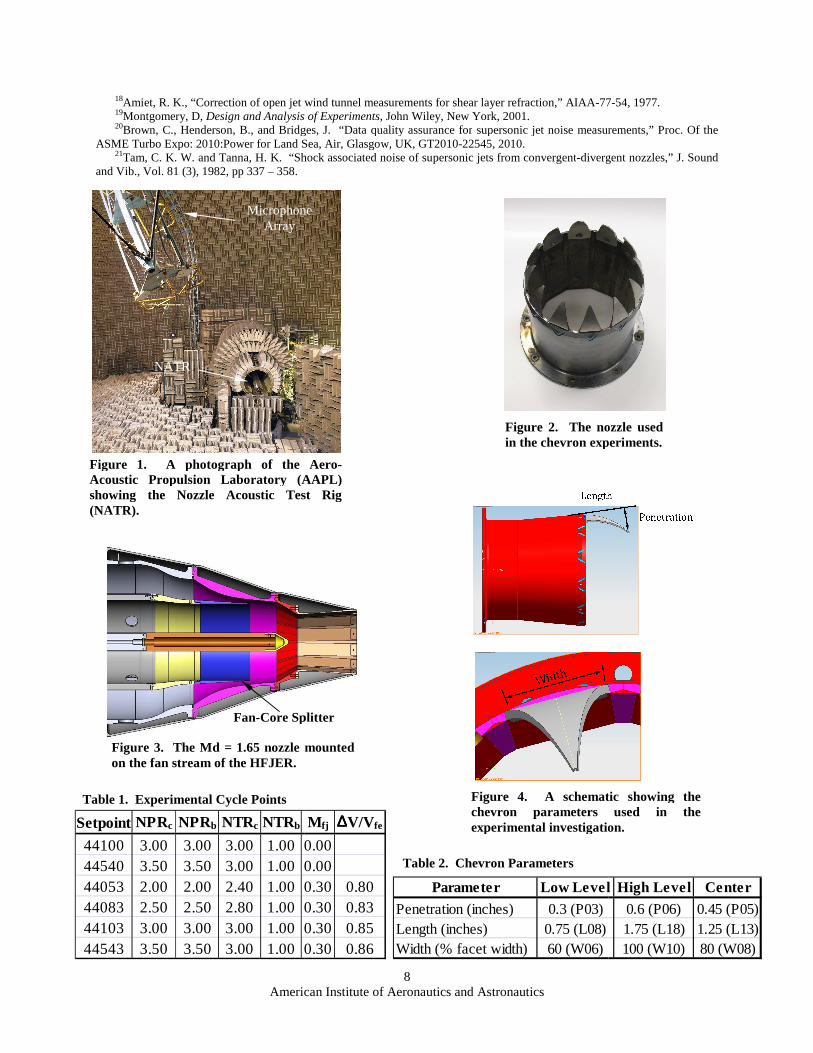
II. Experimental Approach The experiments were performed in the Aero-Acoustic Propulsion Laboratory (AAPL) at the NASA Glenn
Research Center shown in Fig. 1. The AAPL is a 20 m radius geodesic dome treated with acoustic wedges. The AAPL contains the Nozzle Acoustic Test Rig (NATR), which produces a 53 inch diameter simulated forward flight stream reaching Mach numbers of 0.35 and contains the High Flow Jet Exit Rig (HFJER), a dual-stream jet engine simulator capable of replicating most commercial turbo-fan engine temperatures and pressures16. The experiments used two representative military style nozzles with conical convergent and divergent sections, nozzle area ratios corresponding to design Mach numbers (Md) equal to 1.51 and 1.65, and throat diameters equal to 4.45 inches. Facets were cut in the internal surfaces of the nozzles to simulate divergent seals as shown in Fig. 2. Pockets were machined in each of the 12 nozzle facets to mount chevrons. For the baseline nozzle, blanks were used in place of the chevrons. Unless otherwise stated, the results presented here are for the Md = 1.65 nozzle. The nozzles were mounted on the fan stream of the HFJER as shown in Fig. 3. The fan-stream was used to simulate the cooling flow in tactical aircraft nozzles. The area ratio of the fan and core streams at the exit of the fan-core splitter was 0.2 which resulted in a bypass ratio of roughly 0.3. The cycle conditions used in the investigation are shown in Table 1. The nozzle temperature ratio (NTR) is the ratio of the jet stagnation temperature to the ambient temperature, the nozzle pressure ratio (NPR) is the ratio of the jet stagnation pressure to the ambient pressure, and the free jet Mach number (Mfj) is the Mach number of the simulated flight stream. The subscripts “c” and “b” indicate the core and bypass streams, respectively. For the normalized shear velocity shown in the last column of Table 1, ∆V is given by Vfe – Vfj, where Vfe is the fully expanded jet velocity and Vfj is the free jet velocity. Acoustic measurements were made with the far-field array shown in Fig. 1. The array contains 24 microphones located on a 45 foot constant radius arc covering polar angles between 45o and 160o, where angles greater than 90o are in the downstream direction relative to the nozzle exit. All data were corrected for atmospheric absorption17 and wind tunnel shear layer effects18 and are presented on a one-foot lossless arc. Data are acquired using ¼” Bruel and Kjaer microphones without gridcaps, pointed directly at the nozzle exit. Microphone sensitivity and frequency response have been applied to all measurements. Narrowband results are presented as power spectral density and one-third octave band results are presented as sound pressure levels within the band. A full-factorial, three-parameter, two-level Modern Design of Experiments (MDOE) investigation was conducted using the parameters shown in Fig. 4 and the parameter levels given in Table 2. Also shown in Table 2 are the configuration designations (quantities in parentheses) used to identify each chevron configuration. The chevrons are identified by two digits following the penetration (P), length (L), and width (W) so a chevron designation of P03L08W06 indicates a chevron with 0.30 inches penetration, 0.75 inches length, and 60% width. As shown in Fig. 4, the penetration is defined as the distance from the line extending along the inner facetted surface of the Md = 1.65
American Institute of Aeronautics and Astronautics
3
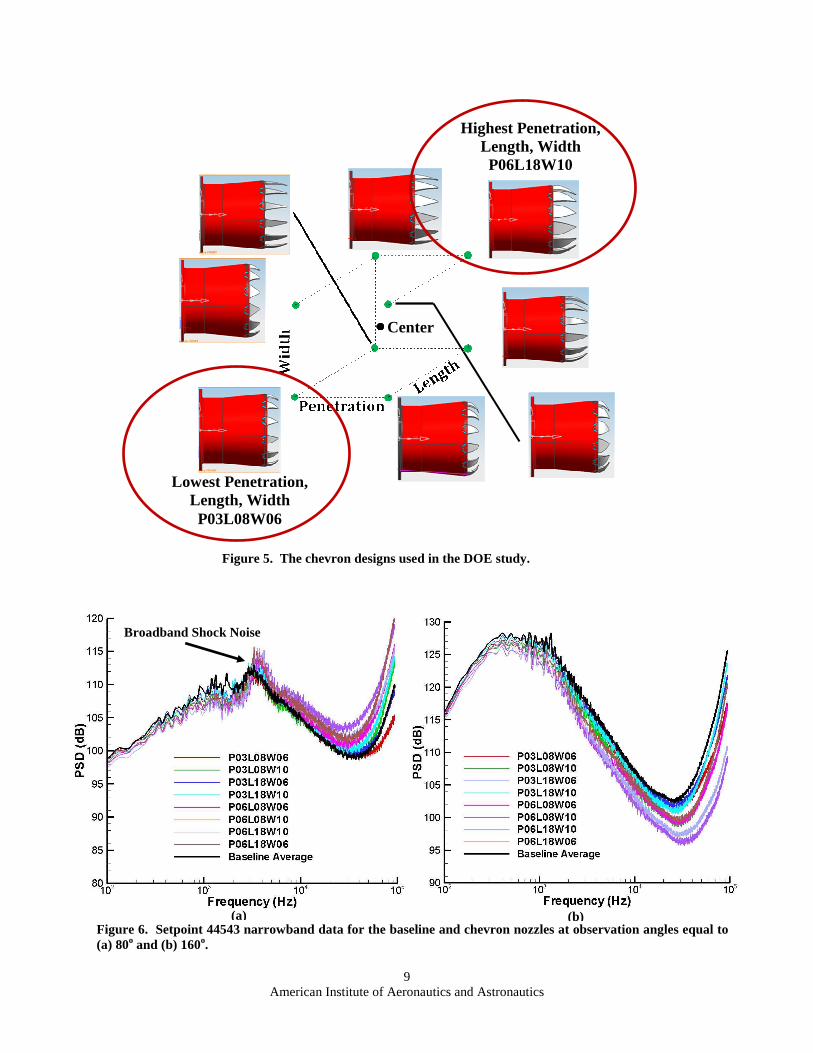
nozzle to the chevron tip. The length is defined as the distance from the nozzle trailing edge to the chevron tip parallel to the facet surface. Lastly, the width is equal to the chevron base width divided by the nozzle facet width and represented in percentage form. All configurations used 12 chevrons to match the number of facets in the nozzle. All combinations of the parameters were tested, resulting in the design space shown in Fig. 5. The chevrons shown in Fig. 5 are edge-point designs. A center point design (represented by the black dot in Fig. 5) was also tested and used to identify curvature in the resulting models, quantify error, and identify block effects (effects due to acquiring data on different days). The center chevron was tested two times during each data acquisition block (each night of testing) for a total of eight repeat acquisitions. Details of MDOE analysis are found in Montgomery19.
III. Results The impact of operating condition, forward flight, bypass flow, and the nozzle area ratio (nozzle design Mach
number) on the chevron acoustic performance will be presented first. These effects were not part of the MDOE analysis. For some of the experiments, only the center point chevron was used. The MDOE analysis will be presented in Section B. Only the chevron configuration order was randomized during the experiments so the jet operating condition was not a parameter in the MDOE analysis. Separate models were developed for each operating condition which means that applying the MDOE analysis to operating conditions not contained in Table 1 requires model interpolation.
A. Effect of Operating Condition, Forward Flight, Bypass Flow, and Nozzle Area Ratio on Chevron Acoustic Performance
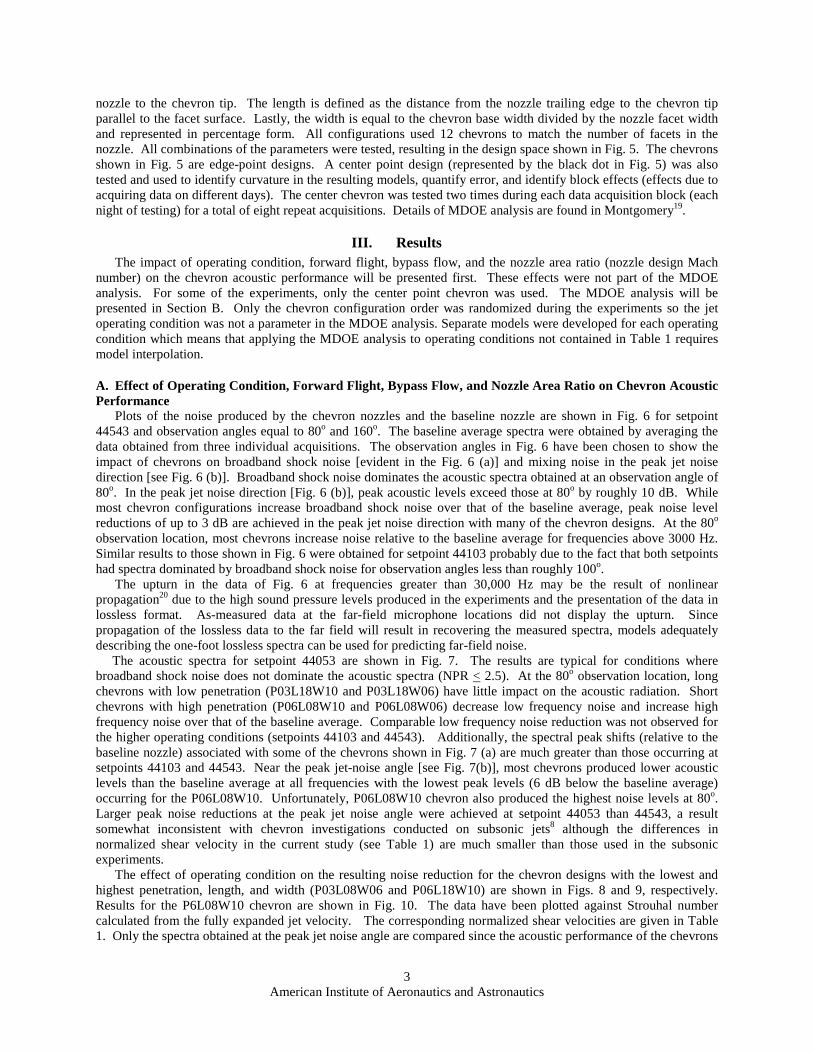
Plots of the noise produced by the chevron nozzles and the baseline nozzle are shown in Fig. 6 for setpoint 44543 and observation angles equal to 80o and 160o. The baseline average spectra were obtained by averaging the data obtained from three individual acquisitions. The observation angles in Fig. 6 have been chosen to show the impact of chevrons on broadband shock noise [evident in the Fig. 6 (a)] and mixing noise in the peak jet noise direction [see Fig. 6 (b)]. Broadband shock noise dominates the acoustic spectra obtained at an observation angle of 80o. In the peak jet noise direction [Fig. 6 (b)], peak acoustic levels exceed those at 80o by roughly 10 dB. While most chevron configurations increase broadband shock noise over that of the baseline average, peak noise level reductions of up to 3 dB are achieved in the peak jet noise direction with many of the chevron designs. At the 80o observation location, most chevrons increase noise relative to the baseline average for frequencies above 3000 Hz. Similar results to those shown in Fig. 6 were obtained for setpoint 44103 probably due to the fact that both setpoints had spectra dominated by broadband shock noise for observation angles less than roughly 100o.
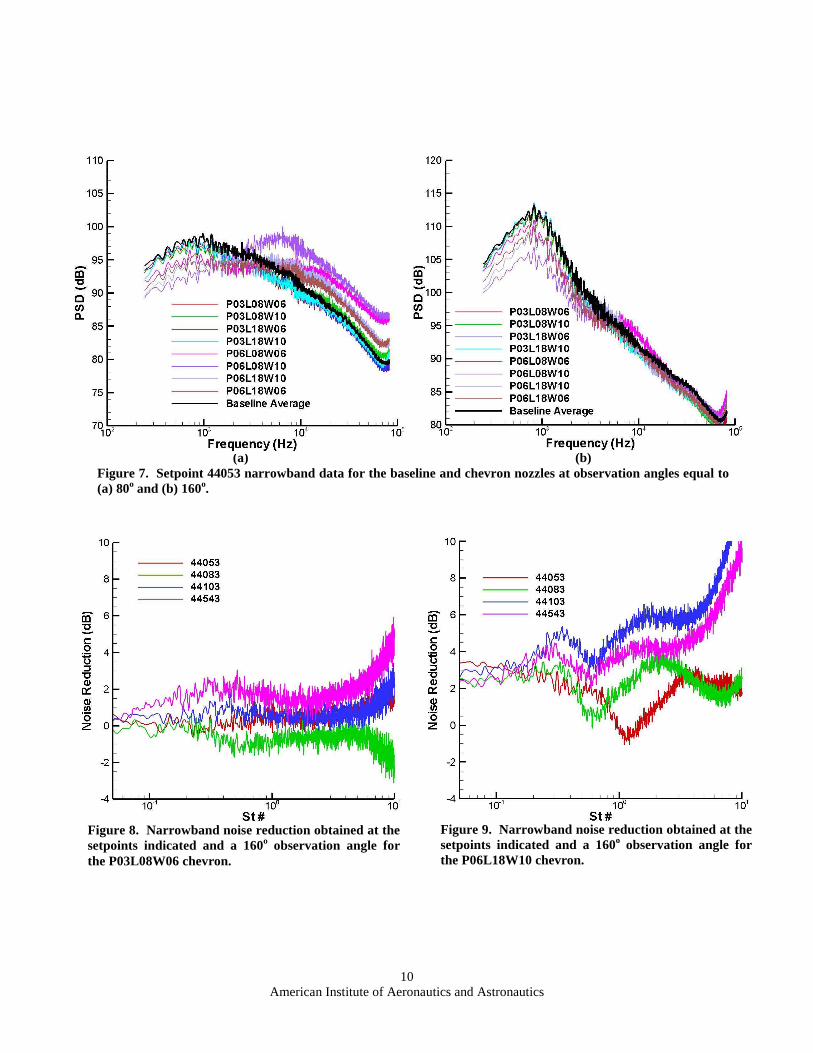
The upturn in the data of Fig. 6 at frequencies greater than 30,000 Hz may be the result of nonlinear propagation20 due to the high sound pressure levels produced in the experiments and the presentation of the data in lossless format. As-measured data at the far-field microphone locations did not display the upturn. Since propagation of the lossless data to the far field will result in recovering the measured spectra, models adequately describing the one-foot lossless spectra can be used for predicting far-field noise. The acoustic spectra for setpoint 44053 are shown in Fig. 7. The results are typical for conditions where broadband shock noise does not dominate the acoustic spectra (NPR < 2.5). At the 80o observation location, long chevrons with low penetration (P03L18W10 and P03L18W06) have little impact on the acoustic radiation. Short chevrons with high penetration (P06L08W10 and P06L08W06) decrease low frequency noise and increase high frequency noise over that of the baseline average. Comparable low frequency noise reduction was not observed for the higher operating conditions (setpoints 44103 and 44543). Additionally, the spectral peak shifts (relative to the baseline nozzle) associated with some of the chevrons shown in Fig. 7 (a) are much greater than those occurring at setpoints 44103 and 44543. Near the peak jet-noise angle [see Fig. 7(b)], most chevrons produced lower acoustic levels than the baseline average at all frequencies with the lowest peak levels (6 dB below the baseline average) occurring for the P06L08W10. Unfortunately, P06L08W10 chevron also produced the highest noise levels at 80o. Larger peak noise reductions at the peak jet noise angle were achieved at setpoint 44053 than 44543, a result somewhat inconsistent with chevron investigations conducted on subsonic jets8 although the differences in normalized shear velocity in the current study (see Table 1) are much smaller than those used in the subsonic experiments.
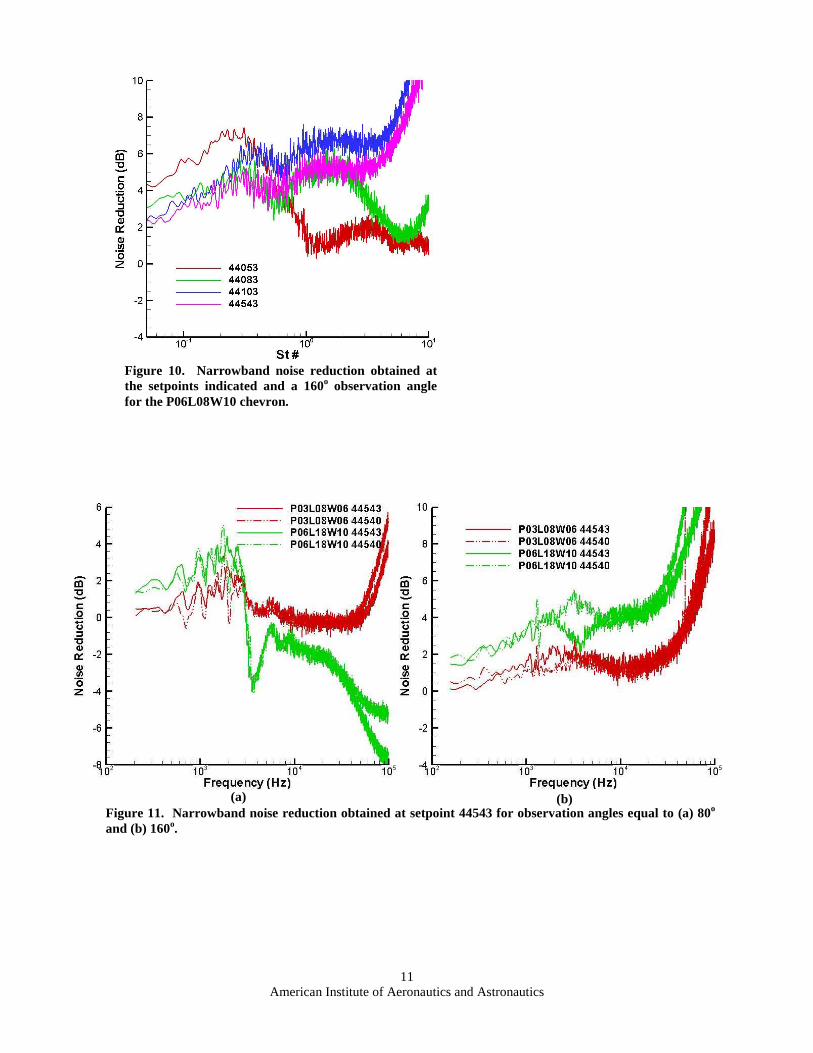
The effect of operating condition on the resulting noise reduction for the chevron designs with the lowest and highest penetration, length, and width (P03L08W06 and P06L18W10) are shown in Figs. 8 and 9, respectively. Results for the P6L08W10 chevron are shown in Fig. 10. The data have been plotted against Strouhal number calculated from the fully expanded jet velocity. The corresponding normalized shear velocities are given in Table 1. Only the spectra obtained at the peak jet noise angle are compared since the acoustic performance of the chevrons
American Institute of Aeronautics and Astronautics
4
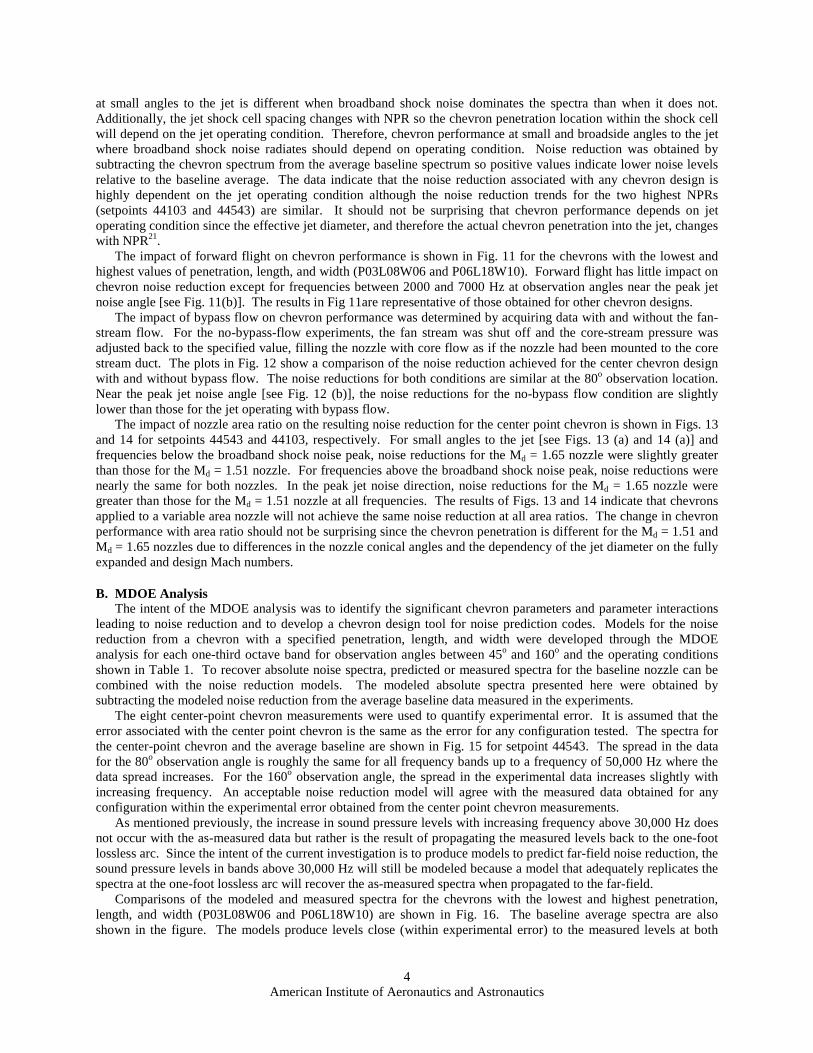
at small angles to the jet is different when broadband shock noise dominates the spectra than when it does not. Additionally, the jet shock cell spacing changes with NPR so the chevron penetration location within the shock cell will depend on the jet operating condition. Therefore, chevron performance at small and broadside angles to the jet where broadband shock noise radiates should depend on operating condition. Noise reduction was obtained by subtracting the chevron spectrum from the average baseline spectrum so positive values indicate lower noise levels relative to the baseline average. The data indicate that the noise reduction associated with any chevron design is highly dependent on the jet operating condition although the noise reduction trends for the two highest NPRs (setpoints 44103 and 44543) are similar. It should not be surprising that chevron performance depends on jet operating condition since the effective jet diameter, and therefore the actual chevron penetration into the jet, changes with NPR21.
The impact of forward flight on chevron performance is shown in Fig. 11 for the chevrons with the lowest and highest values of penetration, length, and width (P03L08W06 and P06L18W10). Forward flight has little impact on chevron noise reduction except for frequencies between 2000 and 7000 Hz at observation angles near the peak jet noise angle [see Fig. 11(b)]. The results in Fig 11are representative of those obtained for other chevron designs.
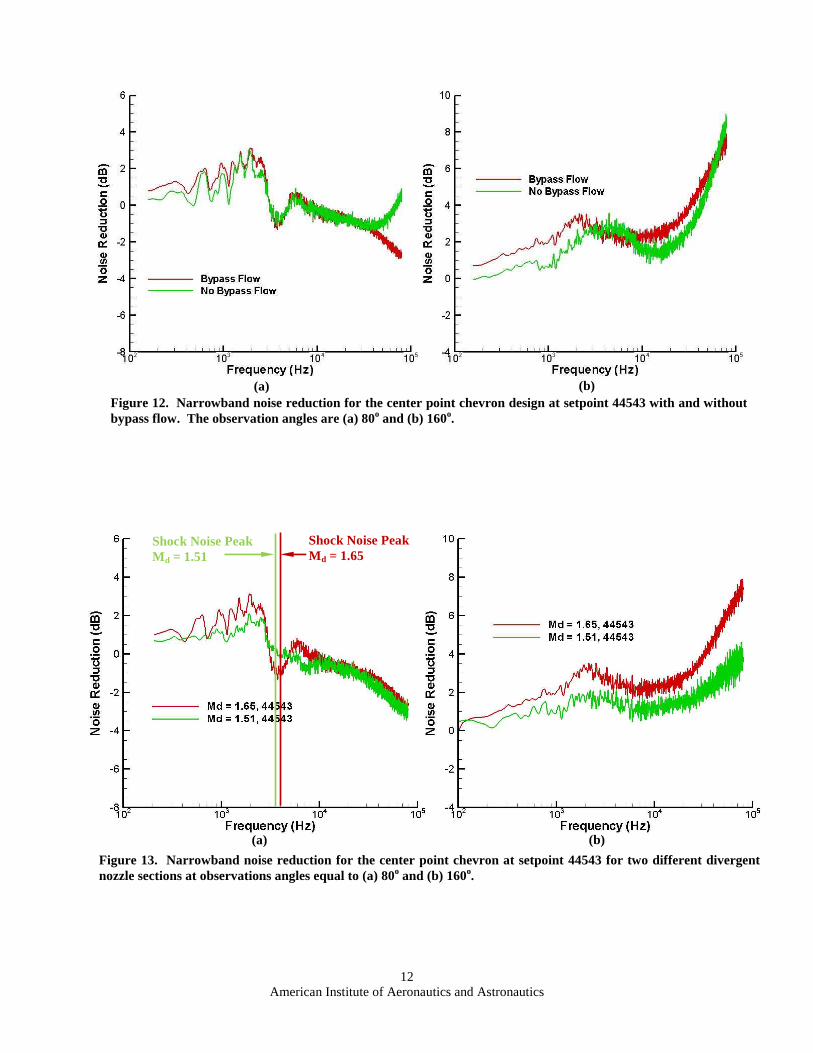
The impact of bypass flow on chevron performance was determined by acquiring data with and without the fan-stream flow. For the no-bypass-flow experiments, the fan stream was shut off and the core-stream pressure was adjusted back to the specified value, filling the nozzle with core flow as if the nozzle had been mounted to the core stream duct. The plots in Fig. 12 show a comparison of the noise reduction achieved for the center chevron design with and without bypass flow. The noise reductions for both conditions are similar at the 80o observation location. Near the peak jet noise angle [see Fig. 12 (b)], the noise reductions for the no-bypass flow condition are slightly lower than those for the jet operating with bypass flow.
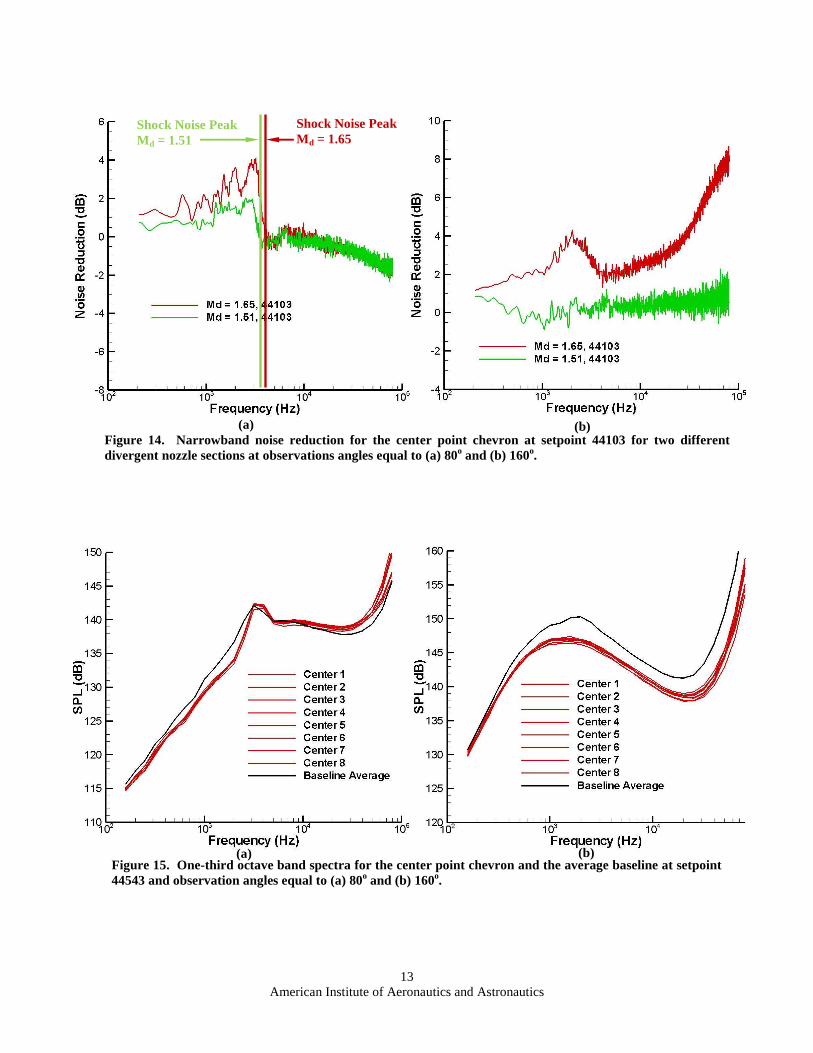
The impact of nozzle area ratio on the resulting noise reduction for the center point chevron is shown in Figs. 13 and 14 for setpoints 44543 and 44103, respectively. For small angles to the jet [see Figs. 13 (a) and 14 (a)] and frequencies below the broadband shock noise peak, noise reductions for the Md = 1.65 nozzle were slightly greater than those for the Md = 1.51 nozzle. For frequencies above the broadband shock noise peak, noise reductions were nearly the same for both nozzles. In the peak jet noise direction, noise reductions for the Md = 1.65 nozzle were greater than those for the Md = 1.51 nozzle at all frequencies. The results of Figs. 13 and 14 indicate that chevrons applied to a variable area nozzle will not achieve the same noise reduction at all area ratios. The change in chevron performance with area ratio should not be surprising since the chevron penetration is different for the Md = 1.51 and Md = 1.65 nozzles due to differences in the nozzle conical angles and the dependency of the jet diameter on the fully expanded and design Mach numbers.
B. MDOE Analysis The intent of the MDOE analysis was to identify the significant chevron parameters and parameter interactions
leading to noise reduction and to develop a chevron design tool for noise prediction codes. Models for the noise reduction from a chevron with a specified penetration, length, and width were developed through the MDOE analysis for each one-third octave band for observation angles between 45o and 160o and the operating conditions shown in Table 1. To recover absolute noise spectra, predicted or measured spectra for the baseline nozzle can be combined with the noise reduction models. The modeled absolute spectra presented here were obtained by subtracting the modeled noise reduction from the average baseline data measured in the experiments.
The eight center-point chevron measurements were used to quantify experimental error. It is assumed that the error associated with the center point chevron is the same as the error for any configuration tested. The spectra for the center-point chevron and the average baseline are shown in Fig. 15 for setpoint 44543. The spread in the data for the 80o observation angle is roughly the same for all frequency bands up to a frequency of 50,000 Hz where the data spread increases. For the 160o observation angle, the spread in the experimental data increases slightly with increasing frequency. An acceptable noise reduction model will agree with the measured data obtained for any configuration within the experimental error obtained from the center point chevron measurements.
As mentioned previously, the increase in sound pressure levels with increasing frequency above 30,000 Hz does not occur with the as-measured data but rather is the result of propagating the measured levels back to the one-foot lossless arc. Since the intent of the current investigation is to produce models to predict far-field noise reduction, the sound pressure levels in bands above 30,000 Hz will still be modeled because a model that adequately replicates the spectra at the one-foot lossless arc will recover the as-measured spectra when propagated to the far-field.
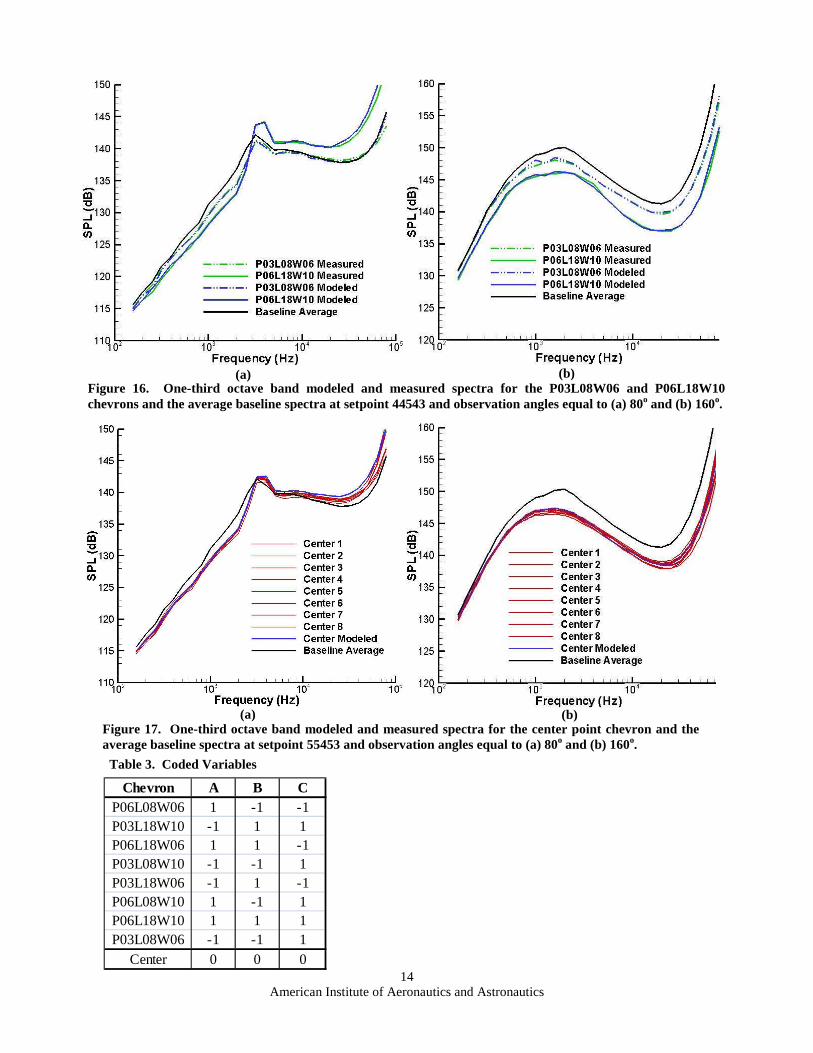
Comparisons of the modeled and measured spectra for the chevrons with the lowest and highest penetration, length, and width (P03L08W06 and P06L18W10) are shown in Fig. 16. The baseline average spectra are also shown in the figure. The models produce levels close (within experimental error) to the measured levels at both
American Institute of Aeronautics and Astronautics
5
observation angles and in all frequency bands. The results in Fig. 16 are similar to those obtained at other observation angles and for other edge point chevron configurations.
In addition to quantifying error, the center point chevron measurements are used to identify curvature. If curvature does not exist, the modeled spectra will agree (within experimental error) with measured spectra for the center point chevron. While the center point chevron can be used to identify curvature, quantifying curvature requires testing additional chevron configurations and is not a part of the experiments described here. If a model has curvature, the predicted acoustic spectra for chevron designs falling within the box in Fig. 5 will not agree with measured data.
The measured and modeled spectra for the center point chevron as well as the baseline average spectra are shown in Fig. 17. For most one-third octave bands at the 80o observation angle, the model produces slightly higher levels than the measured data indicating curvature. For the peak jet noise direction [see Fig. 17 (b)], the modeled data falls within the measured data for most one-third octave bands. Curvature was identified in most models developed for small and broadside angles to the jet. The model obtained from the MDOE analysis uses the equation
������ ���� ��� � � ��� � � ��� � � ���� � �� ���� � �� ���� � �� ����� � ���,
where �����is the noise reduction in the specified one-third octave band, CO are the coefficients determined from
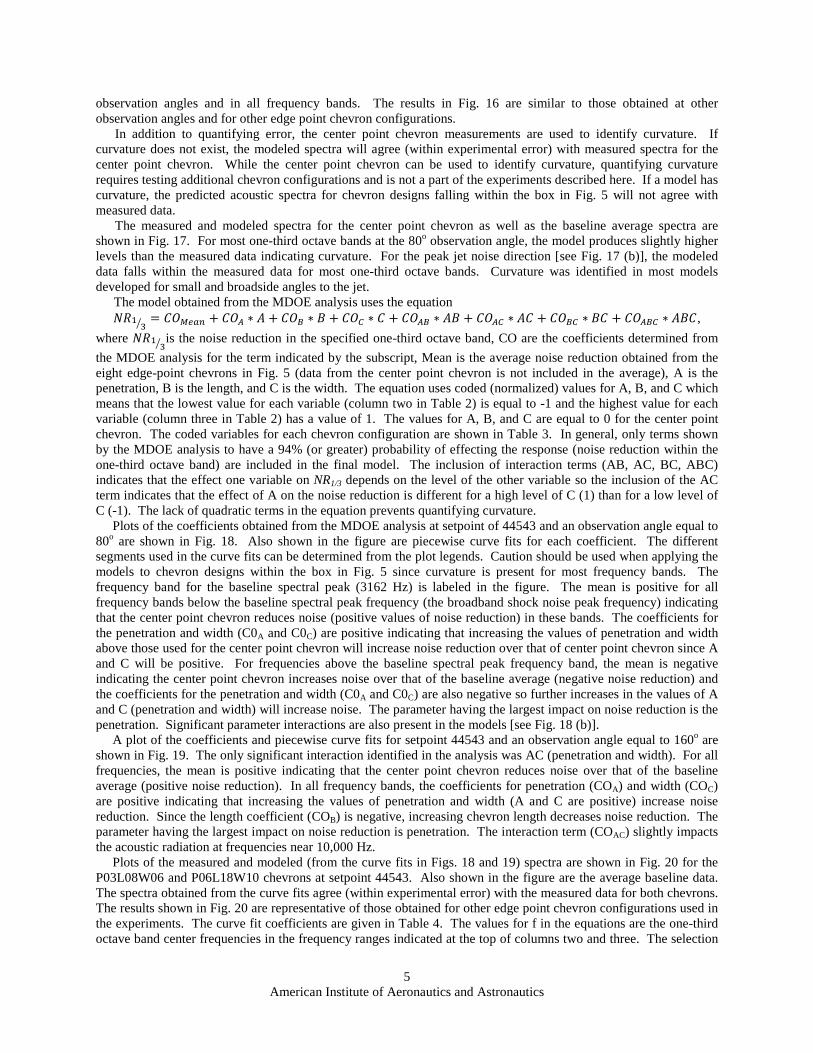
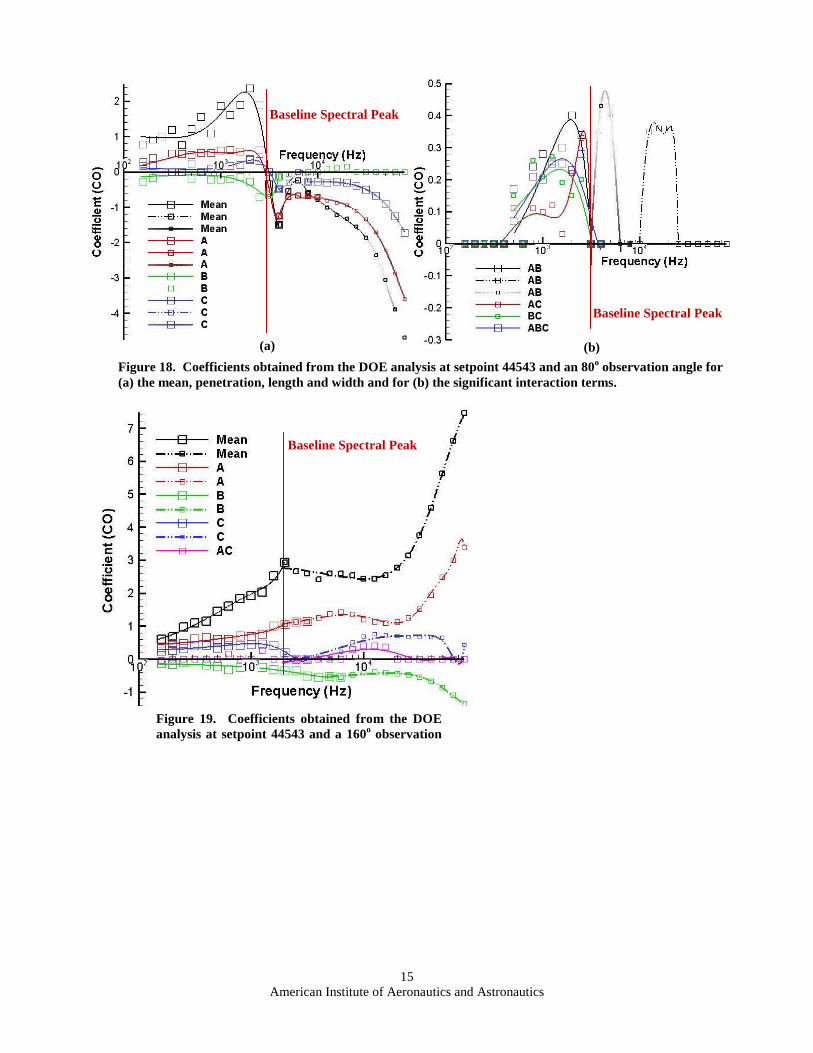
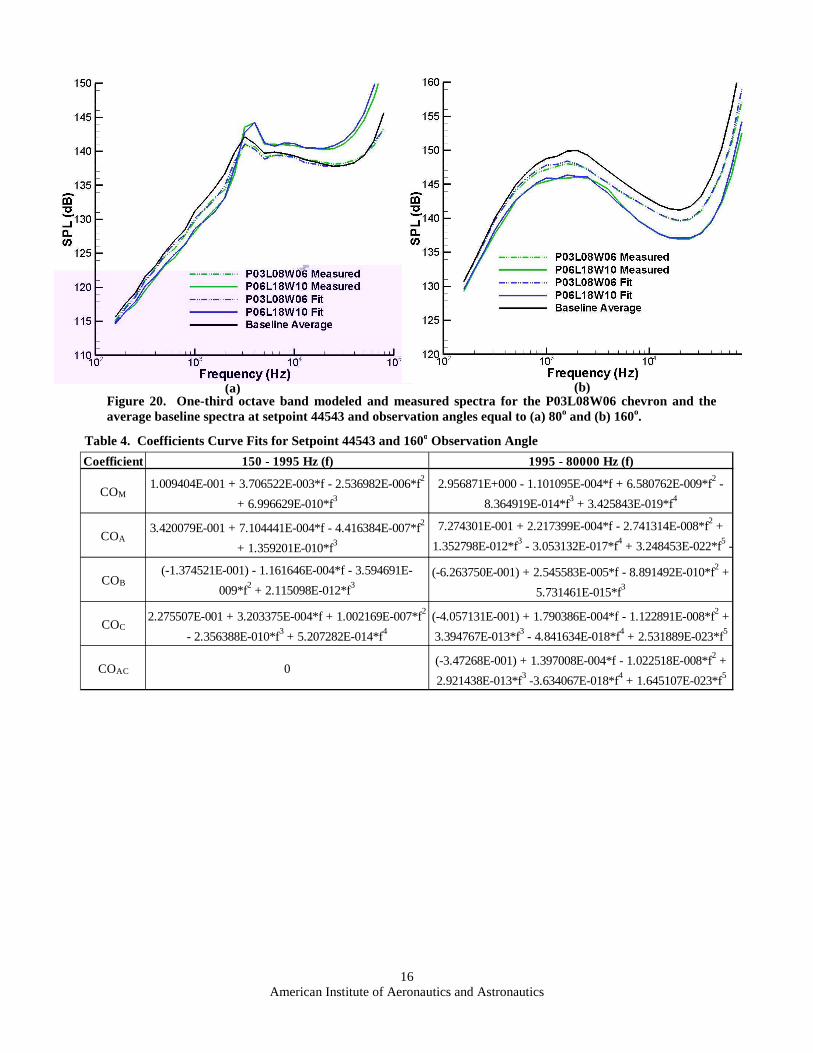
the MDOE analysis for the term indicated by the subscript, Mean is the average noise reduction obtained from the eight edge-point chevrons in Fig. 5 (data from the center point chevron is not included in the average), A is the penetration, B is the length, and C is the width. The equation uses coded (normalized) values for A, B, and C which means that the lowest value for each variable (column two in Table 2) is equal to -1 and the highest value for each variable (column three in Table 2) has a value of 1. The values for A, B, and C are equal to 0 for the center point chevron. The coded variables for each chevron configuration are shown in Table 3. In general, only terms shown by the MDOE analysis to have a 94% (or greater) probability of effecting the response (noise reduction within the one-third octave band) are included in the final model. The inclusion of interaction terms (AB, AC, BC, ABC) indicates that the effect one variable on NR1/3 depends on the level of the other variable so the inclusion of the AC term indicates that the effect of A on the noise reduction is different for a high level of C (1) than for a low level of C (-1). The lack of quadratic terms in the equation prevents quantifying curvature. Plots of the coefficients obtained from the MDOE analysis at setpoint of 44543 and an observation angle equal to 80o are shown in Fig. 18. Also shown in the figure are piecewise curve fits for each coefficient. The different segments used in the curve fits can be determined from the plot legends. Caution should be used when applying the models to chevron designs within the box in Fig. 5 since curvature is present for most frequency bands. The frequency band for the baseline spectral peak (3162 Hz) is labeled in the figure. The mean is positive for all frequency bands below the baseline spectral peak frequency (the broadband shock noise peak frequency) indicating that the center point chevron reduces noise (positive values of noise reduction) in these bands. The coefficients for the penetration and width (C0A and C0C) are positive indicating that increasing the values of penetration and width above those used for the center point chevron will increase noise reduction over that of center point chevron since A and C will be positive. For frequencies above the baseline spectral peak frequency band, the mean is negative indicating the center point chevron increases noise over that of the baseline average (negative noise reduction) and the coefficients for the penetration and width (C0A and C0C) are also negative so further increases in the values of A and C (penetration and width) will increase noise. The parameter having the largest impact on noise reduction is the penetration. Significant parameter interactions are also present in the models [see Fig. 18 (b)]. A plot of the coefficients and piecewise curve fits for setpoint 44543 and an observation angle equal to 160o are shown in Fig. 19. The only significant interaction identified in the analysis was AC (penetration and width). For all frequencies, the mean is positive indicating that the center point chevron reduces noise over that of the baseline average (positive noise reduction). In all frequency bands, the coefficients for penetration (COA) and width (COC) are positive indicating that increasing the values of penetration and width (A and C are positive) increase noise reduction. Since the length coefficient (COB) is negative, increasing chevron length decreases noise reduction. The parameter having the largest impact on noise reduction is penetration. The interaction term (COAC) slightly impacts the acoustic radiation at frequencies near 10,000 Hz. Plots of the measured and modeled (from the curve fits in Figs. 18 and 19) spectra are shown in Fig. 20 for the P03L08W06 and P06L18W10 chevrons at setpoint 44543. Also shown in the figure are the average baseline data. The spectra obtained from the curve fits agree (within experimental error) with the measured data for both chevrons. The results shown in Fig. 20 are representative of those obtained for other edge point chevron configurations used in the experiments. The curve fit coefficients are given in Table 4. The values for f in the equations are the one-third octave band center frequencies in the frequency ranges indicated at the top of columns two and three. The selection
American Institute of Aeronautics and Astronautics
6
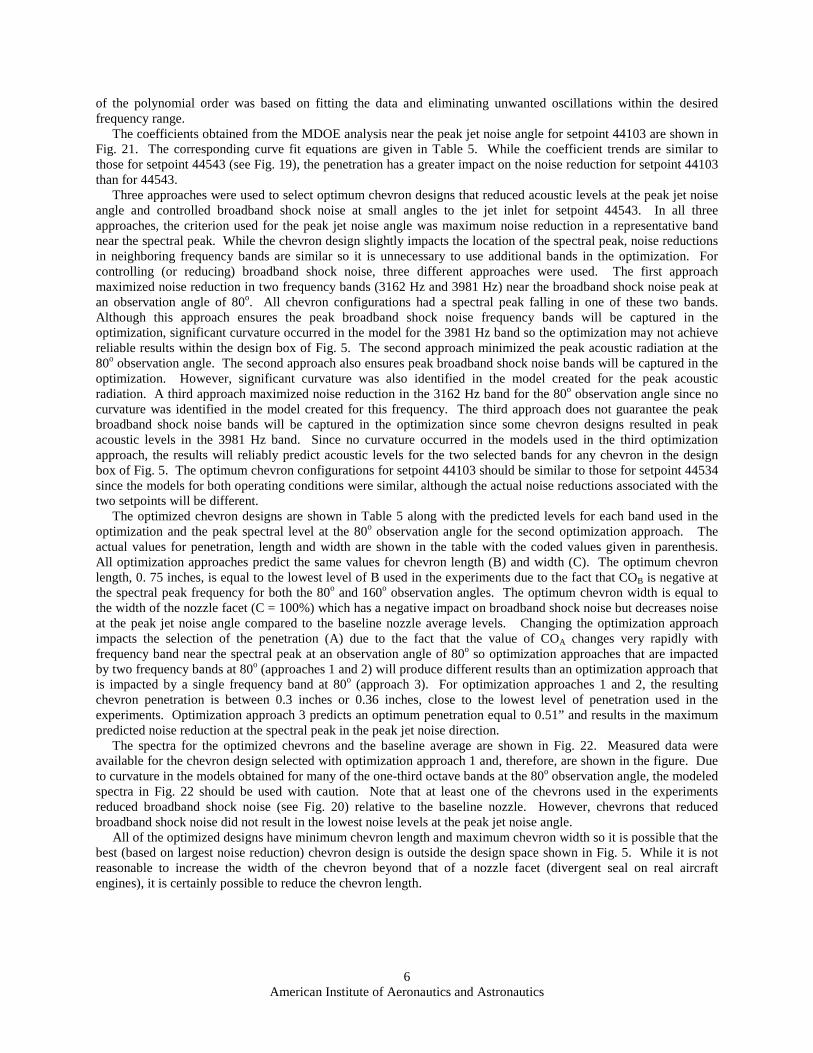
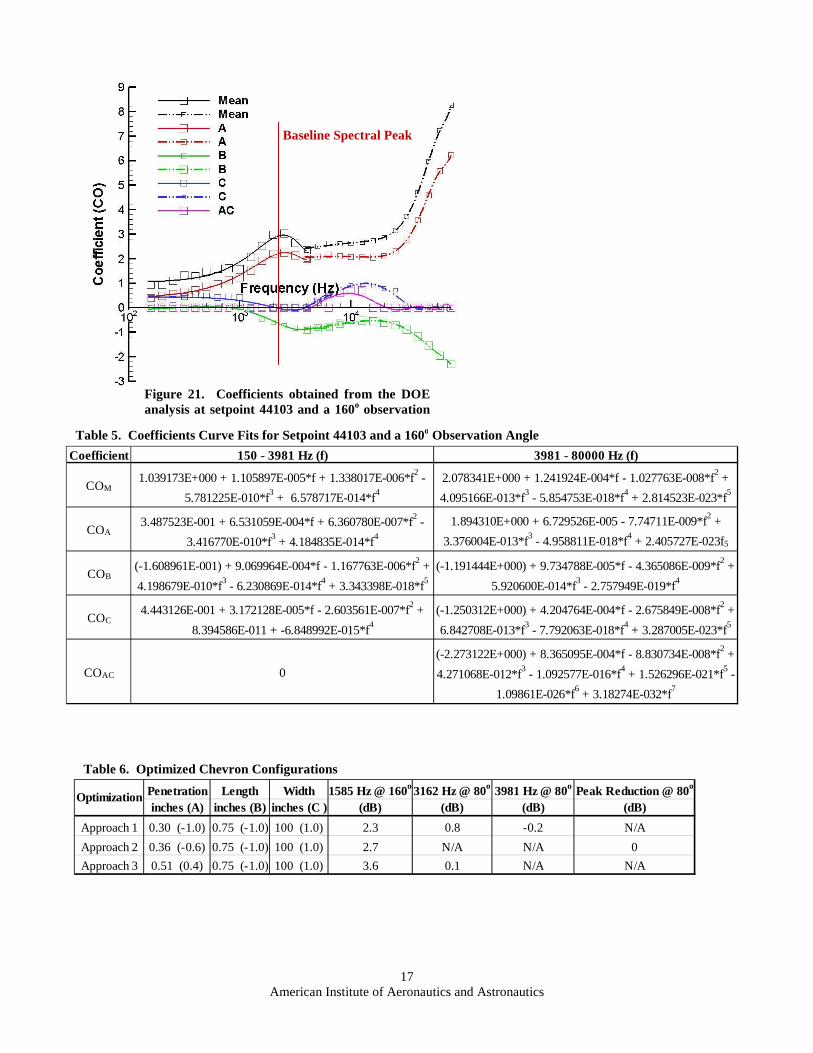
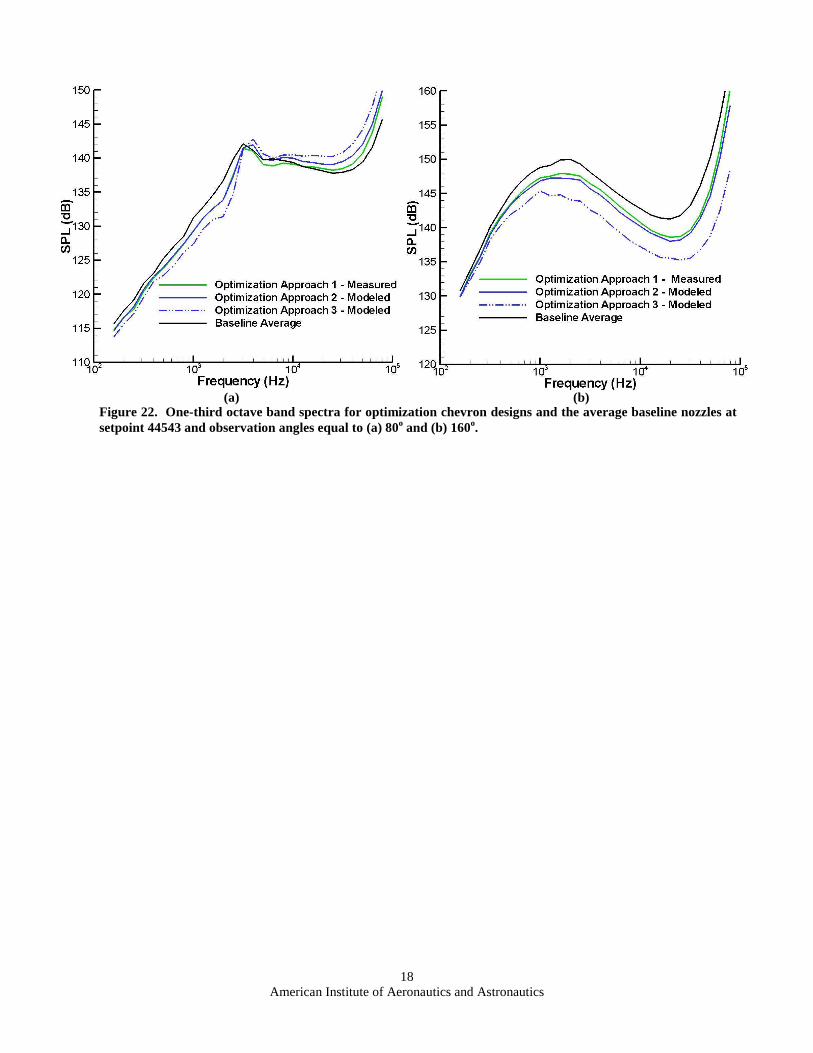
of the polynomial order was based on fitting the data and eliminating unwanted oscillations within the desired frequency range. The coefficients obtained from the MDOE analysis near the peak jet noise angle for setpoint 44103 are shown in Fig. 21. The corresponding curve fit equations are given in Table 5. While the coefficient trends are similar to those for setpoint 44543 (see Fig. 19), the penetration has a greater impact on the noise reduction for setpoint 44103 than for 44543. Three approaches were used to select optimum chevron designs that reduced acoustic levels at the peak jet noise angle and controlled broadband shock noise at small angles to the jet inlet for setpoint 44543. In all three approaches, the criterion used for the peak jet noise angle was maximum noise reduction in a representative band near the spectral peak. While the chevron design slightly impacts the location of the spectral peak, noise reductions in neighboring frequency bands are similar so it is unnecessary to use additional bands in the optimization. For controlling (or reducing) broadband shock noise, three different approaches were used. The first approach maximized noise reduction in two frequency bands (3162 Hz and 3981 Hz) near the broadband shock noise peak at an observation angle of 80o. All chevron configurations had a spectral peak falling in one of these two bands. Although this approach ensures the peak broadband shock noise frequency bands will be captured in the optimization, significant curvature occurred in the model for the 3981 Hz band so the optimization may not achieve reliable results within the design box of Fig. 5. The second approach minimized the peak acoustic radiation at the 80o observation angle. The second approach also ensures peak broadband shock noise bands will be captured in the optimization. However, significant curvature was also identified in the model created for the peak acoustic radiation. A third approach maximized noise reduction in the 3162 Hz band for the 80o observation angle since no curvature was identified in the model created for this frequency. The third approach does not guarantee the peak broadband shock noise bands will be captured in the optimization since some chevron designs resulted in peak acoustic levels in the 3981 Hz band. Since no curvature occurred in the models used in the third optimization approach, the results will reliably predict acoustic levels for the two selected bands for any chevron in the design box of Fig. 5. The optimum chevron configurations for setpoint 44103 should be similar to those for setpoint 44534 since the models for both operating conditions were similar, although the actual noise reductions associated with the two setpoints will be different. The optimized chevron designs are shown in Table 5 along with the predicted levels for each band used in the optimization and the peak spectral level at the 80o observation angle for the second optimization approach. The actual values for penetration, length and width are shown in the table with the coded values given in parenthesis. All optimization approaches predict the same values for chevron length (B) and width (C). The optimum chevron length, 0. 75 inches, is equal to the lowest level of B used in the experiments due to the fact that COB is negative at the spectral peak frequency for both the 80o and 160o observation angles. The optimum chevron width is equal to the width of the nozzle facet (C = 100%) which has a negative impact on broadband shock noise but decreases noise at the peak jet noise angle compared to the baseline nozzle average levels. Changing the optimization approach impacts the selection of the penetration (A) due to the fact that the value of COA changes very rapidly with frequency band near the spectral peak at an observation angle of 80o so optimization approaches that are impacted by two frequency bands at 80o (approaches 1 and 2) will produce different results than an optimization approach that is impacted by a single frequency band at 80o (approach 3). For optimization approaches 1 and 2, the resulting chevron penetration is between 0.3 inches or 0.36 inches, close to the lowest level of penetration used in the experiments. Optimization approach 3 predicts an optimum penetration equal to 0.51” and results in the maximum predicted noise reduction at the spectral peak in the peak jet noise direction. The spectra for the optimized chevrons and the baseline average are shown in Fig. 22. Measured data were available for the chevron design selected with optimization approach 1 and, therefore, are shown in the figure. Due to curvature in the models obtained for many of the one-third octave bands at the 80o observation angle, the modeled spectra in Fig. 22 should be used with caution. Note that at least one of the chevrons used in the experiments reduced broadband shock noise (see Fig. 20) relative to the baseline nozzle. However, chevrons that reduced broadband shock noise did not result in the lowest noise levels at the peak jet noise angle. All of the optimized designs have minimum chevron length and maximum chevron width so it is possible that the best (based on largest noise reduction) chevron design is outside the design space shown in Fig. 5. While it is not reasonable to increase the width of the chevron beyond that of a nozzle facet (divergent seal on real aircraft engines), it is certainly possible to reduce the chevron length.
American Institute of Aeronautics and Astronautics
7
IV. Discussion and Conclusions Chevron acoustic performance was impacted by jet operating condition and nozzle design Mach number.
Forward flight Mach number had little impact on the noise reduction achieved with the chevrons. The presence of bypass flow slightly impacted noise reduction at the peak jet noise angle. Most chevron designs increased high frequency noise at small and broadside angles to the jet inlet axis. At the peak jet noise angle, reductions in peak spectral levels (relative to the baseline nozzle) were achieved with high penetration chevrons.
Models developed from the MDOE analysis showed that the chevron penetration had the greatest impact on the resulting acoustic spectra. Relative to the baseline acoustic levels, high penetration chevrons decreased noise at the peak jet noise angle and increased broadband shock noise while low levels of chevron length favorably impacted noise reduction at broadside angles and in the peak jet noise direction. The impact of chevron width on acoustic radiation depended on frequency and observation angle. Curvature was present for most frequency bands in the models obtained for small and broadside angles to jet inlet axis so additional experiments are required to quantify the noise reduction from chevrons at these angles. In the peak jet noise direction, no curvature was identified for most frequency bands so the models presented here will adequately predict the peak acoustic radiation for chevron configurations with penetration, length, and width falling within the limits of the chevrons tested.
Noise reductions presented here have been based on changes in noise radiation of the chevron nozzles relative to the same baseline (round) nozzle and, therefore, are not corrected for thrust losses although CFD results have shown differences in the thrust produced by the different chevron designs. Future work will focus on evaluating the chevrons on a “thrust corrected” basis where the baseline nozzle area (and corresponding spectra) will be corrected to produce the same thrust as that predicted from the CFD analysis for each chevron design.
Acknowledgments The authors thank the engineers and technicians in the AAPL for assisting with the experiments. The authors
also thank Franco Frate at the NASA Glenn Research Center for performing the prescreening CFD analysis. This work was supported by the Strategic Environmental Research and Development Program (Project Number WP-1583) and by the Supersonic Project in the Fundamental Aeronautics Program.
References 1Harper-Bourne, M. and Fisher, M., “The noise from shock waves in supersonic jets,” Proceedings of AGARD Conference on
Noise Mechanisms, AGARD, 1973. 2Tam, C., “Stochastic model theory of broadband shock associated noise from supersonic jets,” J.Sound and Vib., Vol. 116,
Pt. 2, 1987, pp. 265 - 302. 3Tam, C., “Stochastic model theory of broadband shock associated noise from supersonic jets in flight,” J .Sound and Vib.,
Vol. 151, Pt. 1, 1991, pp. 131-147. 4Laufer, J., Schlinker, R., and Kaplan, R. E. “Experiments on supersonic jet noise,” AIAA J., Vol. 14, No. 4, 1976, 489 –
497. 5Tam, C. K. W. “Jet Noise: Since 1952,” Theort. Comput. Fluid Dynamics, Vol. 10, 1998, pp. 393 – 405. 6Janardan, B. A., Hoff, G. E., Barter, J. W. Martens, S., and Gliebe, P. R. “AST Critical propulsion and noise reduction
technologies for future commercial subsonic engines,” NASA CR – 2000-210039, 2000. 7Bridges, J. and Brown, C. A. “Parametric testing of chevrons on single flow hot jets,” AIAA 2004-2824, 2004. 8Callender, B., Gutmark, E., and Martens, S. “Far-field acoustic investigation into chevron nozzle mechanisms and trends,”
AIAA J., Vol. 43, No. 1, 2005, 87 – 95. 9Callender, B., Gutmark, E., and Martens, S. “Near-field investigation of chevron nozzle mechanisms,” AIAA J., 46, No. 1,
2008. 10Alkislar, M. B., Krothapalli, A., and Butler, G. W. “The effect of streamwise vortices on the aeroacoustics of a Mach 0.9
jet,” J. Fluid Mech, Vol 578, 2007, pp. 139 – 169. 11Bridges, J., and Wernet, M. P. “Turbulence measurements of separate flow nozzles with mixing enhancement features,”
AIAA 2002-2484, 2002. 12Doty, M., Henderson , B., and Kinzie, K. W. “Turbulence measurements of separate-flow nozzles with pylon interaction
using particle image velocimetry,” AIAA J., Vol. 45, No. 6, 2007, pp. 1281 – 1289. 13Rask, O., Gutmark, E., and Martens, S. “Broadband shock associated noise suppression by chevrons,” AIAA 2006-009,
2006. 14Rask, O., Gutmark, E., and Martens, S. “Shock cell modification due to chevrons,” AIAA 2007-831, 2007. 15Martens, S. and Ludwig, H. “Jet noise reduction for high speed exhaust,” Proc. Of ASME Turbo Expo 2008: Power for
Land, Sea and Air, Berlin, Germany, GT2008-50455, 2008. 16Soeder, R. H., Wnuk, S. P., and Loew, R. “Aero-Acoustic Propulsion Laboratory Nozzle Acoustic Test Rig User Manual,”
NASA/TM – 2006-212939, 2006. 17ANSI S1.26-1995 (R2004), “Method for the Calculation of the Absorption of Sound by the Atmosphere”.
American Institute of Aeronautics and Astronautics
18Amiet, R. K., “Correction of open jet wind tunnel measurements for shear layer refraction,” AIAA19Montgomery, D, Design and Analysis of Experiments20Brown, C., Henderson, B., and Bridges, J. “Data quality assurance for
ASME Turbo Expo: 2010:Power for Land Sea, Air, Glasgo21Tam, C. K. W. and Tanna, H. K. “Shock associated noise of supersonic jets from convergent
and Vib., Vol. 81 (3), 1982, pp 337 – 358.
NATR
Microphone Array
Figure 1. A photograph of the AeroAcoustic Propulsion Laboratory (AAPL) showing the Nozzle Acoustic Test Rig (NATR).
Figure 3. The Md = 1.65 nozzle mounted on the fan stream of the HFJER.
Fan-Core Splitter
Setpoint NPRc NPRb NTRc NTRb
44100 3.00 3.00 3.00 1.000.0044540 3.50 3.50 3.00 1.000.0044053 2.00 2.00 2.40 1.000.3044083 2.50 2.50 2.80 1.000.3044103 3.00 3.00 3.00 1.000.3044543 3.50 3.50 3.00 1.000.30
Table 1. Experimental Cycle Points
American Institute of Aeronautics and Astronautics
8
R. K., “Correction of open jet wind tunnel measurements for shear layer refraction,” AIAA-77Design and Analysis of Experiments, John Wiley, New York, 2001.
Brown, C., Henderson, B., and Bridges, J. “Data quality assurance for supersonic jet noise measurements,” Proc. Of the Sea, Air, Glasgow, UK, GT2010-22545, 2010.
Tam, C. K. W. and Tanna, H. K. “Shock associated noise of supersonic jets from convergent-divergent nozzles,” J. Sound
Microphone
Figure 1. A photograph of the Aero-Acoustic Propulsion Laboratory (AAPL) showing the Nozzle Acoustic Test Rig
Figure 2. The nozzle used in the chevron experiments.
. The Md = 1.65 nozzle mounted
Core Splitter
Mfj ∆∆∆∆V/Vfe
0.000.000.30 0.800.30 0.830.30 0.850.30 0.86
Parameter Low Level
Penetration (inches) 0.3 (P03)Length (inches) 0.75 (L08)Width (% facet width) 60 (W06)
Table 2. Chevron Parameters
Figure 4. A schematic showing the chevron parameters used in the experimental investigation.
77-54, 1977.
supersonic jet noise measurements,” Proc. Of the
divergent nozzles,” J. Sound
. The nozzle used evron experiments.
Low Level High Level Center
0.6 (P06) 0.45 (P05)1.75 (L18) 1.25 (L13)100 (W10) 80 (W08)
. A schematic showing the chevron parameters used in the experimental investigation.
American Institute of Aeronautics and Astronautics
9
Figure 6. Setpoint 44543 narrowband data for the baseline and chevron nozzles at observation angles equal to (a) 80o and (b) 160o.
(a) (b)
Broadband Shock Noise
Figure 5. The chevron designs used in the DOE study.
Center
Highest Penetration, Length, Width
P06L18W10
Lowest Penetration, Length, Width
P03L08W06
American Institute of Aeronautics and Astronautics
10
Figure 7. Setpoint 44053 narrowband data for the baseline and chevron nozzles at observation angles equal to (a) 80o and (b) 160o.
(a) (b)
Figure 9. Narrowband noise reduction obtained at the setpoints indicated and a 160o observation angle for the P06L18W10 chevron.
Figure 8. Narrowband noise reduction obtained at the setpoints indicated and a 160o observation angle for the P03L08W06 chevron.
American Institute of Aeronautics and Astronautics
11
Figure 11. Narrowband noise reduction obtained at setpoint 44543 for observation angles equal to (a) 80o and (b) 160o.
(a) (b)
Figure 10. Narrowband noise reduction obtained at the setpoints indicated and a 160o observation angle for the P06L08W10 chevron.
American Institute of Aeronautics and Astronautics
12
Figure 12. Narrowband noise reduction for the center point chevron design at setpoint 44543 with and without bypass flow. The observation angles are (a) 80o and (b) 160o.
(a) (b)
Figure 13. Narrowband noise reduction for the center point chevron at setpoint 44543 for two different divergent nozzle sections at observations angles equal to (a) 80o and (b) 160o.
(a) (b)
Shock Noise Peak Md = 1.51
Shock Noise Peak Md = 1.65
American Institute of Aeronautics and Astronautics
13
Figure 15. One-third octave band spectra for the center point chevron and the average baseline at setpoint 44543 and observation angles equal to (a) 80o and (b) 160o.
(b) (a)
Figure 14. Narrowband noise reduction for the center point chevron at setpoint 44103 for two different divergent nozzle sections at observations angles equal to (a) 80o and (b) 160o.
(a) (b)
Shock Noise Peak Md = 1.51
Shock Noise Peak Md = 1.65
American Institute of Aeronautics and Astronautics
14
Figure 17. One-third octave band modeled and measured spectra for the center point chevron and the average baseline spectra at setpoint 55453 and observation angles equal to (a) 80o and (b) 160o.
(a) (b)
(a) (b) Figure 16. One-third octave band modeled and measured spectra for the P03L08W06 and P06L18W10 chevrons and the average baseline spectra at setpoint 44543 and observation angles equal to (a) 80o and (b) 160o.
Chevron A B CP06L08W06 1 -1 -1P03L18W10 -1 1 1P06L18W06 1 1 -1P03L08W10 -1 -1 1P03L18W06 -1 1 -1P06L08W10 1 -1 1P06L18W10 1 1 1P03L08W06 -1 -1 1
Center 0 0 0
Table 3. Coded Variables
American Institute of Aeronautics and Astronautics
15
Figure 19. Coefficients obtained from the DOE analysis at setpoint 44543 and a 160o observation angle.
Baseline Spectral Peak
Baseline Spectral Peak
Baseline Spectral Peak
Figure 18. Coefficients obtained from the DOE analysis at setpoint 44543 and an 80o observation angle for (a) the mean, penetration, length and width and for (b) the significant interaction terms.
(a) (b)
American Institute of Aeronautics and Astronautics
16
Figure 20. One-third octave band modeled and measured spectra for the P03L08W06 chevron and the average baseline spectra at setpoint 44543 and observation angles equal to (a) 80o and (b) 160o.
(a) (b)
Coefficient 150 - 1995 Hz (f) 1995 - 80000 Hz (f)
COM1.009404E-001 + 3.706522E-003*f - 2.536982E-006*f2
+ 6.996629E-010*f32.956871E+000 - 1.101095E-004*f + 6.580762E-009*f2 -
8.364919E-014*f3 + 3.425843E-019*f4
COA3.420079E-001 + 7.104441E-004*f - 4.416384E-007*f2
+ 1.359201E-010*f37.274301E-001 + 2.217399E-004*f - 2.741314E-008*f2 +
1.352798E-012*f3 - 3.053132E-017*f4 + 3.248453E-022*f5 - 6
COB(-1.374521E-001) - 1.161646E-004*f - 3.594691E-
009*f2 + 2.115098E-012*f3(-6.263750E-001) + 2.545583E-005*f - 8.891492E-010*f2 +
5.731461E-015*f3
COC2.275507E-001 + 3.203375E-004*f + 1.002169E-007*f2
- 2.356388E-010*f3 + 5.207282E-014*f4(-4.057131E-001) + 1.790386E-004*f - 1.122891E-008*f2 +
3.394767E-013*f3 - 4.841634E-018*f4 + 2.531889E-023*f5
COAC 0(-3.47268E-001) + 1.397008E-004*f - 1.022518E-008*f2 +
2.921438E-013*f3 -3.634067E-018*f4 + 1.645107E-023*f5
Table 4. Coefficients Curve Fits for Setpoint 44543 and 160o Observation Angle
American Institute of Aeronautics and Astronautics
17
Figure 21. Coefficients obtained from the DOE analysis at setpoint 44103 and a 160o observation angle.
Baseline Spectral Peak
Coefficient 150 - 3981 Hz (f) 3981 - 80000 Hz (f)
COM1.039173E+000 + 1.105897E-005*f + 1.338017E-006*f2 -
5.781225E-010*f3 + 6.578717E-014*f4
2.078341E+000 + 1.241924E-004*f - 1.027763E-008*f2 +
4.095166E-013*f3 - 5.854753E-018*f4 + 2.814523E-023*f5
COA3.487523E-001 + 6.531059E-004*f + 6.360780E-007*f2 -
3.416770E-010*f3 + 4.184835E-014*f41.894310E+000 + 6.729526E-005 - 7.74711E-009*f2 +
3.376004E-013*f3 - 4.958811E-018*f4 + 2.405727E-023f5
COB(-1.608961E-001) + 9.069964E-004*f - 1.167763E-006*f2 +
4.198679E-010*f3 - 6.230869E-014*f4 + 3.343398E-018*f5(-1.191444E+000) + 9.734788E-005*f - 4.365086E-009*f2 +
5.920600E-014*f3 - 2.757949E-019*f4
COC4.443126E-001 + 3.172128E-005*f - 2.603561E-007*f2 +
8.394586E-011 + -6.848992E-015*f4
(-1.250312E+000) + 4.204764E-004*f - 2.675849E-008*f2 +
6.842708E-013*f3 - 7.792063E-018*f4 + 3.287005E-023*f5
COAC 0
(-2.273122E+000) + 8.365095E-004*f - 8.830734E-008*f2 +
4.271068E-012*f3 - 1.092577E-016*f4 + 1.526296E-021*f5 -
1.09861E-026*f6 + 3.18274E-032*f7
Table 5. Coefficients Curve Fits for Setpoint 44103 and a 160o Observation Angle
Penetration Length Width 1585 Hz @ 160o 3162 Hz @ 80o 3981 Hz @ 80o Peak Reduction @ 80o
inches (A) inches (B) inches (C ) (dB) (dB) (dB) (dB)
Approach 1 0.30 (-1.0) 0.75 (-1.0) 100 (1.0) 2.3 0.8 -0.2 N/A
Approach 2 0.36 (-0.6) 0.75 (-1.0) 100 (1.0) 2.7 N/A N/A 0
Approach 3 0.51 (0.4) 0.75 (-1.0) 100 (1.0) 3.6 0.1 N/A N/A
Optimization
Table 6. Optimized Chevron Configurations
American Institute of Aeronautics and Astronautics
18
(a) (b) Figure 22. One-third octave band spectra for optimization chevron designs and the average baseline nozzles at setpoint 44543 and observation angles equal to (a) 80o and (b) 160o.