Embed Size (px)
Citation preview
HIGHLIGHTED ARTICLE| INVESTIGATION
An Opaque Cell-Specific Expression Program ofSecreted Proteases and Transporters Allows Cell-Type
Cooperation in Candida albicansMatthew B. Lohse,* Lucas R. Brenes,*,1 Naomi Ziv,* Michael B. Winter,†,2 Charles S. Craik,†
and Alexander D. Johnson*,3
*Department of Microbiology and Immunology and †Department of Pharmaceutical Chemistry, University of California, SanFrancisco, California 94143
ABSTRACT An unusual feature of the opportunistic pathogen Candida albicans is its ability to switch stochastically between twodistinct, heritable cell types called white and opaque. Here, we show that only opaque cells, in response to environmental signals,massively upregulate a specific group of secreted proteases and peptide transporters, allowing exceptionally efficient use of proteins assources of nitrogen. We identify the specific proteases [members of the secreted aspartyl protease (SAP) family] needed for opaquecells to proliferate under these conditions, and we identify four transcriptional regulators of this specialized proteolysis and uptakeprogram. We also show that, in mixed cultures, opaque cells enable white cells to also proliferate efficiently when proteins are the solenitrogen source. Based on these observations, we suggest that one role of white-opaque switching is to create mixed populationswhere the different phenotypes derived from a single genome are shared between two distinct cell types.
KEYWORDS white-opaque switching; fungal pathogenesis; microbiome; protease
PROTEASE secretionbypathogensplays an important role inmany aspects of host–pathogen interactions, including col-
onization, tissue damage, and interference with host immuneresponses (Blom et al. 2009; Koziel and Potempa 2013;Pietrocola et al. 2017). Secreted proteases also contribute tonutrient acquisition; examples include amino acid acquisitionby Legionella pneumophila (White et al. 2018) and carbon ac-quisition by Pseudomonas aeruginosa (Diggle et al. 2007). Se-creted proteases are also important for the most prevalentfungal pathogen of humans, Candida albicans. The secretedaspartyl protease (SAP) family from C. albicans comprises13 homologous proteins and has been linked to, among otherthings, biofilm formation (Winter et al. 2016), interactionswithbacteria (Dutton et al. 2016), adhesion to host cells (Watts et al.1998; Bektic et al. 2001; Albrecht et al. 2006), protection from
host defense proteins (Borg-von Zepelin et al. 1998; Groppet al. 2009; Meiller et al. 2009; Rapala-Kozik et al. 2010,2015; Bochenska et al. 2015; Kozik et al. 2015), and activationof host immune responses (Schaller et al. 2005; Hornbach et al.2009; Pietrella et al. 2010; Pericolini et al. 2015; Gabrielli et al.2016). The SAP family, especially SAP2 (Hube et al. 1997), hasalso been linked to C. albicans’ unusual ability, compared withother fungal species, to utilize proteins [e.g., casein or bovineserum albumin (BSA)] as a nitrogen source (Staib 1965;Nelson and Young 1986). This occurs through the cleavageof proteins into short peptides that are then imported by theoligopeptide transporter (OPT) and peptide transporter (PTR)families (Reuss and Morschhäuser 2006; Dunkel et al. 2013).
Although C. albicans is a common component of the humanmicrobiome—asymptomatically colonizing the skin, gastroin-testinal tract, and genitourinary tract of healthy individuals—it can cause superficial mucosal or dermal infections as well asdisseminated bloodstream infections if the host immune sys-tem is compromised or the native microbiome is disrupted(Kennedy and Volz 1985; Wey et al. 1988; Wenzel 1995;Calderone and Fonzi 2001; Kullberg and Oude Lashof 2002;Eggimann et al. 2003; Gudlaugsson et al. 2003; Pappas et al.2004; Achkar and Fries 2010; Kumamoto 2011; Kim andSudbery 2011). C. albicans grows as several distinct cell typesin vitro and in vivo, including yeast, pseudohyphal, and hyphal
Copyright © 2020 by the Genetics Society of Americadoi: https://doi.org/10.1534/genetics.120.303613Manuscript received April 20, 2020; accepted for publication August 20, 2020;published Early Online August 24, 2020.Supplemental material available at figshare: https://doi.org/10.25386/genetics.12818894.1Present address: Biology Graduate Program, Massachusetts Institute of Technology,Cambridge, MA 02139.
2Present address: CytomX Therapeutics Inc., South San Francisco, CA 94080.3Corresponding author: Department of Microbiology and Immunology, University ofCalifornia, San Francisco, 600 16th St., MBGH Room N372E, Box 2200, San Francisco,CA 94143-2200. E-mail: [email protected]
Genetics, Vol. 216, 409–429 October 2020 409
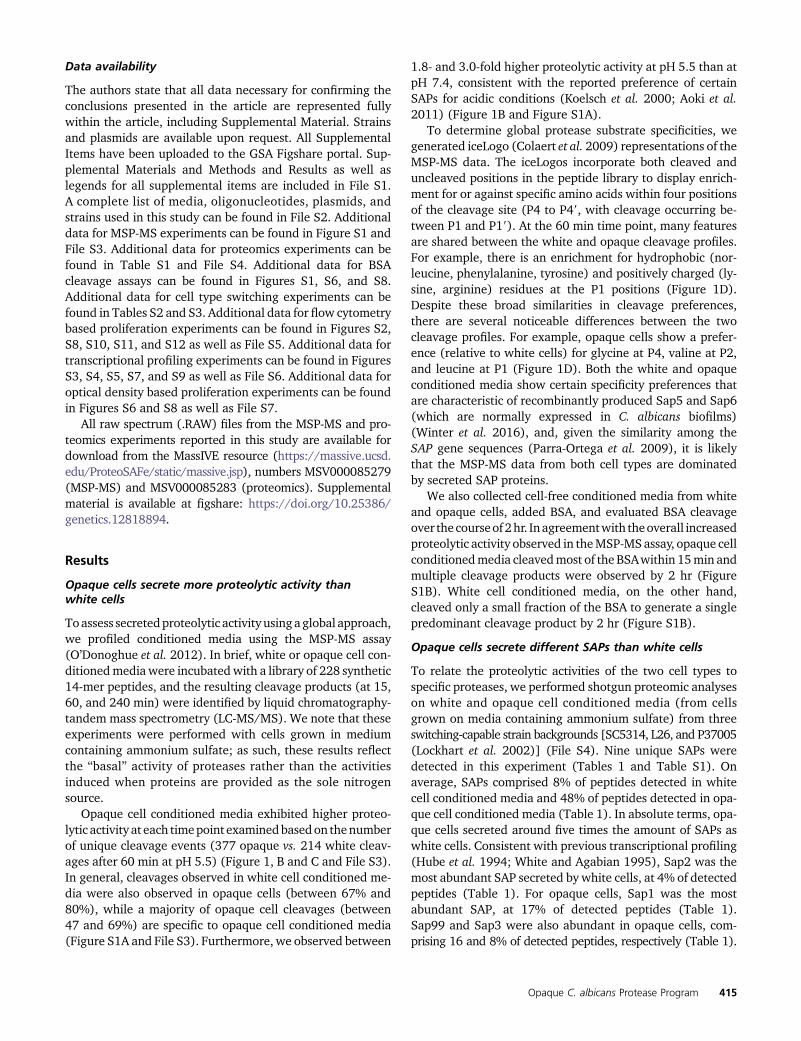
cells. In addition, C. albicans (and the closely related speciesCandida dubliniensis and Candida tropicalis) can switch be-tween two distinct, heritable cell types named “white” and“opaque” (Slutsky et al. 1987; Soll et al. 1993; Johnson2003; Pujol et al. 2004; Lohse and Johnson 2009; Soll 2009;Morschhäuser 2010; Porman et al. 2011). The white and opa-que cell types are heritable for many generations, and switch-ing between them occurs approximately once every 10,000cell divisions under standard laboratory conditions (Rikkerinket al. 1988; Bergen et al. 1990). Although genetically identical,these two cell types differ in the appearance of their colonies,in their cell morphologies (Figure 1A), as well as in expressionof roughly 15% of the genome (Lan et al. 2002; Tuch et al.2010). As a result of these expression differences, the two celltypes also differ in their abilities to mate (Miller and Johnson2002), their responses to environmental conditions (Si et al.2013), their metabolic preferences (Lan et al. 2002; Ene et al.2016; Dalal et al. 2019), and their interactions with the hostimmune system (Kvaal et al. 1997, 1999; Geiger et al. 2004;Lohse and Johnson 2008; Sasse et al. 2013; Takagi et al.2019). Transcriptional profiling has revealed that severalSAPs and peptide transporters are differentially expressed be-tween white and opaque cells (e.g., OPT1 is enriched in whitecells, SAP1 andOPT4 are enriched in opaque cells) (Hube et al.1994; White and Agabian 1995; Lan et al. 2002; Tuch et al.2010; Hernday et al. 2013). It has also been shown that opa-que cells proliferate better than white cells when dipeptides,tripeptides, or BSA are the sole nitrogen source (Kvaal et al.1999; Lan et al. 2002; Ene et al. 2016).
In this work, we show that opaque cells have a specializedprogram that is induced when protein present in the environ-ment is the sole source of nitrogen. This inducible program,which is not observed in white cells, includes the massiveupregulation of several specific SAP proteins along with aseries of peptide transporters. We show that this inducedresponse is needed for the ability of opaque cells to useproteins efficiently as a sole nitrogen source, and, using aseries of quadruple and quintuple deletion mutants, we iden-tify the individual SAPs needed for opaque cells to proliferateunder these conditions. We also show that Stp1, a knownregulator of SAP2 in white cells (Martínez and Ljungdahl2005), works in combination with the white-opaque regula-tors Wor3 and Efg1 to produce the specialized opaque pro-teolysis program. Finally, we show that, in mixed cultures ofwhite and opaque cells, opaque cells, evenwhen in theminority,can enable white cells to proliferate efficiently when proteinsare the sole nitrogen source. Based on these results, we suggestthat one role of white–opaque switching is to create mixedpopulations where the population characteristics derived froma single genome are shared between two distinct cell types.
Materials and Methods
Supplemental Materials andMethods, Supplemental Results,as well as legends for all Supplemental Figures, Files, andTables can be found in File S1.
Media and growth conditions
Unless otherwise noted, strains were grown at 25� on syn-thetic complete medium (6.7 g/liter Yeast Nitrogen Basewithout Amino Acids (BD #291940)) supplemented with2% glucose, amino acids (2 g/liter), and uridine (100 mg/ml)(SCD+aa+Uri); plates contained 2% agar. Specific nitro-gen source and nitrogen depletion media was prepared im-mediately before use from 2X S+Uri (3.4 g/liter YeastNitrogen Base without Amino Acids or ammonium sulfate(MP Biomedicals, #4027-032), 200 mg/ml uridine), 40%glucose, 5% ammonium sulfate (A2939; Sigma), and 10%protein [bovine serum albumin (BSA; A1470; Sigma), humanserum albumin (HSA; A8763; Sigma), hemoglobin (SigmaH2500), or myoglobin (M1882; Sigma)] stocks. Final glu-cose, ammonium sulfate, and protein concentrations, whenpresent, were 2%, 0.5%, and 1%, respectively. Common com-binations included BSAwithout ammonium sulfate or aminoacids (SD+BSA+Uri), ammonium sulfate without BSA oramino acids (SD+AmS+Uri), or medium lacking BSA, am-monium sulfate, and amino acids (SD+Uri). Specific nitro-gen source, nitrogen depletion, and specific carbon sourceliquid media were filtered on 0.45 mm polyethersulfone(PES) filters (#725-2545; Thermo) prior to use. Dulbecco’sPBS (D-PBS) lacking calcium chloride and magnesium chlo-ride was procured from the Cell Culture facility at the Uni-versity of California, San Francisco or Gibco (#14190-136). Alist of media used in this study can be found in File S2.
Plasmid construction
ThemCherry reporter plasmidswere constructed as follows inthe pUC19 backbone. In three separate steps, C. albicans op-timized mCherry taken from pMBL180 (Lohse and Johnson2016), the SAT1 selectable marker from pNIM1 (Park andMorschhäuser 2005), and the RPS1/RP10 homology regionfrom pADH33 (Lohse et al. 2013) were inserted between theHindIII–PstI, PstI–BamHI, and BamHI–EcoRI restriction sites,respectively, to create the plasmid pNZ116. The promotersfor OPT1 (1968 bp), OPT2 (2056 bp), SAP2 (4522 bp), andUGA4 (980 bp) were amplified from C. albicans SC5314 ge-nomic DNA and added toHindIII-digested pNZ116 backboneusing In-Fusion cloning (#638911; Takara) to generate plas-mids pNZ119 (OPT1), pNZ120 (OPT2), pNZ121 (SAP2), andpNZ118 (UGA4). The promoter regions extend from the startor stop of the upstream gene (with the exception of pOPT2and pUGA4, which start 24 and 6 base pairs downstream ofthat location, respectively) to the ATG at the start of the re-spective genes. All plasmid sequences were verified by se-quencing. A list of oligonucleotides and plasmids used inthis study can be found in File S2.
Strain construction
The SC5314-derived C. albicans wild-type white and opaquestrains used in the proteomic and Multiplex Substrate Pro-filing by Mass Spectrometry (MSP-MS) experiments havebeen reported previously (Hernday et al. 2013); in brief,
410 M. B. Lohse et al.
these areHIS1 and LEU2 addbacks to the SN152 a/a his1 leu2arg4 strain (Noble and Johnson 2005) that were then con-verted to the switching capable a/D background by deletionof the a copy of the Mating Type Like (MTL) locus using pJD1(Lin et al. 2013). The opaque transcriptional regulator knock-out library strains (Lohse et al. 2016) derive from the samebackground. The previously reportedwhite and opaque Tef2-GFP and Tef2-mCherry strains (Takagi et al. 2019) are de-rived from the switching capable AHY135 strain (Herndayet al. 2013), where the HIS1 and LEU2 markers were addedback to RZY47, itself a sorbose selected a/a copy of the SN87a/a his1 leu2 strain (Noble and Johnson 2005; Zordan et al.2006). C. albicans clinical isolates L26 and P37005 (Lockhartet al. 2002), C. dubliniensis CD36 (Sullivan et al. 1995),C. tropicalis MYA3404 (Joly et al. 1996), the C. tropicalisAM2005/0093 derived white-opaque switching strains(Anderson et al. 2016), and Candida parapsilosis CBS604/ATCC22019 (Guerin et al. 1989) have all been reportedpreviously.
Gene deletion and truncation utilized the SAT1 marker-based CRISPR protocol targeting Candida maltosa LEU2 asdescribed by Nguyen et al. (2017). We used a derivative ofthe hemizygous LEU2 strain SNY250 [a derivative of SNY152(a/a his1 leu2 arg4) with the C. dubliniensis HIS1 and C.maltosa LEU2 gene deletion cassettes integrated at the C.albicans LEU2 locus] (Noble and Johnson 2005), which wasconverted to a/D by deleting the a copy of the MTL usingpJD1 (Lin et al. 2013). For gene deletions, the 90 bp-annealed donor DNA (dDNA) contains homology to the re-gions directly upstream and downstream of the targetedORF. Each dDNA homology arm consists of 44 bp and thetwo homology arms are separated by a two base pair GGinsert added to create a potential gRNA site. For the STP1truncation mutant (D2–61), the dDNA homology arms flankthe targeted amino acids and no GG insert was added. Genedeletions were confirmed by colony PCR reactions verifyingthe loss of the targeted ORF(s) and truncation mutationswere confirmed by sequencing. After confirming the presenceof the desired edit(s), the Cas9 ORF-gRNA-SAT1 cassette wasrecycled by plating on Leu/His/Arg dropout plates andselecting for recombination events with an intact CmLEU2ORF. We selected against both leucine and histidine in orderto avoid potential histidine auxotrophies arising during therecombination process (both CmLEU2 and CdHIS1 are pre-sent at the CaLEU2 locus in the SNY250-derived background).
The mCherry reporter strains were constructed usingAgeI-HF (NEB R3552L)-linearized reporter plasmids trans-formed into the SNY250-derived a/D wild type strain. Colo-nies were selected for growth on Yeast Extract PeptoneDextrose (YEPD) plates supplemented with 400 mg/ml nour-seothricin (clonNAT, WERNER BioAgents, Jena, Germany).Plasmid integration at the RPS1 (RP10) locus was verified bycolony PCR across the 59 and 39 flanks of the integratedplasmid.
A list of oligonucleotides and strains used in this study canbe found in File S2.
Conditioned media processing for MSP-MS andproteomic analyses
Following recovery from glycerol stocks, white and opaque C.albicans strains were grown for 7 days on SCD+aa+Uriplates at 25�. Overnight cultures (5 ml, SCD+aa+Uri, 25�)were started from single colonies with no visible switchingevents. The following morning, cell type homogeneity of theovernight culture was verified by microscopy prior to dilutionto OD600 = 0.05 in 50 ml of SCD+aa+Uri medium in a 250ml flask; two independent 50 ml cultures were grown foreach strain. Cultures were incubated with shaking at 220rpm for 24 hr at 25� before harvesting as previously describedfor planktonic C. albicans cultures (Winter et al. 2016). Inshort, cultures were transferred to 50 ml tubes and centri-fuged for 10 min at 3500 rpm at 4�. The supernatant wascollected, filtered on a 0.45 mm PES filter (#725-2545;Thermo), and flash frozen in liquid nitrogen. A small aliquotwas taken from each culture immediately prior to harvesting,diluted, and plated on three SCD+aa+Uri plates, which wereincubated for 7 days at 25� and then scored for colony mor-phology to confirm each culture’s cell type.
To prepare samples for analysis, each frozen conditionedmedium was thawed on ice, the conditioned media from thetwo independent cultures of each strain were pooled, and thecombined sample was concentrated (using a refrigeratedcentrifuge) to �1 ml on 10 kDa MWCO Amicon Ultra spinfilter units (Millipore UFC901024). The concentrated solu-tions were then diluted to 15 ml with ice cold D-PBS to ex-change the buffer and subsequently concentrated to�750ml.These concentrated solutions were then aliquoted, flash fro-zen in liquid nitrogen, and stored at 280�. Protein concen-trations of each solution were quantified using the Bradfordassay.
MSP-MS analysis
Substrate specificity profiles were determined for 24 hr con-ditioned media samples, prepared as described above, fromwhite and opaque cultures from an SC5314-derived C. albi-cans strain using the previously reported MSP-MS assay(O’Donoghue et al. 2012; Winter et al. 2016, 2017). In short,20 mg/ml processed conditioned medium and matchedno-enzyme controls were assayed at room temperature(�22�) against a diverse library of 228 tetradecapeptidespooled at 500 nM in D-PBS (pH 7.4) and MES (pH 5.5; 9.5mMMES, 2.7mMKCl, 140mMNaCl). A 30ml aliquot of each150 ml assay mixture was removed after 15, 60, and 240min,quenched with 30 ml of 8 M guanidinium-HCl, and flashfrozen in liquid nitrogen. Samples were thawed, acidifiedto pH 2 by the addition of 1.5 ml of 20% formic acid, desaltedwith C18 Desalting Tips (17014047; Rainin), eluted in 40 mlof a 50:50 acetonitrile (34851; Sigma): water (Fisher W5)mixture with 0.2% formic acid, and then lyophilized. Sam-ples were resuspended in 30 ml of 0.2% formic acid solutionprior to mass spectrometry.
Cleavage site identification was performed on an LTQOrbitrap XL mass spectrometer (Thermo) equipped with a
Opaque C. albicans Protease Program 411
nanoACQUITY (Waters) ultraperformance LC (UPLC) systemand an EASY Spray ion source (Thermo). Reversed-phasechromatographywas carried outwith anEASY-Spray PepMapC18 column(Thermo,ES800; 3mmbead size, 75mm3150mm).Loading was performed at a 600 nl/min flow rate for 12 min,and then peptide separation was performed at a 300 nl/minflow rate over 63min with a linear gradient of 2–30% (vol/vol)acetonitrile in 0.1% formic acid followed by a 2 min lineargradient from 30 to 50% acetonitrile. Peptide fragmentationwas performed by collision-induced dissociation (CID) onthe six most intense precursor ions, with a minimum of1000 counts, with an isolation width of 2.0 m/z anda minimum normalized collision energy of 25. For MS/MSanalysis, survey scans were recorded over a range of 325 to1500 m/z. Internal recalibration to polydimethylcyclosilox-ane ion (m/z = 445.120025) was used for both MS andMS/MS scans. MS peak lists were generated with MSConvert.Data were searched against the 228-member peptide libraryusing the Protein Prospector software (http://prospector.ucsf.edu/prospector/mshome.htm, UCSF) (Chalkley et al.2008) with specified tolerances of 20 ppm for parent ionsand 0.8 Da for fragment ions. All cleavages were allowed inthe search by designating “no enzyme” specificity. The fol-lowing variable modifications were used: amino acid (pro-line, tryptophan, and tyrosine) oxidation and N-terminalpyroglutamate conversion from glutamine. Protein Pros-pector score thresholds were selected with a minimum pro-tein score of 15 and a minimum peptide score of 15.Maximum expectation values of 0.01 and 0.05 were selectedfor protein and peptide matches, respectively. Peptides cor-responding to cleavage products in the 228-member library(O’Donoghue et al. 2015) were selected with inhouse soft-ware and imported into iceLogo software v.1.2 (Colaert et al.2009) to generate substrate specificity profiles and Z scorecalculations as described previously (O’Donoghue et al.2012). Octapeptides corresponding to P4–P49 were used asthe positive data set, and octapeptides corresponding to allpossible cleavages in the library (n= 2964) were used as thenegative data set. Octapeptide cleavage products identifiedby the MSP-MS assays with the 228-member library are pro-vided in File S3 in the supplemental material.
Proteomic analysis
Proteomic analysis of conditioned media from planktoniccultures of white and opaque cells from three C. albicansbackgrounds (SC5314, L26, P37005) was based on previ-ously reported methods (Winter et al. 2016). In brief, threesamples from 24 hr conditioned media preparations of eachstrain (3 mg diluted to 40 ml with D-PBS) were prepared asdescribed above and matched on a total protein basis. Con-ditioned media preparations were incubated for 20 minwith 6 M urea (U5378; Sigma) and 10 mM DTT (D0632;Sigma) at 55�, alkylated for 1 hr with 12.5 mM iodoaceta-mide (I6125; Sigma) at room temperature (�22�), quenchedwith an additional 10 mM DTT, and diluted 2.5-fold with25 mM ammonium bicarbonate (100 ml; A6161; Sigma).
For trypsinization, 16 ml of a 1:100 dilution (in 25 mM am-monium bicarbonate) of trypsin solution (V511C; Promega)was added, and the digests were incubated for 17 hr at 37�(1:37.5 trypsin/sample w/w). Following the trypsin digest,samples were acidified to pH 2 with 5 ml of 20% formic acid(JT Baker 0128-01) before desalting with C18 Desalting Tips(Rainin 17014047). Samples were eluted in 40 ml of a 50:50acetonitrile (34851; Sigma): water (Fisher W5)mixture with0.2% formic acid and then lyophilized. Samples were resus-pended in 50 ml of 0.2% formic acid solution prior to massspectrometry.
LC-MS/MS peptide sequencing was performed using theLTQOrbitrap-XLmass spectrometer, ion source, UPLC system,EASY-Spray PepMap C18 column, and CID parameters forpeptide fragmentation described above. Loading was per-formed at a 600 nl/min flow rate for 12min, and then peptideseparation was performed at a 300 nl/min flow rate over 63min with a linear gradient of 2–30% (vol/vol) acetonitrile in0.1% formic acid followed by a 2 min linear gradient from30 to 50% acetonitrile. For MS/MS analysis, survey scanswere recorded over a mass range of 325–1500m/z. MS peaklists were generated with inhouse software called PAVA. Da-tabase searching was performed with Protein Prospectoragainst the UniProtKB C. albicans database [SC5314, taxo-nomic identifier 237561; downloaded April 20, 2017 (lastmodified February 4, 2017) with 6153 entries]. The data-bases were concatenated with an equal number of fully ran-domized entries for estimation of the false-discovery rate(FDR). Database searching was carried out with tolerancesof 20 ppm for parent ions and 0.8 Da for fragment ions.Peptide sequences were matched as tryptic peptides withup to two missed cleavages. Constant and variable modifica-tions were set as described previously (O’Donoghue et al.2012). The following Protein Prospector score thresholdswere selected to yield a maximum protein FDR of ,1%.A minimum “protein score” of 22 and a minimum “peptidescore” of 15 were used; maximum expectation values of 0.01for protein and 0.05 for peptide matches were used; “ReportHomologous Proteins”was set to “Interesting.”Only proteinswith a minimum of two unique peptides for identification arereported.
Each protein’s individual peptide (i.e., spectral) countsfrom the three samples for a given strain were averaged,using a value of zero when no peptides were detected in agiven sample. The percent abundance of a protein in a strainwas calculated as the average spectral count from the threesamples divided by the sum of the average spectral counts forall proteins detected in that strain. A complete list of proteinsidentified by these experiments are provided in File S4 in thesupplemental material. We note that three proteins (Bgl2,Fet31, Rny11) appeared twice in the protein list for at leastone sample; we have left both instances in place in File S4and for the percent abundance calculations. Omitting thesecond entries of these proteins had less than a 0.1% effecton the abundance of all SAPs expect for the most highlyexpressed samples (Sap1, Sap3, Sap98, Sap99 in opaque
412 M. B. Lohse et al.
cells) where the largest effect was 0.66%; none of our con-clusions are affected by the inclusion and/or exclusion ofthese entries.
Conditioned media BSA cleavage assays
In order to examine basal proteolytic activity, 3 mlSCD+aa+Uri cultures were started from white or opaquecolonies and incubated for 24 hr at 25� on a roller drum. ThepH of SCD+aa+Uri media, as evaluated by pH paper (Baker#4393-01 and #4391-01), decreased from �5.0–5.5 to 3.0–3.5 during the 24 hr incubation, we note that this range iscompatible with the reported pH preferences of much of theSAP family (Koelsch et al. 2000; Aoki et al. 2011). After the24 hr incubation, supernatant was collected and filtered ona 0.45 mm PES filter (#725-2545; Thermo). BSA was addedto the filtered supernatant at a final concentration of 0.5%(from a 20% stock solution) and the mixture was vortexedand incubated for 2 hr at 25� in a glass test tube on a rollerdrum. Samples were collected immediately after the additionof BSA and after 15, 60, and 120 min. The test tubes werevortexed prior to harvesting, and the harvested samples weremixed 1:4 with 8 M Urea, vortexed, and flash frozen in liquidnitrogen. Samples were run on 12.5% SDS-PAGE gels to eval-uate effects on the full length BSA band. When indicated,pepstatin A (Sigma P5318) was diluted from 5 mM (inDMSO) to 1 mM (in DMSO) before being added to the fil-tered conditioned media (prior to addition of BSA) at a finalconcentration of 1 or 5 mM as indicated, equivalent volumesof DMSO were used as loading controls for these assays.
When screening the opaque transcriptional regulatorknockout library, we processed 16 strains at a time and onlyharvested samples after 120 min. Candidates with reducedcleavage of BSA identified by the initial screenwere subjectedto further testing in order to control for experimental artifactssuch as predominately white cell populations or lower culturedensities. First, we repeated the assay while microscopicallyverifying the cell type of each culture. This eliminated thewhite cell population concern for all but two strains for whichwe could not get majority opaque populations (bcr1, fgr15).We then repeated the assay with the remaining candidatesand, after verifying cell type, determined the cell density ofeach sample by flow cytometry. To compensate for the lowercell density observed for several strains after 24 hr, the assaywas repeated with cultures incubated for 40 or 44 hr. Afteraccounting for cell type and culture density, only the efg1 andwor3 deletions exhibited a BSA cleavage-deficient phenotype.
Flow cytometry proliferation and expression assays
Flow cytometry assays used either a BD Accuri C6 Plus (basicproliferation assays, GFP-based coculture assays) or a BDFACS Celesta (mCherry-based coculture and Proteinase Kpretreatment reporter assays). The BD Accuri C6 Plus useda 488 nm laser with a 533/30 bandpass filter, samples wereloaded from 96-well U-bottom plates (351177; Falcon), andnormal acquisition was 10 ml of sample on the slow setting.The BD FACS Celesta used a 488 nm laser with a 530/30
bandpass filter and a 561 nm laser with a 610/20 bandpassfilter, samples were loaded from 5ml tubes (352052; Falcon)and normal acquisition was 10,000 events on the highsetting.
For flow cytometry proliferation assays, SCD+aa+Uriovernight cultures (25�) were started from white or opaquecolonies of each strain; independent cultures were processedin parallel for repeats of a given strain or condition. Thefollowing morning, cultures were diluted back to OD600 =0.5 in 5 or 15 ml fresh SCD+aa+uri media and grown for5–10 hr, depending on the assay, at 25� in a roller drum. Cellswere then harvested, washed twice with 4 ml D-PBS, resus-pended in SD+Uri, and diluted to OD600 = 0.5 in SD+Uri.Cell densities were verified by flow cytometry, and the cellswere then diluted 1:10 to OD600 = 0.05 in the appropriatemedium (e.g., SD + BSA + Uri or SD + AmS + Uri) andgently vortexed. The density of each culture was then deter-mined by flow cytometry, and the strains were grown on aroller drum at 25�. At each subsequent time point, cultureswere gently vortexed, samples were removed, and densersamples were diluted with D-PBS prior to determining celldensity by flow cytometry. Cell counts for proliferation assayswere based on the number of cells detected in a 10 ml samplemultiplied by the sample’s dilution. For the assay comparingproliferation on different proteins (BSA, HSA, hemoglobin,myoglobin), the initial 10% protein stocks were dialyzed at4� in 3500 MWCO Slide-A-Lyzer Dialysis Cassettes (#66330;Thermo) vs. distilled water for �8 hr (roughly 1:250) andthen against fresh distilled water for a further 16 hr (again,roughly 1:250) prior to incorporation into the medium. Forthe 37� BSA proliferation assay, samples were incubated in a37�, rather than a 25�, roller drum and cells were harvestedand plated for cell type determination as described in File S1.For the BSA as a carbon source assays, cells were dilutedto OD600 = 0.5 in S + Uri and then 1:10 to OD600 = 0.05in either S + BSA + Uri or S + BSA + AmS + Uri media.
Flow cytometry coculture proliferation assays: The cocul-ture proliferation assays followed the protocol describedabove with the following modifications. After the D-PBSwashes, SD+Uri resuspension, and OD600 determination,the two strains were mixed at defined Tagged/Untagged ra-tios (e.g., 100/0, 50/50, 20/80, 5/95, and 0/100 for the wildtype opaque and white experiments) where the two strainshad a combined starting OD600 of 0.5. Expression of a Tef2-GFP fusion protein was used to distinguish strains, this re-porter was expressed by the wild type opaque strain except inthe cases of the wild type white cell Tef2-GFP: wild typeopaque cell Tef2-mCherry fluorophore swap experiment,and the wild type white cell Tef2-GFP: opaque quintupleSAP deletion strain coculture experiment.
Flow cytometry mCherry reporter assays: The coculturemCherry reporter proliferation assays followed the protocoldescribed above with the following modifications. After theD-PBS washes and SD+Uri resuspension, the initial dilution
Opaque C. albicans Protease Program 413
in SD+Uri was to OD600 = 1.0, rather than 0.5, and thesubsequent 1:10 dilution into the appropriate media wasto OD600 = 0.1, rather than 0.05. Cells were analyzed usinga BD FACS Celesta rather than a BD Accuri C6 Plus. TheTef2-GFP fusion protein was used to distinguish betweenthe opaque cells (GFP positive) and the white strainsexpressing the mCherry reporters for OPT1, OPT2, SAP2,or UGA4 expression (GFP negative). For the proteinase Kpretreatment assays, 10 ml of a 10% BSA solution was in-cubated with 2.5 ml of proteinase K (NEB P8107S) for30 min at room temperature (�22�). The proteinaseK-treated BSA, in parallel with a mock treated BSA control,was then used to make SD+BSA+Uri media as describedabove.
Flow cytometry analysis:Data for each samplewas exportedas an FCS file, all subsequent analysis was done with R (RCore Team 2019) using the flowCore (Ellis et al. 2019),ggcyto (Van et al. 2018), and tidyverse (Wickham 2017)packages. For the myoglobin samples, which accumulateddebris during the experiment, the data were filtered duringanalysis to exclude events with a FSC of ,200,000. For thecoculture experiments performed on the Accuri (Figure 7Band Supplemental Material, S10 and S12), data were firstfiltered to exclude those with no GFP fluorescence measure-ment. Cells were defined as GFP positive if the ratio ofGFP.A/SSC.A was.0.04. For the coculture and/or reporterexperiments performed on the Celesta (Figure 7C and Fig-ure S11), cells were defined as GFP positive if the ratio ofGFP.A/SSC.A was .0.5. In both sets of coculture analysis,the GFP positive evaluation was performed on all samples(including those that should contain 100% or 0% GFP pos-itive cells).
Growth rates were calculated using a sliding windowapproach; the natural log of cell count was regressed againsttime for each set of five time points based on previouslyreported protocols (Ziv et al. 2013). The growth rate wascalculated as the greatest slope of a regression that had bothan R2 .0.9 and at least a fourfold change over the five timepoints. Subsequently, lag duration was estimated as the in-tersection of this regressionwith a horizontal line determinedby the cell count at the first time point. Confidence intervalsfor mean growth rate and lag duration were calculated as61.96 the SEM. Growth rates calculated based on FlowCytometry Proliferation Assays are included in File S5.
White-opaque switching assay and variants
The white-to-opaque and opaque-to-white switching assaysevaluating the effect of SAP deletions on switching rates fol-lowed previously reported protocols (Miller and Johnson2002; Zordan et al. 2007; Lohse et al. 2016). Details aboutthis method, the modifications to evaluate white-opaqueswitching when BSA is the sole nitrogen source, and themodifications to evaluate the effect of BSA on opaque cellstability at 37� are addressed in the Supplemental Materialsand Methods (File S1).
NanoString transcriptional profiling
Transcriptional analysis was conducted using NanoStringprobes against a set of 59 C. albicans genes (one probe pergene). Probes were designed and synthesized by NanoStringTechnologies. A list of target genes and probe sequences canbe found in File S6.
Overnight cultures of strains being profiled were grown inSD+AmS+Uri at 25�; in the morning, cells were diluted to adensity of 53 106 cells/ml (opaque cells), 2.53 106 cells/ml(white cells), or 1 3 107 cells/ml (2 hr experiments) in thedesired media. Ammonium sulfate samples were harvested8 hr postdilution, other samples were harvested 2 hr postdilu-tion or when cells were growing logarithmically, as indicated.Cells were pelleted, frozen in liquid nitrogen, and storedat280� pending further processing. Total RNAwas extractedusing a MasterPure Yeast RNA Purification Kit (MPY03100;Lucigen), the RNA concentration was determined on a Nano-drop 2000C (Thermo Scientific), and RNA quantity was nor-malized to 400 ng per sample. Samples were processed on anCounter Sprint Profiler (NanoString Technologies) at theCenter for Advanced Technology at the University of Califor-nia, San Francisco. Read count data were processed using thenSolver analysis software (NanoString Technologies). Tworeplicates were analyzed for each sample except for wild-typeopaque cells when BSAwas the sole source of nitrogen; in thiscase, four replicates were analyzed.
Raw counts were exported and then analyzed with R (RCore Team 2019) using the tidyverse package (Wickham2017). All data were normalized based on four housekeep-ing genes (PGA59, MTLa1, TBP1, HTA1) whose averageexpression spans almost three orders of magnitude. Thegeometric mean of these four housekeeping genes for eachsample was calculated (PGA59, 11,5; MTLa1, 5.84; TBP1,7.59; HTA1, 9.6), and the difference between the geometricmean of these housekeeping genes across all samples andthe geometric mean of these four housekeeping genes ineach individual sample was determined. This differencewas then subtracted from all reads in that individual sampleto normalize the data, and these normalized read countswere used for all further comparisons and analyses. Stu-dent’s t-tests were performed on log transformed expressiondata to compare between the ammonium sulfate and BSAconditions for wild type opaque and white cells either log-arithmically growing or at the 2 hr time point (Figure S3).Significance was evaluated using a 5% FDR (Benjamini–Hochberg procedure). Raw and normalized NanoStringtranscriptional data can be found in File S6.
Optical density proliferation assays
The optical density proliferation assays modified our pre-viously reported protocol (Lohse et al. 2016) to accountfor the increased delay before proliferation when BSAwas the sole nitrogen source. This method is describedin detail in the Supplemental Materials and Methods(File S1).
414 M. B. Lohse et al.
Data availability
The authors state that all data necessary for confirming theconclusions presented in the article are represented fullywithin the article, including Supplemental Material. Strainsand plasmids are available upon request. All SupplementalItems have been uploaded to the GSA Figshare portal. Sup-plemental Materials and Methods and Results as well aslegends for all supplemental items are included in File S1.A complete list of media, oligonucleotides, plasmids, andstrains used in this study can be found in File S2. Additionaldata for MSP-MS experiments can be found in Figure S1 andFile S3. Additional data for proteomics experiments can befound in Table S1 and File S4. Additional data for BSAcleavage assays can be found in Figures S1, S6, and S8.Additional data for cell type switching experiments can befound in Tables S2 and S3. Additional data for flow cytometrybased proliferation experiments can be found in Figures S2,S8, S10, S11, and S12 as well as File S5. Additional data fortranscriptional profiling experiments can be found in FiguresS3, S4, S5, S7, and S9 as well as File S6. Additional data foroptical density based proliferation experiments can be foundin Figures S6 and S8 as well as File S7.
All raw spectrum (.RAW) files from the MSP-MS and pro-teomics experiments reported in this study are available fordownload from the MassIVE resource (https://massive.ucsd.edu/ProteoSAFe/static/massive.jsp), numbers MSV000085279(MSP-MS) and MSV000085283 (proteomics). Supplementalmaterial is available at figshare: https://doi.org/10.25386/genetics.12818894.
Results
Opaque cells secrete more proteolytic activity thanwhite cells
Toassess secretedproteolytic activity usingaglobal approach,we profiled conditioned media using the MSP-MS assay(O’Donoghue et al. 2012). In brief, white or opaque cell con-ditionedmedia were incubatedwith a library of 228 synthetic14-mer peptides, and the resulting cleavage products (at 15,60, and 240 min) were identified by liquid chromatography-tandem mass spectrometry (LC-MS/MS). We note that theseexperiments were performed with cells grown in mediumcontaining ammonium sulfate; as such, these results reflectthe “basal” activity of proteases rather than the activitiesinduced when proteins are provided as the sole nitrogensource.
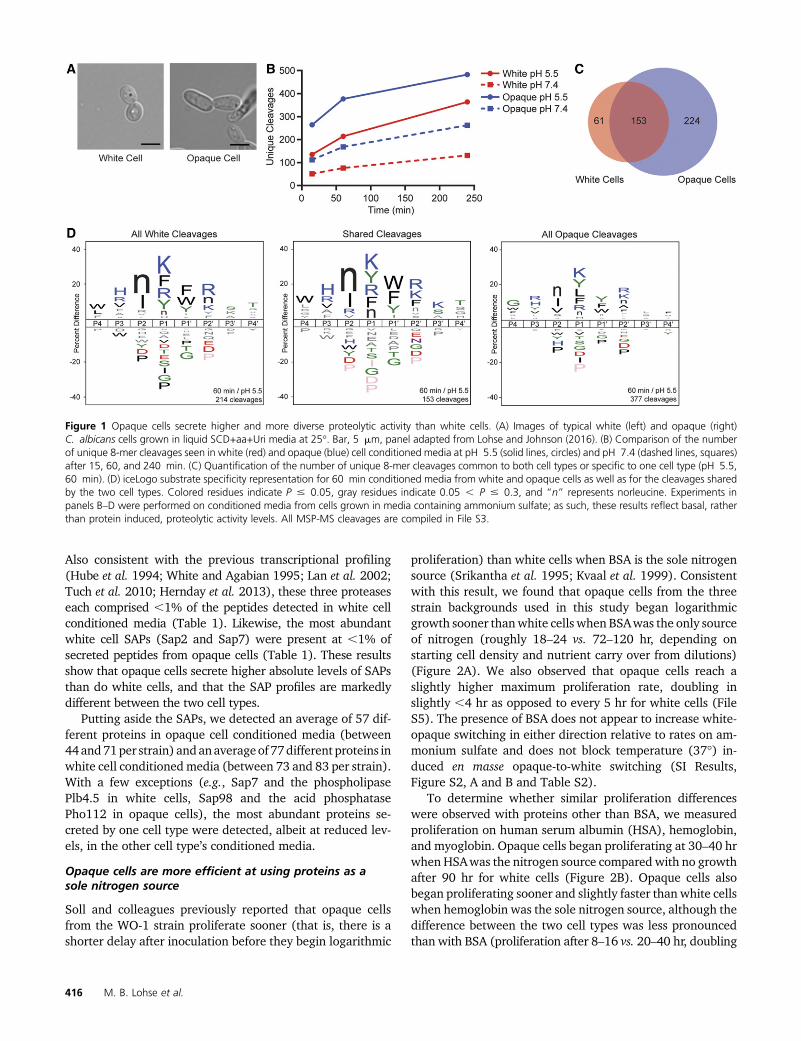
Opaque cell conditioned media exhibited higher proteo-lytic activity at each timepoint examinedbasedon thenumberof unique cleavage events (377 opaque vs. 214 white cleav-ages after 60 min at pH 5.5) (Figure 1, B and C and File S3).In general, cleavages observed in white cell conditioned me-dia were also observed in opaque cells (between 67% and80%), while a majority of opaque cell cleavages (between47 and 69%) are specific to opaque cell conditioned media(Figure S1A and File S3). Furthermore, we observed between
1.8- and 3.0-fold higher proteolytic activity at pH 5.5 than atpH 7.4, consistent with the reported preference of certainSAPs for acidic conditions (Koelsch et al. 2000; Aoki et al.2011) (Figure 1B and Figure S1A).
To determine global protease substrate specificities, wegenerated iceLogo (Colaert et al. 2009) representations of theMSP-MS data. The iceLogos incorporate both cleaved anduncleaved positions in the peptide library to display enrich-ment for or against specific amino acids within four positionsof the cleavage site (P4 to P49, with cleavage occurring be-tween P1 and P19). At the 60 min time point, many featuresare shared between the white and opaque cleavage profiles.For example, there is an enrichment for hydrophobic (nor-leucine, phenylalanine, tyrosine) and positively charged (ly-sine, arginine) residues at the P1 positions (Figure 1D).Despite these broad similarities in cleavage preferences,there are several noticeable differences between the twocleavage profiles. For example, opaque cells show a prefer-ence (relative to white cells) for glycine at P4, valine at P2,and leucine at P1 (Figure 1D). Both the white and opaqueconditioned media show certain specificity preferences thatare characteristic of recombinantly produced Sap5 and Sap6(which are normally expressed in C. albicans biofilms)(Winter et al. 2016), and, given the similarity among theSAP gene sequences (Parra-Ortega et al. 2009), it is likelythat the MSP-MS data from both cell types are dominatedby secreted SAP proteins.
We also collected cell-free conditioned media from whiteand opaque cells, added BSA, and evaluated BSA cleavageover the courseof2hr. Inagreementwith theoverall increasedproteolytic activity observed in theMSP-MSassay, opaque cellconditionedmedia cleavedmost of the BSAwithin 15min andmultiple cleavage products were observed by 2 hr (FigureS1B). White cell conditioned media, on the other hand,cleaved only a small fraction of the BSA to generate a singlepredominant cleavage product by 2 hr (Figure S1B).
Opaque cells secrete different SAPs than white cells
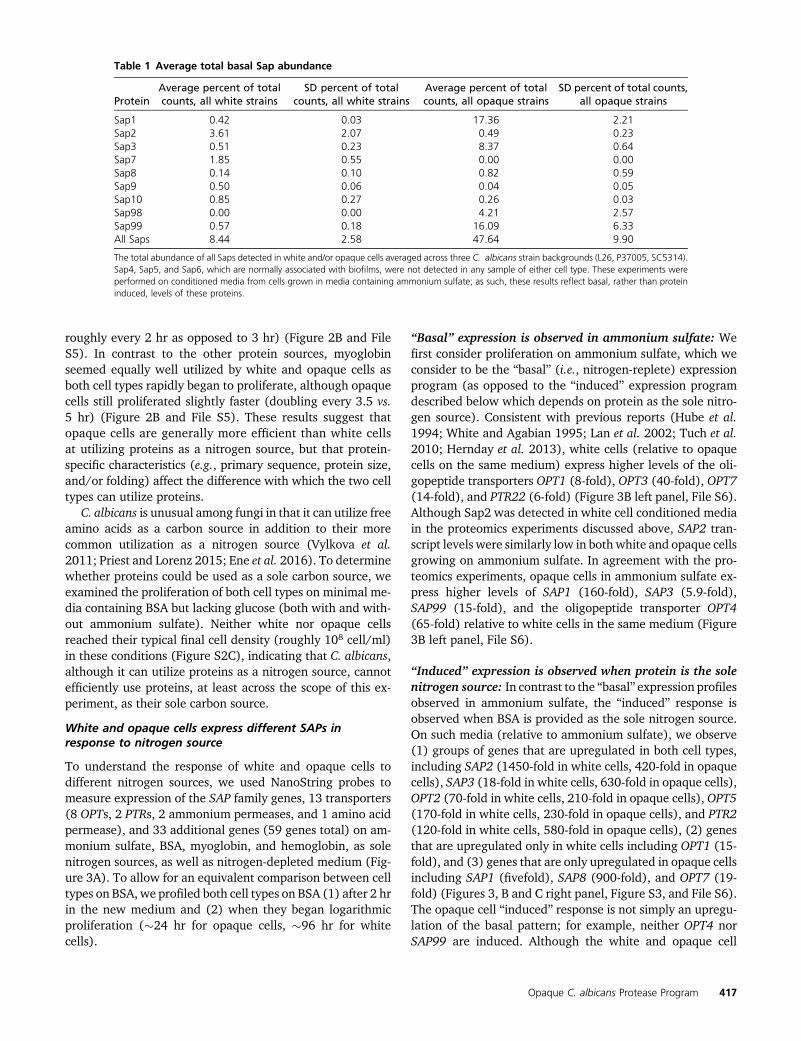
To relate the proteolytic activities of the two cell types tospecific proteases, we performed shotgun proteomic analyseson white and opaque cell conditioned media (from cellsgrown on media containing ammonium sulfate) from threeswitching-capable strain backgrounds [SC5314, L26, and P37005(Lockhart et al. 2002)] (File S4). Nine unique SAPs weredetected in this experiment (Tables 1 and Table S1). Onaverage, SAPs comprised 8% of peptides detected in whitecell conditioned media and 48% of peptides detected in opa-que cell conditioned media (Table 1). In absolute terms, opa-que cells secreted around five times the amount of SAPs aswhite cells. Consistent with previous transcriptional profiling(Hube et al. 1994; White and Agabian 1995), Sap2 was themost abundant SAP secreted by white cells, at 4% of detectedpeptides (Table 1). For opaque cells, Sap1 was the mostabundant SAP, at 17% of detected peptides (Table 1).Sap99 and Sap3 were also abundant in opaque cells, com-prising 16 and 8% of detected peptides, respectively (Table 1).
Opaque C. albicans Protease Program 415
Also consistent with the previous transcriptional profiling(Hube et al. 1994; White and Agabian 1995; Lan et al. 2002;Tuch et al. 2010; Hernday et al. 2013), these three proteaseseach comprised ,1% of the peptides detected in white cellconditioned media (Table 1). Likewise, the most abundantwhite cell SAPs (Sap2 and Sap7) were present at ,1% ofsecreted peptides from opaque cells (Table 1). These resultsshow that opaque cells secrete higher absolute levels of SAPsthan do white cells, and that the SAP profiles are markedlydifferent between the two cell types.
Putting aside the SAPs, we detected an average of 57 dif-ferent proteins in opaque cell conditioned media (between44and71per strain) andanaverageof 77different proteins inwhite cell conditionedmedia (between 73 and 83 per strain).With a few exceptions (e.g., Sap7 and the phospholipasePlb4.5 in white cells, Sap98 and the acid phosphatasePho112 in opaque cells), the most abundant proteins se-creted by one cell type were detected, albeit at reduced lev-els, in the other cell type’s conditioned media.
Opaque cells are more efficient at using proteins as asole nitrogen source
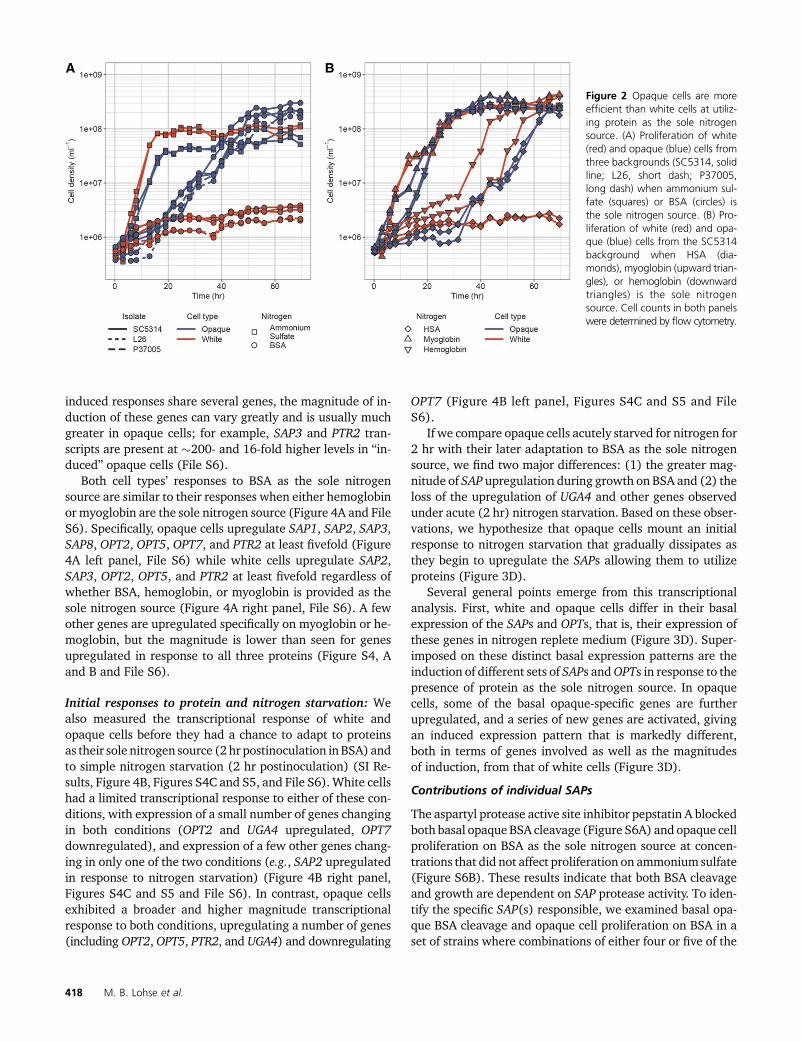
Soll and colleagues previously reported that opaque cellsfrom the WO-1 strain proliferate sooner (that is, there is ashorter delay after inoculation before they begin logarithmic
proliferation) than white cells when BSA is the sole nitrogensource (Srikantha et al. 1995; Kvaal et al. 1999). Consistentwith this result, we found that opaque cells from the threestrain backgrounds used in this study began logarithmicgrowth sooner thanwhite cells when BSAwas the only sourceof nitrogen (roughly 18–24 vs. 72–120 hr, depending onstarting cell density and nutrient carry over from dilutions)(Figure 2A). We also observed that opaque cells reach aslightly higher maximum proliferation rate, doubling inslightly ,4 hr as opposed to every 5 hr for white cells (FileS5). The presence of BSA does not appear to increase white-opaque switching in either direction relative to rates on am-monium sulfate and does not block temperature (37�) in-duced en masse opaque-to-white switching (SI Results,Figure S2, A and B and Table S2).
To determine whether similar proliferation differenceswere observed with proteins other than BSA, we measuredproliferation on human serum albumin (HSA), hemoglobin,and myoglobin. Opaque cells began proliferating at 30–40 hrwhen HSAwas the nitrogen source compared with no growthafter 90 hr for white cells (Figure 2B). Opaque cells alsobegan proliferating sooner and slightly faster than white cellswhen hemoglobin was the sole nitrogen source, although thedifference between the two cell types was less pronouncedthan with BSA (proliferation after 8–16 vs. 20–40 hr, doubling
Figure 1 Opaque cells secrete higher and more diverse proteolytic activity than white cells. (A) Images of typical white (left) and opaque (right)C. albicans cells grown in liquid SCD+aa+Uri media at 25�. Bar, 5 mm, panel adapted from Lohse and Johnson (2016). (B) Comparison of the numberof unique 8-mer cleavages seen in white (red) and opaque (blue) cell conditioned media at pH 5.5 (solid lines, circles) and pH 7.4 (dashed lines, squares)after 15, 60, and 240 min. (C) Quantification of the number of unique 8-mer cleavages common to both cell types or specific to one cell type (pH 5.5,60 min). (D) iceLogo substrate specificity representation for 60 min conditioned media from white and opaque cells as well as for the cleavages sharedby the two cell types. Colored residues indicate P # 0.05, gray residues indicate 0.05 , P # 0.3, and “n” represents norleucine. Experiments inpanels B–D were performed on conditioned media from cells grown in media containing ammonium sulfate; as such, these results reflect basal, ratherthan protein induced, proteolytic activity levels. All MSP-MS cleavages are compiled in File S3.
416 M. B. Lohse et al.
roughly every 2 hr as opposed to 3 hr) (Figure 2B and FileS5). In contrast to the other protein sources, myoglobinseemed equally well utilized by white and opaque cells asboth cell types rapidly began to proliferate, although opaquecells still proliferated slightly faster (doubling every 3.5 vs.5 hr) (Figure 2B and File S5). These results suggest thatopaque cells are generally more efficient than white cellsat utilizing proteins as a nitrogen source, but that protein-specific characteristics (e.g., primary sequence, protein size,and/or folding) affect the difference with which the two celltypes can utilize proteins.
C. albicans is unusual among fungi in that it can utilize freeamino acids as a carbon source in addition to their morecommon utilization as a nitrogen source (Vylkova et al.2011; Priest and Lorenz 2015; Ene et al. 2016). To determinewhether proteins could be used as a sole carbon source, weexamined the proliferation of both cell types on minimal me-dia containing BSA but lacking glucose (both with and with-out ammonium sulfate). Neither white nor opaque cellsreached their typical final cell density (roughly 108 cell/ml)in these conditions (Figure S2C), indicating that C. albicans,although it can utilize proteins as a nitrogen source, cannotefficiently use proteins, at least across the scope of this ex-periment, as their sole carbon source.
White and opaque cells express different SAPs inresponse to nitrogen source
To understand the response of white and opaque cells todifferent nitrogen sources, we used NanoString probes tomeasure expression of the SAP family genes, 13 transporters(8 OPTs, 2 PTRs, 2 ammonium permeases, and 1 amino acidpermease), and 33 additional genes (59 genes total) on am-monium sulfate, BSA, myoglobin, and hemoglobin, as solenitrogen sources, as well as nitrogen-depleted medium (Fig-ure 3A). To allow for an equivalent comparison between celltypes on BSA, we profiled both cell types on BSA (1) after 2 hrin the new medium and (2) when they began logarithmicproliferation (�24 hr for opaque cells, �96 hr for whitecells).
“Basal” expression is observed in ammonium sulfate: Wefirst consider proliferation on ammonium sulfate, which weconsider to be the “basal” (i.e., nitrogen-replete) expressionprogram (as opposed to the “induced” expression programdescribed below which depends on protein as the sole nitro-gen source). Consistent with previous reports (Hube et al.1994; White and Agabian 1995; Lan et al. 2002; Tuch et al.2010; Hernday et al. 2013), white cells (relative to opaquecells on the same medium) express higher levels of the oli-gopeptide transporters OPT1 (8-fold), OPT3 (40-fold), OPT7(14-fold), and PTR22 (6-fold) (Figure 3B left panel, File S6).Although Sap2 was detected in white cell conditioned mediain the proteomics experiments discussed above, SAP2 tran-script levels were similarly low in bothwhite and opaque cellsgrowing on ammonium sulfate. In agreement with the pro-teomics experiments, opaque cells in ammonium sulfate ex-press higher levels of SAP1 (160-fold), SAP3 (5.9-fold),SAP99 (15-fold), and the oligopeptide transporter OPT4(65-fold) relative to white cells in the same medium (Figure3B left panel, File S6).
“Induced” expression is observed when protein is the solenitrogen source: In contrast to the “basal” expression profilesobserved in ammonium sulfate, the “induced” response isobserved when BSA is provided as the sole nitrogen source.On such media (relative to ammonium sulfate), we observe(1) groups of genes that are upregulated in both cell types,including SAP2 (1450-fold in white cells, 420-fold in opaquecells), SAP3 (18-fold in white cells, 630-fold in opaque cells),OPT2 (70-fold in white cells, 210-fold in opaque cells), OPT5(170-fold in white cells, 230-fold in opaque cells), and PTR2(120-fold in white cells, 580-fold in opaque cells), (2) genesthat are upregulated only in white cells including OPT1 (15-fold), and (3) genes that are only upregulated in opaque cellsincluding SAP1 (fivefold), SAP8 (900-fold), and OPT7 (19-fold) (Figures 3, B and C right panel, Figure S3, and File S6).The opaque cell “induced” response is not simply an upregu-lation of the basal pattern; for example, neither OPT4 norSAP99 are induced. Although the white and opaque cell
Table 1 Average total basal Sap abundance
ProteinAverage percent of totalcounts, all white strains
SD percent of totalcounts, all white strains
Average percent of totalcounts, all opaque strains
SD percent of total counts,all opaque strains
Sap1 0.42 0.03 17.36 2.21Sap2 3.61 2.07 0.49 0.23Sap3 0.51 0.23 8.37 0.64Sap7 1.85 0.55 0.00 0.00Sap8 0.14 0.10 0.82 0.59Sap9 0.50 0.06 0.04 0.05Sap10 0.85 0.27 0.26 0.03Sap98 0.00 0.00 4.21 2.57Sap99 0.57 0.18 16.09 6.33All Saps 8.44 2.58 47.64 9.90
The total abundance of all Saps detected in white and/or opaque cells averaged across three C. albicans strain backgrounds (L26, P37005, SC5314).Sap4, Sap5, and Sap6, which are normally associated with biofilms, were not detected in any sample of either cell type. These experiments wereperformed on conditioned media from cells grown in media containing ammonium sulfate; as such, these results reflect basal, rather than proteininduced, levels of these proteins.
Opaque C. albicans Protease Program 417
induced responses share several genes, the magnitude of in-duction of these genes can vary greatly and is usually muchgreater in opaque cells; for example, SAP3 and PTR2 tran-scripts are present at �200- and 16-fold higher levels in “in-duced” opaque cells (File S6).
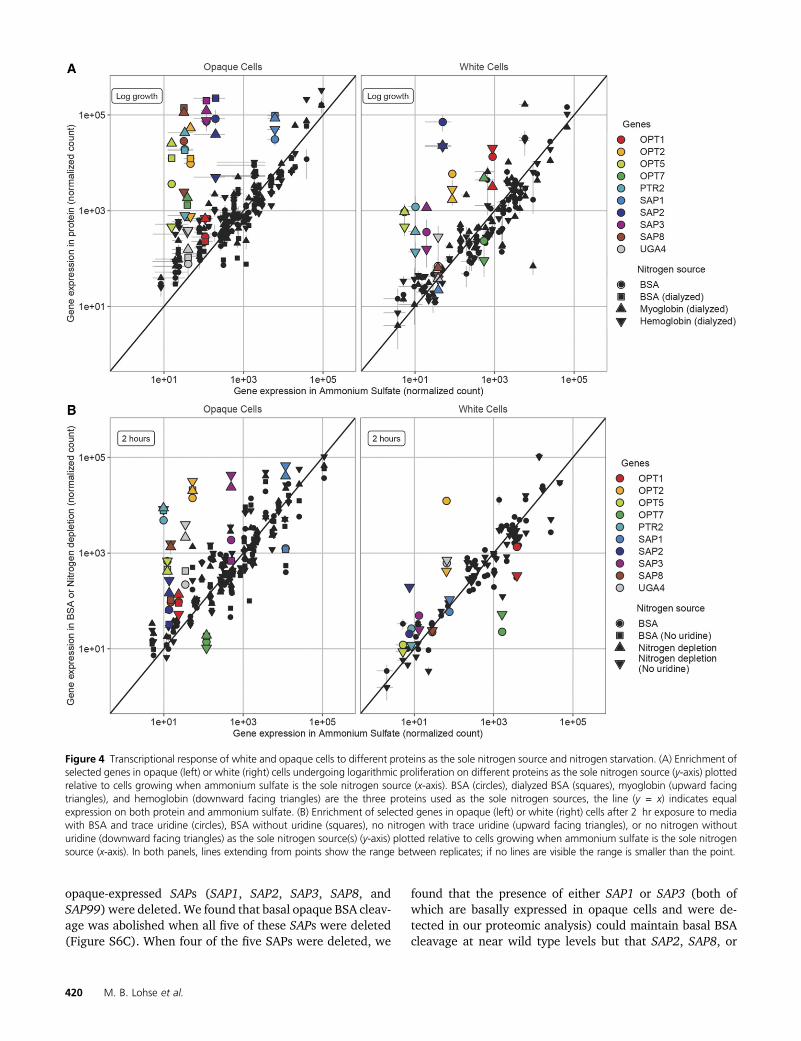
Both cell types’ responses to BSA as the sole nitrogensource are similar to their responses when either hemoglobinor myoglobin are the sole nitrogen source (Figure 4A and FileS6). Specifically, opaque cells upregulate SAP1, SAP2, SAP3,SAP8, OPT2, OPT5, OPT7, and PTR2 at least fivefold (Figure4A left panel, File S6) while white cells upregulate SAP2,SAP3, OPT2, OPT5, and PTR2 at least fivefold regardless ofwhether BSA, hemoglobin, or myoglobin is provided as thesole nitrogen source (Figure 4A right panel, File S6). A fewother genes are upregulated specifically on myoglobin or he-moglobin, but the magnitude is lower than seen for genesupregulated in response to all three proteins (Figure S4, Aand B and File S6).
Initial responses to protein and nitrogen starvation: Wealso measured the transcriptional response of white andopaque cells before they had a chance to adapt to proteinsas their sole nitrogen source (2 hr postinoculation in BSA) andto simple nitrogen starvation (2 hr postinoculation) (SI Re-sults, Figure 4B, Figures S4C and S5, and File S6). White cellshad a limited transcriptional response to either of these con-ditions, with expression of a small number of genes changingin both conditions (OPT2 and UGA4 upregulated, OPT7downregulated), and expression of a few other genes chang-ing in only one of the two conditions (e.g., SAP2 upregulatedin response to nitrogen starvation) (Figure 4B right panel,Figures S4C and S5 and File S6). In contrast, opaque cellsexhibited a broader and higher magnitude transcriptionalresponse to both conditions, upregulating a number of genes(including OPT2, OPT5, PTR2, and UGA4) and downregulating
OPT7 (Figure 4B left panel, Figures S4C and S5 and FileS6).
If we compare opaque cells acutely starved for nitrogen for2 hr with their later adaptation to BSA as the sole nitrogensource, we find two major differences: (1) the greater mag-nitude of SAP upregulation during growth on BSA and (2) theloss of the upregulation of UGA4 and other genes observedunder acute (2 hr) nitrogen starvation. Based on these obser-vations, we hypothesize that opaque cells mount an initialresponse to nitrogen starvation that gradually dissipates asthey begin to upregulate the SAPs allowing them to utilizeproteins (Figure 3D).
Several general points emerge from this transcriptionalanalysis. First, white and opaque cells differ in their basalexpression of the SAPs and OPTs, that is, their expression ofthese genes in nitrogen replete medium (Figure 3D). Super-imposed on these distinct basal expression patterns are theinduction of different sets of SAPs andOPTs in response to thepresence of protein as the sole nitrogen source. In opaquecells, some of the basal opaque-specific genes are furtherupregulated, and a series of new genes are activated, givingan induced expression pattern that is markedly different,both in terms of genes involved as well as the magnitudesof induction, from that of white cells (Figure 3D).
Contributions of individual SAPs
The aspartyl protease active site inhibitor pepstatin A blockedboth basal opaque BSA cleavage (Figure S6A) and opaque cellproliferation on BSA as the sole nitrogen source at concen-trations that did not affect proliferation on ammonium sulfate(Figure S6B). These results indicate that both BSA cleavageand growth are dependent on SAP protease activity. To iden-tify the specific SAP(s) responsible, we examined basal opa-que BSA cleavage and opaque cell proliferation on BSA in aset of strains where combinations of either four or five of the
Figure 2 Opaque cells are moreefficient than white cells at utiliz-ing protein as the sole nitrogensource. (A) Proliferation of white(red) and opaque (blue) cells fromthree backgrounds (SC5314, solidline; L26, short dash; P37005,long dash) when ammonium sul-fate (squares) or BSA (circles) isthe sole nitrogen source. (B) Pro-liferation of white (red) and opa-que (blue) cells from the SC5314background when HSA (dia-monds), myoglobin (upward trian-gles), or hemoglobin (downwardtriangles) is the sole nitrogensource. Cell counts in both panelswere determined by flow cytometry.
418 M. B. Lohse et al.
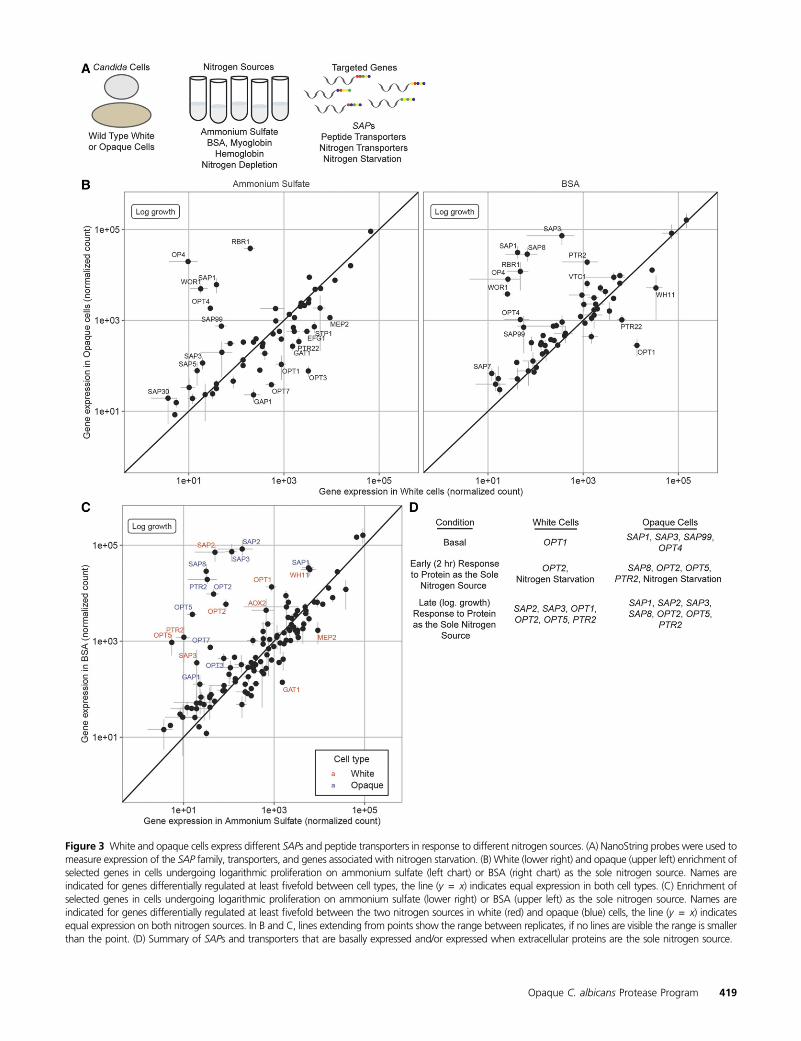
Figure 3 White and opaque cells express different SAPs and peptide transporters in response to different nitrogen sources. (A) NanoString probes were used tomeasure expression of the SAP family, transporters, and genes associated with nitrogen starvation. (B) White (lower right) and opaque (upper left) enrichment ofselected genes in cells undergoing logarithmic proliferation on ammonium sulfate (left chart) or BSA (right chart) as the sole nitrogen source. Names areindicated for genes differentially regulated at least fivefold between cell types, the line (y = x) indicates equal expression in both cell types. (C) Enrichment ofselected genes in cells undergoing logarithmic proliferation on ammonium sulfate (lower right) or BSA (upper left) as the sole nitrogen source. Names areindicated for genes differentially regulated at least fivefold between the two nitrogen sources in white (red) and opaque (blue) cells, the line (y = x) indicatesequal expression on both nitrogen sources. In B and C, lines extending from points show the range between replicates, if no lines are visible the range is smallerthan the point. (D) Summary of SAPs and transporters that are basally expressed and/or expressed when extracellular proteins are the sole nitrogen source.
Opaque C. albicans Protease Program 419
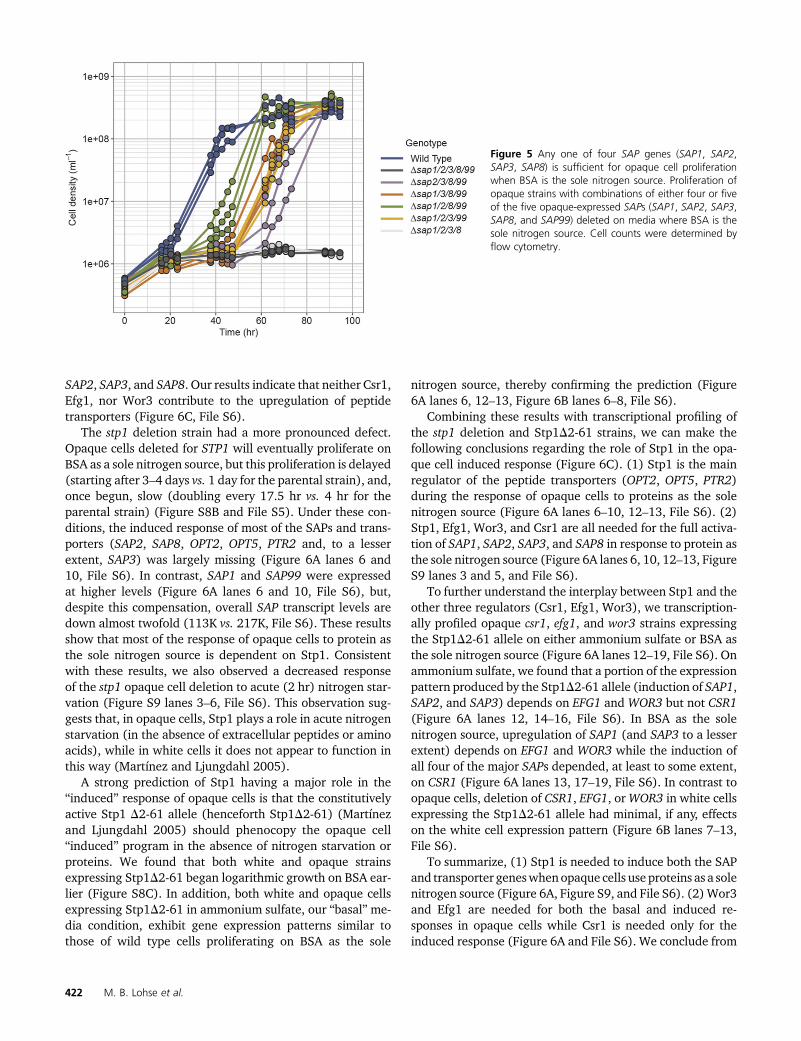
opaque-expressed SAPs (SAP1, SAP2, SAP3, SAP8, andSAP99) were deleted. We found that basal opaque BSA cleav-age was abolished when all five of these SAPs were deleted(Figure S6C). When four of the five SAPs were deleted, we
found that the presence of either SAP1 or SAP3 (both ofwhich are basally expressed in opaque cells and were de-tected in our proteomic analysis) could maintain basal BSAcleavage at near wild type levels but that SAP2, SAP8, or
Figure 4 Transcriptional response of white and opaque cells to different proteins as the sole nitrogen source and nitrogen starvation. (A) Enrichment ofselected genes in opaque (left) or white (right) cells undergoing logarithmic proliferation on different proteins as the sole nitrogen source (y-axis) plottedrelative to cells growing when ammonium sulfate is the sole nitrogen source (x-axis). BSA (circles), dialyzed BSA (squares), myoglobin (upward facingtriangles), and hemoglobin (downward facing triangles) are the three proteins used as the sole nitrogen sources, the line (y = x) indicates equalexpression on both protein and ammonium sulfate. (B) Enrichment of selected genes in opaque (left) or white (right) cells after 2 hr exposure to mediawith BSA and trace uridine (circles), BSA without uridine (squares), no nitrogen with trace uridine (upward facing triangles), or no nitrogen withouturidine (downward facing triangles) as the sole nitrogen source(s) (y-axis) plotted relative to cells growing when ammonium sulfate is the sole nitrogensource (x-axis). In both panels, lines extending from points show the range between replicates; if no lines are visible the range is smaller than the point.
420 M. B. Lohse et al.
SAP99 alone did not support cleavage (Figure S6C). As SAP2and SAP8 are not basally expressed by opaque cells, theirinability to support BSA cleavage is not unexpected; however,the inability of SAP99 to support opaque BSA cleavage was asurprise as SAP99 is basally expressed and was detected inthe proteomic analysis.
Efficient opaque cell proliferation onBSAas a sole nitrogensource was abolished (for at least 7 days, the extent of theexperiment) when all five SAPs were deleted (Figure 5). Thepresence of either SAP1, SAP2, SAP3, or SAP8, but notSAP99, was sufficient to allow opaque cell proliferation onBSA, although this proliferation was delayed relative to thewild type strain (Figure 5 and File S5). This result is consis-tent with our transcriptional profiling in that all four of theSAPs (SAP1, SAP2, SAP3, and SAP8) that supported growthare highly induced. We note that the delay before opaquecells begin to proliferate when BSA is the sole nitrogen sourceis longer (by 15–35 hr) when only one SAP gene is present,but, once they begin, the proliferation rates were slightlyfaster than the parental strain (doubling times of roughly3.2–3.3 hr vs. 3.8 hr) (File S5). We believe that the delaybefore active proliferation (henceforth referred to as “lag”)reflects the time it takes to produce sufficient BSA cleavageproducts at a rate needed for logarithmic growth.
We did not observe significant changes in the basal expres-sion of SAP4-SAP7, SAP9, SAP10, or SAP30 when SAP1,SAP2, SAP3, SAP8, and SAP99 were deleted (Figure S7 andFile S6), suggesting that there is no compensatory upregula-tion in response to the loss of basal opaque cell SAP expres-sion. The only exception was an increase in SAP98 expressionwhen SAP99 was deleted, but these two genes are adjacentand we believe that this upregulation is likely the result of thenearby genetic manipulation. As SAP98 does not appear tocontribute to growth on BSA as a nitrogen source (a numberof deletion strains containing it failed to cleave BSA or pro-liferate), we do not consider it further. Finally, we note thatdeletions of either four or five of the opaque-expressed SAPs(SAP1, SAP2, SAP3, SAP8, and SAP99) do not appear to blockor increase white-opaque switching in either direction (TableS3, SI Results, File S1).
Control of opaque cell basal proteolytic activity
To identify regulators controlling opaque cells’ basal proteo-lytic activity, we screened a library of 188 opaque transcrip-tion regulator deletion strains (Lohse et al. 2016) for loss ofBSA cleavage in conditionedmedia. Only 2 of the 188 opaquestrains tested, the efg1 and wor3 deletions, lacked basal opa-que cell proteolytic activity as monitored by BSA cleavage(Figure S8A). Both Efg1 and Wor3 are known regulators ofwhite-opaque switching and both are required for full expres-sion of the opaque cell transcriptional program (Sonnebornet al. 1999; Zordan et al. 2007; Hernday et al. 2013; Lohseet al. 2013). In addition, Efg1 has previously been linked toSAP expression in the oral epithelial cell and parenchymalorgan invasion models, although these experiments wereconducted with white cells (Felk et al. 2002; Korting et al.
2003). Because WOR3 expression in opaque cells is depen-dent on the presence of Efg1 (Hernday et al. 2013), the mostparsimonious explanation for the efg1 phenotype is that itreflects the loss of WOR3 expression rather than a Wor3-independent mechanism.
To understand the roles of Efg1 and Wor3 in expressingbasal opaque cell proteolytic activity, we used NanoStringprobes to profile expression of the wor3 and efg1 deletionstrains proliferating in ammonium sulfate. Consistent withthe BSA cleavage results, we observed that expression ofthe basal opaque program (defined by upregulation ofSAP1, SAP3, SAP99, and OPT4 relative to white cells in thesame medium) was lost in both the opaque wor3 and efg1deletion strains (Figure 6A lanes 1–3, File S6). In contrast,deletion of STP1 or CSR1 (which contribute to the opaque cellresponse to proteins as the sole nitrogen source as describedbelow), affected neither basal opaque proteolytic activity norexpression of the basal opaque program (Figure 6A lanes 1,4–5, Figure S8A, File S6). These results differ from whitecells, where the stp1 deletion strain affected basal white cellexpression of OPT1 and SAP2, consistent with previous re-ports (Martínez and Ljungdahl 2005). The csr1, efg1, andwor3 deletions, on the other hand, had minimal or no effecton basal white cell expression of OPT1 or SAP2 (Figure 6B,lanes 1–5, File S6).
Regulation of the opaque cell response to protein as thesole nitrogen source
To identify regulators controlling opaque cells’ ability to useproteins as a nitrogen source (which requires the inducedresponse), we screened the aforementioned library of188 opaque transcription regulator deletion strains (Lohseet al. 2016) for failure to proliferate when BSA was the solenitrogen source. In this screen, only the stp1 deletion strainshowed a pronounced proliferation defect, with no detect-able growth after 3 days. This result is consistent with pre-vious reports that Stp1 was necessary for white cellproliferation on BSA (Martínez and Ljungdahl 2005). Thecsr1, efg1, andwor3 deletion strains exhibited milder defects,showing either late and/or slow proliferation relative to wildtype (Figure S8B, File S1, S5, and S7).
In order to understand the relationships among Stp1, Csr1,Efg1, andWor3 in opaque cells, weusedNanoString probes toprofile expression of logarithmically proliferating opaquecsr1, efg1, stp1, and wor3 deletion strains when BSA is thesole nitrogen source. Expression of SAP1, SAP2, and SAP3was reduced between 18- and 330-fold (relative to wild type)when EFG1 or WOR3 were deleted and expression of SAP2,SAP3, and SAP8 was reduced between 5- and 25-fold (rela-tive to wild type) when CSR1 was deleted (Figure 6A lanes6–9, File S6). Deletion of CSR1, EFG1, or WOR3 had minimaleffect on the expression of the transportersOPT2,OPT5,OPT7,or PTR2 under these conditions (Figure 6A lanes 6–9, File S6).We interpret these results to indicate that Efg1 and Wor3are important for the upregulation of SAP1, SAP2, andSAP3, while Csr1 is important for the upregulation of
Opaque C. albicans Protease Program 421
SAP2, SAP3, and SAP8. Our results indicate that neither Csr1,Efg1, nor Wor3 contribute to the upregulation of peptidetransporters (Figure 6C, File S6).
The stp1 deletion strain had a more pronounced defect.Opaque cells deleted for STP1 will eventually proliferate onBSA as a sole nitrogen source, but this proliferation is delayed(starting after 3–4 days vs. 1 day for the parental strain), and,once begun, slow (doubling every 17.5 hr vs. 4 hr for theparental strain) (Figure S8B and File S5). Under these con-ditions, the induced response of most of the SAPs and trans-porters (SAP2, SAP8, OPT2, OPT5, PTR2 and, to a lesserextent, SAP3) was largely missing (Figure 6A lanes 6 and10, File S6). In contrast, SAP1 and SAP99 were expressedat higher levels (Figure 6A lanes 6 and 10, File S6), but,despite this compensation, overall SAP transcript levels aredown almost twofold (113K vs. 217K, File S6). These resultsshow that most of the response of opaque cells to protein asthe sole nitrogen source is dependent on Stp1. Consistentwith these results, we also observed a decreased responseof the stp1 opaque cell deletion to acute (2 hr) nitrogen star-vation (Figure S9 lanes 3–6, File S6). This observation sug-gests that, in opaque cells, Stp1 plays a role in acute nitrogenstarvation (in the absence of extracellular peptides or aminoacids), while in white cells it does not appear to function inthis way (Martínez and Ljungdahl 2005).
A strong prediction of Stp1 having a major role in the“induced” response of opaque cells is that the constitutivelyactive Stp1 D2-61 allele (henceforth Stp1D2-61) (Martínezand Ljungdahl 2005) should phenocopy the opaque cell“induced” program in the absence of nitrogen starvation orproteins. We found that both white and opaque strainsexpressing Stp1D2-61 began logarithmic growth on BSA ear-lier (Figure S8C). In addition, both white and opaque cellsexpressing Stp1D2-61 in ammonium sulfate, our “basal”me-dia condition, exhibit gene expression patterns similar tothose of wild type cells proliferating on BSA as the sole
nitrogen source, thereby confirming the prediction (Figure6A lanes 6, 12–13, Figure 6B lanes 6–8, File S6).
Combining these results with transcriptional profiling ofthe stp1 deletion and Stp1D2-61 strains, we can make thefollowing conclusions regarding the role of Stp1 in the opa-que cell induced response (Figure 6C). (1) Stp1 is the mainregulator of the peptide transporters (OPT2, OPT5, PTR2)during the response of opaque cells to proteins as the solenitrogen source (Figure 6A lanes 6–10, 12–13, File S6). (2)Stp1, Efg1, Wor3, and Csr1 are all needed for the full activa-tion of SAP1, SAP2, SAP3, and SAP8 in response to protein asthe sole nitrogen source (Figure 6A lanes 6, 10, 12–13, FigureS9 lanes 3 and 5, and File S6).
To further understand the interplay between Stp1 and theother three regulators (Csr1, Efg1, Wor3), we transcription-ally profiled opaque csr1, efg1, and wor3 strains expressingthe Stp1D2-61 allele on either ammonium sulfate or BSA asthe sole nitrogen source (Figure 6A lanes 12–19, File S6). Onammonium sulfate, we found that a portion of the expressionpattern produced by the Stp1D2-61 allele (induction of SAP1,SAP2, and SAP3) depends on EFG1 and WOR3 but not CSR1(Figure 6A lanes 12, 14–16, File S6). In BSA as the solenitrogen source, upregulation of SAP1 (and SAP3 to a lesserextent) depends on EFG1 and WOR3 while the induction ofall four of the major SAPs depended, at least to some extent,on CSR1 (Figure 6A lanes 13, 17–19, File S6). In contrast toopaque cells, deletion of CSR1, EFG1, orWOR3 in white cellsexpressing the Stp1D2-61 allele had minimal, if any, effectson the white cell expression pattern (Figure 6B lanes 7–13,File S6).
To summarize, (1) Stp1 is needed to induce both the SAPand transporter geneswhenopaque cells use proteins as a solenitrogen source (Figure 6A, Figure S9, and File S6). (2)Wor3and Efg1 are needed for both the basal and induced re-sponses in opaque cells while Csr1 is needed only for theinduced response (Figure 6A and File S6). We conclude from
Figure 5 Any one of four SAP genes (SAP1, SAP2,SAP3, SAP8) is sufficient for opaque cell proliferationwhen BSA is the sole nitrogen source. Proliferation ofopaque strains with combinations of either four or fiveof the five opaque-expressed SAPs (SAP1, SAP2, SAP3,SAP8, and SAP99) deleted on media where BSA is thesole nitrogen source. Cell counts were determined byflow cytometry.
422 M. B. Lohse et al.
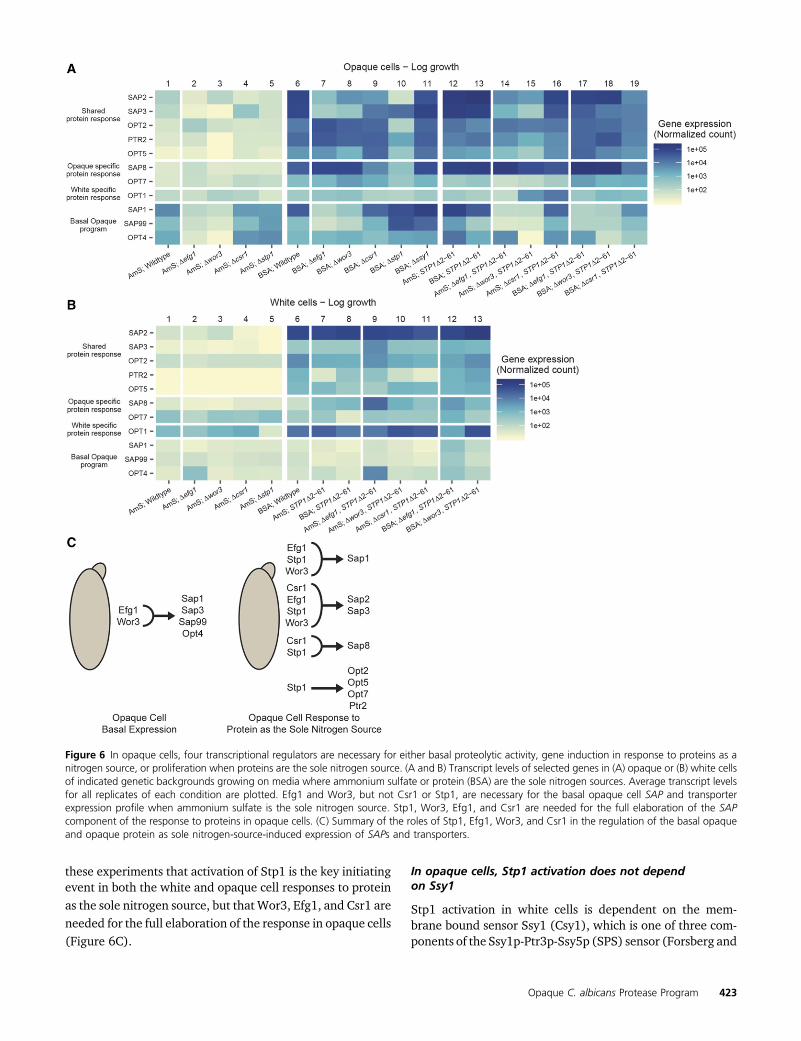
these experiments that activation of Stp1 is the key initiatingevent in both the white and opaque cell responses to proteinas the sole nitrogen source, but that Wor3, Efg1, and Csr1 areneeded for the full elaboration of the response in opaque cells(Figure 6C).
In opaque cells, Stp1 activation does not dependon Ssy1
Stp1 activation in white cells is dependent on the mem-brane bound sensor Ssy1 (Csy1), which is one of three com-ponents of the Ssy1p-Ptr3p-Ssy5p (SPS) sensor (Forsberg and
Figure 6 In opaque cells, four transcriptional regulators are necessary for either basal proteolytic activity, gene induction in response to proteins as anitrogen source, or proliferation when proteins are the sole nitrogen source. (A and B) Transcript levels of selected genes in (A) opaque or (B) white cellsof indicated genetic backgrounds growing on media where ammonium sulfate or protein (BSA) are the sole nitrogen sources. Average transcript levelsfor all replicates of each condition are plotted. Efg1 and Wor3, but not Csr1 or Stp1, are necessary for the basal opaque cell SAP and transporterexpression profile when ammonium sulfate is the sole nitrogen source. Stp1, Wor3, Efg1, and Csr1 are needed for the full elaboration of the SAPcomponent of the response to proteins in opaque cells. (C) Summary of the roles of Stp1, Efg1, Wor3, and Csr1 in the regulation of the basal opaqueand opaque protein as sole nitrogen-source-induced expression of SAPs and transporters.
Opaque C. albicans Protease Program 423
Ljungdahl 2001). Deletion of SSY1 in white cells blocks Stp1truncation, and thus activation, in response to extracellularamino acids (Martínez and Ljungdahl 2005). We deletedSSY1 to determine if it was also necessary for the opaque cellinduced response. Although proliferation of an opaque ssy1deletion strain on BSA as the sole nitrogen source was slightlydelayed (roughly 24–36 hr vs. 18–24 hr) and slower (dou-bling every 4.5 vs. 4 hr) than wild type (Figure S8B and FileS5), we found that the transcriptional profile of opaque ssy1deletion cells growing logarithmically on BSA was similar tothat of wild type opaque cells (and the Stp1D2-61 strain)rather than the stp1 deletion strain (Figure 6A lanes 6, 10–13 and File S6). Thus, we conclude that the full transcrip-tional response of opaque cells to protein as the sole nitrogensource requires Stp1, Wor3, Efg1, and Csr1 but not Ssy1,while the more limited response in white cells requiresStp1 and Ssy1 but not the other three regulators. It remainsto be determined, however, whether the Ssy1-independentmechanism utilizes the other components of the SPS sensor(Ptr3/Ssy5) or an entirely different signaling pathway.
A minority opaque cell population supports white cellproliferation on BSA as a sole nitrogen source
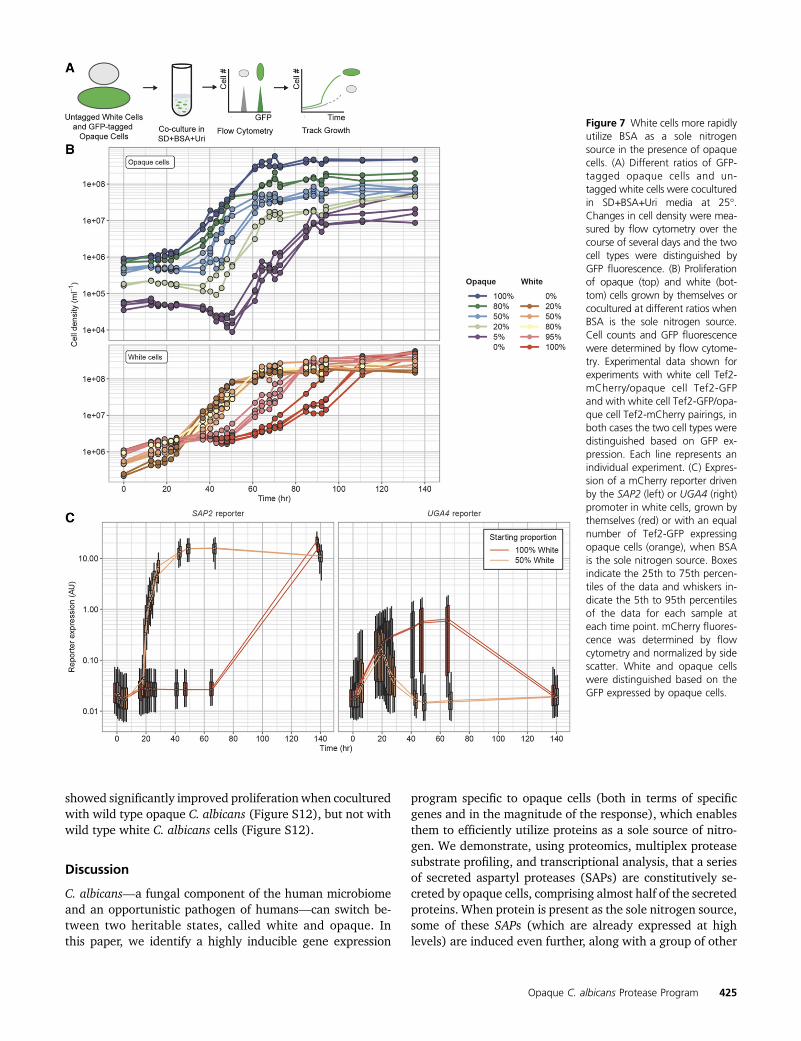
We tested whether the induction of the SAPs in opaque cellscould help white cells utilize BSA as a sole nitrogen source byco-incubating white and opaque cells tagged with differentfluorescent markers and tracking the proliferation of each celltype over several days using flow cytometry (Figure 7A). In thepresence of BSA as the sole nitrogen source, pure opaque celland white cell populations began logarithmic proliferation af-ter�24 and 60–72 hr, respectively, with the proliferation rate,once the cells begin to divide, being faster in opaque cells(doubling every 3.5–4.5 hr vs. every 6–9 hr) (Figure 7B andFile S5). These results are consistent with those describedearlier based on single strain measurements (Figure 2A), in-dicating that the fluorescent markers did not significantly af-fect the relative growth rates. In populations that contained20% opaque cells and 80% white cells, both cell types beganproliferation after 24–36 hr and both proliferated at moresimilar rates (Figure 7B and File S5). Even a small fractionof opaque cells (,5%) had a significant effect on white cellproliferation in the presence of BSA as the sole nitrogensource, and we found that the maximum proliferation rate ofwhite cells increased with the fraction of opaque cells (Figure7B and File S5). The early proliferation of white cells did notoccur when they were cocultured with the opaque quintupleSAP deletion strain, indicating that the increase in white cellproliferation in cocultures was dependent on Saps secreted byopaque cells (Figure S10 and File S5).
To further explore this “helping” effect, we asked whetherwild type opaque cells could rescue the opaque quintuple SAPdeletion strain or the opaque stp1 deletion strain, neither ofwhich can efficiently utilize BSA as the sole nitrogen source.We found that wild type opaque cells could completely rescuethe quintuple SAP deletion strain (which actually proliferatedslightly faster than wild type, doubling every 2.9 vs. 3.2 hr),
and could partially rescue the stp1 deletion strain (which dou-bled every 5.8 hr) (Figure S10 and File S5). These observa-tions suggest that the growth defect of the quintuple SAPdeletion stems solely from a lack of SAP-cleaved peptidesrather than a more general inability to efficiently utilize pep-tides. Given that the opaque stp1 deletion strain fails to inducethe peptide transporters (OPT2, OPT5, PTR2), we interpret itsinability to be fully rescued as a failure to take up BSA cleavageproducts. The increased proliferation rates of the quintupleSAP deletion strain and several of the quadruple SAP deletionstrains relative to the parental strain on BSA suggests thatthere may be a fitness cost associated with the burden ofexpressing and secreting SAPs at high levels (File S5).
Our coculture experiments suggest that the receiving cellsmust actively respond in order to take full advantage of Sapcleavage products. To test this idea, we determined whetherwhite cells mounted a specific response to BSA as a solenitrogen source only in the presence of opaque cells. Weperformed coculture experiments with a GFP tagged wildtype opaque strain and white strains with mCherry reportersdriven by the OPT1, OPT2, SAP2, or UGA4 promoters. In purepopulations of white cells exposed to BSA as the sole nitrogensource, neither SAP2 nor OPT1 expression is fully upregu-lated within 60 hr and, conversely, OPT2 and UGA4 (whichare induced simply by nitrogen starvation) are upregulatedwithin 18 hr and remain fully induced after 60 hr (Figure 7Cand Figure S11A). In the presence of wild type opaque cells,however, there is a noticeable increase in SAP2 expressionafter 19 hr, which continues to increase until it is fullyexpressed in all white cells by 42 hr (Figure 7C). Likewise,OPT1 levels begin to increase (relative to a pure white cellpopulation) within 18 hr and appear fully induced within24 hr (Figure S11A). Expression of OPT2 and UGA4, on theother hand, noticeably begins to decrease (relative to a purewhite cell population) after 18–24 hr and reached theirlocal minimum within 42 hr in the presence of opaque cells(Figure 7C and Figure S11A). These results indicate that notonly does the presence of opaque cells allow white cells toproliferate in the presence of BSA as the sole nitrogen source,but that the white cells respond differently (and sooner) toBSA as the sole nitrogen source in the presence of opaque cells.
The results of these experiments donot distinguishwhetherthe “signal” from opaque to white cells is simply the presenceof BSA cleavage products or some other molecule secreted byopaque cells. To answer this question, white cells were incu-bated with BSA that had been pretreated with proteinase K,and we observed upregulation of SAP2 and OPT1 and down-regulation of UGA4 relative to levels in white cells exposed tointact BSA (Figure S11B). This result argues strongly that, inthe coculture experiments, BSA peptides produced by opaquecells are the signal for white cells to respond.
To test whether the helping effect of opaque cells for whitecells extended across species, we performed similar cocultureexperiments with C. dubliniensis, C. tropicalis, and C. para-psilosis, none of which can efficiently utilize BSA as the solenitrogen source (Figure S12). All three of these species
424 M. B. Lohse et al.
showed significantly improved proliferation when coculturedwith wild type opaque C. albicans (Figure S12), but not withwild type white C. albicans cells (Figure S12).
Discussion
C. albicans—a fungal component of the human microbiomeand an opportunistic pathogen of humans—can switch be-tween two heritable states, called white and opaque. Inthis paper, we identify a highly inducible gene expression
program specific to opaque cells (both in terms of specificgenes and in the magnitude of the response), which enablesthem to efficiently utilize proteins as a sole source of nitro-gen. We demonstrate, using proteomics, multiplex proteasesubstrate profiling, and transcriptional analysis, that a seriesof secreted aspartyl proteases (SAPs) are constitutively se-creted by opaque cells, comprising almost half of the secretedproteins. When protein is present as the sole nitrogen source,some of these SAPs (which are already expressed at highlevels) are induced even further, along with a group of other
Figure 7 White cells more rapidlyutilize BSA as a sole nitrogensource in the presence of opaquecells. (A) Different ratios of GFP-tagged opaque cells and un-tagged white cells were coculturedin SD+BSA+Uri media at 25�.Changes in cell density were mea-sured by flow cytometry over thecourse of several days and the twocell types were distinguished byGFP fluorescence. (B) Proliferationof opaque (top) and white (bot-tom) cells grown by themselves orcocultured at different ratios whenBSA is the sole nitrogen source.Cell counts and GFP fluorescencewere determined by flow cytome-try. Experimental data shown forexperiments with white cell Tef2-mCherry/opaque cell Tef2-GFPand with white cell Tef2-GFP/opa-que cell Tef2-mCherry pairings, inboth cases the two cell types weredistinguished based on GFP ex-pression. Each line represents anindividual experiment. (C) Expres-sion of a mCherry reporter drivenby the SAP2 (left) or UGA4 (right)promoter in white cells, grown bythemselves (red) or with an equalnumber of Tef2-GFP expressingopaque cells (orange), when BSAis the sole nitrogen source. Boxesindicate the 25th to 75th percen-tiles of the data and whiskers in-dicate the 5th to 95th percentilesof the data for each sample ateach time point. mCherry fluores-cence was determined by flowcytometry and normalized by sidescatter. White and opaque cellswere distinguished based on theGFP expressed by opaque cells.
Opaque C. albicans Protease Program 425
genes including specific peptide transporters. We show thatthe protein-induced response is not simply an upregulation ofthe basal pattern, as other genes are also activated to producean entirely new pattern of gene expression. We show thatthese secreted proteases degrade generic proteins, whosepeptides can then be used as a nitrogen source. As a result,opaque cells proliferate faster than white cells in mediawhere protein is the sole nitrogen source; in nearly all othertypes of media, white cells outcompete opaque cells. Usingdeletion mutants, we identified the individual SAPs requiredfor opaque cells to efficiently utilize protein as a nitrogensource. In contrast to white cells, where a single SAP(SAP2) allows limited growth under these conditions(Hube et al. 1997), upregulation of any one of four opaque-induced SAPs (SAP1, SAP2, SAP3, SAP8) can suffice for effi-cient proliferation of opaque cells. Activation of Stp1—a pre-viously identified regulator of SAP genes in white cells(Martínez and Ljungdahl 2005)—is also key for the opa-que-specific upregulation, although the response differsgreatly between white and opaque cells. Compared to whitecells, opaque cells appear to activate Stp1 in a different way,and have incorporated at least three additional regulators(Wor3, Efg1, and Csr1) that act in concert with Stp1. It seemslikely that these differences contribute to both the timing ofthe response in opaque cells as well as its magnitude.
White and opaque cells differ in many properties, and areoften thought of as being specialized for different niches intheir mammalian hosts. In this work, we show that, in mixedcultures of white and opaque cells, a minority of opaque cells,by providing massive amounts of secreted proteases, canbenefit the entire culture. This result suggests that, ratherthan occupying separate niches in the host, the two types ofcells can work together to produce a population that can berobust to changing environments. White and opaque cellscarry identical genomes, and it is an intriguing idea that C.albicans’ ability to adapt to a wide range of environmentsmight be achieved, at least in part, by partitioning expressionof the genome between two different types of cooperatingcells, where each cell type has specific, but complementary,metabolic characteristics. In the case examined here, a smallsubpopulation of opaque cells could shoulder the burden ofexpressing SAPs at high levels, allowing white cells to thrivewhen proteins are the sole nitrogen source.
Such a partnership need not be limited to nitrogen acqui-sition, it could extend to a wide-range of other SAP-mediatedfunctions (e.g., interactions with bacteria (Dutton et al.2016), adhesion to host cells (Watts et al. 1998; Bekticet al. 2001; Albrecht et al. 2006), protection from host de-fense proteins (Borg-von Zepelin et al. 1998; Gropp et al.2009; Meiller et al. 2009; Rapala-Kozik et al. 2010, 2015;Bochenska et al. 2015; Kozik et al. 2015), and activation ofimmune responses (Schaller et al. 2005; Hornbach et al.2009; Pietrella et al. 2010; Pericolini et al. 2015; Gabrielliet al. 2016)). Additionally, white and opaque cells differ inmany more ways than their patterns of SAP expression;for example, differences have been observed in cell wall
associated proteins, metabolite production and use, and theresponses to specific environmental cues, suggesting otherpossibilities for collaboration between the cell types. Ourproteomics experiments showed preferential secretion ofthe phospholipase Plb4.5 by white cells and the acid phos-phatase Pho112 by opaque cells, suggesting a specific test-able example.
Finally, we note that the benefits of SAP-mediated nitrogenacquisition by opaque cells are not limited to C. albicans. Weshowed that three other species (C. dubliniensis, C. tropicalis,and C. parapsilosis), each of which, on its own, cannot effi-ciently proliferate on BSA as a sole nitrogen source, can do soin the presence of C. albicans opaque cells. There is no a priorireason that more distantly related fungi, or even bacteria,with the capacity to uptake and process short peptides couldnot also benefit from the presence of C. albicans opaque cells.
Acknowledgments
We thank Haley Gause, Carrie Graham, and Niyati Rodricksfor advice. We thank Ananda Mendoza for technical support.Support was provided by the University of California SanFrancisco (UCSF) Mass Spectrometry Facility (A.L. Burlin-game, Director) supported by the Dr. Miriam And SheldonG. Adelson Medical Research Foundation (AMRF) and theNational Institutes of Health (NIH) – National Institute ofGeneral Medical Sciences (NIGMS) NIH P41GM103481.This work was supported by NIH grants F32CA168150 (toM.B.W.), P50AI150476 (to C.S.C.) and R01AI049187 (toA.D.J.). This investigation has also been aided by a grantfrom The Jane Coffin Childs Memorial Fund for MedicalResearch (to N.Z.). The content is the sole responsibility ofthe authors and does not represent the views of the NIH orother funding agencies. Neither the NIH nor other fundingagencies had any role in the design of the study, in thecollection, analyses, or interpretation of data, in the writingof the manuscript, or in the decision to publish the results.Alexander D. Johnson is a cofounder of BioSynesis, Inc., acompany developing inhibitors and diagnostics of C. albicansbiofilms. Matthew Lohse was formerly an employee andcurrently is a consultant for BioSynesis, Inc.
Literature Cited
Achkar, J. M., and B. C. Fries, 2010 Candida infections of thegenitourinary tract. Clin. Microbiol. Rev. 23: 253–273. https://doi.org/10.1128/CMR.00076-09
Albrecht, A., A. Felk, I. Pichová, J. R. Naglik, M. Schaller et al.,2006 Glycosylphosphatidylinositol-anchored proteases ofCandida albicans target proteins necessary for both cellularprocesses and host-pathogen interactions. J. Biol. Chem. 281:688–694. https://doi.org/10.1074/jbc.M509297200
Anderson, M. Z., A. M. Porman, N. Wang, E. Mancera, D. Huanget al., 2016 A multistate toggle switch defines fungal cell fatesand is regulated by synergistic genetic cues. PLoS Genet. 12:e1006353. https://doi.org/10.1371/journal.pgen.1006353
Aoki, W., N. Kitahara, N. Miura, H. Morisaka, Y. Yamamoto et al.,2011 Comprehensive characterization of secreted aspartic
426 M. B. Lohse et al.
proteases encoded by a virulence gene family in Candida albicans.J. Biochem. 150: 431–438. https://doi.org/10.1093/jb/mvr073
Bektic, J., C. P. Lell, A. Fuchs, H. Stoiber, C. Speth et al., 2001 HIVprotease inhibitors attenuate adherence of Candida albicans toepithelial cells in vitro. FEMS Immunol. Med. Microbiol. 31: 65–71. https://doi.org/10.1111/j.1574-695X.2001.tb01588.x
Bergen, M. S., E. Voss, and D. R. Soll, 1990 Switching at thecellular level in the white-opaque transition of Candida albicans.J. Gen. Microbiol. 136: 1925–1936. https://doi.org/10.1099/00221287-136-10-1925
Blom, A. M., T. Hallström, and K. Riesbeck, 2009 Complementevasion strategies of pathogens-acquisition of inhibitors and be-yond. Mol. Immunol. 46: 2808–2817. https://doi.org/10.1016/j.molimm.2009.04.025
Bochenska, O., M. Rapala-Kozik, N. Wolak, W. Kamysz, D. Grzy-wacz et al., 2015 Inactivation of human kininogen-derived an-timicrobial peptides by secreted aspartic proteases produced bythe pathogenic yeast Candida albicans. Biol. Chem. 396: 1369–1375. https://doi.org/10.1515/hsz-2015-0167
Borg-von Zepelin, M., S. Beggah, K. Boggian, D. Sanglard, and M.Monod, 1998 The expression of the secreted aspartyl protein-ases Sap4 to Sap6 from Candida albicans in murine macro-phages. Mol. Microbiol. 28: 543–554. https://doi.org/10.1046/j.1365-2958.1998.00815.x
Calderone, R. A., and W. A. Fonzi, 2001 Virulence factors ofCandida albicans. Trends Microbiol. 9: 327–335. https://doi.org/10.1016/S0966-842X(01)02094-7
Chalkley, R. J., P. R. Baker, K. F. Medzihradszky, A. J. Lynn, and A. L.Burlingame, 2008 In-depth analysis of tandem mass spectrom-etry data from disparate instrument types. Mol. Cell. Proteomics7: 2386–2398. https://doi.org/10.1074/mcp.M800021-MCP200
Colaert, N., K. Helsens, L. Martens, J. Vandekerckhove, and K.Gevaert, 2009 Improved visualization of protein consensus se-quences by iceLogo. Nat. Methods 6: 786–787. https://doi.org/10.1038/nmeth1109-786
Dalal, C. K., I. A. Zuleta, M. B. Lohse, R. E. Zordan, H. El-Samadet al., 2019 A population shift between two heritable cell typesof the pathogen Candida albicans is based both on switching andselective proliferation. Proc. Natl. Acad. Sci. USA 116: 26918–26924. https://doi.org/10.1073/pnas.1908986116
Diggle, S. P., A. S. Griffin, G. S. Campbell, and S. A. West,2007 Cooperation and conflict in quorum-sensing bacterialpopulations. Nature 450: 411–414. https://doi.org/10.1038/nature06279
Dunkel, N., T. Hertlein, R. Franz, O. Reuss, C. Sasse et al.,2013 Roles of different peptide transporters in nutrient acqui-sition in Candida albicans. Eukaryot. Cell 12: 520–528. https://doi.org/10.1128/EC.00008-13
Dutton, L. C., H. F. Jenkinson, R. J. Lamont, and A. H. Nobbs,2016 Role of Candida albicans secreted aspartyl proteaseSap9 in interkingdom biofilm formation. Pathog. Dis. 74:ftw005. https://doi.org/10.1093/femspd/ftw005
Eggimann, P., J. Garbino, and D. Pittet, 2003 Epidemiology ofCandida species infections in critically ill non-immunosup-pressed patients. Lancet Infect. Dis. 3: 685–702. https://doi.org/10.1016/S1473-3099(03)00801-6
Ellis B., P. Haaland, F. Hahne, N. Le Meur, N. Gopalakrishnan, et al.,2019 flowCore: Basic structures for flow cytometry data. Rpackage version 1.50.0.
Ene, I. V., M. B. Lohse, A. V. Vladu, J. Morschhäuser, A. D. Johnsonet al., 2016 Phenotypic profiling reveals that Candida albicansopaque cells represent a metabolically specialized cell statecompared to default white cells. MBio 7: e01269-e16. https://doi.org/10.1128/mBio.01269-16
Felk, A., M. Kretschmar, A. Albrecht, M. Schaller, S. Beinhauer et al.,2002 Candida albicans hyphal formation and the expression ofthe Efg1-regulated proteinases Sap4 to Sap6 are required for the
invasion of parenchymal organs. Infect. Immun. 70: 3689–3700.https://doi.org/10.1128/IAI.70.7.3689-3700.2002
Forsberg, H., and P. O. Ljungdahl, 2001 Genetic and biochemicalanalysis of the yeast plasma membrane Ssy1p-Ptr3p-Ssy5p sen-sor of extracellular amino acids. Mol. Cell. Biol. 21: 814–826.https://doi.org/10.1128/MCB.21.3.814-826.2001
Gabrielli, E., S. Sabbatini, E. Roselletti, L. Kasper, S. Perito et al.,2016 In vivo induction of neutrophil chemotaxis by secretoryaspartyl proteinases of Candida albicans. Virulence 7: 819–825.https://doi.org/10.1080/21505594.2016.1184385
Geiger, J., D. Wessels, S. R. Lockhart, and D. R. Soll, 2004 Releaseof a potent polymorphonuclear leukocyte chemoattractant isregulated by white-opaque switching in Candida albicans. Infect.Immun. 72: 667–677. https://doi.org/10.1128/IAI.72.2.667-677.2004
Gropp, K., L. Schild, S. Schindler, B. Hube, P. F. Zipfel et al.,2009 The yeast Candida albicans evades human complementattack by secretion of aspartic proteases. Mol. Immunol. 47:465–475. https://doi.org/10.1016/j.molimm.2009.08.019
Gudlaugsson, O., S. Gillespie, K. Lee, J. Vande Berg, J. Hu et al.,2003 Attributable mortality of nosocomial candidemia, revisited.Clin. Infect. Dis. 37: 1172–1177. https://doi.org/10.1086/378745
Guerin, M., N. Camougrand, R. Caubet, S. Zniber, G. Velours et al.,1989 The second respiratory chain of Candida parapsilosis: acomprehensive study. Biochimie 71: 887–902. https://doi.org/10.1016/0300-9084(89)90072-2
Hernday, A. D., M. B. Lohse, P. M. Fordyce, C. J. Nobile, J. D. DeRisiet al., 2013 Structure of the transcriptional network control-ling white-opaque switching in Candida albicans. Mol. Micro-biol. 90: 22–35.
Hornbach, A., A. Heyken, L. Schild, B. Hube, J. Löffler et al.,2009 The glycosylphosphatidylinositol-anchored proteaseSap9 modulates the interaction of Candida albicans with humanneutrophils. Infect. Immun. 77: 5216–5224. https://doi.org/10.1128/IAI.00723-09
Hube, B., M. Monod, D. A. Schofield, A. J. P. Brown, and N. A. R.Gow, 1994 Expression of seven members of the gene familyencoding secretory aspartyl proteinases in Candida albicans.Mol. Microbiol. 14: 87–99. https://doi.org/10.1111/j.1365-2958.1994.tb01269.x
Hube, B., D. Sanglard, F. C. Odds, D. Hess, M. Monod et al.,1997 Disruption of each of the secreted aspartyl proteinasegenes SAP1, SAP2, and SAP3 of Candida albicans attenuatesvirulence. Infect. Immun. 65: 3529–3538. https://doi.org/10.1128/IAI.65.9.3529-3538.1997
Johnson, A., 2003 The biology of mating in Candida albicans. Nat.Rev. Microbiol. 1: 106–116. https://doi.org/10.1038/nrmi-cro752
Joly, S., C. Pujol, K. Schröppel, and D. R. Soll, 1996 Developmentof two species-specific fingerprinting probes for broad com-puter-assisted epidemiological studies of Candida tropicalis.J. Clin. Microbiol. 34: 3063–3071. https://doi.org/10.1128/JCM.34.12.3063-3071.1996
Kennedy, M. J., and P. A. Volz, 1985 Ecology of Candida albicansgut colonization: inhibition of Candida adhesion, colonization,and dissemination from the gastrointestinal tract by bacterialantagonism. Infect. Immun. 49: 654–663. https://doi.org/10.1128/IAI.49.3.654-663.1985
Kim, J., and P. Sudbery, 2011 Candida albicans, a major humanfungal pathogen. J. Microbiol. 49: 171–177. https://doi.org/10.1007/s12275-011-1064-7
Koelsch, G., J. Tang, J. A. Loy, M. Monod, K. Jackson et al.,2000 Enzymic characteristics of secreted aspartic proteasesof Candida albicans. Biochim. Biophys. Acta 1480: 117–131.https://doi.org/10.1016/S0167-4838(00)00068-6
Korting, H. C., B. Hube, S. Oberbauer, E. Januschke, G. Hamm et al.,2003 Reduced expression of the hyphal-independent Candida
Opaque C. albicans Protease Program 427
albicans proteinase genes SAP1 and SAP3 in the efg1 mutant isassociated with attenuated virulence during infection of oralepithelium. J. Med. Microbiol. 52: 623–632. https://doi.org/10.1099/jmm.0.05125-0
Koziel, J., and J. Potempa, 2013 Protease-armed bacteria in theskin. Cell Tissue Res. 351: 325–337. https://doi.org/10.1007/s00441-012-1355-2
Kozik, A., M. Gogol, O. Bochenska, J. Karkowska-Kuleta, N. Wolaket al., 2015 Kinin release from human kininogen by 10 asparticproteases produced by pathogenic yeast Candida albicans. BMCMicrobiol. 15: 60. https://doi.org/10.1186/s12866-015-0394-8
Kullberg, B. J., and A. M. L. Oude Lashof, 2002 Epidemiology ofopportunistic invasive mycoses. Eur. J. Med. Res. 7: 183–191.
Kumamoto, C. A., 2011 Inflammation and gastrointestinal Candidacolonization. Curr. Opin. Microbiol. 14: 386–391. https://doi.org/10.1016/j.mib.2011.07.015
Kvaal, C. A., T. Srikantha, and D. R. Soll, 1997 Misexpression of thewhite-phase-specific gene WH11 in the opaque phase of Candidaalbicans affects switching and virulence. Infect. Immun. 65:4468–4475. https://doi.org/10.1128/IAI.65.11.4468-4475.1997
Kvaal, C., S. A. Lachke, T. Srikantha, K. Daniels, J. McCoy et al.,1999 Misexpression of the opaque-phase-specific gene PEP1(SAP1) in the white phase of Candida albicans confers increasedvirulence in a mouse model of cutaneous infection. Infect. Im-mun. 67: 6652–6662. https://doi.org/10.1128/IAI.67.12.6652-6662.1999
Lan, C., G. Newport, L. Murillo, T. Jones, S. Scherer et al.,2002 Metabolic specialization associated with phenotypicswitching in Candida albicans. Proc. Natl. Acad. Sci. USA 99:14907–14912. https://doi.org/10.1073/pnas.232566499
Lin, C. H., S. Kabrawala, E. P. Fox, C. J. Nobile, A. D. Johnson et al.,2013 Genetic control of conventional and pheromone-stimu-lated biofilm formation in Candida albicans. PLoS Pathog. 9:e1003305. https://doi.org/10.1371/journal.ppat.1003305
Lockhart, S. R., C. Pujol, K. J. Daniels, M. G. Miller, A. D. Johnsonet al., 2002 In Candida albicans, white-opaque switchers arehomozygous for mating type. Genetics 162: 737–745.
Lohse, M. B., and A. D. Johnson, 2008 Differential phagocytosis ofwhite versus opaque Candida albicans by Drosophila and mousephagocytes. PLoS One 3: e1473. https://doi.org/10.1371/jour-nal.pone.0001473
Lohse, M. B., and A. D. Johnson, 2009 White-opaque switching inCandida albicans. Curr. Opin. Microbiol. 12: 650–654. https://doi.org/10.1016/j.mib.2009.09.010
Lohse, M. B., and A. D. Johnson, 2016 Identification and charac-terization of Wor4, a new transcriptional regulator of white-opaque switching. G3 (Bethesda) 6: 721–729. https://doi.org/10.1534/g3.115.024885
Lohse, M. B., A. D. Hernday, P. M. Fordyce, L. Noiman, T. R. Sorrellset al., 2013 Identification and characterization of a previouslyundescribed family of sequence-specific DNA-binding domains.Proc. Natl. Acad. Sci. USA 110: 7660–7665. https://doi.org/10.1073/pnas.1221734110
Lohse, M. B., I. V. Ene, V. B. Craik, A. D. Hernday, E. Mancera et al.,2016 Systematic genetic screen for transcriptional regulatorsof the Candida albicans white-opaque switch. Genetics 203:1679–1692. https://doi.org/10.1534/genetics.116.190645
Martínez, P., and P. O. Ljungdahl, 2005 Divergence of Stp1 andStp2 transcription factors in Candida albicans places virulencefactors required for proper nutrient acquisition under aminoacid control. Mol. Cell. Biol. 25: 9435–9446. https://doi.org/10.1128/MCB.25.21.9435-9446.2005
Meiller, T. F., B. Hube, L. Schild, M. E. Shirtliff, M. A. Scheperet al., 2009 A novel immune evasion strategy of Candidaalbicans: proteolytic cleavage of a salivary antimicrobial pep-tide. PLoS One 4: e5039. https://doi.org/10.1371/journal.pone.0005039
Miller, M. G., and A. D. Johnson, 2002 White-opaque switching inCandida albicans is controlled by mating-type locus homeodo-main proteins and allows efficient mating. Cell 110: 293–302.https://doi.org/10.1016/S0092-8674(02)00837-1
Morschhäuser, J., 2010 Regulation of white-opaque switching inCandida albicans. Med. Microbiol. Immunol. (Berl.) 199: 165–172. https://doi.org/10.1007/s00430-010-0147-0
Nelson, G., and T. W. Young, 1986 Yeast extracellular proteolyticenzymes for chill-proofing beer. J. Inst. Brew. 92: 599–603.https://doi.org/10.1002/j.2050-0416.1986.tb04460.x
Nguyen, N., M. M. F. Quail, and A. D. Hernday, 2017 An efficient,rapid, and recyclable system for CRISPR-mediated genome edit-ing in Candida albicans. MSphere 2: e00149-e17. https://doi.org/10.1128/mSphereDirect.00149-17
Noble, S. M., and A. D. Johnson, 2005 Strains and strategies forlarge-scale gene deletion studies of the diploid human fungalpathogen Candida albicans. Eukaryot. Cell 4: 298–309. https://doi.org/10.1128/EC.4.2.298-309.2005
O’Donoghue, A. J., A. A. Eroy-Reveles, G. M. Knudsen, J. Ingram,M. Zhou et al., 2012 Global identification of peptidase speci-ficity by multiplex substrate profiling. Nat. Methods 9: 1095–1100. https://doi.org/10.1038/nmeth.2182
O’Donoghue, A. J., G. M. Knudsen, C. Beekman, J. A. Perry, A. D.Johnson et al., 2015 Destructin-1 is a collagen-degrading endo-peptidase secreted by Pseudogymnoascus destructans, the causa-tive agent of white-nose syndrome. Proc. Natl. Acad. Sci. USA112: 7478–7483. https://doi.org/10.1073/pnas.1507082112
Pappas, P. G., J. H. Rex, J. D. Sobel, S. G. Filler, W. E. Dismukeset al., 2004 Guidelines for treatment of candidiasis. Clin. In-fect. Dis. 38: 161–189. https://doi.org/10.1086/380796
Park, Y., and J. Morschhäuser, 2005 Tetracycline-inducible geneexpression and gene deletion in Candida albicans. Eukaryot.Cell 4: 1328–1342. https://doi.org/10.1128/EC.4.8.1328-1342.2005
Parra-Ortega, B., H. Cruz-Torres, L. Villa-Tanaca, and C. Hernán-dez-Rodríguez, 2009 Phylogeny and evolution of the aspartylprotease family from clinically relevant Candida species. Mem.Inst. Oswaldo Cruz 104: 505–512. https://doi.org/10.1590/S0074-02762009000300018
Pericolini, E., E. Gabrielli, M. Amacker, L. Kasper, E. Roselletti et al.,2015 Secretory aspartyl proteinases cause vaginitis and canmediate vaginitis caused by Candida albicans in mice. MBio 6:e00724. https://doi.org/10.1128/mBio.00724-15
Pietrella, D., A. Rachini, N. Pandey, L. Schild, M. Netea et al.,2010 The inflammatory response induced by aspartic prote-ases of Candida albicans is independent of proteolytic activity.Infect. Immun. 78: 4754–4762. https://doi.org/10.1128/IAI.00789-10
Pietrocola, G., G. Nobile, S. Rindi, and P. Speziale, 2017 -Staphylococcus aureus manipulates innate immunity throughown and host-expressed proteases. Front. Cell. Infect. Microbiol.7: 166. https://doi.org/10.3389/fcimb.2017.00166
Porman, A. M., K. Alby, M. P. Hirakawa, and R. J. Bennett,2011 Discovery of a phenotypic switch regulating sexual mat-ing in the opportunistic fungal pathogen Candida tropicalis.Proc. Natl. Acad. Sci. USA 108: 21158–21163. https://doi.org/10.1073/pnas.1112076109
Priest, S. J., and M. C. Lorenz, 2015 Characterization of virulence-related phenotypes in Candida species of the CUG clade. Eukar-yot. Cell 14: 931–940. https://doi.org/10.1128/EC.00062-15
Pujol, C., K. J. Daniels, S. R. Lockhart, T. Srikantha, J. B. Radkeet al., 2004 The closely related species Candida albicans andCandida dubliniensis can mate. Eukaryot. Cell 3: 1015–1027.https://doi.org/10.1128/EC.3.4.1015-1027.2004
R Core Team, 2019 R: A language and environment for statisticalcomputing. R Foundation for Statistical Computing, Vienna,Austria, https://www.R-project.org/.
428 M. B. Lohse et al.
Rapala-Kozik, M., J. Karkowska-Kuleta, A. Ryzanowska, A. Golda,A. Barbasz et al., 2010 Degradation of human kininogens withthe release of kinin peptides by extracellular proteinases ofCandida spp. Biol. Chem. 391: 823–830. https://doi.org/10.1515/bc.2010.083
Rapala-Kozik, M., O. Bochenska, M. Zawrotniak, N. Wolak, G. Trebaczet al., 2015 Inactivation of the antifungal and immunomodula-tory properties of human cathelicidin LL-37 by aspartic proteasesproduced by the pathogenic yeast Candida albicans. Infect. Immun.83: 2518–2530. https://doi.org/10.1128/IAI.00023-15
Reuss, O., and J. Morschhäuser, 2006 A family of oligopeptidetransporters is required for growth of Candida albicans on pro-teins. Mol. Microbiol. 60: 795–812. https://doi.org/10.1111/j.1365-2958.2006.05136.x
Rikkerink, E. H., B. B. Magee, and P. T. Magee, 1988 Opaque-white phenotype transition: a programmed morphological tran-sition in Candida albicans. J. Bacteriol. 170: 895–899. https://doi.org/10.1128/JB.170.2.895-899.1988
Sasse, C., M. Hasenberg, M. Weyler, M. Gunzer, and J. Morschhäuser,2013 White-opaque switching of Candida albicans allows im-mune evasion in an environment-dependent fashion. Eukaryot.Cell 12: 50–58. https://doi.org/10.1128/EC.00266-12
Schaller, M., H. C. Korting, C. Borelli, G. Hamm, and B. Hube,2005 Candida albicans-secreted aspartic proteinases modifythe epithelial cytokine response in an in vitro model of vaginalcandidiasis. Infect. Immun. 73: 2758–2765. https://doi.org/10.1128/IAI.73.5.2758-2765.2005
Si, H., A. D. Hernday, M. P. Hirakawa, A. D. Johnson, and R. J.Bennett, 2013 Candida albicans white and opaque cells un-dergo distinct programs of filamentous growth. PLoS Pathog.9: e1003210. https://doi.org/10.1371/journal.ppat.1003210
Slutsky, B., M. Staebell, J. Anderson, L. Risen, M. Pfaller et al.,1987 “White-opaque transition”: a second high-frequencyswitching system in Candida albicans. J. Bacteriol. 169: 189–197. https://doi.org/10.1128/JB.169.1.189-197.1987
Soll, D. R., 2009 Why does Candida albicans switch? FEMS Yeast Res.9: 973–989. https://doi.org/10.1111/j.1567-1364.2009.00562.x
Soll, D. R., B. Morrow, and T. Srikantha, 1993 High-frequencyphenotypic switching in Candida albicans. Trends Genet. 9:61–65. https://doi.org/10.1016/0168-9525(93)90189-O
Sonneborn, A., B. Tebarth, and J. Ernst, 1999 Control of white-opaque phenotypic switching in Candida albicans by the Efg1pmorphogenetic regulator. Infect. Immun. 67: 4655–4660.https://doi.org/10.1128/IAI.67.9.4655-4660.1999
Srikantha, T., B. Morrow, K. Schröppel, and D. R. Soll, 1995 Thefrequency of integrative transformation at phase-specific genes ofCandida albicans correlates with their transcriptional state. Mol.Gen. Genet. 246: 342–352. https://doi.org/10.1007/BF00288607
Staib, F., 1965 Serum-proteins as nitrogen source for yeastlikefungi. Sabouraudia 4: 187–193. https://doi.org/10.1080/00362176685190421
Sullivan, D. J., T. J. Westerneng, K. A. Haynes, D. E. Bennett, and D.C. Coleman, 1995 Candida dubliniensis sp. nov.: phenotypic andmolecular characterization of a novel species associated with oralcandidosis in HIV-infected individuals. Microbiology 141: 1507–1521. https://doi.org/10.1099/13500872-141-7-1507
Takagi, J., S. D. Singh-Babak, M. B. Lohse, C. K. Dalal, and A. D.Johnson, 2019 Candida albicans white and opaque cells ex-hibit distinct spectra of organ colonization in mouse models ofinfection. PLoS One 14: e0218037. https://doi.org/10.1371/journal.pone.0218037
Tuch, B. B., Q. M. Mitrovich, O. R. Homann, A. D. Hernday, C. K.Monighetti et al., 2010 The transcriptomes of two heritable celltypes illuminate the circuit governing their differentiation. PLoSGenet. 6: e1001070. https://doi.org/10.1371/journal.pgen.1001070
Van, P., W. Jiang, R. Gottardo, and G. Finak, 2018 ggCyto: nextgeneration open-source visualization software for cytometry. Bi-oinformatics 34: 3951–3953. https://doi.org/10.1093/bioinformatics/bty441
Vylkova, S., A. J. Carman, H. A. Danhof, J. R. Collette, H. Zhouet al., 2011 The fungal pathogen Candida albicans autoinduceshyphal morphogenesis by raising extracellular pH. MBio 2:e00055-11. https://doi.org/10.1128/mBio.00055-11
Watts, H. J., F. S. Cheah, B. Hube, D. Sanglard, and N. A. Gow,1998 Altered adherence in strains of Candida albicans har-bouring null mutations in secreted aspartic proteinase genes.FEMS Microbiol. Lett. 159: 129–135. https://doi.org/10.1111/j.1574-6968.1998.tb12851.x
Wenzel, R. P., 1995 Nosocomial candidemia: risk factors and at-tributable mortality. Clin. Infect. Dis. 20: 1531–1534. https://doi.org/10.1093/clinids/20.6.1531
Wey, S. B., M. Mori, M. A. Pfaller, R. F. Woolson, and R. P. Wenzel,1988 Hospital-acquired candidemia. The attributable mortalityand excess length of stay. Arch. Intern. Med. 148: 2642–2645.https://doi.org/10.1001/archinte.1988.00380120094019
White, T. C., and N. Agabian, 1995 Candida albicans secretedaspartyl proteinases: isoenzyme pattern is determined by celltype, and levels are determined by environmental factors.J. Bacteriol. 177: 5215–5221. https://doi.org/10.1128/JB.177.18.5215-5221.1995
White, R. C., F. F. Gunderson, J. Y. Tyson, K. H. Richardson, T. J.Portlock et al., 2018 Type II secretion-dependent aminopepti-dase LapA and acyltransferase PlaC are redundant for nutrientacquisition during Legionella pneumophila intracellular infectionof amoebas. MBio 9: e00528-18. https://doi.org/10.1128/mBio.00528-18
Wickham, H., 2017 tidyverse: Easily Install and Load the “Tidy-verse.” R Package Version 1.2.1 https://CRAN.R-project.org/package=tidyverse.
Winter, M. B., E. C. Salcedo, M. B. Lohse, N. Hartooni, M. Gulatiet al., 2016 Global identification of biofilm-specific proteolysisin Candida albicans. MBio 7: e01514-16. https://doi.org/10.1128/mBio.01514-16
Winter, M. B., F. La Greca, S. Arastu-Kapur, F. Caiazza, P. Cimer-mancic et al., 2017 Immunoproteasome functions explainedby divergence in cleavage specificity and regulation. eLife 6:e27364. https://doi.org/10.7554/eLife.27364
Ziv, N., M. L. Siegal, and D. Gresham, 2013 Genetic and nonge-netic determinants of cell growth variation assessed by high-throughput microscopy. Mol. Biol. Evol. 30: 2568–2578. https://doi.org/10.1093/molbev/mst138
Zordan, R. E., D. J. Galgoczy, and A. D. Johnson, 2006 Epigeneticproperties of white-opaque switching in Candida albicans arebased on a self-sustaining transcriptional feedback loop. Proc.Natl. Acad. Sci. USA 103: 12807–12812. https://doi.org/10.1073/pnas.0605138103
Zordan, R., M. Miller, D. Galgoczy, B. Tuch, and A. Johnson,2007 Interlocking transcriptional feedback loops controlwhite-opaque switching in Candida albicans. PLoS Biol. 5:e256. https://doi.org/10.1371/journal.pbio.0050256
Communicating editor: A. Hinnebusch
Opaque C. albicans Protease Program 429