Embed Size (px)
Citation preview
AN OPEN-CIRCUIT-VOLTAGE MODEL OF LITHIUM-ION BATTERIES FOREFFECTIVE INCREMENTAL CAPACITY ANALYSIS
Caihao Weng∗
Department of Naval Architectureand Marine EngineeringUniversity of Michigan
Ann Arbor, Michigan 48109Email: [email protected]
Jing Sun
Department of Naval Architectureand Marine EngineeringUniversity of Michigan
Ann Arbor, Michigan 48109Email: [email protected]
Huei Peng
Department of Mechanical EngineeringUniversity of Michigan
Ann Arbor, Michigan 48109Email: [email protected]
ABSTRACTOpen-Circuit-Voltage (OCV) is an essential part of battery
models for state-of-charge (SOC) estimation. In this paper, wepropose a new parametric OCV model, which considers the stag-ing phenomenon during the lithium intercalation/deintercalationprocess. Results show that the new parametric model improvesSOC estimation accuracy compared to other existing OCV mod-els. Moreover, the model is shown to be suitable and effectivefor battery state-of-health monitoring. In particular, the newOCV model can be used for incremental capacity analysis (ICA),which reveals important information on the cell behavior associ-ated with its electrochemical properties and aging status.
INTRODUCTIONWith the widespread use of lithium-ion batteries for energy
storage, the development of reliable and efficient battery man-agement systems (BMS) has become a crucial task [1–3]. Twoimportant functions of BMS are the state-of-charge (SOC) es-timation and state-of-health (SOH) determination [4, 5]. SOCis commonly defined as “the percentage of the maximum possi-ble charge that is present inside a rechargeable battery” (in thisstudy, SOC is defined with respect to the current total capacity),and SOH is “a ‘measure’ that reflects the general condition ofa battery and its ability to deliver the specified performance incomparison with a fresh battery” [6]. Typically, the quantitativedefinition of SOH is based either on the battery capacity or theinternal resistance, depending on specific applications.
The on-line estimation of battery SOC has been studied ex-
∗Address all correspondence to this author.
tensively in literature (see Ref. [7] and references therein). Mostof those methods, including the extended Kalman filter (EKF)approach [8–10], require an accurate open-circuit-voltage (OCV)model which relates OCV to SOC [7, 11, 12]. The OCV-SOCfunction is implemented either as a look-up table or an analyti-cal expression, while the latter has several advantages includingcomputational efficiency (since no interpolation is needed) andease for analysis [13].
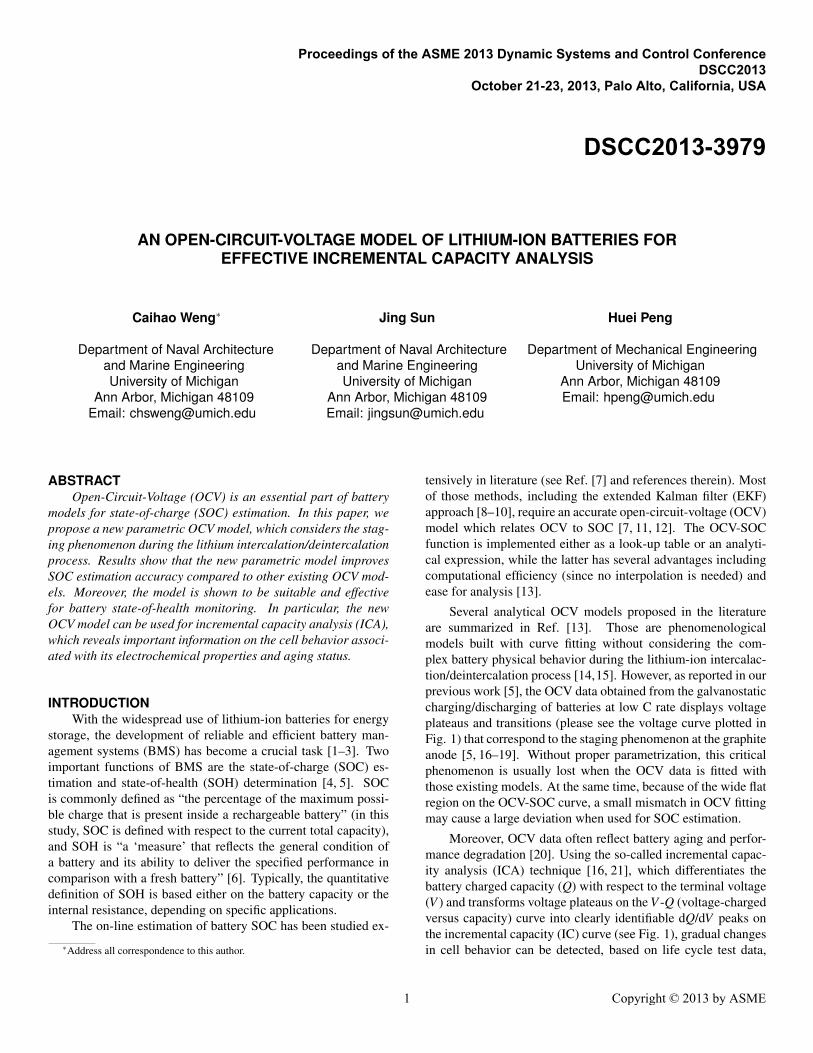
Several analytical OCV models proposed in the literatureare summarized in Ref. [13]. Those are phenomenologicalmodels built with curve fitting without considering the com-plex battery physical behavior during the lithium-ion intercalac-tion/deintercalation process [14,15]. However, as reported in ourprevious work [5], the OCV data obtained from the galvanostaticcharging/discharging of batteries at low C rate displays voltageplateaus and transitions (please see the voltage curve plotted inFig. 1) that correspond to the staging phenomenon at the graphiteanode [5, 16–19]. Without proper parametrization, this criticalphenomenon is usually lost when the OCV data is fitted withthose existing models. At the same time, because of the wide flatregion on the OCV-SOC curve, a small mismatch in OCV fittingmay cause a large deviation when used for SOC estimation.
Moreover, OCV data often reflect battery aging and perfor-mance degradation [20]. Using the so-called incremental capac-ity analysis (ICA) technique [16, 21], which differentiates thebattery charged capacity (Q) with respect to the terminal voltage(V ) and transforms voltage plateaus on the V -Q (voltage-chargedversus capacity) curve into clearly identifiable dQ/dV peaks onthe incremental capacity (IC) curve (see Fig. 1), gradual changesin cell behavior can be detected, based on life cycle test data,
1 Copyright © 2013 by ASME
Proceedings of the ASME 2013 Dynamic Systems and Control Conference DSCC2013
October 21-23, 2013, Palo Alto, California, USA
DSCC2013-3979
0.1 0.2 0.3 0.4 0.5 0.6 0.7 0.8 0.9 12.8
3
3.2
3.4
Charged Capacity (Ah)
Mea
sure
d V
olta
ge (
V)
3.15 3.2 3.25 3.3 3.350
20
40
60
Measured Voltage (V)
Incr
emen
tal C
apac
ity (
Ah/
V)
Figure 1. ICA PERFORMED ON CHARGING VOLTAGE CURVE AT 120
C RATE
with greater sensitivity than those based on conventional meth-ods [22]. One major challenge in ICA for battery aging analysisis its sensitivity to measurement noise. Since all the peaks on anIC curve lie within the flat region of the OCV curve, computingthe derivatives directly from the data set often leads to inaccurateand undesirable results, even after careful data filtering. By de-signing an OCV model that captures those voltage plateaus andthe subtle transitions over the flat region, one can perform ICAwithout using numerical derivative to study battery performance,thereby revealing useful information associated with its electro-chemical properties and aging status [22, 23]. Therefore, for thepurposes of both SOC estimation and SOH monitoring throughICA, an OCV model that can capture the underlying physicalprocess over the flat region and be capable of supporting ICA isneeded.
In this paper, we propose a new parametric OCV model forlithium-ion batteries that considers the staging phenomenon dur-ing the lithium intercalation/deintercalation process. The modelis intended for both SOC estimation and SOH monitoring. Thestudy is based on a battery life cycle test data set collected fromeight different A123 LiFePO4 cells over a period of 18 months.
The remainder of this paper is organized as follows. First,the development and parametrization of the new OCV model isproposed. Then we compare the new OCV model with otherexisting models in terms of OCV data fitting and SOC estimationaccuracy. After that we elucidate the application of the new OCVmodel for SOH monitoring, followed by the conclusions.
A NEW OPEN-CIRCUIT-VOLTAGE MODELWe propose a new OCV model structure that can capture
the lithium-ion intercalaction/deintercalation process while fit-ting the OCV-SOC data. Instead of measuring the OCV after along relaxation period at different SOC levels that span the en-
tire operating range, the data used for the development of the ourOCV model are collected by charging/discharging a LiFePO4battery cell at 1
20 C rate. The upper and lower cut-off voltagelimits are 3.6V and 2.1V respectively.
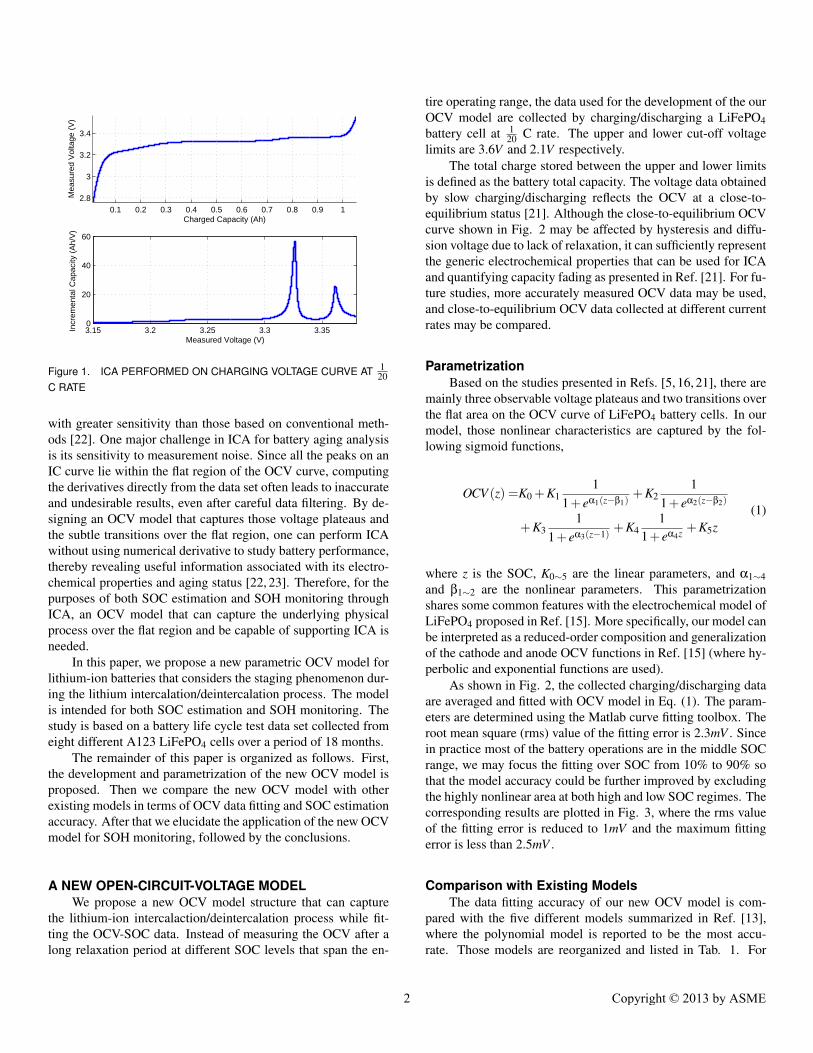
The total charge stored between the upper and lower limitsis defined as the battery total capacity. The voltage data obtainedby slow charging/discharging reflects the OCV at a close-to-equilibrium status [21]. Although the close-to-equilibrium OCVcurve shown in Fig. 2 may be affected by hysteresis and diffu-sion voltage due to lack of relaxation, it can sufficiently representthe generic electrochemical properties that can be used for ICAand quantifying capacity fading as presented in Ref. [21]. For fu-ture studies, more accurately measured OCV data may be used,and close-to-equilibrium OCV data collected at different currentrates may be compared.
ParametrizationBased on the studies presented in Refs. [5, 16, 21], there are
mainly three observable voltage plateaus and two transitions overthe flat area on the OCV curve of LiFePO4 battery cells. In ourmodel, those nonlinear characteristics are captured by the fol-lowing sigmoid functions,
OCV (z) =K0 +K11
1+ eα1(z−β1)+K2
11+ eα2(z−β2)
+K31
1+ eα3(z−1) +K41
1+ eα4z +K5z(1)
where z is the SOC, K0∼5 are the linear parameters, and α1∼4and β1∼2 are the nonlinear parameters. This parametrizationshares some common features with the electrochemical model ofLiFePO4 proposed in Ref. [15]. More specifically, our model canbe interpreted as a reduced-order composition and generalizationof the cathode and anode OCV functions in Ref. [15] (where hy-perbolic and exponential functions are used).
As shown in Fig. 2, the collected charging/discharging dataare averaged and fitted with OCV model in Eq. (1). The param-eters are determined using the Matlab curve fitting toolbox. Theroot mean square (rms) value of the fitting error is 2.3mV . Sincein practice most of the battery operations are in the middle SOCrange, we may focus the fitting over SOC from 10% to 90% sothat the model accuracy could be further improved by excludingthe highly nonlinear area at both high and low SOC regimes. Thecorresponding results are plotted in Fig. 3, where the rms valueof the fitting error is reduced to 1mV and the maximum fittingerror is less than 2.5mV .
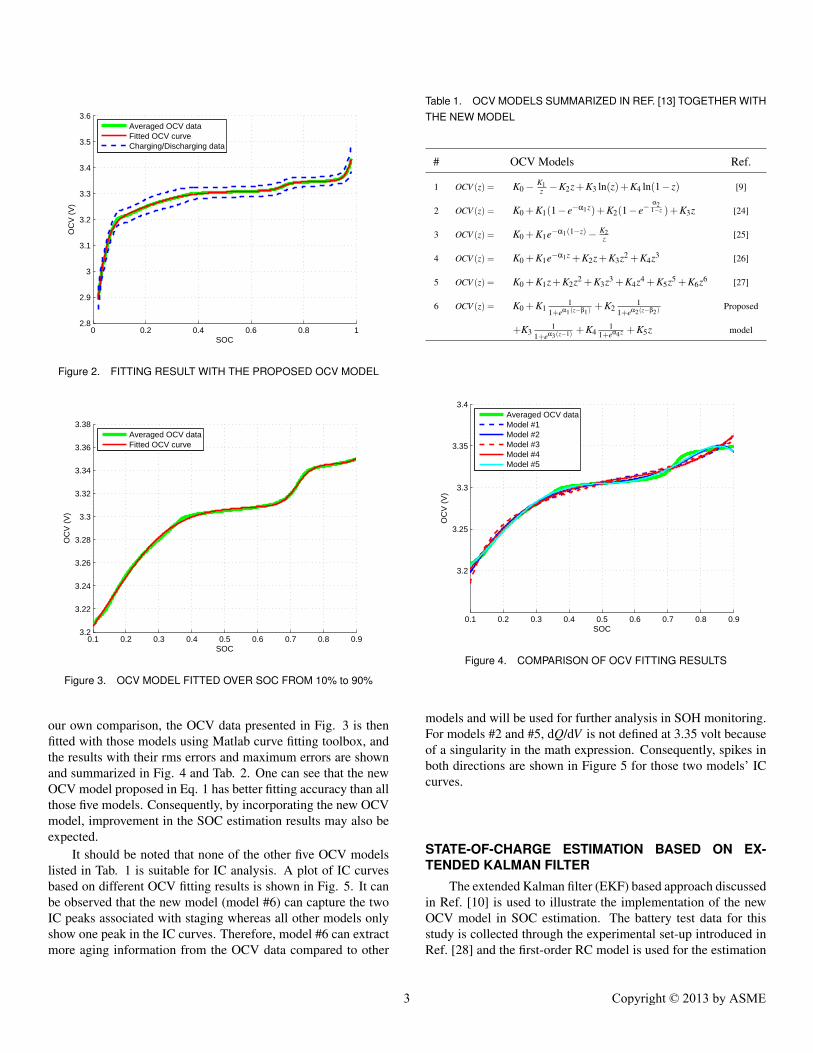
Comparison with Existing ModelsThe data fitting accuracy of our new OCV model is com-
pared with the five different models summarized in Ref. [13],where the polynomial model is reported to be the most accu-rate. Those models are reorganized and listed in Tab. 1. For
2 Copyright © 2013 by ASME
0 0.2 0.4 0.6 0.8 12.8
2.9
3
3.1
3.2
3.3
3.4
3.5
3.6
SOC
OC
V (
V)
Averaged OCV dataFitted OCV curveCharging/Discharging data
Figure 2. FITTING RESULT WITH THE PROPOSED OCV MODEL
0.1 0.2 0.3 0.4 0.5 0.6 0.7 0.8 0.93.2
3.22
3.24
3.26
3.28
3.3
3.32
3.34
3.36
3.38
SOC
OC
V (
V)
Averaged OCV dataFitted OCV curve
Figure 3. OCV MODEL FITTED OVER SOC FROM 10% to 90%
our own comparison, the OCV data presented in Fig. 3 is thenfitted with those models using Matlab curve fitting toolbox, andthe results with their rms errors and maximum errors are shownand summarized in Fig. 4 and Tab. 2. One can see that the newOCV model proposed in Eq. 1 has better fitting accuracy than allthose five models. Consequently, by incorporating the new OCVmodel, improvement in the SOC estimation results may also beexpected.
It should be noted that none of the other five OCV modelslisted in Tab. 1 is suitable for IC analysis. A plot of IC curvesbased on different OCV fitting results is shown in Fig. 5. It canbe observed that the new model (model #6) can capture the twoIC peaks associated with staging whereas all other models onlyshow one peak in the IC curves. Therefore, model #6 can extractmore aging information from the OCV data compared to other
Table 1. OCV MODELS SUMMARIZED IN REF. [13] TOGETHER WITHTHE NEW MODEL
# OCV Models Ref.
1 OCV (z) = K0 − K1z −K2z+K3 ln(z)+K4 ln(1− z) [9]
2 OCV (z) = K0 +K1(1− e−α1z)+K2(1− e−α21−z )+K3z [24]
3 OCV (z) = K0 +K1e−α1(1−z)− K2z [25]
4 OCV (z) = K0 +K1e−α1z +K2z+K3z2 +K4z3 [26]
5 OCV (z) = K0 +K1z+K2z2 +K3z3 +K4z4 +K5z5 +K6z6 [27]
6 OCV (z) = K0 +K11
1+eα1(z−β1)+K2
11+eα2(z−β2)
Proposed
+K31
1+eα3(z−1) +K41
1+eα4z +K5z model
0.1 0.2 0.3 0.4 0.5 0.6 0.7 0.8 0.9
3.2
3.25
3.3
3.35
3.4
SOC
OC
V (
V)
Averaged OCV dataModel #1Model #2Model #3Model #4Model #5
Figure 4. COMPARISON OF OCV FITTING RESULTS
models and will be used for further analysis in SOH monitoring.For models #2 and #5, dQ/dV is not defined at 3.35 volt becauseof a singularity in the math expression. Consequently, spikes inboth directions are shown in Figure 5 for those two models’ ICcurves.
STATE-OF-CHARGE ESTIMATION BASED ON EX-TENDED KALMAN FILTER
The extended Kalman filter (EKF) based approach discussedin Ref. [10] is used to illustrate the implementation of the newOCV model in SOC estimation. The battery test data for thisstudy is collected through the experimental set-up introduced inRef. [28] and the first-order RC model is used for the estimation
3 Copyright © 2013 by ASME
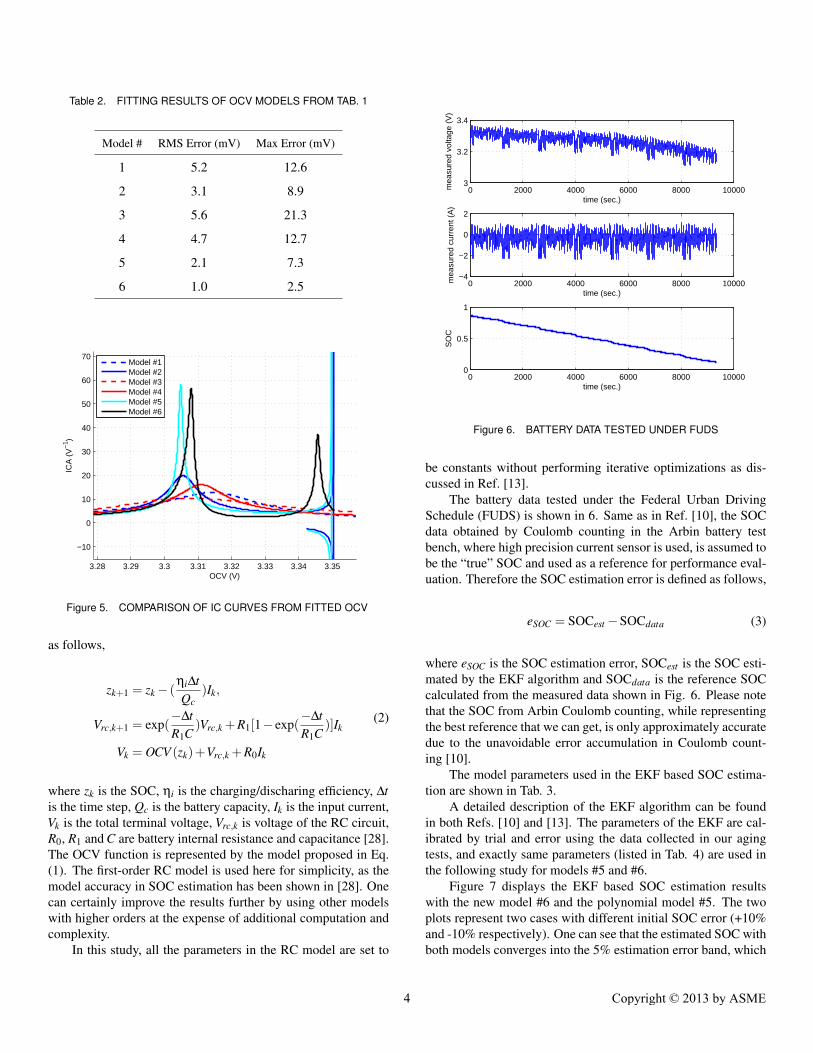
Table 2. FITTING RESULTS OF OCV MODELS FROM TAB. 1
Model # RMS Error (mV) Max Error (mV)
1 5.2 12.6
2 3.1 8.9
3 5.6 21.3
4 4.7 12.7
5 2.1 7.3
6 1.0 2.5
3.28 3.29 3.3 3.31 3.32 3.33 3.34 3.35
−10
0
10
20
30
40
50
60
70
OCV (V)
ICA
(V
−1 )
Model #1Model #2Model #3Model #4Model #5Model #6
Figure 5. COMPARISON OF IC CURVES FROM FITTED OCV
as follows,
zk+1 = zk − (ηi∆tQc
)Ik,
Vrc,k+1 = exp(−∆tR1C
)Vrc,k +R1[1− exp(−∆tR1C
)]Ik
Vk = OCV (zk)+Vrc,k +R0Ik
(2)
where zk is the SOC, ηi is the charging/discharing efficiency, ∆tis the time step, Qc is the battery capacity, Ik is the input current,Vk is the total terminal voltage, Vrc,k is voltage of the RC circuit,R0, R1 and C are battery internal resistance and capacitance [28].The OCV function is represented by the model proposed in Eq.(1). The first-order RC model is used here for simplicity, as themodel accuracy in SOC estimation has been shown in [28]. Onecan certainly improve the results further by using other modelswith higher orders at the expense of additional computation andcomplexity.
In this study, all the parameters in the RC model are set to
0 2000 4000 6000 8000 100003
3.2
3.4
time (sec.)
mea
sure
d vo
ltage
(V
)
0 2000 4000 6000 8000 10000−4
−2
0
2
time (sec.)
mea
sure
d cu
rren
t (A
)
0 2000 4000 6000 8000 100000
0.5
1
time (sec.)
SO
C
Figure 6. BATTERY DATA TESTED UNDER FUDS
be constants without performing iterative optimizations as dis-cussed in Ref. [13].
The battery data tested under the Federal Urban DrivingSchedule (FUDS) is shown in 6. Same as in Ref. [10], the SOCdata obtained by Coulomb counting in the Arbin battery testbench, where high precision current sensor is used, is assumed tobe the “true” SOC and used as a reference for performance eval-uation. Therefore the SOC estimation error is defined as follows,
eSOC = SOCest −SOCdata (3)
where eSOC is the SOC estimation error, SOCest is the SOC esti-mated by the EKF algorithm and SOCdata is the reference SOCcalculated from the measured data shown in Fig. 6. Please notethat the SOC from Arbin Coulomb counting, while representingthe best reference that we can get, is only approximately accuratedue to the unavoidable error accumulation in Coulomb count-ing [10].
The model parameters used in the EKF based SOC estima-tion are shown in Tab. 3.
A detailed description of the EKF algorithm can be foundin both Refs. [10] and [13]. The parameters of the EKF are cal-ibrated by trial and error using the data collected in our agingtests, and exactly same parameters (listed in Tab. 4) are used inthe following study for models #5 and #6.
Figure 7 displays the EKF based SOC estimation resultswith the new model #6 and the polynomial model #5. The twoplots represent two cases with different initial SOC error (+10%and -10% respectively). One can see that the estimated SOC withboth models converges into the 5% estimation error band, which
4 Copyright © 2013 by ASME
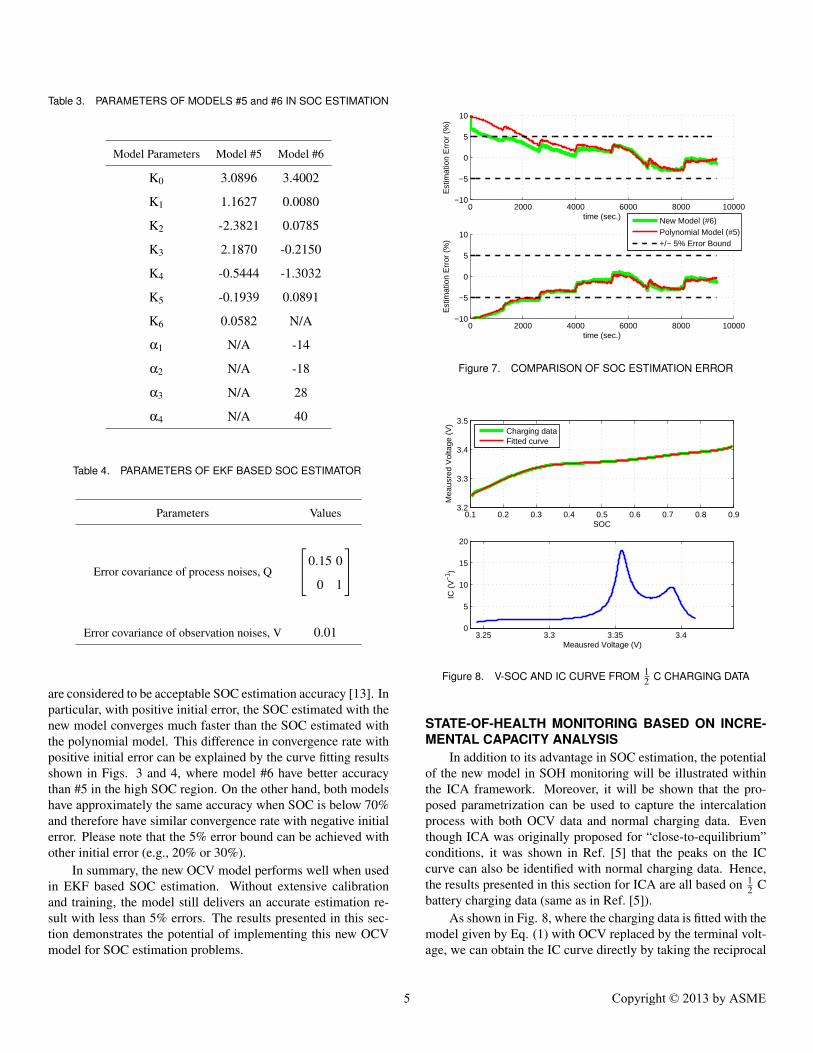
Table 3. PARAMETERS OF MODELS #5 and #6 IN SOC ESTIMATION
Model Parameters Model #5 Model #6
K0 3.0896 3.4002
K1 1.1627 0.0080
K2 -2.3821 0.0785
K3 2.1870 -0.2150
K4 -0.5444 -1.3032
K5 -0.1939 0.0891
K6 0.0582 N/A
α1 N/A -14
α2 N/A -18
α3 N/A 28
α4 N/A 40
Table 4. PARAMETERS OF EKF BASED SOC ESTIMATOR
Parameters Values
Error covariance of process noises, Q
0.15 0
0 1
Error covariance of observation noises, V 0.01
are considered to be acceptable SOC estimation accuracy [13]. Inparticular, with positive initial error, the SOC estimated with thenew model converges much faster than the SOC estimated withthe polynomial model. This difference in convergence rate withpositive initial error can be explained by the curve fitting resultsshown in Figs. 3 and 4, where model #6 have better accuracythan #5 in the high SOC region. On the other hand, both modelshave approximately the same accuracy when SOC is below 70%and therefore have similar convergence rate with negative initialerror. Please note that the 5% error bound can be achieved withother initial error (e.g., 20% or 30%).
In summary, the new OCV model performs well when usedin EKF based SOC estimation. Without extensive calibrationand training, the model still delivers an accurate estimation re-sult with less than 5% errors. The results presented in this sec-tion demonstrates the potential of implementing this new OCVmodel for SOC estimation problems.
0 2000 4000 6000 8000 10000−10
−5
0
5
10
time (sec.)
Est
imat
ion
Err
or (
%)
New Model (#6)Polynomial Model (#5)+/− 5% Error Bound
0 2000 4000 6000 8000 10000−10
−5
0
5
10
time (sec.)
Est
imat
ion
Err
or (
%)
Figure 7. COMPARISON OF SOC ESTIMATION ERROR
0.1 0.2 0.3 0.4 0.5 0.6 0.7 0.8 0.93.2
3.3
3.4
3.5
SOC
Mea
usre
d V
olta
ge (
V)
Charging dataFitted curve
3.25 3.3 3.35 3.40
5
10
15
20
Meausred Voltage (V)
IC (
V−
1 )
Figure 8. V-SOC AND IC CURVE FROM 12 C CHARGING DATA
STATE-OF-HEALTH MONITORING BASED ON INCRE-MENTAL CAPACITY ANALYSIS
In addition to its advantage in SOC estimation, the potentialof the new model in SOH monitoring will be illustrated withinthe ICA framework. Moreover, it will be shown that the pro-posed parametrization can be used to capture the intercalationprocess with both OCV data and normal charging data. Eventhough ICA was originally proposed for “close-to-equilibrium”conditions, it was shown in Ref. [5] that the peaks on the ICcurve can also be identified with normal charging data. Hence,the results presented in this section for ICA are all based on 1
2 Cbattery charging data (same as in Ref. [5]).
As shown in Fig. 8, where the charging data is fitted with themodel given by Eq. (1) with OCV replaced by the terminal volt-age, we can obtain the IC curve directly by taking the reciprocal
5 Copyright © 2013 by ASME
3.2 3.25 3.3 3.35 3.4 3.450
2
4
6
8
10
12
14
16
18
20
Measured Voltage (V)
Incr
emen
tal C
apac
ity (
V−
1 )
Cycle 1000Cycle 1400Cycle 1900Cycle 2300
Figure 9. IC CURVES OF DATA AT DIFFERENT AGES
3.36 3.38 3.4 3.422
4
6
8
10
Voltage (V)
Incr
emen
tal C
apac
ity (
V−
1 )
3.36 3.38 3.4 3.422
4
6
8
10
Voltage (V)
Incr
emen
tal C
apac
ity (
V−
1 )
3.36 3.38 3.4 3.422
4
6
8
10
Voltage (V)
Incr
emen
tal C
apac
ity (
V−
1 )
3.36 3.38 3.4 3.422
4
6
8
10
Voltage (V)
Incr
emen
tal C
apac
ity (
V−
1 )
1000140019002300
Figure 10. IC CURVES COMPARISON FROM FOUR DIFFERENTCELLS
after differentiating the analytical V-SOC function.
Incremental Capacity Analysis at Different AgingStages
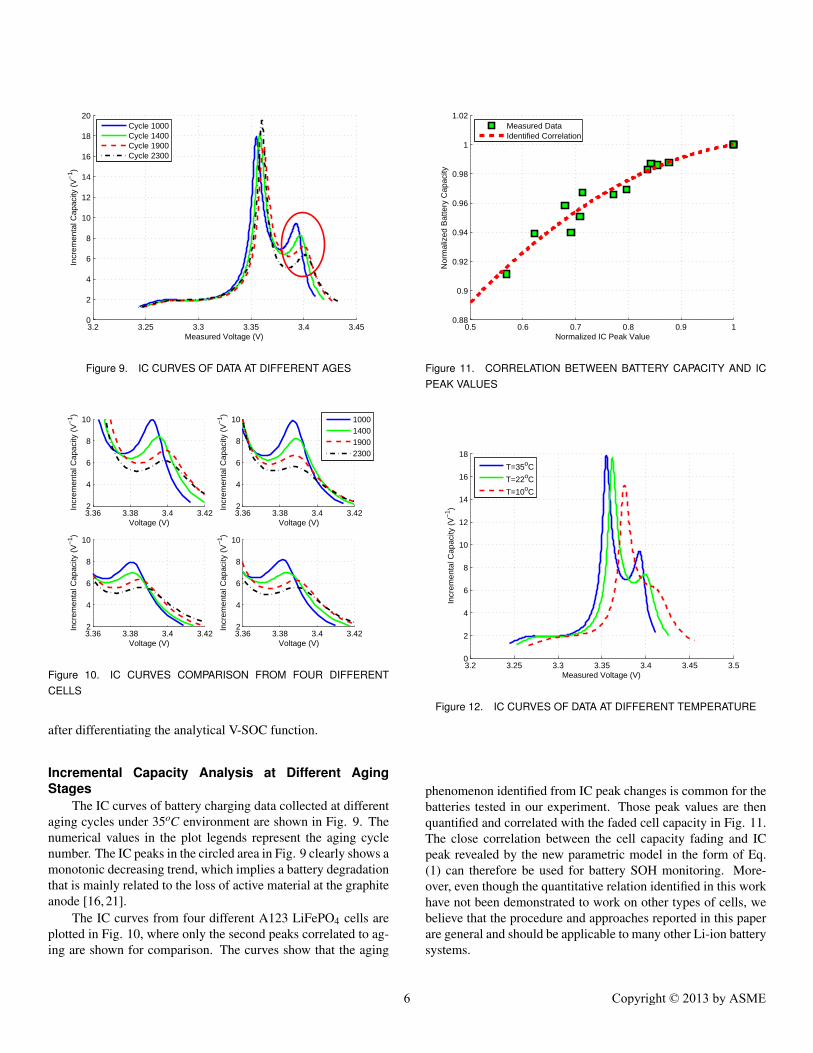
The IC curves of battery charging data collected at differentaging cycles under 35oC environment are shown in Fig. 9. Thenumerical values in the plot legends represent the aging cyclenumber. The IC peaks in the circled area in Fig. 9 clearly shows amonotonic decreasing trend, which implies a battery degradationthat is mainly related to the loss of active material at the graphiteanode [16, 21].
The IC curves from four different A123 LiFePO4 cells areplotted in Fig. 10, where only the second peaks correlated to ag-ing are shown for comparison. The curves show that the aging
0.5 0.6 0.7 0.8 0.9 10.88
0.9
0.92
0.94
0.96
0.98
1
1.02
Normalized IC Peak Value
Nor
mal
ized
Bat
tery
Cap
acity
Measured DataIdentified Correlation
Figure 11. CORRELATION BETWEEN BATTERY CAPACITY AND ICPEAK VALUES
3.2 3.25 3.3 3.35 3.4 3.45 3.50
2
4
6
8
10
12
14
16
18
Measured Voltage (V)
Incr
emen
tal C
apac
ity (
V−
1 )
T=35oC
T=22oC
T=10oC
Figure 12. IC CURVES OF DATA AT DIFFERENT TEMPERATURE
phenomenon identified from IC peak changes is common for thebatteries tested in our experiment. Those peak values are thenquantified and correlated with the faded cell capacity in Fig. 11.The close correlation between the cell capacity fading and ICpeak revealed by the new parametric model in the form of Eq.(1) can therefore be used for battery SOH monitoring. More-over, even though the quantitative relation identified in this workhave not been demonstrated to work on other types of cells, webelieve that the procedure and approaches reported in this paperare general and should be applicable to many other Li-ion batterysystems.
6 Copyright © 2013 by ASME
3.2 3.3 3.4 3.50
5
10
15
20
Voltage (V)
Incr
emen
tal C
apac
ity (
V−
1 )
3.2 3.3 3.4 3.50
5
10
15
20
Voltage (V)In
crem
enta
l Cap
acity
(V
−1 )
3.2 3.3 3.4 3.50
5
10
15
20
Voltage (V)
Incr
emen
tal C
apac
ity (
V−
1 )
3.2 3.3 3.4 3.50
5
10
15
20
Voltage (V)
Incr
emen
tal C
apac
ity (
V−
1 )
T=35oC
T=22oC
T=10oC
Cycle 1700
Cycle 1000 Cycle 1400
Cycle 1900
Figure 13. IC CURVES AT DIFFERENT TEMPERATURE AND AGES
Incremental Capacity Analysis at Different Tempera-ture
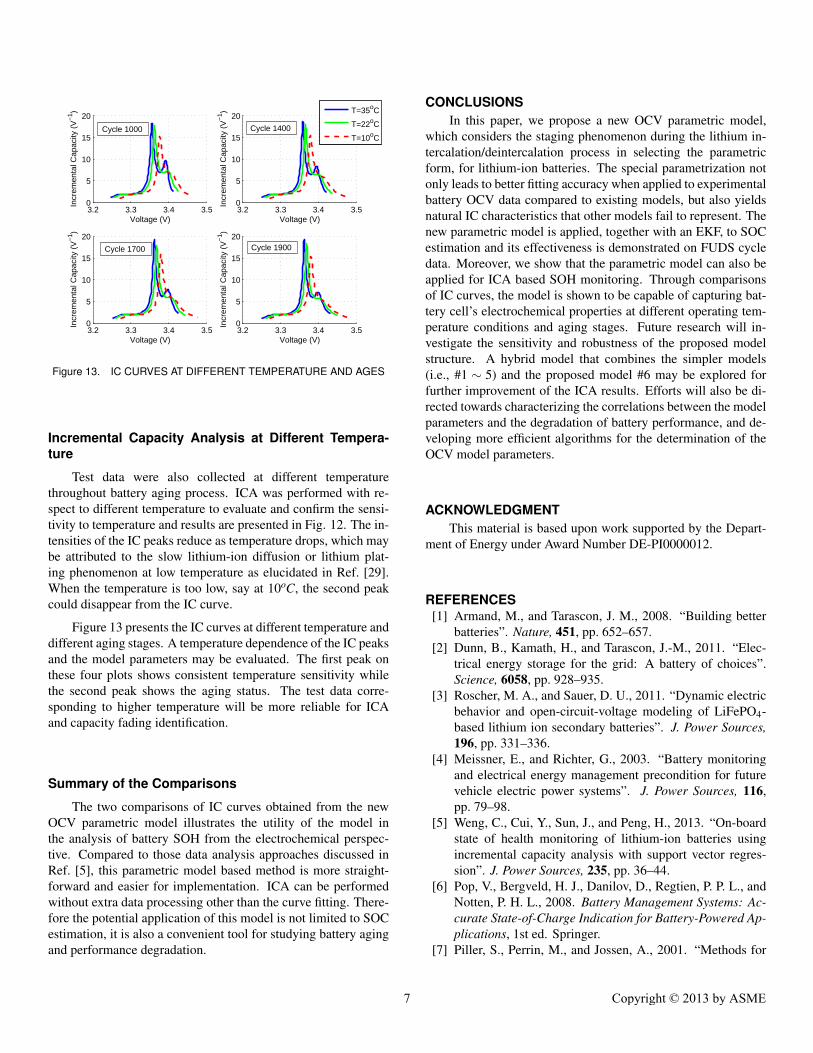
Test data were also collected at different temperaturethroughout battery aging process. ICA was performed with re-spect to different temperature to evaluate and confirm the sensi-tivity to temperature and results are presented in Fig. 12. The in-tensities of the IC peaks reduce as temperature drops, which maybe attributed to the slow lithium-ion diffusion or lithium plat-ing phenomenon at low temperature as elucidated in Ref. [29].When the temperature is too low, say at 10oC, the second peakcould disappear from the IC curve.
Figure 13 presents the IC curves at different temperature anddifferent aging stages. A temperature dependence of the IC peaksand the model parameters may be evaluated. The first peak onthese four plots shows consistent temperature sensitivity whilethe second peak shows the aging status. The test data corre-sponding to higher temperature will be more reliable for ICAand capacity fading identification.
Summary of the Comparisons
The two comparisons of IC curves obtained from the newOCV parametric model illustrates the utility of the model inthe analysis of battery SOH from the electrochemical perspec-tive. Compared to those data analysis approaches discussed inRef. [5], this parametric model based method is more straight-forward and easier for implementation. ICA can be performedwithout extra data processing other than the curve fitting. There-fore the potential application of this model is not limited to SOCestimation, it is also a convenient tool for studying battery agingand performance degradation.
CONCLUSIONSIn this paper, we propose a new OCV parametric model,
which considers the staging phenomenon during the lithium in-tercalation/deintercalation process in selecting the parametricform, for lithium-ion batteries. The special parametrization notonly leads to better fitting accuracy when applied to experimentalbattery OCV data compared to existing models, but also yieldsnatural IC characteristics that other models fail to represent. Thenew parametric model is applied, together with an EKF, to SOCestimation and its effectiveness is demonstrated on FUDS cycledata. Moreover, we show that the parametric model can also beapplied for ICA based SOH monitoring. Through comparisonsof IC curves, the model is shown to be capable of capturing bat-tery cell’s electrochemical properties at different operating tem-perature conditions and aging stages. Future research will in-vestigate the sensitivity and robustness of the proposed modelstructure. A hybrid model that combines the simpler models(i.e., #1 ∼ 5) and the proposed model #6 may be explored forfurther improvement of the ICA results. Efforts will also be di-rected towards characterizing the correlations between the modelparameters and the degradation of battery performance, and de-veloping more efficient algorithms for the determination of theOCV model parameters.
ACKNOWLEDGMENTThis material is based upon work supported by the Depart-
ment of Energy under Award Number DE-PI0000012.
REFERENCES[1] Armand, M., and Tarascon, J. M., 2008. “Building better
batteries”. Nature, 451, pp. 652–657.[2] Dunn, B., Kamath, H., and Tarascon, J.-M., 2011. “Elec-
trical energy storage for the grid: A battery of choices”.Science, 6058, pp. 928–935.
[3] Roscher, M. A., and Sauer, D. U., 2011. “Dynamic electricbehavior and open-circuit-voltage modeling of LiFePO4-based lithium ion secondary batteries”. J. Power Sources,196, pp. 331–336.
[4] Meissner, E., and Richter, G., 2003. “Battery monitoringand electrical energy management precondition for futurevehicle electric power systems”. J. Power Sources, 116,pp. 79–98.
[5] Weng, C., Cui, Y., Sun, J., and Peng, H., 2013. “On-boardstate of health monitoring of lithium-ion batteries usingincremental capacity analysis with support vector regres-sion”. J. Power Sources, 235, pp. 36–44.
[6] Pop, V., Bergveld, H. J., Danilov, D., Regtien, P. P. L., andNotten, P. H. L., 2008. Battery Management Systems: Ac-curate State-of-Charge Indication for Battery-Powered Ap-plications, 1st ed. Springer.
[7] Piller, S., Perrin, M., and Jossen, A., 2001. “Methods for
7 Copyright © 2013 by ASME
state-of-charge determination and their applications”. J.Power Sources, 96, pp. 113–120.
[8] Plett, G. L., 2004. “Extended kalman filtering for batterymanagement systems of LiPB-based hev battery packs, part1. background”. J. Power Sources, 134, pp. 252–261.
[9] Plett, G. L., 2004. “Extended kalman filtering for batterymanagement systems of LiPB-based hev battery packs, part2. modeling and identification”. J. Power Sources, 134,pp. 262–276.
[10] Plett, G. L., 2004. “Extended kalman filtering for batterymanagement systems of LiPB-based hev battery packs, part3. state and parameter estimation”. J. Power Sources, 134,pp. 277–292.
[11] Santhanagopalan, S., and White, R. E., 2006. “Online esti-mation of the state of charge of a lithium ion cell”. J. PowerSources, 161, pp. 1346–1355.
[12] Verbrugge, M., and Tate, E., 2004. “Adaptive state ofcharge algorithm for nickel metal hydride batteries in-cluding hysteresis phenomena”. J. Power Sources, 126,pp. 236–249.
[13] Hu, X., Li, S., Peng, H., and Sun, F., 2012. “Robust-ness analysis of state-of-charge estimation methods for twotypes of li-ion batteries”. J. Power Sources, 217, pp. 209–219.
[14] Safari, M., and Delacourt, C., 2011. “Mathematical mod-eling of lithium iron phosphate electrode: Galvanostaticcharge/discharge and path dependence”. J. Electrochem.Soc., 158(2), pp. A63–A73.
[15] Safari, M., and Delacourt, C., 2011. “Modeling of acommercial graphite/LiFePO4 cell”. J. Electrochem. Soc.,158(5), pp. A562–A571.
[16] Groot, J., 2012. “State-of-health estimation of li-ion bat-teries: Cycle life test methods”. Master’s thesis, ChalmersUniversity of Technology.
[17] Yazami, R., and Touzain, P., 1983. “A reversible graphite-lithium negative electrode for electrochemical generators”.J. Power Sources, 9, pp. 365–371.
[18] Dahn, J. R., 1991. “Phase diagram of LixC6”. Phys. Rev.,B44, pp. 9170–9177.
[19] Yazami, R., and Reynier, Y., 2006. “Thermodynam-ics and crystal structure anomalies in lithium-intercalatedgraphite”. J. Power Sources, 153, pp. 312–318.
[20] Roscher, M. A., Assfalg, J., and Bohlen, O. S., 2011. “De-tection of utilizable capacity deterioration in battery sys-tems”. IEEE Trans. Veh. Technol., 60(1), pp. 98–103.
[21] Dubarry, M., Svoboda, V., Hwu, R., , and Liaw, B. Y., 2006.“Incremental capacity analysis and close-to-equilibriumocv measurements to quantify capacity fade in commer-cial rechargeable lithium batteries”. Electrochem. Solid St.,9(10), pp. A454–A457.
[22] Liaw, B. Y., and Dubarry, M., 2010. “A roadmap to un-derstand battery performance in electric and hybrid vehi-cle operation”. In Electric and Hybrid Vehicles: PowerSources, Models, Sustainability, Infrastructure and the
Market, G. Pistoia, ed. Elsevier, pp. 375–403.[23] Dubarry, M., and Liaw, B. Y., 2009. “Identify capacity
fading mechanism in a commercial LiFePO4 cell”. J. PowerSources, 194, pp. 541–549.
[24] Hu, Y., Yurkovich, S., Guezennec, Y., and Yurkovich, B.,2011. “Electro-thermal battery model identification for au-tomotive applications”. J. Power Sources, 196, pp. 449–457.
[25] Neumann, D. E., and Lichte, S., 2011. “A multi-dimensional battery discharge model with thermal feedbackapplied to a lithium- ion battery pack”. In NDIA GroundVehicle Systems Engineering and Technology Symposium.
[26] Chen, M., and Rincon-Mora, G. A., 2008. “Accurate elec-trical battery model capable of predicting runtime and I-Vperformance”. IEEE Trans. Veh. Technol., 21(2), pp. 504–511.
[27] Szumanowski, A., and Chang, Y., 2008. “Battery manage-ment system based on battery nonlinear dynamics model-ing”. IEEE Trans. Veh. Technol., 57(3), pp. 1425–1432.
[28] Hu, X., Li, S., and Peng, H., 2012. “A comparative studyof equivalent circuit models for li-ion batteries”. J. PowerSources, 198, pp. 359–367.
[29] Vetter, J., Novak, P., Wagner, M., Veit, C., Moller, K.-C.,Besenhard, J., Winter, M., Wohlfahrt-Mehrens, M., Vogler,C., and Hammouched, A., 2005. “Ageing mechanisms inlithium-ion batteries”. J. Power Sources, 147, pp. 269–281.
8 Copyright © 2013 by ASME