Embed Size (px)
Citation preview
RESEARCH ARTICLE
An open-source tool for analysis and
automatic identification of dendritic spines
using machine learning
Michael S. Smirnov1*, Tavita R. Garrett1,2, Ryohei Yasuda1
1 Neuronal Signal Transduction, Max Planck Florida Institute for Neuroscience, Jupiter, Florida, United
States of America, 2 Neuroscience, Oregon Health and Science University School of Medicine, Portland,
Oregon, United States of America
Abstract
Synaptic plasticity, the cellular basis for learning and memory, is mediated by a complex bio-
chemical network of signaling proteins. These proteins are compartmentalized in dendritic
spines, the tiny, bulbous, post-synaptic structures found on neuronal dendrites. The ability
to screen a high number of molecular targets for their effect on dendritic spine structural
plasticity will require a high-throughput imaging system capable of stimulating and monitor-
ing hundreds of dendritic spines in various conditions. For this purpose, we present a pro-
gram capable of automatically identifying dendritic spines in live, fluorescent tissue. Our
software relies on a machine learning approach to minimize any need for parameter tuning
from the user. Custom thresholding and binarization functions serve to “clean” fluorescent
images, and a neural network is trained using features based on the relative shape of the
spine perimeter and its corresponding dendritic backbone. Our algorithm is rapid, flexible,
has over 90% accuracy in spine detection, and bundled with our user-friendly, open-source,
MATLAB-based software package for spine analysis.
Introduction
Structural changes in dendritic spines, tiny postsynaptic protrusions on the dendritic surface
of neurons, are considered to be the basis of synaptic plasticity [1] and are known to be impor-
tant for learning and memory [2]. Dysfunctions in synaptic plasticity are a feature of affective
disorders, neurodegenerative diseases, and aging-associated cognitive decline [1].
Recent advances in photostimulation and imaging techniques have made it possible to visu-
alize the morphological and molecular changes in individual spines with high time resolution.
Two-photon laser-scanning microscopy in live brain tissue is often used due to its relatively
low scattering and precise localization in deep samples [3]. Furthermore, two-photon micros-
copy can be combined with glutamate uncaging, resulting in targeted photoactivation and
plasticity in individual dendritic spines [4]. However, the process of finding, imaging, and ana-
lyzing changes in individual dendritic spines is cumbersome and time-consuming. Therefore,
the identification of dendritic spines needs to be automated.
PLOS ONE | https://doi.org/10.1371/journal.pone.0199589 July 5, 2018 1 / 16
a1111111111
a1111111111
a1111111111
a1111111111
a1111111111
OPENACCESS
Citation: Smirnov MS, Garrett TR, Yasuda R
(2018) An open-source tool for analysis and
automatic identification of dendritic spines using
machine learning. PLoS ONE 13(7): e0199589.
https://doi.org/10.1371/journal.pone.0199589
Editor: Jorge Bernardino de la Serna, Science and
Technology Facilities Council, UNITED KINGDOM
Received: December 20, 2017
Accepted: June 11, 2018
Published: July 5, 2018
Copyright: © 2018 Smirnov et al. This is an open
access article distributed under the terms of the
Creative Commons Attribution License, which
permits unrestricted use, distribution, and
reproduction in any medium, provided the original
author and source are credited.
Data Availability Statement: All source code data
is available via a public GitHub repository found at
https://github.com/mikeusru/Braintown. All training
data can be found at https://figshare.com/articles/
Labeled_Dendritic_Spines_-_Training_Data/
6149207.
Funding: All relevant work by Smirnov, Garrett, and
Yasuda was supported by National Institutes of
Health- National Institute of Neurological Disorders
and Stroke - 5DP1NS096787.
Competing interests: The authors have declared
that no competing interests exist.

Recently, several approaches to semi-automated identification and analysis of dendritic
spines have been described [5–10]. These methods have the potential to greatly reduce the
amount of effort required for large-scale spine counting and analysis, but are often optimized
to a specific cell type, imaging technique, or magnification. Since the majority of spine seg-
mentation algorithms are designed to be used for post-hoc analysis rather than to assist with
live imaging, they may require large amounts of computing time and always rely on human
input for error correction. Furthermore, variations in image intensity, background signal, and
spine length must be accounted for by manual optimization of program settings. Therefore,
the application of these algorithms to assist with live spine imaging under varying physiologi-
cal conditions proves prohibitively difficult.
To reduce errors due to sample variability, some spine identification techniques incorpo-
rate machine learning techniques [5, 11]. Since differences in microscopes, fluorescent mark-
ers, and spine morphologies lead to variability in how spines are visualized, complex machine
learning algorithms such as neural networks and deep learning often require enormous
amounts of labeled training images (>10,000), while simpler classifier techniques lack the abil-
ity to properly capture the amount of features required to identify spines.
Here we provide a user-friendly tool to analyze, label, segment, and automatically identify
dendritic spines. We use a machine learning approach to dendritic spine identification which
is highly adaptable to any fluorescent imaging setup. By using adaptive thresholding, we iden-
tify neuronal dendrites regardless of background noise and signal intensity. Next, we train a
neural network to identify spines based on the position of perimeter pixels relative to the den-
drite and spine backbone, as well as the fluorescence intensity along the spine backbone. Our
approach is fast and works with a training data set of as few as two thousand images which can
be labeled within a few hours using our semi-automated labeling software. Furthermore, our
software can be easily adapted to unique imaging setups, and is freely available in open-source
MATLAB code.
Image acquisition
Tissue preparation
To create an algorithm able to detect dendritic spines within a variety of morphologies, the
images used for analysis were collected from a variety of genotypes. Organotypic hippocampal
slice cultures were prepared as described previously [12] from p4-p6 mice were cultured for
10–12 days before transfection. A biolostic particle delivery system (Helios1 Gene Gun Sys-
tem, Bio-Rad) was used to introduce fluorescent GFP labels to obtain sparse transfection of
neurons. Two to six days after transfection, neurons in sparsely GFP-labeled CA1 hippocampal
regions were chosen for imaging. Individual spines in the striatum radiatum on secondary api-
cal dendrites were chosen for observation.
Animals
Wild-type C57BL/6J were purchased from Charles river laboratories, and conditional knock-
out (cKO) lines were generated for IGF1 Receptor and Insulin Receptors as using standard
knockout techniques. Animals were housed on a 12 hour light cycle with a room temperature
of 74˚F, 50% humidity, with Harlan 7092 ¼” corn cob bedding. P4-p6 pups were taken from
mothers housed individually in Tecniplast1 ventilated cages. Pups were sacrificed using
decapitation. This study, including all animal procedures, was approved by the Max Planck
Florida Institute for Neuroscience Animal Care and Use Committee, in accordance with
guidelines by the US National Institutes of Health. Max Planck Florida Institute has been
AAALAC Accredited since June, 2014.
Automated identification of dendritic spines
PLOS ONE | https://doi.org/10.1371/journal.pone.0199589 July 5, 2018 2 / 16

Microscopy
Imaging was done on a custom built, two-photon microscope controlled by Scanimage and
modified to allow for automated, multiposition image collection [13, 14]. Dendritic spines
were imaged over ~1 hour using a 60X objective and 30X or 15X galvanometer-scan zoom
(image field ~8x8 μm or 16x16 μm). One 5 μm Z-stack was collected over five Z-planes at each
imaging position per minute. Each image was acquired at 128x128 pixels, resulting in a resolu-
tion of ~ 15 pixels per μm in both X and Y.
Image analysis
The image processing workflow for feature extraction is illustrated in Fig 1. First, spine loca-
tions are labeled in each image, and images are automatically segmented. After segmentation,
individual feature vectors consisting of 221 values were used to train a neural network using a
scaled conjugate gradient propagation algorithm [15]. Once trained, the neural network was
used to evaluate whether feature vectors from newly segmented images represent spine or
non-spine locations. All code was written in MATLAB and is freely available at https://github.
com/mikeusru/Braintown. All functions have been tested in MATLAB 2016b and require the
Image Processing, Neural Network, and Statistics and Machine Learning toolboxes. All train-
ing data has also been made available [16].
Preprocessing and binarization
Once an image is loaded (Fig 2A), pixels are converted to grayscale floating-point numbers
ranging between 0 to 1. Noise is removed using a standard 2D median filter. Highest-probabil-
ity background is identified using Otsu’s method of globally thresholding [17]. To ensure no
relevant pixels are lost, the global threshold value is reduced by 70%. The average pixel below
the background threshold is then subtracted from the image. Next, an adaptive image thresh-
old is computed using local first-order statistics with a neighborhood size of 10x10 μm. Any
resulting holes smaller than 0.5 μm2 are filled. Ideally, the resulting binary image (Fig 2B)
includes only regions of neuronal tissue.
Backbone extraction
The backbone of the dendrite (Fig 2C) was identified by thinning the binary image until all
structures had a thickness of no more than one pixel, and then removing any branches which
didn’t belong to the dendrite. After skeletonization [18], the presence of dendritic spines and
noise within the image causes a significant number of spurious branches and loops which are
not representative of the dendrite itself. Loop artifacts were removed by filling in all areas
smaller than 0.5 μm2 and undergoing a second round of skeletonization. Any isolated seg-
ments where p<M were removed, where p was the amount of pixels in the segment, and M
was the minimum branch length (2 μm) multiplied by the number of pixels per μm. The
remainder of the spurious segments were removed by a recursive trimming algorithm adapted
from Cheng et al. [7]. Basically, endpoint pixels were iteratively removed from the skeleton
and added to a set of deleting templates through the use of a nested loop. If the iteration did
not add to the deleting template, then the deleting template was permanently removed from
the skeleton. The code structure is presented below:
1. Initialize m = 1
2. Repeat until m = M
a. Initialize removed segments = blank
Automated identification of dendritic spines
PLOS ONE | https://doi.org/10.1371/journal.pone.0199589 July 5, 2018 3 / 16

b. Repeat m times:
i. Find skeleton endpoints, ignoring those near border
ii. Add skeleton endpoints to removed segments
c. Remove skeleton endpoints from skeleton
Fluorescent NeuronImage
Preprocessing
Binarization
Backbone Extraction
Perimeter Smoothing
Perimeter DistanceCalculation
Neural Network Testfor Spine Detection
Manual SpineLabeling
Training DataCreation
Neural NetworkTraining
Fig 1. Image processing workflow for automated identification of dendritic spines. Orange: Spine locations are
labeled in each image prior to automated segmentation. Extracted feature vectors are used to train a neural network
using a scaled conjugate gradient propagation algorithm. Blue: Novel images are preprocessed, segmented, and feature
vectors are extracted. Feature vectors are used to evaluate identify potential dendritic spines using the previously
trained neural network.
https://doi.org/10.1371/journal.pone.0199589.g001
Automated identification of dendritic spines
PLOS ONE | https://doi.org/10.1371/journal.pone.0199589 July 5, 2018 4 / 16

d. Restore any removed segments that have m pixels
e. m = m + 1
After trimming, the backbone often retained some small kinks leftover from the initial ske-
letonization process. As these kinks could introduce artifacts in the later perimeter distance
calculation, they were removed by a custom smoothing algorithm also adapted from Cheng at
al. [7]: First, all branch points belonging to the initial, untrimmed skeleton were located along
the dendrite backbone. Next, the branchpoints were dilated by M/4 to include all local back-
bone pieces which might belong to a kink. Finally, these kinks were removed, and the resulting
line endpoints connected, resulting in a smooth backbone segment.
Surface smoothing
To isolate individual segments of the cell perimeter to be used as features for spine detection,
the surface of the binary object needed to be smooth, lacking any spurious pixels or diagonally
connected regions. Smoothing was achieved using an array of morphological operations on
the binary image. First, a majority operation [19] set a pixel to 1 if five or more pixels in its 3x3
neighborhood are 1s, otherwise the pixel is set to 0. Next, the image is morphologically opened,
closed, and opened again using a 3x3 structuring element of ones. Pixels connected to fewer
than three other pixels were removed, and a diagonal fill was used to eliminate any 8-connec-
tivity of the background, essentially transforming diagonal connections into right angles. The
binary objects were then thickened by adding a one-pixel width border, as long as that border
did not form a new connection with a neighboring border. An example of the result attained
through surface smoothing can be seen in Fig 3.
DCBA
HGFE
Fig 2. Steps in image segmentation. A. Original Image. B. Thresholding using Otsu’s global method, followed by adaptive thresholding and binarization. C. Backbone
Extraction D. Identification of removed spines. E. Geodesic distance transform using dendrite backbone as seed location F. Identification of potential spine locations by
local maxima along perimeter. G, H. Local geodesic distance transforms for each individual potential spine point, using spine backbone (shortest path between local
maxima and dendrite backbone) as seed point. Scale bar = 5 μm.
https://doi.org/10.1371/journal.pone.0199589.g002
Automated identification of dendritic spines
PLOS ONE | https://doi.org/10.1371/journal.pone.0199589 July 5, 2018 5 / 16

Identification of disconnected spines
As the purpose of our algorithm was to find spines which were obviously attached to the den-
drite, small objects which became disconnected from the dendrite (Fig 2D) during the surface
smoothing step were categorized using k-means clustering, but were ignored from the neural
network training data. In any individual image, the signal to noise ratio was calculated in
objects that were within distance M from the dendrite backbone. Each respective signal was
collected from the pixels in the original image (Fig 2A) which overlapped with the object,
while noise was calculated using pixels in the bounding box of the object minus the pixels
within the object. If more than two objects were detected, spines were identified using k-
means clustering of the signal to noise ratios into two clusters. The group with a larger average
signal to noise ratio were identifies as spines, while others were non-spine objects. All objects
detached from the main dendrite structure were ignored for the remaining calculations.
Perimeter feature extraction
Three feature vectors were used for neural network training and spine identification: perime-
ter distance from dendrite backbone (PD), perimeter distance from spine backbone (PS), and
fluorescence intensity along the spine backbone (IS). The location of each feature vector, as
well as the individual values of PD features, were quantified based on a geodesic distance trans-
form [20] of the binary image of the dendrite, using the dendrite backbone as a seed location.
Thus, the value assigned to each connected pixel represents its relative distance from the den-
drite backbone (Fig 2E). The central position of each feature vector was assigned by finding
local maxima along the perimeter of the geodesic transform (Fig 2F), and a geodesic distance
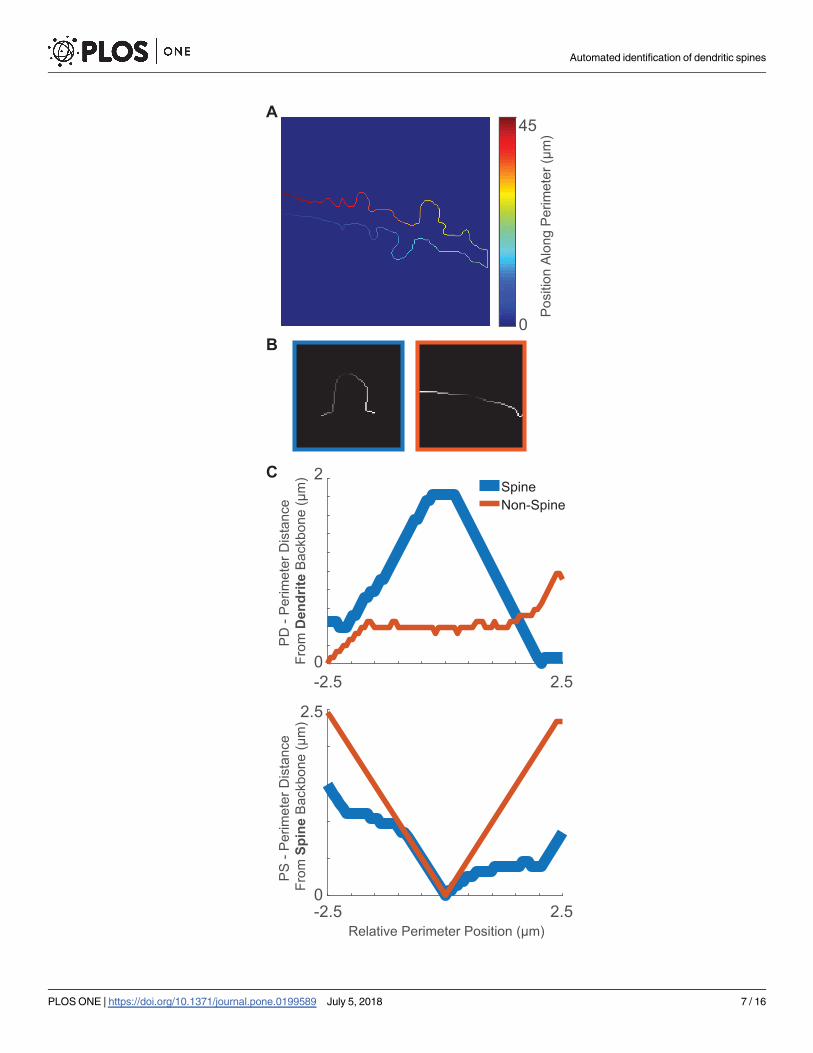
transform of the perimeter itself (Fig 4A) served to organize all perimeter pixels into relative
locations. Vectors were all standardized to contain a minimum value of 0 to reflect the shape
of the spine while ignoring dendrite thickness. Each PD feature vector represents a 5 μm seg-
ment of pixel values along the edge of the geodesic transform (Fig 4C).
Unlike PD features, which represent distance from the dendrite backbone, PS features rep-
resent distance from the spine backbone. The spine backbone was identified as the shortest
path between the feature origin point on the perimeter (Fig 2F, 2G and 2H) and its nearest
point on the dendrite backbone with the help of a fast marching algorithm [21]. A geodesic
distance transforms was calculated using the spine backbone as a seed (Fig 2G and 2H), and
PS features are represented as a 5 μm segment of pixel values along the resulting perimeter
(Fig 4B and 4C).
Fig 3. Surface smoothing of binary image. (A) Initial binary image contains a significant noise around its perimeter.
(B) Surface-smoothed image lacks kinks, as well as spurious or diagonally–connected pixels.
https://doi.org/10.1371/journal.pone.0199589.g003
Automated identification of dendritic spines
PLOS ONE | https://doi.org/10.1371/journal.pone.0199589 July 5, 2018 6 / 16
0
45
Pos
ition
Alo
ng P
erim
eter
(µm
)
5.25.2-0
2.5
Relative Perimeter Position (µm)
PS
- P
erim
eter
Dis
tanc
e Fr
om S
pine
Bac
kbon
e (µ
m)
A
SpineNon-Spine
5.25.2-0
2
PD
- P
erim
eter
Dis
tanc
e Fr
om D
endr
ite B
ackb
one
(µm
)
B
C
Automated identification of dendritic spines
PLOS ONE | https://doi.org/10.1371/journal.pone.0199589 July 5, 2018 7 / 16

PD and PS features were arranged based on their respective position along the perimeter. To
minimize the amount of necessary training data, position information was defined by a single
value as the directional distance along the perimeter from the center of the feature origin. To
assign position values, a closed-loop perimeter was first cut at a random point. A geodesic dis-
tance transform, with one endpoint as a seed, was then used to assign a single value to each pixel
(Fig 4A). As a result of the transform, each consecutive pixel was assigned a value based on its
travel distance from the seed pixel. Prior surface smoothing (Fig 3) was exceptionally important
for this distance transform to work properly, since any kinks or loops in the perimeter would
result in duplicate position values. By assigning these position values to each perimeter feature,
we translated 2D perimeter images (Fig 4B) into 1D arrays of feature-specific values (Fig 4C).
Finally, since the amount of pixels in a 5 μm segment varied based on the resolution of the initial
image, PS and PD feature vectors were standardized by interpolating to 100 values each.
Features in the IS group were assigned using pixel positions from the spine backbone, and
pixel values from the original image. The resulting feature vector represents a line of intensity
values starting at the dendrite backbone and finishing at the tip of the spine. Due to the spine
backbone varying in length, each group of values was interpolated to 20 features (Fig 5A),
while the 21th feature represented the original spine backbone length in μm (Fig 5B).
Network training
PD, PS, and IS feature sets consisting of a combined 221 values were used to train a neural net-
work using a scaled conjugate gradient propagation algorithm [15] from the MATLAB
Fig 4. PD and PS feature vectors. (A) Relative position values, in μm, assigned to each pixel starting from a random
seed and following a single direction. (B) 5 μm perimeter segments are extracted at each potential spine point to create
PS feature vectors. Brighter pixels indicate higher distance from spine backbone. Left box (blue) is a true spine, right
box (orange) is a non-spine. (C) Perimeter feature vectors represent respective pixel values (y axis) and pixel position
(x axis).
https://doi.org/10.1371/journal.pone.0199589.g004
Non-Spine Spine0
1
2
3
4
Spi
ne L
engt
h (μ
m)
0 5 10 15 20Relative Pixel
0.35
0.4
0.45
0.5
0.55
Pix
el In
tens
ity (a
u)
SpineNon-Spine
BA
Fig 5. Length and Intensity of the spine backbone. (A) Average pixel intensity in pixels taken along line connecting tip of potential
spine to closest point in dendrite backbone. (B) Average length of spine backbone in pre-labeled Spine and Non-Spine objects.
https://doi.org/10.1371/journal.pone.0199589.g005
Automated identification of dendritic spines
PLOS ONE | https://doi.org/10.1371/journal.pone.0199589 July 5, 2018 8 / 16

(2016b) Neural Network Toolbox using default parameters. Weights and biases were initial-
ized randomly between -1 and 1. To elicit the highest accuracy in spine categorization while
keeping training and classification times manageable, the network was configured to have a
single hidden layer with 20 nodes. Features sets were classified as either spine or non-spine. To
label training data, we designed an application which allows users to rapidly identify dendritic
spines by clicking on their location in an image. A 1x1 μm box was then drawn around each
identified spine. Boxes that were within 1.5 μm from the image border were ignored to avoid
edge artifacts. Boxes which overlapped with a disconnected blob (Figs 2 and 1D) were ignored
as well. Feature sets were classified as spines if their point of origin was inside the box.
Software design
To make our tools accessible to users who may lack any significant coding expertise, we built a
straightforward front-end user interface for viewing, analyzing, labeling, and segmenting
images of dendritic spines in MATLAB (Fig 6). The main window (Fig 6A) allows users to
load either individual images or image sets, browse through the loaded data (Fig 6B), and
restrict certain files from being loaded (Fig 6C). Drop-down menus also let users perform
common calculations such as 3D projection on Z stacks and drift correction on timelapse
image sets. Users can draw circular or polygonal ROIs on the image (Fig 6E) to calculate
changes in spine volume over time (Fig 6D). While remaining compatible with variable data
sources, this program is particularly tuned to analyze data collected using our automated mul-
tiposition imaging system [14]. A semi-automated spine selection tool for labeling training
data is also provided (Fig 6F). Users can enter spine selection mode (Fig 6G), where clicking
on the image frame will label and store the local coordinates of each spine (Fig 6E). Users have
the option to track spines through brightness, where given a timelapse image set, spine coordi-
nates will automatically update to their new closest position. Finally, the spine selection tool
allows users to train, preview, and test a neural network for its capability to find dendritic
spines (Fig 6H).
To create a powerful yet user-friendly system for image segmentation, we created a modular
interface where users can manually select, customize, evaluate, and share plugins and configu-
rations without any coding experience (Fig 7). A function selection window (Fig 7A) loads all
of the plugins from a local plugins folder and displays them in an alphabetized list (Fig 7B).
Each plugin serves as a step in the image segmentation, analysis, or feature extraction process,
and may have unique inputs and outputs. Using drop-down lists, users may select which out-
put variables will serve as inputs for plugins down the line. For example, the function selected
in Fig 7C takes the input variable “BW (1)”, and outputs “thin (2)” and “spineSearchZone (2)”,
both of which are used as inputs in other steps down the line. A number referencing the analy-
sis step is attached to each variable name to avoid errors where multiple plugins have outputs
with the same name. To clarify the types of input and output variables associated with each
plugin, as well as the general function of the plugin itself, an informational window previews
all relevant information as each function is selected (Fig 7D). Once the custom segmentation
process is run, all individual output variables are previewed as images in a separate window
(Fig 7E). Once users are satisfied with their plugin configuration, the configuration can be
saved, shared, commented on, and even rated for success at a certain task by multiple users
(Fig 7F).
Results and discussion
We used 1837 images to train, validate, and test the neural network. 3627 and 11922 feature
sets were categorized as spine and non-spine, respectively. Spine PD feature arrays were often
Automated identification of dendritic spines
PLOS ONE | https://doi.org/10.1371/journal.pone.0199589 July 5, 2018 9 / 16

marked with a pseudo-linear increase, and then a decrease, indicating the protruding shape of
the spine, while non-spine PD arrays tended to be flat, with a lower amplitude at the center
(Figs 4C and 8A). PS feature arrays, on the other hand, tended to have lower amplitudes when
associated with a spine, and had a more pronounced V-shape at non-spine positions (Figs 4C
and 8B).
As expected, the length of the spine backbone tended to be longer in spines versus non-
spines (Fig 5B). Spine IS feature arrays often had a pronounced increase followed by decrease
in amplitude, indicating the bright center of the dendritic spine, while non-spine groups were
characterized by a more linear drop-off in signal (Fig 5A).
Labeled data was split into three groups–Training (60%), Validation (20%), and Testing
(20%). Classifier results for training and testing data are shown in Fig 9. Overall, classification
accuracy was highly similar between training, test, and validation datasets, indicating that
there was no overfitting of the model. In the testing dataset, 94.5% of actual spines were classi-
fied as spines (true positive rate), and 5.5% were classified as non-spines (false negative). 98.5%
Fig 6. Graphical user interface to label and measure image regions. (A) Base dendrite analysis window responsible of loading/saving data, (B) switching
between images, (C) avoid particular files, and (D) running calculations on ROI area over time. (D) Image preview window for drawing polygonal/circle ROIs,
and identifying individual spines (red/black rhombi). (F) Spine selection and machine learning tool allows toggling of (G) spine selection mode, semi-
automated spine tracking, (H) gathering and previewing of training data, and spine finding using a trained neural network.
https://doi.org/10.1371/journal.pone.0199589.g006
Automated identification of dendritic spines
PLOS ONE | https://doi.org/10.1371/journal.pone.0199589 July 5, 2018 10 / 16

Fig 7. Graphical user interface for image segmentation. (A) The function selection window handles the available functions and their configuration. (B) All
available functions are displayed in the plugin repository. (C) Selected functions and their inputs are selected in the current configuration space. (D) A short
tutorial for each individual plugin is displayed upon selection. (E) Outputs of each plugin are previewed in a separate, scrollable window. (F) Plugin
configurations can be saved, shared, and rated between multiple users.
https://doi.org/10.1371/journal.pone.0199589.g007
Automated identification of dendritic spines
PLOS ONE | https://doi.org/10.1371/journal.pone.0199589 July 5, 2018 11 / 16

of non-spines were classified as non-spines (true negative) and 1.5% classified as spines (false
positive). The positive predictive value of the algorithm (precision) was 94.7%. These results
indicate that our model is highly successful in spine identification. Reshuffling of the training,
validation, and testing sets did not make any significant difference to the algorithm’s success.
Previous algorithms tend to report results that are either lower or as good. For example, Blu-
mer at al. [5] achieved a true positive rate and precision of 55% and 65%, respectively, on 2P
images, while Cheng et al. [7] saw results comparable to ours. Notably, many of these previous
algorithms report test results on extremely small datasets, suggesting a high probability of
overfitting. Algorithm functionality is also difficult to compare since some code is built specifi-
cally for images collected by other imaging tools, such as SEM, or using specific biomarkers.
None of the data from our validation group was used to train the model indicates the high pre-
dictive value of our algorithms. Furthermore, spine identification in dendrites collected at
magnification values different from those of the training data (Fig 9B) predicts the scalability
of our algorithm to broader datasets. In keeping with best community practices, we have made
our code and data open to the public in an easily accessible online format.
A major benefit of our spine classification algorithm is a lack of parameters which users are
required to tune. The only input required by the algorithm is the relative scale of the image in
pixels/μm, which can often be extracted automatically from images saved with modern imag-
ing software. Furthermore, we expect our algorithm to become more powerful and accurate
for dendritic spine identification as more training data becomes available. Therefore, we see
our algorithm as a particularly user-friendly option for those looking to automate fluorescent
0
1
2
3
1
102
104
106
1
102
104
106
-2 0 20
1
2
3
1
102
104
106
108
-2 0 21102
104
106
108
PD
(µm
)P
S (µ
m)
A
B
)mµ( noitisoP evitaleR)mµ( noitisoP evitaleR
Tota
l Tra
inin
g V
alue
sTo
tal T
rain
ing
Val
ues
0
1
2
3
1
102
104
106
1
102
104
106
-2 0 20
1
2
3
1
102
104
106
108
-2 0 21102
104
106
108
PD
(µm
)P
S (µ
m)
A
B
)mµ(noitisoPevitaleR)mµ(noitisoPevitaleR
Tota
l Tra
inin
g V
alue
sTo
tal T
rain
ing
Val
ues
Fig 8. Cumulative PD and PS features. Each chart represents total points binned from all feature vectors in. (A) Left–Spine, Right–Non-Spine binned feature
vectors. (B) Left–Spine, Right–Non-Spine binned feature vectors. Blue lines represent the average of all feature vectors in each group.
https://doi.org/10.1371/journal.pone.0199589.g008
Automated identification of dendritic spines
PLOS ONE | https://doi.org/10.1371/journal.pone.0199589 July 5, 2018 12 / 16

imaging and/or targeting of dendritic spines. In particular, we expect that the combination of
this technique with our previously developed spine imaging automation software [14] will lead
to significant increases in the throughput of spine imaging and stimulation.
It is important to note that while our algorithm lacks tunable parameters, it differs signifi-
cantly from the current state-of-the-art, end-to-end convolutional networks. Our model
includes automated denoising and thresholding steps which are explicitly programmed as
Target Class
Spi
neN
on-S
pine
Out
put C
lass
Training Confusion Matrix
245422.5%
1131.0%
95.6%4.4%
860.8%
823275.6%
99.0%1.0%
96.6%3.4%
98.6%1.4%
98.2%1.8%
Target Class
Out
put C
lass
Test Confusion Matrix
48120.6%
281.2%
94.5%5.5%
271.2%
179677.0%
98.5%1.5%
94.7%5.3%
98.5%1.5%
97.6%2.4%
Spine Non-Spine
Spi
neN
on-S
pine
Spine Non-Spine
True Positive
True Negative
False Positive
False Negative
A B
Fig 9. Neural Network’s ability to identify spines. (A) Training and Test confusion matrices. (B) Yellow circles
indicate spines identified by neural network in naïve images.
https://doi.org/10.1371/journal.pone.0199589.g009
Automated identification of dendritic spines
PLOS ONE | https://doi.org/10.1371/journal.pone.0199589 July 5, 2018 13 / 16

opposed to being learned. A common pitfall of including explicit processing steps in the pipe-
line is poor parameter tuning, which leads to imprecise feature selection, but we felt that our
algorithm performs adequately enough that these problems were generally avoided. The bene-
fit of including these initial steps over an end-to-end approach is an overall reduction in fea-
ture amount, which leads to smaller processing power for network training. Therefore, while
deep, convolutional networks are an invaluable tool in computer vision, we feel that a shallow
network with explicit feature selection is simple, effective, and practical, making it a useful tool
for the identification of fluorescent subcellular features such as dendritic spines.
While many techniques have been developed to identify dendritic spines [5–11, 22], many
of these techniques were specifically designed for post-hoc analysis, relying on additional
human input to correct mistakes. While our algorithm does not claim to have 100% accuracy,
its goal is to identify a large majority of clearly demarcated spines, specific to a single focus
plane, within a sample for automated imaging and photostimulation. For such an automated
system to work, spine labeling must require no human input, and have a minimal number of
false positives, which lead to throwaway data. Our algorithm accomplishes precisely this feat,
relying only on machine learning and previously labeled training data. Furthermore, to mini-
mize the amount of human training time necessary to train the neural network algorithm,
we’ve taken steps to simplify our data as much as possible, reducing images to a set of feature
vectors which convey important information about spine shape. Since our training data and
code is open-sourced and shared online, we expect other labs to build upon and improve our
algorithm by adding their own training data, therefore increasing the potential accuracy of
spine identification. Furthermore, our software can add additional training features, allowing
for even further improvements of detection accuracy.
Conclusion
Overall, we believe that our neural network model for automated spine identification in fluo-
rescent neurons is highly accurate, scalable, and is built to easily be upgraded with the addition
of training data and programmatic improvements. Due to its open-source availability, simplic-
ity, and lack of tunable features, we expect this software to be used both in post-hoc spine anal-
ysis, as well as for automated spine tracking during imaging experiments.
Author Contributions
Conceptualization: Michael S. Smirnov, Ryohei Yasuda.
Data curation: Tavita R. Garrett.
Formal analysis: Michael S. Smirnov, Tavita R. Garrett, Ryohei Yasuda.
Funding acquisition: Ryohei Yasuda.
Investigation: Michael S. Smirnov, Tavita R. Garrett.
Methodology: Michael S. Smirnov, Ryohei Yasuda.
Project administration: Michael S. Smirnov, Ryohei Yasuda.
Resources: Ryohei Yasuda.
Software: Michael S. Smirnov.
Validation: Michael S. Smirnov.
Visualization: Michael S. Smirnov.
Writing – original draft: Michael S. Smirnov.
Automated identification of dendritic spines
PLOS ONE | https://doi.org/10.1371/journal.pone.0199589 July 5, 2018 14 / 16

Writing – review & editing: Michael S. Smirnov, Tavita R. Garrett, Ryohei Yasuda.
References1. Kasai H, Fukuda M, Watanabe S, Hayashi-Takagi A, Noguchi J. Structural dynamics of dendritic spines
in memory and cognition. Trends in Neurosciences. 2010; 33(3):121–9. https://doi.org/10.1016/j.tins.
2010.01.001 PMID: 20138375
2. Kim IH, Wang H, Soderling SH, Yasuda R. Loss of Cdc42 leads to defects in synaptic plasticity and
remote memory recall. Elife. 2014; 3:e02839–e. https://doi.org/10.7554/eLife.02839 PMID: 25006034;
PubMed Central PMCID: PMCPMC4115656.
3. Hoover EE, Squier JA. Advances in multiphoton microscopy technology. Nature photonics. 2013; 7
(2):93–101. https://doi.org/10.1038/nphoton.2012.361 PMID: 24307915
4. Svoboda K, Yasuda R. Principles of Two-Photon Excitation Microscopy and Its Applications to Neuro-
science. Neuron. 2006; 50(6):823–39. https://doi.org/10.1016/j.neuron.2006.05.019 PMID: 16772166
5. Blumer C, Vivien C, Genoud C, Perez-Alvarez A, Wiegert JS, Vetter T, et al. Automated analysis of
spine dynamics on live CA1 pyramidal cells. Medical image analysis. 2014; 19(1):87–97. https://doi.org/
10.1016/j.media.2014.09.004 PMID: 25299432
6. Cheng J. Automated detection and time lapse analysis of dendritic spines in laser scanning microscopy
images. 2009;Northeaste(April):n/a-n/a.
7. Cheng J, Zhou X, Miller E, Witt RM, Zhu J, Sabatini BL, et al. A novel computational approach for auto-
matic dendrite spines detection in two-photon laser scan microscopy. J Neurosci Methods. 2007; 165
(1):122–34. https://doi.org/10.1016/j.jneumeth.2007.05.020 PMID: 17629570; PubMed Central
PMCID: PMCPMC1989684.
8. Sa Swanger, Yao X, Gross C, Bassell GJ. Automated 4D analysis of dendritic spine morphology: appli-
cations to stimulus-induced spine remodeling and pharmacological rescue in a disease model. Molecu-
lar Brain. 2011; 4(1):38–. https://doi.org/10.1186/1756-6606-4-38 PMID: 21982080
9. Wang S, Chen M, Li Y, Zhang Y, Han L, Wu J, et al. Detection of Dendritic Spines Using Wavelet-
Based Conditional Symmetric Analysis and Regularized Morphological Shared-Weight Neural Net-
works. Comput Math Methods Med. 2015; 2015:454076. https://doi.org/10.1155/2015/454076 PMID:
26692046; PubMed Central PMCID: PMCPMC4672122.
10. Zhang Y, Chen K, Baron M, Teylan Ma, Kim Y, Song Z, et al. A neurocomputational method for fully
automated 3D dendritic spine detection and segmentation of medium-sized spiny neurons. Neuro-
Image. 2010; 50(4):1472–84. https://doi.org/10.1016/j.neuroimage.2010.01.048 PMID: 20100579
11. Gala R, Chapeton J, Jitesh J, Bhavsar C, Stepanyants A. Active learning of neuron morphology for
accurate automated tracing of neurites. Frontiers in neuroanatomy. 2014; 8(May):37–. https://doi.org/
10.3389/fnana.2014.00037 PMID: 24904306
12. Stoppini L, Buchs PA, Muller D. A simple method for organotypic cultures of nervous tissue. J Neurosci
Methods. 1991; 37(2):173–82. PMID: 1715499.
13. Pologruto TA, Sabatini BL, Svoboda K. ScanImage: flexible software for operating laser scanning
microscopes. Biomed Eng Online. 2003; 2(1):13. https://doi.org/10.1186/1475-925X-2-13 PMID:
12801419; PubMed Central PMCID: PMCPMC161784.
14. Smirnov MS, Evans PR, Garrett TR, Yan L, Yasuda R. Automated Remote Focusing, Drift Correction,
and Photostimulation to Evaluate Structural Plasticity in Dendritic Spines. PLoS One. 2017; 12(1):
e0170586. https://doi.org/10.1371/journal.pone.0170586 PMID: 28114380; PubMed Central PMCID:
PMCPMC5256890.
15. Møller MF. A scaled conjugate gradient algorithm for fast supervised learning. Neural networks. 1993; 6
(4):525–33.
16. Michael S, Tavita G. Labeled Dendritic Spines—Training Data. 2018. https://doi.org/10.6084/m9.
figshare.6149207.v1
17. Otsu N. A threshold selection method from gray-level histograms. IEEE Transactions on systems, man,
and cybernetics. 1979; 9(1):62–6.
18. Lam L, Lee S-W, Suen CY. Thinning methodologies-a comprehensive survey. IEEE Transactions on
pattern analysis and machine intelligence. 1992; 14(9):869–85.
19. Kong TY, Rosenfeld A. Topological algorithms for digital image processing: Elsevier; 1996.
20. Soille P. Morphological image analysis: principles and applications: Springer Science & Business
Media; 2013.
Automated identification of dendritic spines
PLOS ONE | https://doi.org/10.1371/journal.pone.0199589 July 5, 2018 15 / 16

21. Sethian JA. A fast marching level set method for monotonically advancing fronts. Proceedings of the
National Academy of Sciences. 1996; 93(4):1591–5.
22. Jungblut D, Vlachos A, Schuldt G, Zahn N, Deller T, Wittum G. SpineLab: tool for three-dimensional
reconstruction of neuronal cell morphology. J Biomed Opt. 2012; 17(7):076007. https://doi.org/10.1117/
1.JBO.17.7.076007 PMID: 22894490.
Automated identification of dendritic spines
PLOS ONE | https://doi.org/10.1371/journal.pone.0199589 July 5, 2018 16 / 16