Embed Size (px)
Citation preview
EARTH SURFACE PROCESSES AND LANDFORMSEarth Surf. Process. Landforms 37, 240–248 (2012)Copyright © 2011 John Wiley & Sons, Ltd.Published online 9 December 2011 in Wiley Online Library(wileyonlinelibrary.com) DOI: 10.1002/esp.2255
Letters to ESEX
An opportunity to connect the morphodynamics ofalternate bars with their sedimentary productsStephane Rodrigues,1* Nicolas Claude,1 Philippe Juge2 and Jean-Gabriel Breheret11 Université François Rabelais de Tours, CNRS/INSU, Institut des Sciences de la Terre d’Orléans, UMR 6113, UFR des Sciences etTechniques, Parc de Grandmont, 37200 Tours, France
2 Université François Rabelais de Tours, CETU ELMIS, Centre Universitaire de Chinon, 11 quai Danton, 37500 Chinon, France
Received 23 February 2011; Revised 3 October 2011; Accepted 10 October 2011
*Correspondence to: Stephane Rodrigues, Université François Rabelais de Tours, CNRS/INSU, Institut des Sciences de la Terre d’Orléans, UMR 6113, UFR des Sciences etTechniques, Parc de Grandmont, 37200 Tours, France. E-mail: [email protected]
ABSTRACT: Field investigations that help clarify local sedimentary processes involved in the migration of alternate bars as aconsequence of flood events are lacking. A simple approach combining scour chains, stratigraphy and frequent bathymetricsurveys is proposed to connect the dynamics of free migrating alternate bars present in disconnected channels of largesandy-gravelly rivers with their sedimentary products and vice versa. The results show that the spatial distribution of barsbefore a flood partly governs the scour and fill processes and that the sediment transport rates vary significantly on a singlecross-section. This can be due to preferential axes of the migration of the bars determined by their location on the cross-section, the bank direction and the discharge. The approach allows the reconstruction of local sedimentary processes involvedin alternate bar migration by combining maximum scour depths reached during a flood with frequent channel bed topographysurveys and post-flood stratigraphy. It is also possible to distinguish deposited and preserved sediments compared withsediments by-passed during the flood. Copyright © 2011 John Wiley & Sons, Ltd.
KEYWORDS: alternate bars; field study; sequential channel bed topography; bedload transport; scour chains; stratigraphy; Loire River; flood
Introduction
Alternate bars are sediment waves consisting of consecutivediagonal fronts with low slope riffles located upstream;they are generated by the instability of turbulent flows overan erodible bed (Callander, 1969; Colombini et al., 1987;Seminara and Tubino, 1989; Tubino, 1991). These barshave been heavily studied by mathematical or experimentalinvestigations focusing on their formation (Lisle et al., 1991;Tubino, 1991; Schielen et al., 1993) and their role inchannel pattern (Lewin, 1976; Parker, 1976; Fredsoe,1978; Blondeaux and Seminara, 1985; Crosato andMosselman, 2009; Kleinhans and van den Berg, 2010).However, field investigations are scarce (Lewin, 1976) andare needed to validate the corpus of theoretical studies(Welford, 1994).The role played by bars in alluvial architecture has been
documented by facies models developed for various rivertypes (Bridge, 1977; Cant and Walker, 1978; Best et al.,2003; Lunt et al., 2004; Hassan et al., 2009; Rice et al.,2009). These facies models highlighted the limits of reconsti-tuting the processes involved in the formation of alluvialsequences (Bridge, 1993; Lunt and Bridge, 2004; SambrookSmith et al., 2010).
This paper describes a field investigation performed ontwo alternate migrating bars in a single-row configuration(as defined by Ikeda, 1984) present in an anabranch of theRiver Loire (France). The goal is to understand the linksbetween the morphodynamics of alternate bars during aflood and their sedimentary products. It is proposed herethat tested methods should be combined to produce asimple field approach that can be applied to other largesandy rivers characterized by disconnected channels.
Study Site
The studied channel is located at Ingrandes (30 km down-stream of Angers, Figure 1). The slope of the river is approx-imately 0�00025mm–1 and the bedload consists of amixture of siliceous sand and gravel. At the gauging stationof Montjean (6 km upstream of the investigated reach), thedischarge is 850m3 s–1 on average and is approximately3200m3 s–1 for a two-year flood return period. The second-ary channel studied is 3070m long and its average width is300m. This channel is only inundated during flood eventsbut water can be present in the pools and between the barsat low flows (Figure 1). The banks are rip-raped and the
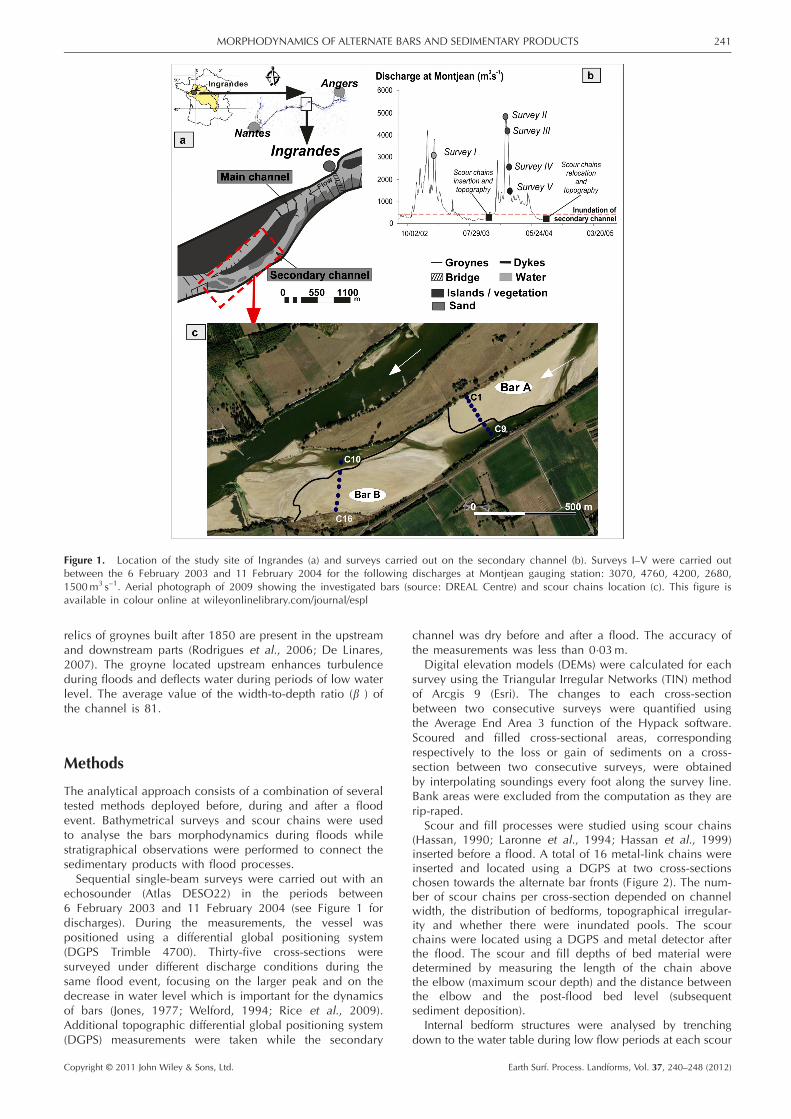
Figure 1. Location of the study site of Ingrandes (a) and surveys carried out on the secondary channel (b). Surveys I–V were carried outbetween the 6 February 2003 and 11 February 2004 for the following discharges at Montjean gauging station: 3070, 4760, 4200, 2680,1500m3 s–1. Aerial photograph of 2009 showing the investigated bars (source: DREAL Centre) and scour chains location (c). This figure isavailable in colour online at wileyonlinelibrary.com/journal/espl
241MORPHODYNAMICS OF ALTERNATE BARS AND SEDIMENTARY PRODUCTS
relics of groynes built after 1850 are present in the upstreamand downstream parts (Rodrigues et al., 2006; De Linares,2007). The groyne located upstream enhances turbulenceduring floods and deflects water during periods of low waterlevel. The average value of the width-to-depth ratio (b ) ofthe channel is 81.
Methods
The analytical approach consists of a combination of severaltested methods deployed before, during and after a floodevent. Bathymetrical surveys and scour chains were usedto analyse the bars morphodynamics during floods whilestratigraphical observations were performed to connect thesedimentary products with flood processes.Sequential single-beam surveys were carried out with an
echosounder (Atlas DESO22) in the periods between6 February 2003 and 11 February 2004 (see Figure 1 fordischarges). During the measurements, the vessel waspositioned using a differential global positioning system(DGPS Trimble 4700). Thirty-five cross-sections weresurveyed under different discharge conditions during thesame flood event, focusing on the larger peak and on thedecrease in water level which is important for the dynamicsof bars (Jones, 1977; Welford, 1994; Rice et al., 2009).Additional topographic differential global positioning system(DGPS) measurements were taken while the secondary
Copyright © 2011 John Wiley & Sons, Ltd.
channel was dry before and after a flood. The accuracy ofthe measurements was less than 0�03m.
Digital elevation models (DEMs) were calculated for eachsurvey using the Triangular Irregular Networks (TIN) methodof Arcgis 9 (Esri). The changes to each cross-sectionbetween two consecutive surveys were quantified usingthe Average End Area 3 function of the Hypack software.Scoured and filled cross-sectional areas, correspondingrespectively to the loss or gain of sediments on a cross-section between two consecutive surveys, were obtainedby interpolating soundings every foot along the survey line.Bank areas were excluded from the computation as they arerip-raped.
Scour and fill processes were studied using scour chains(Hassan, 1990; Laronne et al., 1994; Hassan et al., 1999)inserted before a flood. A total of 16 metal-link chains wereinserted and located using a DGPS at two cross-sectionschosen towards the alternate bar fronts (Figure 2). The num-ber of scour chains per cross-section depended on channelwidth, the distribution of bedforms, topographical irregular-ity and whether there were inundated pools. The scourchains were located using a DGPS and metal detector afterthe flood. The scour and fill depths of bed material weredetermined by measuring the length of the chain abovethe elbow (maximum scour depth) and the distance betweenthe elbow and the post-flood bed level (subsequentsediment deposition).
Internal bedform structures were analysed by trenchingdown to the water table during low flow periods at each scour
Earth Surf. Process. Landforms, Vol. 37, 240–248 (2012)
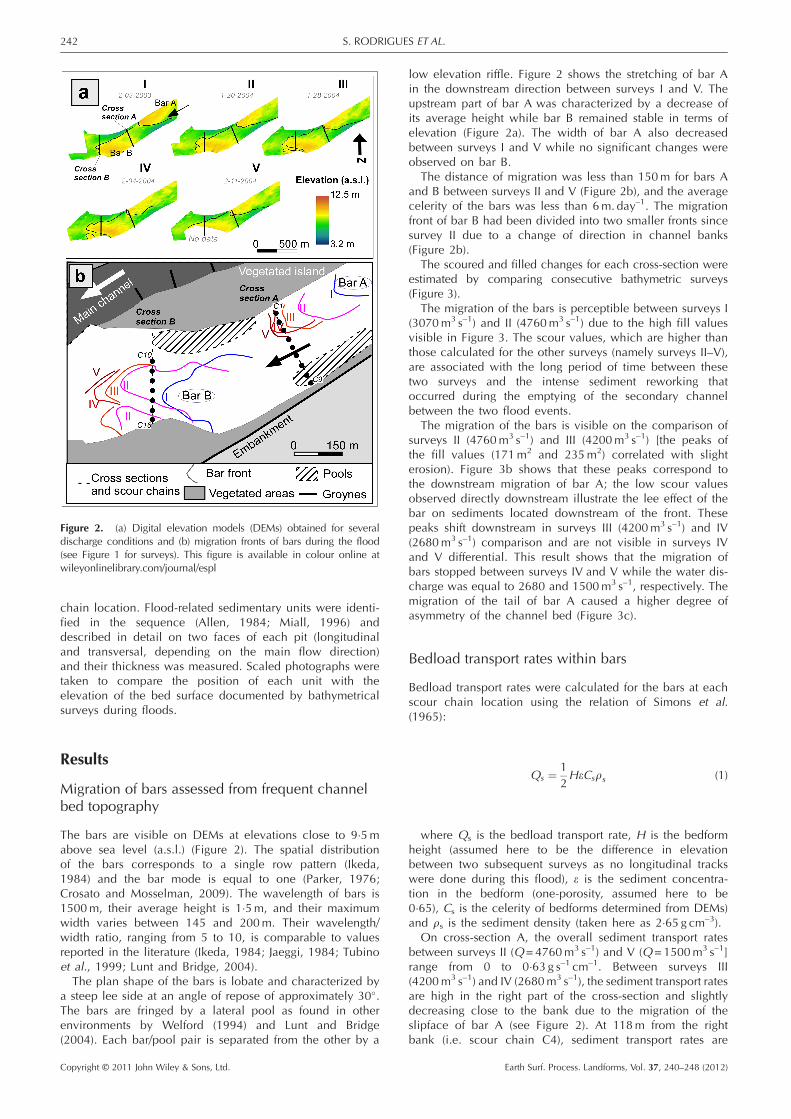
Figure 2. (a) Digital elevation models (DEMs) obtained for severaldischarge conditions and (b) migration fronts of bars during the flood(see Figure 1 for surveys). This figure is available in colour online atwileyonlinelibrary.com/journal/espl
242 S. RODRIGUES ET AL.
chain location. Flood-related sedimentary units were identi-fied in the sequence (Allen, 1984; Miall, 1996) anddescribed in detail on two faces of each pit (longitudinaland transversal, depending on the main flow direction)and their thickness was measured. Scaled photographs weretaken to compare the position of each unit with theelevation of the bed surface documented by bathymetricalsurveys during floods.
Results
Migration of bars assessed from frequent channelbed topography
The bars are visible on DEMs at elevations close to 9�5mabove sea level (a.s.l.) (Figure 2). The spatial distributionof the bars corresponds to a single row pattern (Ikeda,1984) and the bar mode is equal to one (Parker, 1976;Crosato and Mosselman, 2009). The wavelength of bars is1500m, their average height is 1�5m, and their maximumwidth varies between 145 and 200m. Their wavelength/width ratio, ranging from 5 to 10, is comparable to valuesreported in the literature (Ikeda, 1984; Jaeggi, 1984; Tubinoet al., 1999; Lunt and Bridge, 2004).The plan shape of the bars is lobate and characterized by
a steep lee side at an angle of repose of approximately 30�.The bars are fringed by a lateral pool as found in otherenvironments by Welford (1994) and Lunt and Bridge(2004). Each bar/pool pair is separated from the other by a
Copyright © 2011 John Wiley & Sons, Ltd.
low elevation riffle. Figure 2 shows the stretching of bar Ain the downstream direction between surveys I and V. Theupstream part of bar A was characterized by a decrease ofits average height while bar B remained stable in terms ofelevation (Figure 2a). The width of bar A also decreasedbetween surveys I and V while no significant changes wereobserved on bar B.
The distance of migration was less than 150m for bars Aand B between surveys II and V (Figure 2b), and the averagecelerity of the bars was less than 6m. day–1. The migrationfront of bar B had been divided into two smaller fronts sincesurvey II due to a change of direction in channel banks(Figure 2b).
The scoured and filled changes for each cross-section wereestimated by comparing consecutive bathymetric surveys(Figure 3).
The migration of the bars is perceptible between surveys I(3070m3 s–1) and II (4760m3 s–1) due to the high fill valuesvisible in Figure 3. The scour values, which are higher thanthose calculated for the other surveys (namely surveys II–V),are associated with the long period of time between thesetwo surveys and the intense sediment reworking thatoccurred during the emptying of the secondary channelbetween the two flood events.
The migration of the bars is visible on the comparison ofsurveys II (4760m3 s–1) and III (4200m3 s–1) [the peaks ofthe fill values (171m2 and 235m2) correlated with slighterosion). Figure 3b shows that these peaks correspond tothe downstream migration of bar A; the low scour valuesobserved directly downstream illustrate the lee effect of thebar on sediments located downstream of the front. Thesepeaks shift downstream in surveys III (4200m3 s–1) and IV(2680m3 s–1) comparison and are not visible in surveys IVand V differential. This result shows that the migration ofbars stopped between surveys IV and V while the water dis-charge was equal to 2680 and 1500m3 s–1, respectively. Themigration of the tail of bar A caused a higher degree ofasymmetry of the channel bed (Figure 3c).
Bedload transport rates within bars
Bedload transport rates were calculated for the bars at eachscour chain location using the relation of Simons et al.(1965):
Qs ¼ 12HeCsrs (1)
where Qs is the bedload transport rate, H is the bedformheight (assumed here to be the difference in elevationbetween two subsequent surveys as no longitudinal trackswere done during this flood), e is the sediment concentra-tion in the bedform (one-porosity, assumed here to be0�65), Cs is the celerity of bedforms determined from DEMs)and rs is the sediment density (taken here as 2�65 g cm–3).
On cross-section A, the overall sediment transport ratesbetween surveys II (Q= 4760m3 s–1) and V (Q= 1500m3 s–1]range from 0 to 0�63 g s–1 cm–1. Between surveys III(4200m3 s–1) and IV (2680m3 s–1), the sediment transport ratesare high in the right part of the cross-section and slightlydecreasing close to the bank due to the migration of theslipface of bar A (see Figure 2). At 118m from the rightbank (i.e. scour chain C4), sediment transport rates are
Earth Surf. Process. Landforms, Vol. 37, 240–248 (2012)
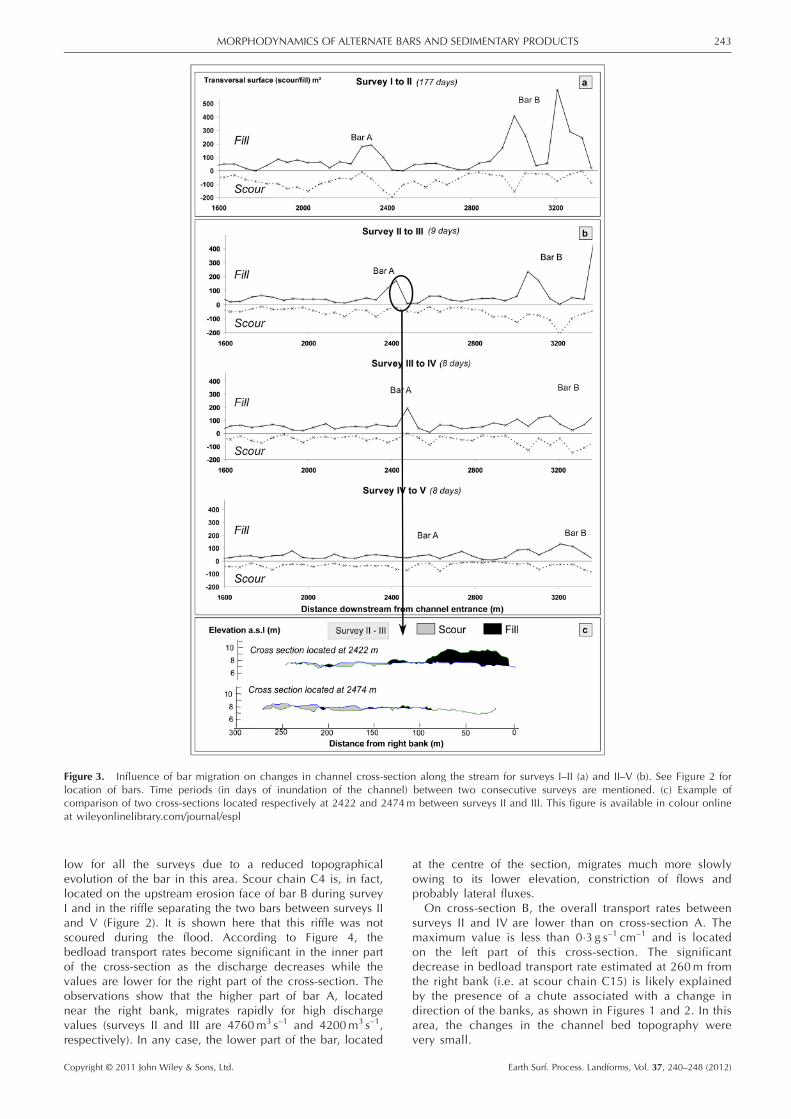
Figure 3. Influence of bar migration on changes in channel cross-section along the stream for surveys I–II (a) and II–V (b). See Figure 2 forlocation of bars. Time periods (in days of inundation of the channel) between two consecutive surveys are mentioned. (c) Example ofcomparison of two cross-sections located respectively at 2422 and 2474m between surveys II and III. This figure is available in colour onlineat wileyonlinelibrary.com/journal/espl
243MORPHODYNAMICS OF ALTERNATE BARS AND SEDIMENTARY PRODUCTS
low for all the surveys due to a reduced topographicalevolution of the bar in this area. Scour chain C4 is, in fact,located on the upstream erosion face of bar B during surveyI and in the riffle separating the two bars between surveys IIand V (Figure 2). It is shown here that this riffle was notscoured during the flood. According to Figure 4, thebedload transport rates become significant in the inner partof the cross-section as the discharge decreases while thevalues are lower for the right part of the cross-section. Theobservations show that the higher part of bar A, locatednear the right bank, migrates rapidly for high dischargevalues (surveys II and III are 4760m3 s–1 and 4200m3 s–1,respectively). In any case, the lower part of the bar, located
Copyright © 2011 John Wiley & Sons, Ltd.
at the centre of the section, migrates much more slowlyowing to its lower elevation, constriction of flows andprobably lateral fluxes.
On cross-section B, the overall transport rates betweensurveys II and IV are lower than on cross-section A. Themaximum value is less than 0�3 g s–1 cm–1 and is locatedon the left part of this cross-section. The significantdecrease in bedload transport rate estimated at 260m fromthe right bank (i.e. at scour chain C15) is likely explainedby the presence of a chute associated with a change indirection of the banks, as shown in Figures 1 and 2. In thisarea, the changes in the channel bed topography werevery small.
Earth Surf. Process. Landforms, Vol. 37, 240–248 (2012)
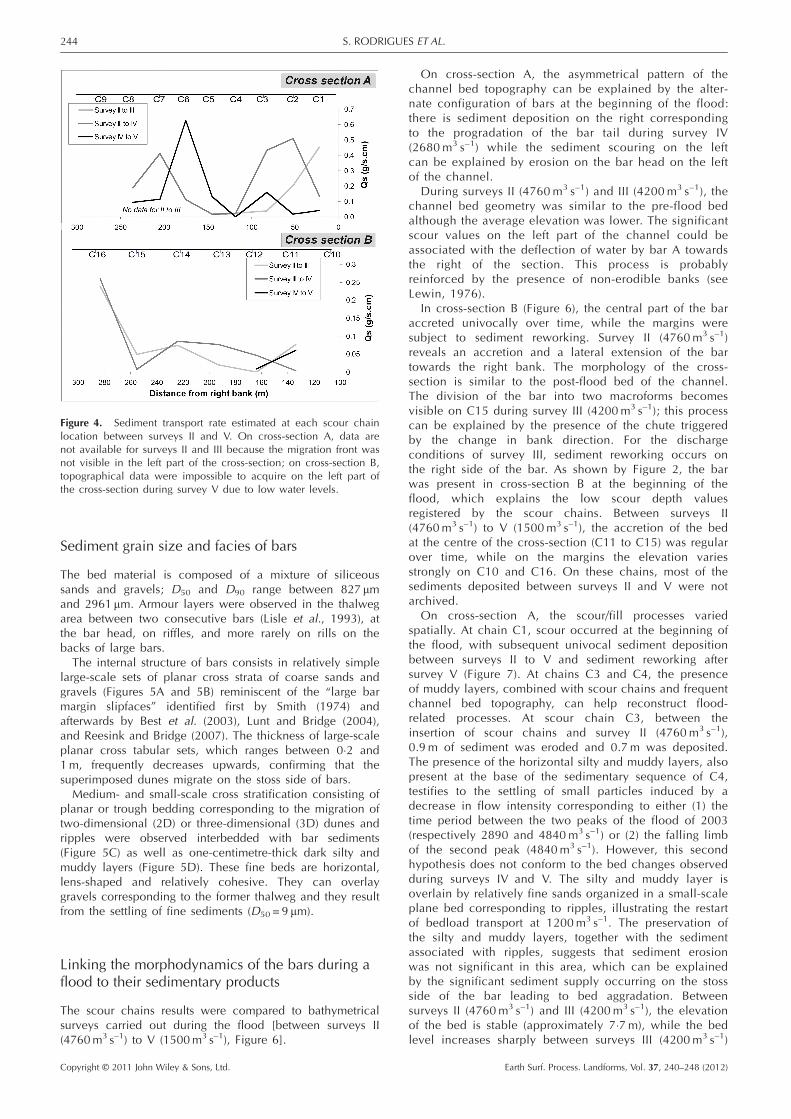
Figure 4. Sediment transport rate estimated at each scour chainlocation between surveys II and V. On cross-section A, data arenot available for surveys II and III because the migration front wasnot visible in the left part of the cross-section; on cross-section B,topographical data were impossible to acquire on the left part ofthe cross-section during survey V due to low water levels.
244 S. RODRIGUES ET AL.
Sediment grain size and facies of bars
The bed material is composed of a mixture of siliceoussands and gravels; D50 and D90 range between 827 mmand 2961 mm. Armour layers were observed in the thalwegarea between two consecutive bars (Lisle et al., 1993), atthe bar head, on riffles, and more rarely on rills on thebacks of large bars.The internal structure of bars consists in relatively simple
large-scale sets of planar cross strata of coarse sands andgravels (Figures 5A and 5B) reminiscent of the “large barmargin slipfaces” identified first by Smith (1974) andafterwards by Best et al. (2003), Lunt and Bridge (2004),and Reesink and Bridge (2007). The thickness of large-scaleplanar cross tabular sets, which ranges between 0�2 and1m, frequently decreases upwards, confirming that thesuperimposed dunes migrate on the stoss side of bars.Medium- and small-scale cross stratification consisting of
planar or trough bedding corresponding to the migration oftwo-dimensional (2D) or three-dimensional (3D) dunes andripples were observed interbedded with bar sediments(Figure 5C) as well as one-centimetre-thick dark silty andmuddy layers (Figure 5D). These fine beds are horizontal,lens-shaped and relatively cohesive. They can overlaygravels corresponding to the former thalweg and they resultfrom the settling of fine sediments (D50 = 9 mm).
Linking the morphodynamics of the bars during aflood to their sedimentary products
The scour chains results were compared to bathymetricalsurveys carried out during the flood [between surveys II(4760m3 s–1) to V (1500m3 s–1), Figure 6].
Copyright © 2011 John Wiley & Sons, Ltd.
On cross-section A, the asymmetrical pattern of thechannel bed topography can be explained by the alter-nate configuration of bars at the beginning of the flood:there is sediment deposition on the right correspondingto the progradation of the bar tail during survey IV(2680m3 s–1) while the sediment scouring on the leftcan be explained by erosion on the bar head on the leftof the channel.
During surveys II (4760m3 s–1) and III (4200m3 s–1), thechannel bed geometry was similar to the pre-flood bedalthough the average elevation was lower. The significantscour values on the left part of the channel could beassociated with the deflection of water by bar A towardsthe right of the section. This process is probablyreinforced by the presence of non-erodible banks (seeLewin, 1976).
In cross-section B (Figure 6), the central part of the baraccreted univocally over time, while the margins weresubject to sediment reworking. Survey II (4760m3 s–1)reveals an accretion and a lateral extension of the bartowards the right bank. The morphology of the cross-section is similar to the post-flood bed of the channel.The division of the bar into two macroforms becomesvisible on C15 during survey III (4200m3 s–1); this processcan be explained by the presence of the chute triggeredby the change in bank direction. For the dischargeconditions of survey III, sediment reworking occurs onthe right side of the bar. As shown by Figure 2, the barwas present in cross-section B at the beginning of theflood, which explains the low scour depth valuesregistered by the scour chains. Between surveys II(4760m3 s–1) to V (1500m3 s–1), the accretion of the bedat the centre of the cross-section (C11 to C15) was regularover time, while on the margins the elevation variesstrongly on C10 and C16. On these chains, most of thesediments deposited between surveys II and V were notarchived.
On cross-section A, the scour/fill processes variedspatially. At chain C1, scour occurred at the beginning ofthe flood, with subsequent univocal sediment depositionbetween surveys II to V and sediment reworking aftersurvey V (Figure 7). At chains C3 and C4, the presenceof muddy layers, combined with scour chains and frequentchannel bed topography, can help reconstruct flood-related processes. At scour chain C3, between theinsertion of scour chains and survey II (4760m3 s–1),0.9m of sediment was eroded and 0.7m was deposited.The presence of the horizontal silty and muddy layers, alsopresent at the base of the sedimentary sequence of C4,testifies to the settling of small particles induced by adecrease in flow intensity corresponding to either (1) thetime period between the two peaks of the flood of 2003(respectively 2890 and 4840m3 s–1) or (2) the falling limbof the second peak (4840m3 s–1). However, this secondhypothesis does not conform to the bed changes observedduring surveys IV and V. The silty and muddy layer isoverlain by relatively fine sands organized in a small-scaleplane bed corresponding to ripples, illustrating the restartof bedload transport at 1200m3 s–1. The preservation ofthe silty and muddy layers, together with the sedimentassociated with ripples, suggests that sediment erosionwas not significant in this area, which can be explainedby the significant sediment supply occurring on the stossside of the bar leading to bed aggradation. Betweensurveys II (4760m3 s–1) and III (4200m3 s–1), the elevationof the bed is stable (approximately 7�7m), while the bedlevel increases sharply between surveys III (4200m3 s–1)
Earth Surf. Process. Landforms, Vol. 37, 240–248 (2012)
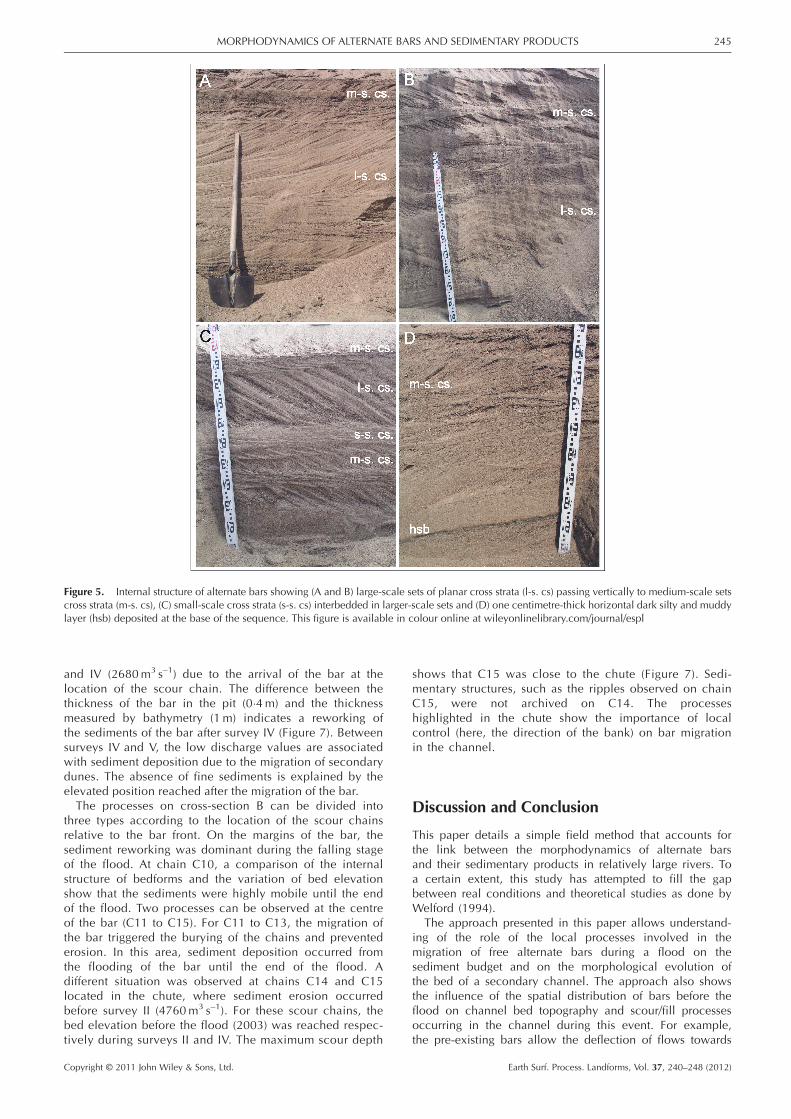
Figure 5. Internal structure of alternate bars showing (A and B) large-scale sets of planar cross strata (l-s. cs) passing vertically to medium-scale setscross strata (m-s. cs), (C) small-scale cross strata (s-s. cs) interbedded in larger-scale sets and (D) one centimetre-thick horizontal dark silty and muddylayer (hsb) deposited at the base of the sequence. This figure is available in colour online at wileyonlinelibrary.com/journal/espl
245MORPHODYNAMICS OF ALTERNATE BARS AND SEDIMENTARY PRODUCTS
and IV (2680m3 s–1) due to the arrival of the bar at thelocation of the scour chain. The difference between thethickness of the bar in the pit (0�4m) and the thicknessmeasured by bathymetry (1 m) indicates a reworking ofthe sediments of the bar after survey IV (Figure 7). Betweensurveys IV and V, the low discharge values are associatedwith sediment deposition due to the migration of secondarydunes. The absence of fine sediments is explained by theelevated position reached after the migration of the bar.The processes on cross-section B can be divided into
three types according to the location of the scour chainsrelative to the bar front. On the margins of the bar, thesediment reworking was dominant during the falling stageof the flood. At chain C10, a comparison of the internalstructure of bedforms and the variation of bed elevationshow that the sediments were highly mobile until the endof the flood. Two processes can be observed at the centreof the bar (C11 to C15). For C11 to C13, the migration ofthe bar triggered the burying of the chains and preventederosion. In this area, sediment deposition occurred fromthe flooding of the bar until the end of the flood. Adifferent situation was observed at chains C14 and C15located in the chute, where sediment erosion occurredbefore survey II (4760m3 s–1). For these scour chains, thebed elevation before the flood (2003) was reached respec-tively during surveys II and IV. The maximum scour depth
Copyright © 2011 John Wiley & Sons, Ltd.
shows that C15 was close to the chute (Figure 7). Sedi-mentary structures, such as the ripples observed on chainC15, were not archived on C14. The processeshighlighted in the chute show the importance of localcontrol (here, the direction of the bank) on bar migrationin the channel.
Discussion and Conclusion
This paper details a simple field method that accounts forthe link between the morphodynamics of alternate barsand their sedimentary products in relatively large rivers. Toa certain extent, this study has attempted to fill the gapbetween real conditions and theoretical studies as done byWelford (1994).
The approach presented in this paper allows understand-ing of the role of the local processes involved in themigration of free alternate bars during a flood on thesediment budget and on the morphological evolution ofthe bed of a secondary channel. The approach also showsthe influence of the spatial distribution of bars before theflood on channel bed topography and scour/fill processesoccurring in the channel during this event. For example,the pre-existing bars allow the deflection of flows towards
Earth Surf. Process. Landforms, Vol. 37, 240–248 (2012)
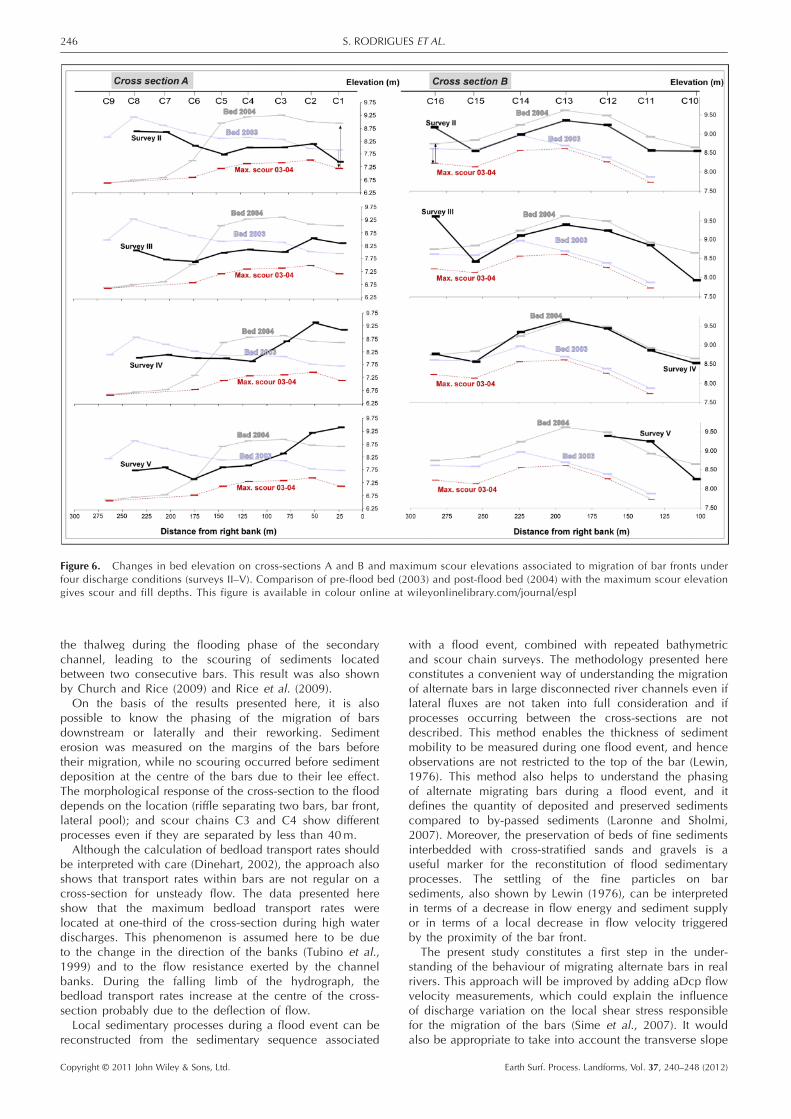
Figure 6. Changes in bed elevation on cross-sections A and B and maximum scour elevations associated to migration of bar fronts underfour discharge conditions (surveys II–V). Comparison of pre-flood bed (2003) and post-flood bed (2004) with the maximum scour elevationgives scour and fill depths. This figure is available in colour online at wileyonlinelibrary.com/journal/espl
246 S. RODRIGUES ET AL.
the thalweg during the flooding phase of the secondarychannel, leading to the scouring of sediments locatedbetween two consecutive bars. This result was also shownby Church and Rice (2009) and Rice et al. (2009).On the basis of the results presented here, it is also
possible to know the phasing of the migration of barsdownstream or laterally and their reworking. Sedimenterosion was measured on the margins of the bars beforetheir migration, while no scouring occurred before sedimentdeposition at the centre of the bars due to their lee effect.The morphological response of the cross-section to the flooddepends on the location (riffle separating two bars, bar front,lateral pool); and scour chains C3 and C4 show differentprocesses even if they are separated by less than 40m.Although the calculation of bedload transport rates should
be interpreted with care (Dinehart, 2002), the approach alsoshows that transport rates within bars are not regular on across-section for unsteady flow. The data presented hereshow that the maximum bedload transport rates werelocated at one-third of the cross-section during high waterdischarges. This phenomenon is assumed here to be dueto the change in the direction of the banks (Tubino et al.,1999) and to the flow resistance exerted by the channelbanks. During the falling limb of the hydrograph, thebedload transport rates increase at the centre of the cross-section probably due to the deflection of flow.Local sedimentary processes during a flood event can be
reconstructed from the sedimentary sequence associated
Copyright © 2011 John Wiley & Sons, Ltd.
with a flood event, combined with repeated bathymetricand scour chain surveys. The methodology presented hereconstitutes a convenient way of understanding the migrationof alternate bars in large disconnected river channels even iflateral fluxes are not taken into full consideration and ifprocesses occurring between the cross-sections are notdescribed. This method enables the thickness of sedimentmobility to be measured during one flood event, and henceobservations are not restricted to the top of the bar (Lewin,1976). This method also helps to understand the phasingof alternate migrating bars during a flood event, and itdefines the quantity of deposited and preserved sedimentscompared to by-passed sediments (Laronne and Sholmi,2007). Moreover, the preservation of beds of fine sedimentsinterbedded with cross-stratified sands and gravels is auseful marker for the reconstitution of flood sedimentaryprocesses. The settling of the fine particles on barsediments, also shown by Lewin (1976), can be interpretedin terms of a decrease in flow energy and sediment supplyor in terms of a local decrease in flow velocity triggeredby the proximity of the bar front.
The present study constitutes a first step in the under-standing of the behaviour of migrating alternate bars in realrivers. This approach will be improved by adding aDcp flowvelocity measurements, which could explain the influenceof discharge variation on the local shear stress responsiblefor the migration of the bars (Sime et al., 2007). It wouldalso be appropriate to take into account the transverse slope
Earth Surf. Process. Landforms, Vol. 37, 240–248 (2012)
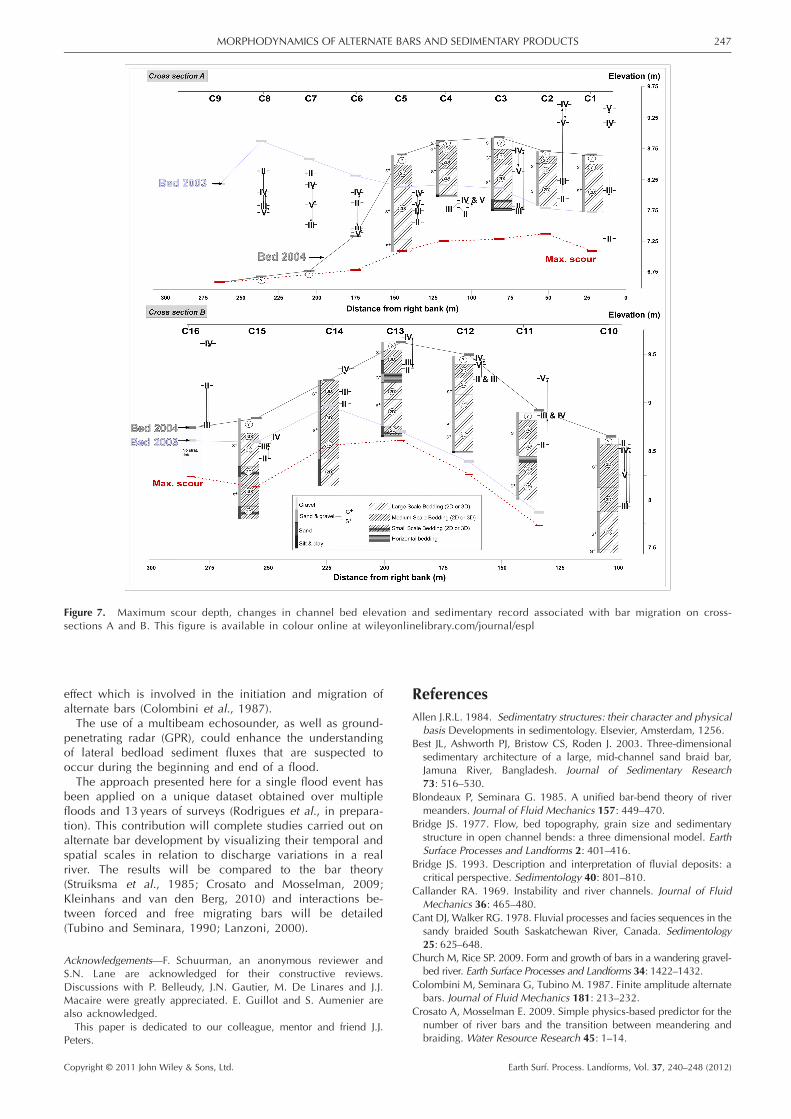
Figure 7. Maximum scour depth, changes in channel bed elevation and sedimentary record associated with bar migration on cross-sections A and B. This figure is available in colour online at wileyonlinelibrary.com/journal/espl
247MORPHODYNAMICS OF ALTERNATE BARS AND SEDIMENTARY PRODUCTS
effect which is involved in the initiation and migration ofalternate bars (Colombini et al., 1987).The use of a multibeam echosounder, as well as ground-
penetrating radar (GPR), could enhance the understandingof lateral bedload sediment fluxes that are suspected tooccur during the beginning and end of a flood.The approach presented here for a single flood event has
been applied on a unique dataset obtained over multiplefloods and 13 years of surveys (Rodrigues et al., in prepara-tion). This contribution will complete studies carried out onalternate bar development by visualizing their temporal andspatial scales in relation to discharge variations in a realriver. The results will be compared to the bar theory(Struiksma et al., 1985; Crosato and Mosselman, 2009;Kleinhans and van den Berg, 2010) and interactions be-tween forced and free migrating bars will be detailed(Tubino and Seminara, 1990; Lanzoni, 2000).
Acknowledgements—F. Schuurman, an anonymous reviewer andS.N. Lane are acknowledged for their constructive reviews.Discussions with P. Belleudy, J.N. Gautier, M. De Linares and J.J.Macaire were greatly appreciated. E. Guillot and S. Aumenier arealso acknowledged.This paper is dedicated to our colleague, mentor and friend J.J.
Peters.
Copyright © 2011 John Wiley & Sons, Ltd.
ReferencesAllen J.R.L. 1984. Sedimentatry structures: their character and physicalbasis Developments in sedimentology. Elsevier, Amsterdam, 1256.
Best JL, Ashworth PJ, Bristow CS, Roden J. 2003. Three-dimensionalsedimentary architecture of a large, mid-channel sand braid bar,Jamuna River, Bangladesh. Journal of Sedimentary Research73: 516–530.
Blondeaux P, Seminara G. 1985. A unified bar-bend theory of rivermeanders. Journal of Fluid Mechanics 157: 449–470.
Bridge JS. 1977. Flow, bed topography, grain size and sedimentarystructure in open channel bends: a three dimensional model. EarthSurface Processes and Landforms 2: 401–416.
Bridge JS. 1993. Description and interpretation of fluvial deposits: acritical perspective. Sedimentology 40: 801–810.
Callander RA. 1969. Instability and river channels. Journal of FluidMechanics 36: 465–480.
Cant DJ, Walker RG. 1978. Fluvial processes and facies sequences in thesandy braided South Saskatchewan River, Canada. Sedimentology25: 625–648.
Church M, Rice SP. 2009. Form and growth of bars in a wandering gravel-bed river. Earth Surface Processes and Landforms 34: 1422–1432.
Colombini M, Seminara G, Tubino M. 1987. Finite amplitude alternatebars. Journal of Fluid Mechanics 181: 213–232.
Crosato A, Mosselman E. 2009. Simple physics-based predictor for thenumber of river bars and the transition between meandering andbraiding. Water Resource Research 45: 1–14.
Earth Surf. Process. Landforms, Vol. 37, 240–248 (2012)
248 S. RODRIGUES ET AL.
De Linares M. 2007. Modélisation numérique bidimensionnelle dutransport solide et de la dynamique fluviale: validation sur deux sitesen Loire et sur l'Arc., Joseph Fourier, Grenoble, 96 + annexes pp.
Dinehart RL. 2002. Bedform movement recorded by sequential single-beam surveys in tidal rivers. Journal of Hydrology 258: 25–39.
Fredsoe J. 1978. Meandering and braiding of rivers. Journal of FluidMechanics 84: 609–624.
HassanMA. 1990. Scour, fill, and burial depth of coarsematerial in gravelbed streams. Earth Surface Processes and Landforms 15: 341–356.
Hassan MA, Marren PM, Schwartz U. 2009. Bar structure in an aridephemeral stream. Sedimentary Geology 221: 57–70.
Hassan MA, Schick AP, Shaw PA. 1999. The transport of gravel in anephemeral sandbed river. Earth Surface Processes and Landforms24: 623–640.
Ikeda S. 1984. Prediction of alternate bar wavelength and height.Journal of Hydraulic Engineering 110: 317–386.
Jaeggi MNR. 1984. Formation and effects of alternate bars. Journal ofHydraulic Engineering 110: 142–156.
Kleinhans MG, van den Berg JH. 2010. River channel and bar patternsexplained and predicted by an empirical and a physics-basedmethod. Earth Surface Processes and Landforms 35: 1–18.
Lanzoni S. 2000. Experiments on bar formation in a straight flume: 1.Uniform sediment. 2. Graded sediment. Water Resource Research36: 3337–3349.
Laronne JB, Sholmi Y. 2007. Depositional character and preservationpotential of coarse-grained sediments deposited by flood events inhyper-arid braided channels in the Rift Valley, Arava, Israel. SedimentaryGeology 195: 21–37.
Laronne JB, Outhet DN, Carling PA, McCabe TJ. 1994. Scour chainemployment in gravel bed rivers. Catena 22: 299–306.
Lewin J. 1976. Initiation of bedforms and meanders in coarse-grainedsediment, Geological Society of America Bulletin,87: 281–285.
Lisle T, Ikeda H, Iseya F. 1991. Formation of stationary alternate bars ina steep channel with mixed size sediment: a flume experiment. EarthSurface Processes and Landforms 16: 463–469.
Lisle T, Iseya F, Ikeda H. 1993. Response of a channel with alternatebars to a decrease in sediment supply of mixed-size bed load: aflume experiment. Water Resource Research 29: 3623–3629.
Lunt IA, Bridge JS. 2004. Evolution and deposits of a gravelly braid bar,Sagavanirktok River, Alaska. Sedimentology 51: 415–432.
Lunt IA, Bridge JS, Tye RS. 2004. A quantitative, three-dimensionalmodel of gravelly braided rivers. Sedimentology 51: 377–414.
Copyright © 2011 John Wiley & Sons, Ltd.
Miall A.D. 1996. The geology of fluvial deposits: sedimentary facies,basin analysis, and petroleum geology. Springer, Berlin, 582pp.
Parker G. 1976. On the cause and characteristic scales of meanderingand braiding in rivers. Journal of Fluid Mechanics 76: 145–160.
Reesink A.J.H., Bridge J.S. 2007. Influence of superimposed bedformsand flow unsteadiness on formation of cross strata in dunes and unitbars. Sedimentary Geology. 202: 281–296.
Rice SP, Church M, Wooldridge CL, Hickin EJ. 2009. Morphology andevolution of bars in a wandering gravel-bed river; lower Fraser river,British Columbia, Canada. Sedimentology 56: 709–736.
Rodrigues S., Gautier J.N.,Peters J.J. 2006. Sediment dynamics in ana-branches of the Loire river: the study case of Ingrandes (France). InFerreira R.M.L., Alves E.C.T.L., Leal J.G.A.B., Cardoso A.H.(Eds).River Flow 2006. 2: 1293–1300pp. Taylor & Francis, Lisbon.
Sambrook Smith G.H., Best J.L., Ashworth P.J., Lane S.N., Parker N.O.,Lunt I.A., Thomas R.E., Simpson C.J. 2010. Can we distinguish floodfrequency and magnitude in the sedimentological record of rivers?Geology. 38: 579–582.
Schielen RMJ, Doelman A, Swart HE. 1993.On the non-linear dynamics offree bars in straight channel. Journal of Fluid Mechanics 252: 325–356.
Seminara G, Tubino M. 1989. Alternate bar and meandering: free,forced and mixed interactions. In River Meandering, Ikeda S, ParkerG (eds). AGU: Washington, DC.
Sime LC, Ferguson RI, Church M. 2007. Estimating shear stress frommoving boat acoustic doppler velocity measurements in a largegravel bed river. Water Resource Research 43: 12.
Simons DB, Richardson EV, Nordin CF. 1965. Bedload Equation forRipples and Dunes, USGS Professional Paper 462H. US GeologicalSurvey: Reston, VA.
Smith N.D. 1974. Sedimentology and bar formation in the upper KickingHorse River, a braided outwash stream. J. Geol., 82: 205–223.
Struiksma N, Olsesen K, Flokstra C, De Vriend H. 1985. Bed deformationin curved alluvial channels. Journal of Hydraulic Research 23: 57–79.
Tubino M. 1991. Growth of alternate bars in unsteady flows. WaterResource Research 27: 37–52.
Tubino M, Seminara G. 1990. Free-forced interactions in developingmeanders and suppression of free bars. Journal of Fluid Mechanics214: 131–159.
Tubino M, Repetto R, Zolezzi G. 1999. Free bars in rivers. Journal ofHydraulic Research 37: 759–775.
Welford MR. 1994. A field test of Tubino’s (1991) model of alternate barformation. Earth Surface Processes and Landforms 19: 287–297.
Earth Surf. Process. Landforms, Vol. 37, 240–248 (2012)