Embed Size (px)
Citation preview

Knowledge… Commitment... Integrity… at Your Service
An Overview of
Ammonia and Nitrogen Removal
in Wastewater Treatment
Tim Constantine, CH2M HILL Canada
February 19th, 2008
2
Presentation Overview
• Ammonia Removal
– Why remove it?
– Regulations
– Nitrification biochemistry and factors
– Design considerations and example
• N-Removal
– Why remove it?
– Regulations
– Denitrification biochemistry and factors
– Design considerations and example
• Return liquors from dewatering

3
Ammonia Removal
4
Introduction
• Why removal ammonia?
– A nutrient, so can promote algae growth
– Can exert oxygen demand in receiver
– Free or un-ionized fraction is toxic to aquatic life
• What technologies remove ammonia?
– Breakpoint Chlorination
– Air stripping
– Ion exchange
– Biological methods
• Focus of this presentation will be biological methods
– Uptake of ammonia during biological growth (heterotrophs)
– Biological nitrification

5
Regulations and Basis for Limits
• In certain cases, effluent ammonia limits based on
limiting oxygen demand in receiver
• More often, limits set based on toxicity to aquatic life
• “Free” ammonia fraction is toxic:
– Chronic toxicity limit ~ 0.02 mg/L (after mixing in receiver)
– Acute toxicity limit ~ 0.1 mg/L (at end of pipe)
• Dissociation constant – pKa = 9.24
• Impacted by pH and temperature
• At pH 7.5, 15oC, about 1% of TAN is NH3-N– So to achieve 0.1 NH3, need to be below 10 mgN/L
NH4+ → NH3 + H+←

6
Nitrification Biochemistry
• Nitrification is a two-step reaction:
• More about the “nitrification reaction”:– Nitrifiers do not use organic carbon as basis for growth
– Building blocks for growth from alkalinity
– 4.57 g O2 consumed per g ammonia oxidized to nitrate
– Acid formed, consumes alkalinity, 7.14 g alkalinity per g NO3
– Nitrite intermediate almost never “stable”, nitrite oxidizers grow faster than ammonia oxidizers at typical WW temperatures
NH4+ + 1.5O2 → NO2
- + 2H+ + H2O AOB
NO2- + 0.5O2 → NO3
-NOB
7
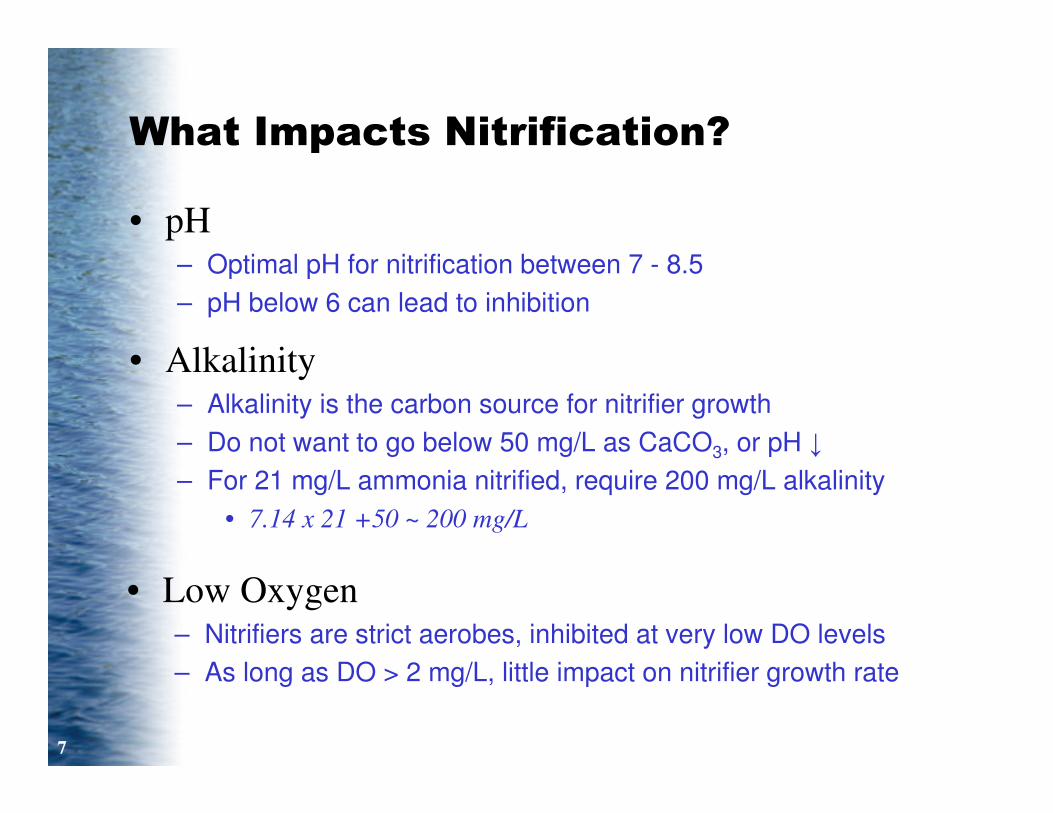
What Impacts Nitrification?
• Alkalinity– Alkalinity is the carbon source for nitrifier growth
– Do not want to go below 50 mg/L as CaCO3, or pH ↓
– For 21 mg/L ammonia nitrified, require 200 mg/L alkalinity
• 7.14 x 21 +50 ~ 200 mg/L
• pH– Optimal pH for nitrification between 7 - 8.5
– pH below 6 can lead to inhibition
• Low Oxygen– Nitrifiers are strict aerobes, inhibited at very low DO levels
– As long as DO > 2 mg/L, little impact on nitrifier growth rate

8
What Impacts Nitrification?
• Inhibitory substances– Nitrifiers can be sensitive to a number of compounds
– Can impact growth rate
– Higher concentration = Lower growth rate or complete loss
– Classic example is free ammonia and nitrous acid inhibition
• Solids Retention Time (SRT) and nitrifier growth
– Concept of minimum SRT is really important!
Min. SRT = 1
µmax,N - bN
• If operating SRT > min. SRT, nitrification takes place
• If operating SRT< min. SRT, no nitrification

9
The Washout Phenomenon of Nitrification
5
10
15
20
25
30
Eff
lue
nt
Am
mo
nia
[m
gN
/L]
0 1 2 3 4 5 6 7 8
Solids Retention Time [days]
MinimumSRT
T = 12oC
DesignSRT

10
What Impacts Nitrification?
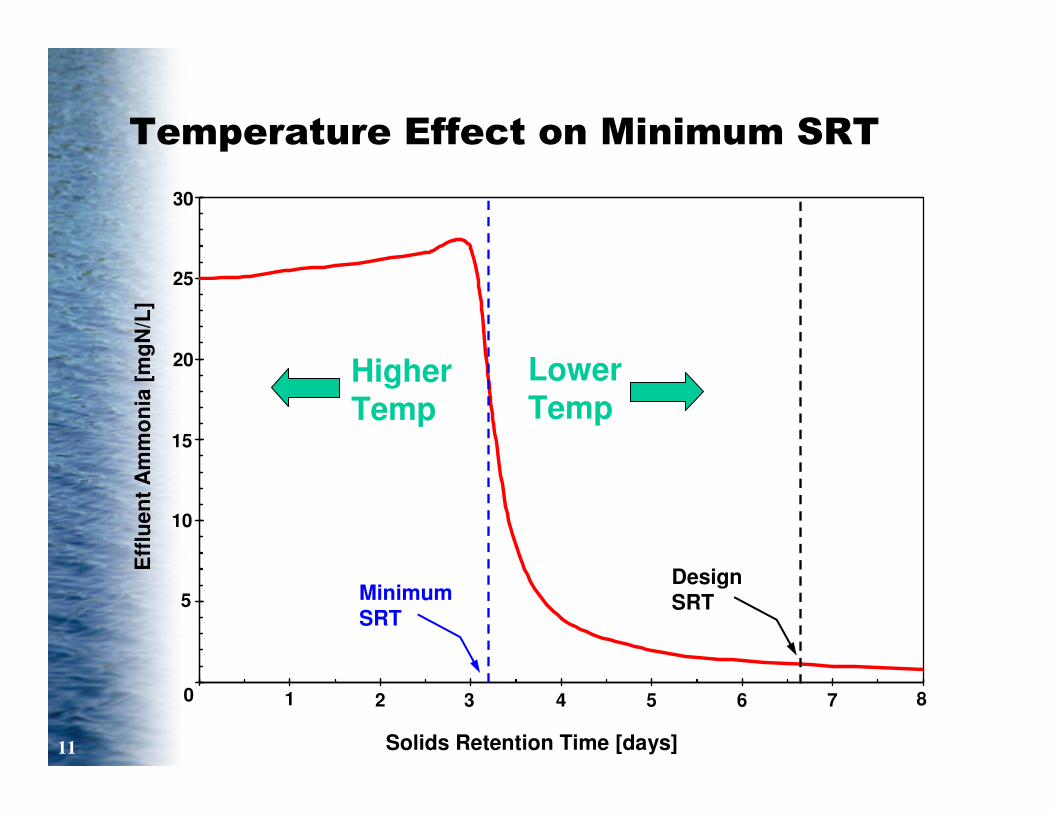
• Wastewater Temperature– Single greatest impact on nitrification
– Nitrifiers are much more sensitive to temperature than heterotrophic bacteria
– Drives the design sizing of aeration tanks in colder climates
11
Temperature Effect on Minimum SRT
5
10
15
20
25
30
Eff
lue
nt
Am
mo
nia
[m
gN
/L]
0 1 2 3 4 5 6 7 8
Solids Retention Time [days]
MinimumSRT
LowerTemp
HigherTemp
DesignSRT

12
Temperature Effect on Nitrification
10
Wastewater Temperature [oC]
12 14 16 18 20
2
4
6
8
10
12
So
lid
s R
ete
nti
on
Tim
e [
da
ys
]
Minimum SRT
Design SRT
13
Design Considerations for
Nitrification
• What do we need to select/determine?
– Bioreactor volume requirements
– Tank configuration
– Oxygen requirements

14
Bioreactor Volume for Nitrification
• Critical parameters for bioreactor volume sizing:
– Design aerobic SRT
– Raw wastewater characteristics
– Selected operating MLSS
• Selection of Design Aerobic SRT
– Almost always based on coldest wastewater temperature
– If good historical data available, use minimum week effluent
temperature
– Aerobic SRT selection might be impacted by effluent limits, but
not normally
– Typical coldest temperature in Ontario is 10oC
– In this case, design aerobic SRT of 8-10 days is typical

15
Bioreactor Volume for Nitrification
• Raw wastewater (or primary effluent) characteristics:
– Can have major impact on sizing of tankage
– Nitrifiers only make up ~1-2% of MLSS
– TSS/BOD feed to bioreactor is most important
– Should do rigorous review of historical data to determine design
characteristics
– For bioreactor sizing, look at peak month characteristics
– At times, peak month loading can coincide with minimum
wastewater temperature
• Good example is a university town, where population is higher in
winter/spring
– Peak month loading of 1.2x average annual is typical

16
Bioreactor Volume for Nitrification
• Design MLSS concentration:
– Optimal in terms of aeration tankage and secondary clarifier
sizing is 2,500 – 3,000 mg/L
– Higher MLSS values can be used, but usually means very large
secondary clarifier to account for higher solids loading
17
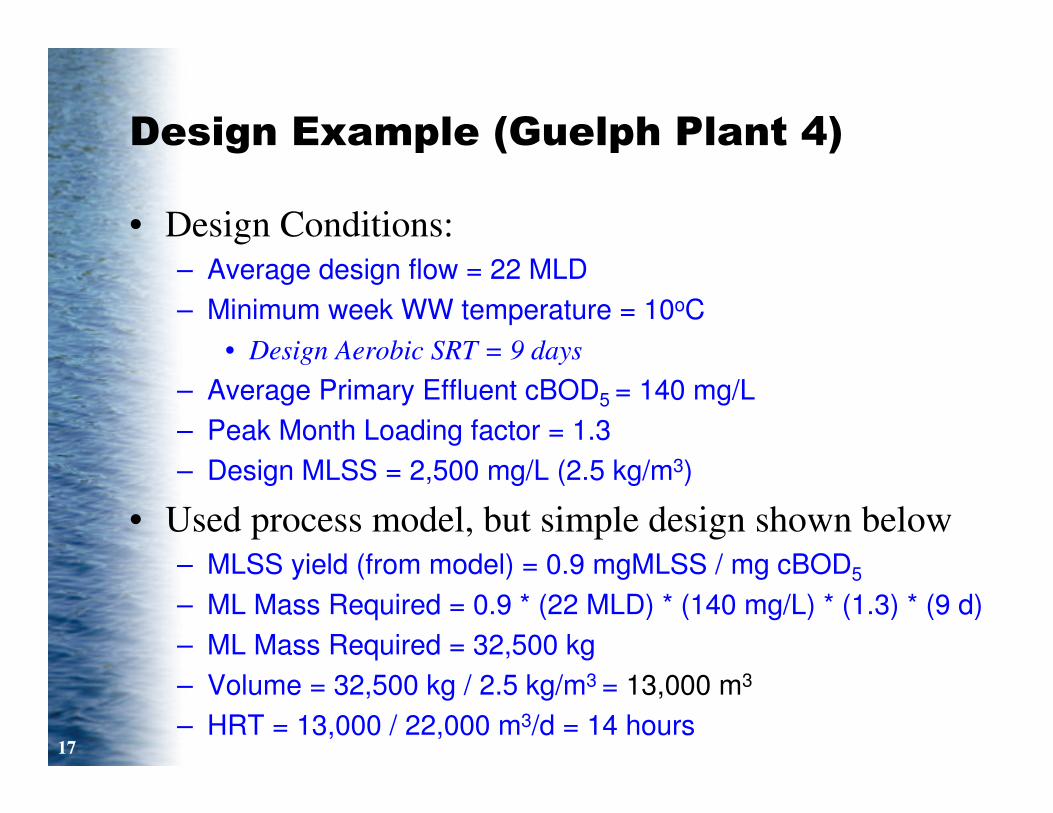
Design Example (Guelph Plant 4)
• Design Conditions:
– Average design flow = 22 MLD
– Minimum week WW temperature = 10oC
• Design Aerobic SRT = 9 days
– Average Primary Effluent cBOD5 = 140 mg/L
– Peak Month Loading factor = 1.3
– Design MLSS = 2,500 mg/L (2.5 kg/m3)
• Used process model, but simple design shown below
– MLSS yield (from model) = 0.9 mgMLSS / mg cBOD5
– ML Mass Required = 0.9 * (22 MLD) * (140 mg/L) * (1.3) * (9 d)
– ML Mass Required = 32,500 kg
– Volume = 32,500 kg / 2.5 kg/m3 = 13,000 m3
– HRT = 13,000 / 22,000 m3/d = 14 hours

18
Same Secondary Clarifier Size
Plant 1
Plant 2
Plant 3
Plant 4
Bioreactor VolumePlant 1 = 4,350 m3
Plant 4 = 13,000 m3

19
Bioreactor Oxygen Requirements
• Aeration is required for:
– Supply oxygen for biological processes
– Mixing
• For mixing, minimum requirements:
– Mechanical aeration = 5 W / m3 of tankage
– Diffused air = 0.3 L/s per m3 of tankage
• Oxygen specifically used for:
– Oxidation of organic matter (BOD)
– Nitrification
– Endogenous decay

20
SRT/nitrification Impact on O2 Demand
Ac
tua
l O
xyg
en
Re
qu
ire
me
nts
[k
gO
2/d
ay]
Solids Retention Time [days]
T = 20oC
2 3 4 5 6 7 8 9 101
WithoutNitrification
IncludingNitrification

21
Bioreactor Oxygen Requirements
• Other design considerations:
– Don’t forget about recycle streams
– Need sufficient oxygen transfer for to meet peak diurnal oxygen
demand during peak day loading
– Don’t forget about minimum mixing criteria, especially in last
pass of an aeration tank
– Consider using fine bubble aeration
22
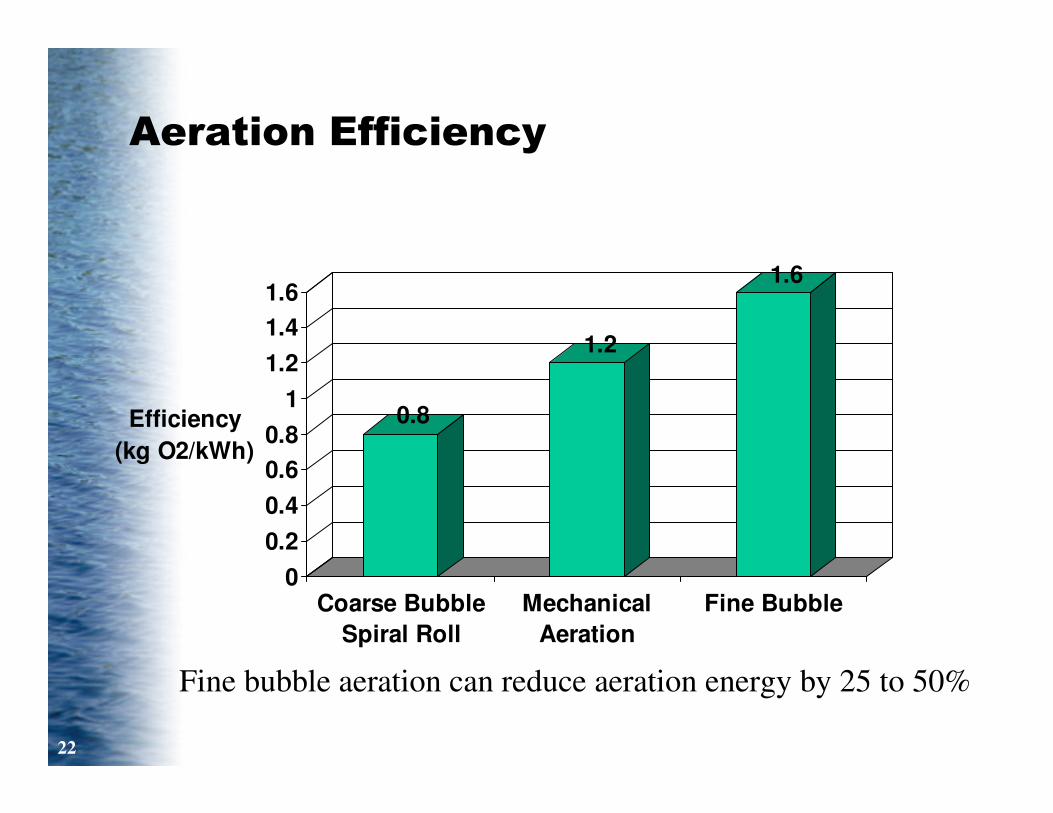
Aeration Efficiency
0.8
1.2
1.6
0
0.2
0.4
0.6
0.8
1
1.2
1.4
1.6
Efficiency
(kg O2/kWh)
Coarse Bubble
Spiral Roll
Mechanical
Aeration
Fine Bubble
Fine bubble aeration can reduce aeration energy by 25 to 50%

23
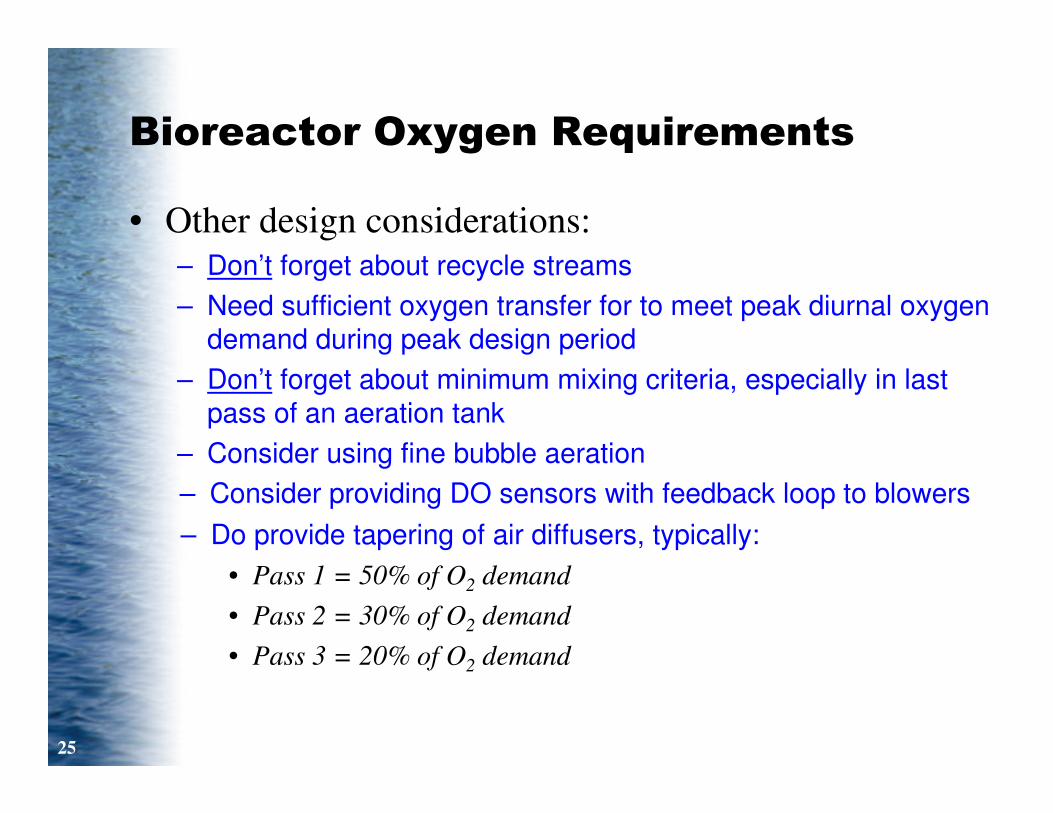
Bioreactor Oxygen Requirements
• Other design considerations:
– Don’t forget about recycle streams
– Need sufficient oxygen transfer for to meet peak diurnal oxygen
demand during peak design period
– Don’t forget about minimum mixing criteria, especially in last
pass of an aeration tank
– Consider using fine bubble aeration
– Consider providing DO sensors with feedback loop to blowers

24
DO Control can Provide Savings
5 10 15 20
Time (hours)
0
5
10
15
20
25
30
35
40
45
50
0
Ae
rati
on
En
erg
y R
eq
uir
ed
(kW
)
No DO Control (47 kW)
With DO Control (35 kW)
25
Bioreactor Oxygen Requirements
• Other design considerations:
– Don’t forget about recycle streams
– Need sufficient oxygen transfer for to meet peak diurnal oxygen
demand during peak design period
– Don’t forget about minimum mixing criteria, especially in last
pass of an aeration tank
– Consider using fine bubble aeration
– Consider providing DO sensors with feedback loop to blowers
– Do provide tapering of air diffusers, typically:
• Pass 1 = 50% of O2 demand
• Pass 2 = 30% of O2 demand
• Pass 3 = 20% of O2 demand

26
Nitrogen Removal

27
Introduction
• Why remove nitrogen?
– A requirement for biological phosphorus removal
– High nitrate levels associated with methemoglobinemia (blue baby syndrome)
– A nutrient, can lead to growth “harmful algal blooms” and hypoxic conditions
• Many jurisdictions now have effluent TN limits:
– EU countries – 70-80% N removal but varies
– “Bubble Limits” in sensitive watersheds (e.g. Chesapeake Bay)
• Canada now has effluent nitrate limits
– 13 mg/L as nitrate ion after mixing
– Equivalent to 2.9 mgN/L nitrate

28
Nitrogen Removal Intro
• There are a number of technologies capable of removing
nitrogen:
– Breakpoint chlorination of ammonia
– Ion exchange (ammonia or nitrate)
– Air stripping of ammonia
– Biological removal
• How is nitrogen removed in biological systems?
– A certain amount of nitrogen is required for biomass growth
– By nitrification / denitrification
– By deammonification (Anammox)

29
Nitrogen Removal - Denitrification
• Denitrification is defined as growth of bacteria when nitrate is
used as the terminal electron acceptor:
• Different from aerobic growth in that nitrate is used instead of
oxygen
• Majority of heterotrophic bacteria in WW treatment can use
both oxygen and nitrate
• If oxygen is present, it will be used before nitrate
• Oxygen inhibits denitrification
Organic
Compound+ NO3 → Biomass + CO2 + N2

30
Consequences of Denitrification
• Reduction in total oxygen required, as part of organic
material is oxidized using nitrate
– Nitrification: 4.57 mgO2/mgN
– Denitrification: 2.86 mgO2/mgN } 63% savings
• Actual O2 savings depends on:
– Raw WW characteristics
– Process configuration and process design
• Alkalinity is formed during denitrification!
– Recover 50% of alkalinity lost through nitrification
– More stable pH, since alkalinity serves as pH buffer

31
Requirements for Denitrification
• Need nitrate to be formed
– Nitrate is formed during nitrification
– As long as system is nitrifying, this criterion is met
• Need “denit” or anoxic zone in system:
– Nitrate
– Bacteria
– Substrate
– No oxygen, but mixing to retain biomass in suspension
32
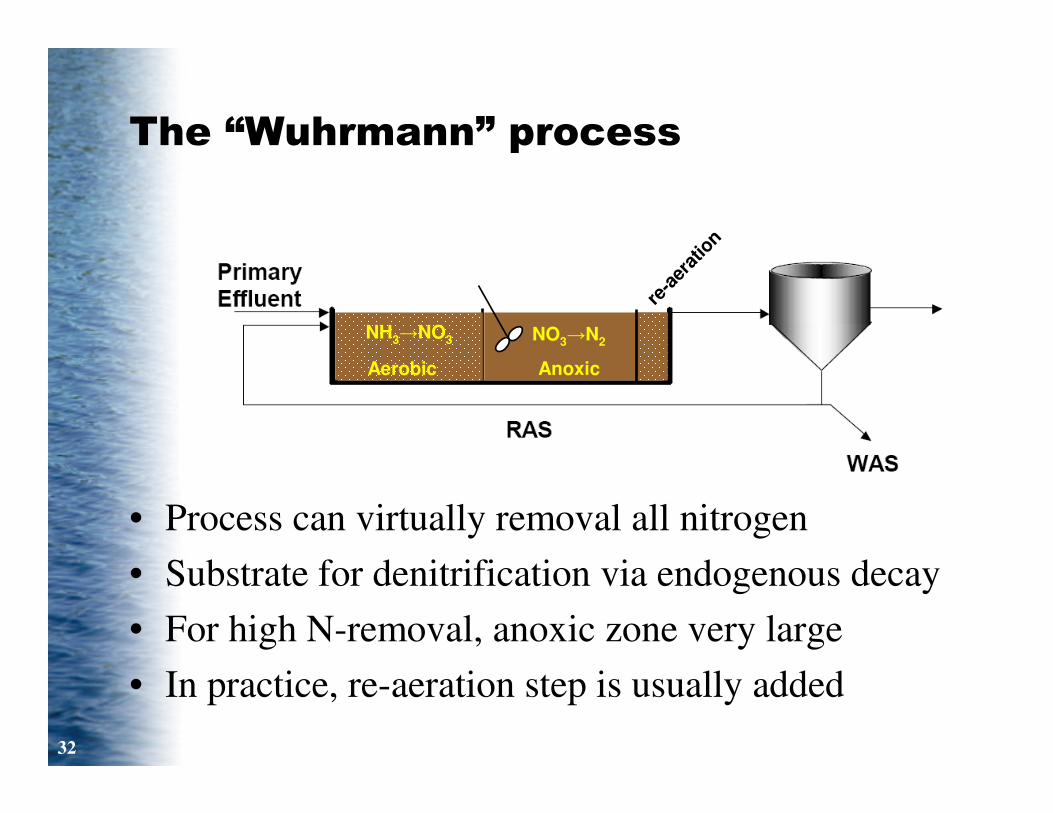
Anoxic
NO3→N2
The “Wuhrmann” process
Aerobic
NH3→NO3
• Process can virtually removal all nitrogen
• Substrate for denitrification via endogenous decay
• For high N-removal, anoxic zone very large
• In practice, re-aeration step is usually added
re-a
erat
ion

33
The “Ludzack-Ettinger” process
Aerobic
NH3→NO3
Anoxic
NO3→N2
• Readily biodegradable substrate used for denitrification
• Significantly higher denitrification rate compared to
Wurhmann
• Only removes nitrate associated with the RAS
• If RAS = Qave, 50% nitrate removal if carbon not limiting

34
“Modified Ludzack-Ettinger” process
Anoxic Aerobic
NH3→NO3NO3→N2
• MLE process includes recirculation to bring greater
quantities of nitrate back for denitrification
• Much higher levels of nitrate removal possible
• Very popular process alternative today

35
Impact of Recycle Rate on MLEN
itra
te R
em
ova
l [%
]
Recirculation Rate [% of influent flow]
100% 200% 300% 400% 500%
10%
20%
30%
40%
50%
60%
70%
80%
90%

36
4-Stage Bardenpho process
Anoxic Aerobic
• Combination of MLE and Wuhrmann process
• Very high levels of nitrate reduction possible
• External carbon source (methanol) often added to
increase second stage denitrification rate
Anoxic
re-a
erat
ion
MeOH

37
Design Considerations for
Denitrification
• Do not take away “required” aerobic SRT to provide
anoxic zones
– Unless providing only seasonal denitrification via “swing”zones
• Size anoxic zones appropriately and provide mixing
– Minimum SRT for MLE anoxic zone ~ 1.5 days
• Kinetics of denitrification are fairly complex, and very
dependent on nature of COD (readily biodegradable,
slowly biodegradable)
– Carry out raw wastewater characterization
– Use a process model to assist in design sizing
• Design “zones” to allow free flowing surface
• Minimize O2 return in recycle streams

38
Sidestream Treatment

39
Centrate Characteristics / Impacts
Parameter Centrate % of Influent
Flow: - 0.5%
TSS: 1,750 mg/L 4.0%
BOD5: 200 mg/L 0.5%
Phosphorus: 200 mg/L 19.0%
Ammonia: 1,000 mg/L 20.0%
Temperature: ~35ºC -
• Major impacts:
– Increased oxygen demand
– Increased carbon requirements for denitrification
– Can lead to bleed through of NH3 / NO3 if not equalized

40
Impact of Centrate on Performance
Se
co
nd
ary
Eff
lue
nt
Am
mo
nia
[m
gN
/L]
12:00 12:000:000:00
2
4
6
8
10
Time of Day
With Centrate addedover 8 hours
No Centrate

41
Centrate Management Alternatives
Centrate Management
Alternatives
Separate
Treatment
No Separate
Treatment
- Do Nothing
- Centrate Equalization
Biological
Treatment
Phys-Chem
Treatment
- Hot Air/Steam Stripping
- Ion Exchange
- Breakpoint Chlorination
- Struvite Precipitation
- Suspended Growth Activated Sludge
- Fixed Film
- Bioaugmentation (e.g. BABE®, InNitri®)
- Nitritation (e.g. SHARON®, AT-3, others)
- Anammox (deammonification)

42
Process Overview - Bioaugmentation
• What is it?
– Side-stream treatment process to treat centrate
– Produces enriched population of nitrifiers
– Nitrifiers seeded to mainstream plant
• Benefit:
– Reduce ammonia (nitrogen) load on mainstream plant
– Allows improved nitrification in mainstream plant
• A number of treatment processes:
– InNitri (Inexpensive Nitrification)
– BABE (Bio-Augmentation Batch Enhanced)
– Nitrification in RAS reaeration (ScanDeNi, Prague)

43
SidestreamSystem
DewateringCentrate
25oC30oC
Process Overview - Bioaugmentation
• Improved mainstream nitrification efficiency
• Typically allows 30% less bioreactor volume
• Requires supplemental chemicals
• Process still emerging – some full scale
installations
Influent
RAS
Effluent
Nitrifiers
Alkalinity/Methanol
PC Bioreactor SC
InNitri ProcessBABE Process
RAS
RAS reaeration

44
Bioaugmentation Benefits MainstreamE
fflu
en
t A
mm
on
ia [
mg
N/L
]
2
4
6
8
10
12
Mainstream Aerobic SRT [days]
1 2 3 4 5 6 7 8 9 10
Design basis: 10oC
WithoutBioaugmentation
Effluent with
Bioaugmentation

45
Process Overview - Nitritation
• What is it?
– Process that converts ammonia to nitrite (NH3 → NO2)
– “Partial nitrification” in side-stream system
• Benefits:
– Reduced O2 (25% less than full nitrification)
– Reduced chemicals (e.g. 40% less MeOH for denitrification)
– Less tankage than bioaugmentation
• A number of treatment processes:
– Solids retention time control (SHARON Process)
– Toxicity control (e.g. AT-3 process)
– Dissolved oxygen control

46
Process Overview - SHARON®
So
lid
s R
ete
nti
on
Tim
e [
da
ys
]
Temperature [oC]
10 15 20 25 30 35 40
1
2
3
4
5
AmmoniaOxidizers
NitriteOxidizers
NH3
NO3
NO2

47
Process Overview - Anammox
• Anammox:
Anaerobic Ammonium Oxidation
• New organisms discovered - Anammox bacteria
NH4-N + NO2-N N2 + 2H2O
• Notable properties of anammox bacteria:
– Very low growth rate (1/10th that of nitrifiers!)
– Inhibited by oxygen even at very low levels
• Key: Generate both NH3 and NO2

48
Process Overview - Anammox
• Efficient N-removal:
– 60% savings in oxygen, 100% savings in carbon
• Long start-up, requires good solids retention
• Full-scale: Rotterdam, Strass
Influent
RASWAS
Effluent
Alkalinity?Methanol ?
DewateringCentrate
SHARONReactor
30oCNONO22
NHNH3330oC
N2
AnammoxReactor

49
Centrate Processes - Which is best?
• Example 1:
– Limitations in nitrification or denitrification capacity
– Low cost secondary treatment expansion
– Bioaugmentation may be best
• Example 2:
– No Limitation on nitrification or denitrification capacity
– Limitation in influent carbon or want to limit operating costs
– Nitritation or Anammox may be best
• Example 3:
– No major limitations in nit/denit capacity
– Equalization

50
Summary
• There will continue to be increased needs in
providing nitrification and N-removal
• Many options available for both systems
• Good process design practice should include:
– Raw WW characterization
– Process simulation
• Centrate treatment alternatives emerging, may solve
upgrade challenges for nitrification or N-removal

Knowledge… Commitment... Integrity… at Your Service
An Overview of
Ammonia and Nitrogen Removal
in Wastewater Treatment
Tim Constantine, CH2M HILL Canada
February 19th, 2008
Thank you for your attention!