Embed Size (px)
Citation preview

An overview of bench design for cut slopes with an example
of an advanced dataset assessment technique
S Coetsee Reutech Mining, South Africa
Abstract
The empirical derivation of the minimum berm width and the formulae presented by the various design
criteria are different due to the input parameters selected, thus resulting in a range of minimum berm widths
that can be calculated for the same set of rock mass and geometric conditions.
When compiling a berm design model, in assigning a derived (calculated) friction angle and cohesion value,
the Factor of Safety (FoS) and Probability of Failure (PoF) for a suite of kinematically identified plane or wedge
sliding instabilities may be overestimated and may not representative of true mining conditions.
Rather than applying dataset cutoff criteria to the FoS or PoF for plane or wedge instability spill volume, the
use of all data regardless of the FoS or spill volume is required in order to accurately assess the minimum
berm width that can be calculated and then recommended for the design. This is based on the assessment of
all spill volumes, spill radii and the criteria accepted and applied.
As shear strength properties changeover the life-of-mine, so does the FoS. Assuming that the FoS is static and
the derived PoF is indefinitely valid will result in a design that may be insufficient in maintaining the berm
retention factor assigned.
Therefore, attaining and utilising derived FoS and PoF allows for all plane and wedge shape iterations
compiled during the modelling process to be utilised. This methodology allows for the assessment of the
minimum berm widths calculated using the published criteria and advanced dataset assessment techniques.
Keywords: bench design, shear strength parameters, berm retention factor
1 Introduction
Bench height and berm width contribute to the inter-ramp geometry on which an overall slope design is based.
It is imperative to ensure that the inter-ramp geometry is empirically sound and that the design berm width is
sufficient to maintain the berm retention factor required and therefore, the anticipated volume of failed
material, should an instability occur. The berm retention factor, rock mass and geometric conditions of the
discontinuities for the selected design sector inevitably define the berm width during the design process.
This berm retention factor is of paramount importance for the mitigation of rockfall, dependent on the
percentage of the volume of material that exceeds the berm width.
Bench design analysis is usually conducted using published criteria such as the Ritchie Criterion (Ritchie 1963),
the minimum berm width (Piteau & Martin 1977), the Modified Ritchie Criterion (Hustrulid et al. 2001), the
minimum berm width using either conical or pyramidal spill radius (Gibson et al. 2006, adapted and applied
by Rocscience) and the minimum berm width presented by Haines et al. (2006).
These criteria are either empirical or formula-based, and typically encompass varietals of input parameters
such as the bench height, bench face angle, plunge of the intersection of the joints, the angle of repose, the
volume of spill material and the bulk or swelling factor.
The likelihood of achieving a design is highly reliant on attaining the bench face angle with specific reference
to the bench crest due to break back as well as frozen toes. Break back is controlled by the local geology and
Slope Stability 2020 - PM Dight (ed.)© Australian Centre for Geomechanics, Perth, ISBN 978-0-9876389-7-7
Slope Stability 2020 731
doi:10.36487/ACG_repo/2025_47

the reduction in shear strength of the structures due to the blast and excavation cycle, and weathering over
the life-of-mine. Frozen toes occur due to errors in pre-split application.
When compiling a berm design model, in assigning a derived (calculated) friction angle and cohesion value,
the Factor of Safety (FoS) and Probability of Failure (PoF) for a suite of kinematically identified plane or wedge
sliding instabilities may be overestimated and may not be representative of true mining conditions.
The friction angle may be assigned based on values that are residual, weakened or averaged, or a sensitivity
analysis as described by Piteau & Martin (1977), Whyatt et al. (2004), Gibson et al. (2006) and Jermy
et al. (2011), respectively.
The cohesion value may be assigned based on 0 MPa, a weakened state or a sensitivity analysis as described
by Piteau & Martin (1977), Gibson et al. (2006), Whyatt et al. (2004) and Jermy et al. (2011), respectively.
The friction angle and cohesion value should be assigned based on nominal and static values or by applying a
sensitivity analysis approach. The cohesion value especially should be reduced to account for field conditions
as slope displacements could have degraded the natural cohesion within the discontinuities. These reduced
values take into consideration the reduction in shear strength of the structures over the life of a mine.
Rather than applying dataset cutoff criteria to the FoS or PoF for plane or wedge instability spill volume, the
use of all data regardless of the FoS or spill volume is required in order to accurately assess the minimum
berm width that can be calculated and then recommended for the design. This is based on the assessment
of all spill volumes, spill radii and the criteria accepted and applied.
As shear strength properties changeover the life-of-mine, so does the FoS. Assuming that the FoS is static
and the derived PoF is indefinitely valid will result in a design that may be insufficient in maintaining the berm
retention factor assigned.
Therefore, attaining and utilising derived FoS and PoF allows for all plane and wedge shape iterations
compiled during the modelling process to be utilised. This methodology allows for the assessment of the
minimum berm widths calculated using the published criteria and detailed dataset analyses techniques.
It is suggested that two plots illustrating the percentage of instabilities per spill radius bin (metre increments)
and the break back distance range per spill radius (same metre increments) be compiled using the datasets
from each planar and wedge combination model per selected section line without any design criteria being
applied to first assess the worst-case scenarios.
This analysis provides a realistic assessment of the minimum berm width required per section line, per failure
mode. This is especially pertinent as the conditions of the joints in the bench face cannot be accurately
allocated. Practical considerations such as ravelling, blast spill from higher cuts, the time period of exposure,
climate and weathering such as freeze and thaw cycles and blasting practices have an effect on the shear
strength of the joints over the life-of-mine.
By comparing the minimum berm width and the anticipated break back associated per geometric iteration
for planar or wedge sliding, the effective berm width can be evaluated and compared to the berm width for
design, validation or optimisation.
This allows for a robust design approach that encompasses all eventualities and will ensure that the berm
retention factor is valid for the life-of-mine.
The test of the design is to determine how well it measures up to and incorporates design rules that can be
deemed standard or best industry practice at the time of this work.
An overview of bench design for cut slopes with an example of an advanceddataset assessment technique
S Coetsee
732 Slope Stability 2020
2 Bench design: an overview of current best practice principals
Hoek & Bray (1981) discussed the importance of understanding bench scale instability. Whilst rock slope
engineering has developed significantly over the last few decades, the fundamental principles of bench
design remain the same, as outlined:
“While overall slopes are important in terms of the economics of the mining operation, of
more immediate concern is the stability of individual benches on a day-to-day basis.
Failures on a bench scale may cause severe disruptions to the mining programme, should
the infrastructure such as haul roads, property boundaries etc. be affected. Similarly, the
safety of the working area in the vicinity of the bench face especially during excavation,
scaling and cleaning and the preparation of subsequent drill and blast blocks is of utmost
importance. It is these relatively small failures which occur with very little warning, that
lives can be lost and equipment damaged”.
It is these daily safety concerns that make bench design, and the understanding of bench scale failure is
paramount from a production and monitoring perspective.
The stability of the individual bench is controlled by the local geological conditions, the geometry (orientation
and angle) of the overall slope in the area, the groundwater conditions and the excavation technique.
If the listed factors, as well as the blast damage and long-term weathering effects can be quantified, the
conditions which result in slope instabilities can be recognised and mitigated accordingly during the design
process. Controlled blasting techniques, support and dewatering strategies can be considered and employed.
2.1 The bench analysis programme
It is important at the onset of a bench analysis programme to define the outcomes in completing the study.
For example, these may include the validation and generation of new slope design, validation of an existing
slope design, validation of the actual, opposed to designed slopes excavated, optimisation of a design that
may include the whole pit slope, or designated zones within the pit for a future cut or the identification of
bench scale instabilities that require control, and the design of the control system. In conducting a bench
analysis for slope design purposes, the methodology described by Hoek & Bray (1981) may be applied.
2.2 Bench and berm functionality in slope design and bench design aspects
The principal functions of a berm, in terms of an inter-ramp or slope design, is to provide a safe environment
near the slope face for personnel and equipment to operate. Bench and berm design must therefore satisfy
these standards (Read & Stacey 2009):
• Reliability, which requires stable bench faces and bench crests. Joint geometry and the related
shear strength properties define this.
• Safety, which requires that berm widths are sufficient to arrest and mitigate the danger of instability
and related rockfall and to contain any spillage from the benches above.
• Long-term access to the berms for monitoring and the clean-up of spillage and rockfall.
In designing the bench face height and angle, and the berm width, consideration of the following bench
design aspects are required (Read & Stacey 2009):
• In many cases, it is not economically feasible to design an inter-ramp slope that allows the berms
to catch each and every potential instability. As such, a limit is applied to the volume of material
that a berm should accommodate. This is typically between 70 and 85%. The berm capacity factor
is defined by the mine owners as an accepted level of risk.
• A swell factor, dependent on the type of material, should be applied in order to estimate accurate
volumes of spilled material.
Assessment and implications for uncertainty in design
Slope Stability 2020 733

• The angle of repose, also defined by the type of material should be applied to accurately reproduce
the spill dimensions, which further define the applicable berm width.
Based on these input parameters, the radius of the spilled material may be derived, which allows for the
calculation of the minimum berm width required to arrest and hold failed bench scale instabilities and rockfall.
2.3 Likelihood of achieving the design
The likelihood of achieving a bench design is principally based on achieving the designed toe position of the
bench face (known as frozen toe when the toe is not established) and minimising the back-break distance
behind the crest.
Both of these factors are controlled by the local geology and the reduction in shear strength of the structures
due to the blast and excavation cycle, or due to weathering over a long period of time. Excessive or poorly
designed blasts cause significant damage to the rock mass volume in the vicinity of the slope. The usable
width of the berm may be defined as the designed berm, minus the frozen toe or back-break of the crest due
to blasting or structural crest failure.
Blast and excavation effects extend behind the slope face and can influence the stability of the geologic
structures in that volume of rock mass. Blast-related damage includes extension of existing fractures,
creation of additional fractures (by opening closed geological features or the creation of new blast or
mechanical fractures) and displacement of structural surfaces resulting in a loss of cohesion and friction and
creation of instantaneous excess porewater pressure.
3 Bench design analysis considerations
The principal design analysis considerations are discussed in the proceeding sections.
3.1 Failure geometry
With planar failure, Gibson et al. (2006) discuss the significant consideration of the fact that essentially one
major plane for sliding to take place and a release plane on one or both ends is required. Planar failure can
therefore be said to mimic highly asymmetric wedge shapes, whereby one joint surface is oblique to the
bench face and sliding occurs mainly on this surface.
Based on this reasoning, planar and wedge shape failures may be assessed by the same method in order to
ascertain minimum berm width requirements.
In order to correctly calculate the volume of failed material, the true geometric shape should be included as
part of the input parameters for the analysis. The volume of material is directly proportional to the plunge of
the line of intersection between the two joints as this dictates the size of the wedge.
3.2 Friction angle
The allocation of the friction angle for a bench design analysis may be based on the following rationale:
• Piteau & Martin (1977) assume a residual friction angle in order to portray field opposed to
laboratory conditions.
• Whyatt et al. (2004) weaken the discontinuity strength with the friction angle being reduced from
saw cut to in situ values.
• Gibson et al. (2006) assume an average friction angle as it is deemed to be more realistic.
• Jermy et al. (2011) conduct a sensitivity analysis of the friction angles for wedge geometries with
an FoS < 1.2 in their study.
These methods are all based on the reduction of the friction angle to replicate true field conditions, as
production activities have a profound effect on the shear strength of the discontinuities.
An overview of bench design for cut slopes with an example of an advanceddataset assessment technique
S Coetsee
734 Slope Stability 2020

3.3 Cohesion
The allocation of the cohesion value for a bench design analysis may be based on the following rationale:
• Piteau & Martin (1977) assume a cohesion value of 0 MPa to account for field conditions.
• Gibson et al. (2006) assume a cohesion value of 0 MPa, as they reason slope displacements have
occurred and destroyed the natural cohesion within the discontinuities.
• Whyatt et al. (2004) weaken the discontinuity strength but do not specify how this is applied to the
cohesion value.
• Jermy et al. (2011) conduct a sensitivity analysis of the cohesion value for wedge geometries with
an FoS < 1.2 in their study.
Displacement on discontinuities caused by the drill and blast cycle will result in the loss of both friction and
cohesion. Whilst these publications have reduced the cohesion value to 0 MPa, it is pertinent to assess if the
structures do indeed have no cohesion as this would result in higher rates of failure and may affect the results
of a bench design assessment.
3.4 Defect waviness
Whyatt et al. (2004) is the only publication that discusses defect waviness for bench design. In their study,
the discontinuity waviness was removed. However, they do note that removal of the macro condition of the
discontinuity must be tested independently of the friction and cohesion angle in order to correctly calibrate
the models, or else there is the risk of overcompensating for blasting effects and therefore designing a more
conservative slope.
3.5 Hydrogeology
The incorporation of the hydrogeological conditions for a bench analysis is discussed by Piteau &
Martin (1977) whereby they assume for the case study that the conditions were dry based on field
observations. However, no other publication addresses how to incorporate water conditions accurately as
an input parameter. Roscience RocPlane and SWedge software allow for a water-filled tension crack to be
applied. Based on the methodology proposed in this paper, all valid geometric iterations are assessed,
therefore, regardless of the groundwater conditions, each and every instability has been mitigated for. From
an operational and monitoring perspective, instability during the wet season or due to higher than normal
porewater pressures are likely to induce failure and should be addressed as a trigger mechanism for failure
as part of the trigger action response plan (TARP).
3.6 Angle of repose
The angle of repose is defined as the maximum angle at which material remains stable when not found in its
in situ state. The angle of repose is dependent on the material itself and the size of the contributing particles
which form the slope of the material.
The angle of repose is an important parameter in defining the minimum berm width required, as the spill
width of the failure is directly proportional to the value allocated. Martin & Piteau (1977) and Gibson et
al. (2006) include the angle of repose in their design criteria for minimum berm width.
Martin & Piteau (1977) assumed that the failed material will rest at the angle of repose, which is typically
between 35 and 40°. The angle of repose can be calibrated by back-analysis of previous or existing failures.
Assessment and implications for uncertainty in design
Slope Stability 2020 735

3.7 Bulk or swell factor
The bulk or swell factor is applied to the derived failure volume in order to represent the new volume of
space that the failed material will fit into, as it is no longer in situ. This factor is allocated based on the material
being assessed.
Piteau & Martin (1977) do not consider a bulk or swell factor in their minimum berm width formulae.
However, a bulking factor may be applied to the minimum berm width after it has been calculated. Gibson
et al. (2006) include a bulk factor in their formulae.
Haines et al. (2006) assume that a value of 1.5 for the bulk or swell factor is acceptable, as do Holley et al.
(2006). Values between 1.3 and 1.5 are considered to be acceptable limits for a bench design analysis.
3.8 Break back cells
Miller (1983) provides the first insight into break back cell distribution and the probability of sliding per
predefined break back cell. The probability that a certain berm width can be attained based on the joint
probability stability is also discussed with the relevant formulae presented in order to calculate this. This is a
concept that is later applied to the Rocscience RocPlane and SWedge software application.
The number of units, or cells that can be analysed for berm width, is dependent on the number and size of
the windows, the discontinuity spacing, length and engineering judgment. It is important to vary the analyses
to test the sensitivity to certain parameters to correctly ascertain the critical failure modes and their
respective break back distances. Stability charts may then be compiled per overall slope angle for the berm
width, allowing for the probability of retaining the berm width to be taken into consideration.
Miller et al. (2000) present the concept of blasting layout being designed with the intent to produce benches
of a certain width. It is unlikely that the berm width will actually be retained after blasting and excavation.
The paper is adapted from Miller (1983) and expands on the break back cell concept whilst providing a
formula for computer-based modelling. The berm design and rockfall assessments must consider the
predicted, operational catch-bench geometry and not the originally designed and ideal geometry. Tension
cracks at the crest have not been incorporated as part of the cell break back probability theory.
3.9 Geotechnical design considerations
Geotechnical design considerations, when conducting a bench design include:
• Deep-seated failure which is to be addressed by other more detailed methods (Piteau &
Martin 1977).
• That the geotechnical model is well defined with specific emphasis on the structural model from
both a major and minor discontinuity perspective. The orientation, geometry and spatial
distribution of the structural features should be described per design sector in collaboration with
the proposed orientation and potential geometry of the pit slopes (Piteau & Martin 1977).
• The probable modes of failure are dependent on the various combinations of the identified joints
sets should be identified along with a probability distribution for the probability of occurrence for
certain wedge formations. Wedge shape formation can be based on stereographic projection
techniques (Piteau & Martin 1977).
• The importance of defining failure for individual benches as well as failure of the overall slope.
It may be found that the PoF for an overall slope is often low with regards to failure on major faults
or weak zones, while the design of individual benches against excessive failure may be the
controlling factor for the design of the overall slope (Martin & Piteau 1977).
• Alternative slope geometry and slope orientation should be considered in collaboration with the
defined discontinuities (Martin & Piteau 1977).
An overview of bench design for cut slopes with an example of an advanceddataset assessment technique
S Coetsee
736 Slope Stability 2020

• Hustrulid et al. (2001) places emphasis on assessing the orientation of slope with respect to
discontinuities as the mode of failure can be amplified or reduced based upon the final pit limits.
This is an especially pertinent point as many pit slopes have been designed without full
comprehension of the impact of slope orientation.
• The bench faces require adequate cleaning and scaling to reduce rockfall and localised failure
occurrence. Achievable bench face angles are defined by the rock strength, geological
characteristics and by drill, blasting and excavation techniques (Hustrulid et al. 2001).
• The option of multiple benching in pits has some benefits which are described in Hustrulid
et al. (2001):
○ To provide steeper inter-ramp or overall pit slopes. Berm widths do not need to be doubled
should the bench face be doubled, thus resulting in a steeper slope.
○ To improve working conditions by leaving a wider, more accessible berm from which to
base operations.
○ To improve the reliability of catch berms as they are wider, by default, in order to minimise the
effect of crest lost.
○ To minimise the occurrence of areas where there is no catch berm left in the slope due to
complete loss (anticipated or due to poor rock conditions or blasting and excavation).
• Ritchie (1963) describes the use of containment ditches dug into the berm. Hustrulid et al. (2001)
states that whilst ditches may not always be possible, should space allow, tailings windrows are
highly useful in rockfall and failure containment.
• The amount of break back of the crest locally rather than the bench face angle, that is of most
concern during the design process. The majority of break back occurs on structures that are located
in close proximity to the bench crest, should the discontinuities be flatter in this portion of the
bench face, crest break back can be significant (Hustrulid et al. 2001).
3.10 Design approaches
Martin & Piteau (1977) propose two principal design approaches. The first is a conservative approach whereby
the slope is designed so that little or no failure occurs, and if it does these minor failures are caught on berms
and removed as required. The second is a thorough consideration of the slope geometry, and an optimised
design that will result in a managed approach toward failure. Berms should be designed to allow for later access
for regular clean-up of failure. Inclined bench faces reduce the likelihood of high stresses at the bench face crest
and therefore minimise tension cracks and subsequent loss of the crest and also reduce rockfall.
Carvalho (ca. 2012) presents a managed approach to bench design similar to that of Martin & Piteau (1977)
whereby a more detailed assessment is made of the design for optimisation. A design reliability of 80% is
considered acceptable, thus allowing for 20% of plane- and wedge-shaped failures to occur.
A technique that can be utilised is the cumulative frequency analysis whereby the potential for a plane to
slide within a pre-determined daylighting window, 50 to 60° wide and 25 to 30° on either side of normal to
the bench face is calculated and the cumulative frequency of the failed planes is plotted against the bench
face angle. For a wedge to slide, the pre-determined daylight window is typically 90° wide and 45° on either
side of the normal to the bench face, similarly the cumulative frequency of the failed planes is plotted against
the bench face angle (Carvalho ca. 2012).
By plotting the cumulative frequency of the failed planes or wedges against the bench face angle, a 20%
acceptance cutoff can be applied. The Carvalho (ca. 2012) study was based on a kinematic approach and
therefore, only defined kinematic or vector failure possibilities opposed to detailing the minimum spill berm
widths required.
Assessment and implications for uncertainty in design
Slope Stability 2020 737

Minimum berm width can be ascertained utilising the methodologies presented in Piteau & Martin (1977),
Martin & Piteau (1977), Pierson et al. (1994), Hustrulid et al. (2001), Miller et al. (2000), Gibson et al. (2006)
or Haines et al. (2006).
In open pit design, it is considered acceptable to trade-off a certain amount of bench scale failure for steeper
bench face angles, but without compromising safety, as it is more economical to schedule regular berm
clean-ups than to have much higher stripping ratios (Carvalho ca. 2012).
Abrahams (2015) states that the requirements of a bench and berm design are effectively the amount of
back-break anticipated, the volume of material that is expected to fail and the minimum berm width that is
required. It is important to define the expected and average conditions of the pit slope to include in an analysis.
The general approaches adopted when conducting a bench analysis, whether conservation or managed,
include:
• A detailed bench and berm design without exposure has limited value as the design is not calibrated.
• It is preferable to start with an empirically sound slope and base the inter-ramp geometry on the
derived overall slope angle.
• The acceptance criteria are based on the geotechnical conditions and operational requirements
and capability.
Abrahams (2015) discussed the two principal approaches to slope design which are to either start with bench
scale and to build stacks, or to start with an inter-ramp slope and assign a geometry that will fit. This is very
dependent on the geotechnical conditions at the project site and the design criteria defined for the study,
however, a sound inter-ramp slope is a more reliable design option from a stability perspective.
3.11 Dataset assessment methods
Piteau & Martin (1977) conducted a study whereby the FoS was calculated for different wedge shapes and
sizes based on the defined joints. The maximum plunge for the wedges with an FoS > 1 was then derived and
used in the proceeding bench design analysis, thus an FoS cutoff of > 1 was applied.
Hafid Baroudi et al. (1992) state that the traditional analysis method provides information typically on the
largest wedge by volume, opposed to smaller accumulative wedges over the distance of the bench face,
which may actually result in a larger failed volume of material. The dataset of derived viable iterations is split
based on the volume of the proposed wedge.
Holley et al. (2006) present an interesting theory of removing all model iterations with an FoS > 1.1. It was
envisaged due to the experience of the authors that the features with an FoS < 1.1 were stable.
Holley et al. (2006) eliminate potential failures that were either too small and therefore likely to be removed
by blasting or too large and therefore unlikely to occur. The largest 20% and the smallest 40% of failures by
volume were removed from the dataset.
Jermy et al. (2011) focused specifically on generated wedge iterations that had FoS values between 1.2 and
1.8 for larger spill volumes. The sensitivity of the FoS for larger failures < 1.2 was defined.
Grenon & Laflamme (2011) build on the work from Grenon & Hadjigeorgiou (2010) by focusing on
incorporating design criteria to the integrated analysis of inter-ramp and bench stability. Both kinematic and
limit equilibrium assessments of the derived pit slopes were conducted. The bench analysis cutoff for the FoS
was < 1.1 similar to that in the study conducted by Holley et al. (2006).
Coetsee (2014) recommends the utilisation of all iterations regardless of FoS or volume and to calculate the
cumulative percentage of spill radii that will exceed a selected berm width, thus not splitting the dataset.
An overview of bench design for cut slopes with an example of an advanceddataset assessment technique
S Coetsee
738 Slope Stability 2020

3.12 Probabilistic analysis for break back assessment
Hustrulid et al. (2001) presents the importance of defining structures that may affect bench crest stability as
part of a probabilistic analysis that takes the occurrence, orientation, length, spacing and shear strength of
the discontinuities into account. The maximum distance of break back due to failure is utilised as a significant
parameter in design bench height and berm width.
Each attribute must be defined statistically in order to be able to complete a probabilistic analysis of these
components. A Monte Carlo method is typically utilised due to the complexity of the variables when
conducting this type of analysis. When assessing the stability for a particular slope orientation, the procedure
is outlined as:
• Determine of the potential failure modes through a kinematic analysis.
• Determine the maximum break back for each defined cell. In turn, assess:
○ The probability of occurrence for each structure set.
○ Calculate the theoretical break back for each failure mode occurrence – ensure the statistical
distribution of the dip, dip direction, length and spacing are included.
○ Construct the geometry of the failure mode.
○ Calculate the stability of the constructed geometry.
○ Evaluate the break back for other failure modes.
○ Calculate the maximum break back for all failure modes and add this to the theoretical break
back model for the slope.
• Combine these results into a cumulative probability density function for the break back.
• Convert the break back distance distribution to an equivalent bench face angle distribution.
This process adequately covers the probability of break back occurrence, which can be completed per design
sector. The break back distance can be converted to equivalent bench face angle and therefore an
appropriate berm width based on the acceptance criteria. It is imperative, where possible, to correctly survey
the bench face toe and crest and compare the achieved design with what was anticipated in the detailed
assessment. An empirical correction factor of what can theoretically be achieved may then be applied per
design sector.
3.13 Rocscience RocPlane and SWedge
The methodology of calculating spill radii for both conical- and pyramidal-shaped instabilities was presented
by Gibson et al. (2006). These methodologies have been utilised by Rocscience in their RocPlane and
SWedge software.
A review of the options available for the Rocscience RocPlane and SWedge software was compiled based on
the tutorials published by Rocscience for bench design (Roscience n.d. a, b). Two principal approaches are
described for the bench design analysis tool:
• The managed approach: The concept that it is acceptable to use steep bench face angles and allow
some failures to occur as long as safety is not compromised. While there is a greater amount of
spilled material on the bench, the economics behind a steeper slope and instituting bench cleaning
procedures are far more favourable than a shallower slope with larger berm widths.
• The quantitative hazard assessment: This includes the estimation of a variety of instability sizes, the
likelihood of forming that instability, the likelihood that the instability will slide and an estimation
of the PoF.
Assessment and implications for uncertainty in design
Slope Stability 2020 739

The minimum bench width is defined as the sum of the back-break distance and the spill width. If this value
is greater than the actual berm width defined in the input parameters, material may spill over the bench and
move down the slope into the operating levels below. As both the back-break distance and spill width will
have a distribution of values, a minimum bench width is defined for each bench face angle according to the
bench retention factor. The acceptance criteria for the minimum berm width is a catchment potential of
between 70 and 85%.
3.14 Assessment of the minimum berm width required utilising published criteria
Ritchie (1963) is the first publication that challenges the concept of the design of berm width to adequately
contain rockfall for highway shoulders. A relationship between the width of the fall-out versus the height and
angle of the slope is provided for selecting adequate berm width for design as is known as the Ritchie Criterion.
In 1977, Piteau & Martin presented formula for designing the minimum berm width required for a bench
design. This is the first instance whereby the cross-sectional and the dip or plunge of the failure were taken
into consideration as well as the angle of repose, however, this formula does not take the true geometry or
the wedge or the bulking/swell factor into consideration.
Martin & Piteau (1977) later present two methods on which slope design can be based, these are a
conservative or a managed approach. A process for calculating the cross-sectional area of a failure, the radius
of the failed material taking the angle of repose into consideration, and the minimum berm width required
to hold the failure size is presented based on the earlier work, case study and formula provided in Piteau &
Martin (1977).
Pierson et al. (1994) present the Oregon Ditch Standard, which is based on a number of tested rockfall scenarios
for determining the required berm width for highway shoulder. Pierson et al. (1994) discuss that ditches true
to the Ritchie Criterion are seldom constructed and therefore, that the criterion has been adjusted and is not
actually applicable as the construction is not an accurate reflection of the design recommendations. The Oregon
Ditch Standard is not typically applied to bench design analysis for open pit slopes.
Hustrulid et al. (2001) present the Modified Ritchie Criterion, which considers rockfall. However, the
applicability of the criterion due to the fact that ditches are not constructed is not highlighted as in Pierson
et al. (1994). The Modified Ritchie Criterion is considered to be conservative for containing rockfall. As the
problem of rockfall and failure containment is complex, a risk-management perspective should be taken into
consideration when compiling an open-pit design.
Gibson et al. (2006) present a methodology for calculating spill radii utilising a conical (does not take wedge
geometry into account) and pyramidal (does take wedge geometry into account) distribution of failed
material. Between the two formulae, it is recommended that the lesser of the two spill radii values is utilised
for design purposes. The principal design considerations for berm width such as the angle of repose, swelling
or bulk factor as well as the bench retention factor are included in the formula.
Haines et al. (2006) present formula for the derivation of spill berm width using a bulk or swell factor of 1.5.
Martin & Piteau (1977) also stated an adjustment factor of 1.5 for the swelling or bulk factor should it not be
taken into consideration. It would appear that the formula presented does not take the angle of repose,
bench retention factor nor the failure geometry into account. Although not published, there is no reason why
the bench retention factor should not be applied to the volume utilised in the formula.
Jermy et al. (2011) conduct a comparison of the Modified Ritchie Criterion (Ritchie 1963) which provided a
static berm width, whilst the Haines Criterion (Haines et al. 2006) and the conical distribution formula from
Gibson et al. (2006) tended to overestimate the berm widths required as the wedge geometry and failed
material distribution were not taken into consideration. The pyramidal Gibson formula (Gibson et al. 2006)
did, however, provide a more realistic estimate of the design berm width.
Gibson & Paul (2016) present a comparison of the Gibson formula (Gibson et al. 2006) and the results
obtained by Frac_Rock, which demonstrates that the Gibson formula overestimates the berm width required
by approximately 10 to 20%.
An overview of bench design for cut slopes with an example of an advanceddataset assessment technique
S Coetsee
740 Slope Stability 2020

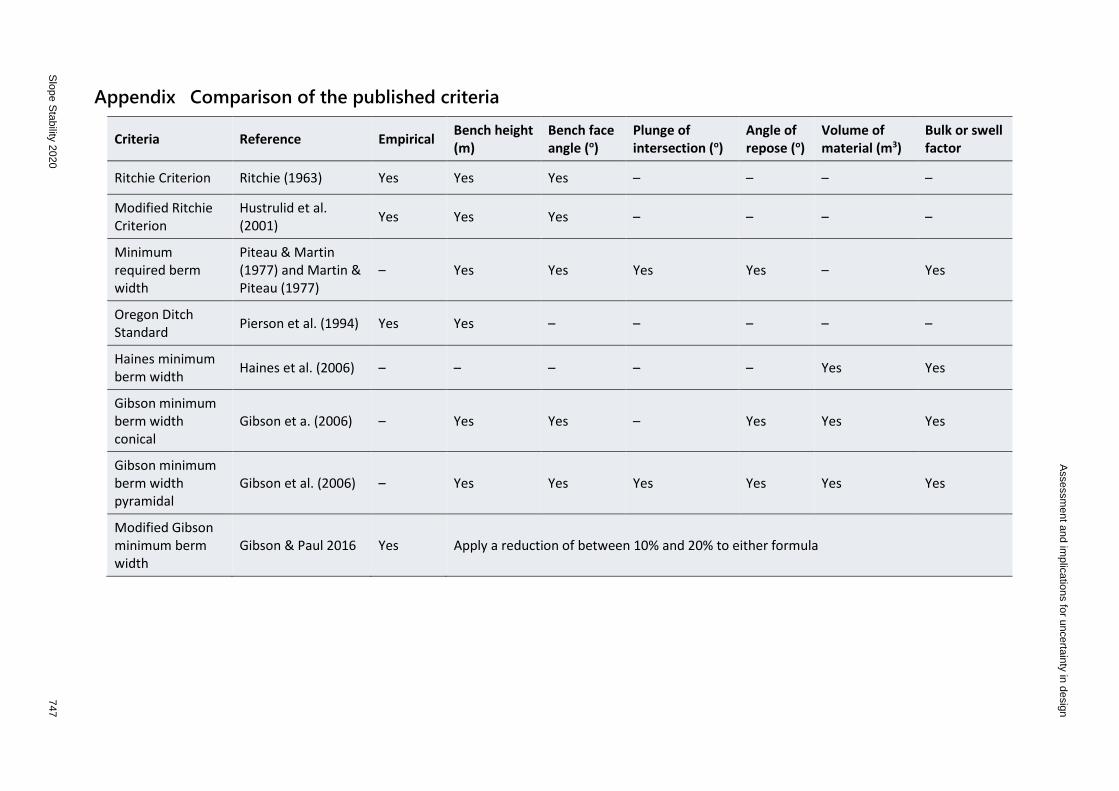
The Appendix provides a comparison of the published criteria, noting if they are empirical or formula-based,
and if factors such as the bench height, bench face angle, plunge of intersection, angle of repose, volume of
material and the bulk/swell factor were taken into consideration.
4 Bench design: an example of an advanced dataset assessment
technique
The assessment of the minimum required berm width using advanced analysis techniques, database
assessment methods and published criteria are discussed in the proceeding sections.
4.1 Bench design methodology using advanced analysis techniques
A flow chart detailing the bench design methodology based on the published literature, available software
and advanced dataset analysis techniques is presented in Figure 1. The flow chart describes the processes
for defining the outcome of the analysis, the data collection stage, the empirical slope design, the kinematic
analysis, model compilation, acceptance criteria, input parameters, practical considerations, managed and
quantitative design approaches, advanced dataset assessment methods, advanced assessment of the
minimum berm width required utilising published criteria and the outcome of the analysis.
4.2 Dataset assessment methods
The published dataset assessment methods may be summarised as:
• FoS cutoff of > 1, Piteau & Martin (1977).
• FoS cutoff of > 1.1, Holley et al. (2006) and Grenon & Laflamme (2011) (iterations with a FoS > 1.1
were discounted).
• Jermy et al. (2011) focussed specifically on generated wedge iterations that had FoS values between
1.2 and 1.8 for larger spill volumes. The sensitivity of the FoS for larger failures < 1.2 was defined.
• Hafid et al. (1992) focus on the largest wedges by volume.
• Remove the largest 20% and smallest 40% of wedge iterations based on volume (Holley et al. 2006).
• Utilise the whole dataset, regardless of FoS or volume (Coetsee 2014).
• Do not apply the berm retention factor criteria to this data, so that a full assessment of the spill
radii can be made (apply design criteria at the end of the analysis).
4.3 Assessment of the minimum berm width required utilising advanced dataset
analysis techniques
In order to conduct a detailed assessment of the planar and wedge sliding implications for berm width, two
plots may be compiled for each section line. The first plot can illustrate the percentage of instabilities per
spill radius bin (metre increments) and the second plot can illustrate the break back distance range per spill
radius (same metre increments) required utilising the same database. The database must be a combined
dataset for planar and wedge sliding iterations for each model, per section line. Figure 2 illustrates an
example of spill radii and percentage of instabilities and the crest break back range per spill radii distance.
By applying a population cutoff (case study specific) of the percentage of instabilities per metre increment
(spill radius), the maximum berm width required and the maximum break back distance (for the berm above)
can be delineated. In the case of Figure 2, the percentage population under 5% for spill radii greater than 6 m
is very low. By assessing each the plots compiled for each section line, for both planar and wedge sliding, the
percentage population cutoff can be decided.
Assessment and implications for uncertainty in design
Slope Stability 2020 741
The population cutoff, whilst case study-specific, should capture a point in the data presented whereby the
majority of the population of instabilities has been taken into consideration. By not applying the berm retention
factor to this data, the true spread of spill widths can be assessed as well as the likely break back range per spill
radii distance. By applying the berm retention factor, this data comparison would not be accurate.
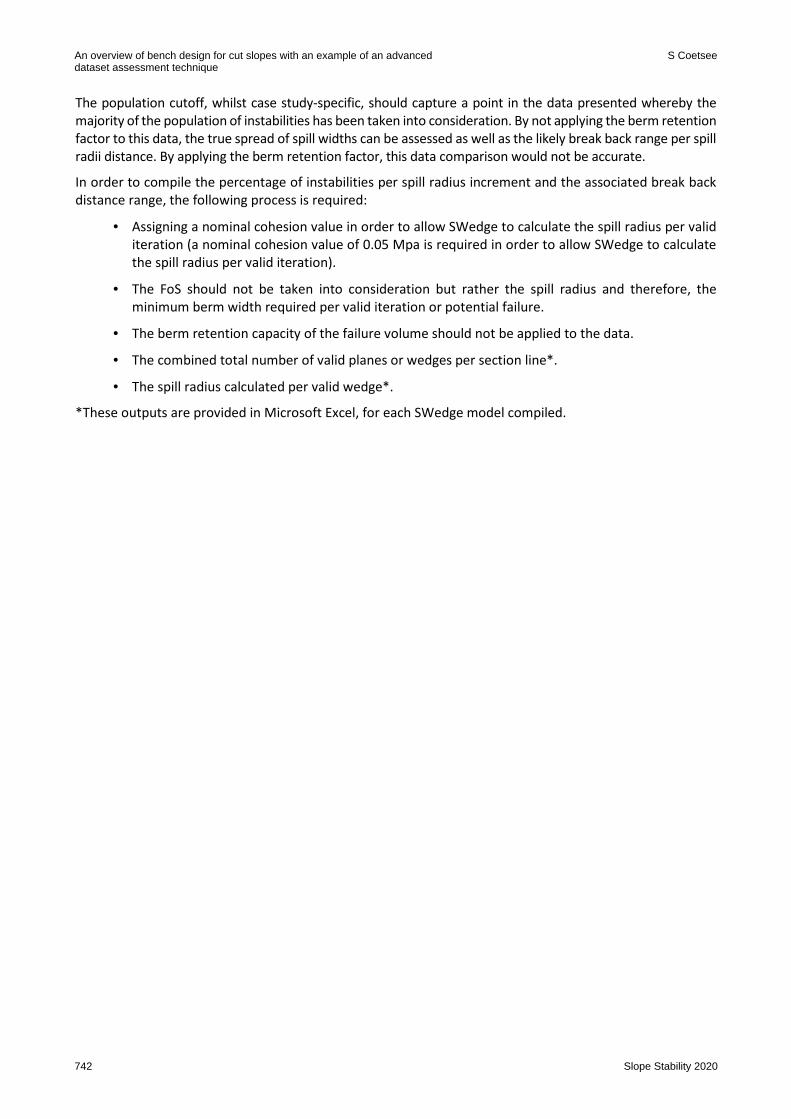
In order to compile the percentage of instabilities per spill radius increment and the associated break back
distance range, the following process is required:
• Assigning a nominal cohesion value in order to allow SWedge to calculate the spill radius per valid
iteration (a nominal cohesion value of 0.05 Mpa is required in order to allow SWedge to calculate
the spill radius per valid iteration).
• The FoS should not be taken into consideration but rather the spill radius and therefore, the
minimum berm width required per valid iteration or potential failure.
• The berm retention capacity of the failure volume should not be applied to the data.
• The combined total number of valid planes or wedges per section line*.
• The spill radius calculated per valid wedge*.
*These outputs are provided in Microsoft Excel, for each SWedge model compiled.
An overview of bench design for cut slopes with an example of an advanceddataset assessment technique
S Coetsee
742 Slope Stability 2020

Figure 1 Bench design methodology based on published literature, available software and advanced
dataset analysis techniques
Assessment and implications for uncertainty in design
Slope Stability 2020 743

Figure 2 Example of spill radii and percentage of instabilities and the crest break back range per spill
radii distance
The FoS per iteration should not be taken into consideration, as it is not an absolute value. The FoS will change
dependent on the joint conditions over time. Therefore, what may be considered an acceptable FoS for a
plane or wedge shape geometry may not be acceptable at a later date due to weathering, blasting, etc.
The information that the plots provide includes:
• The likelihood in the form of the percentage of the population of valid planes and wedges that will
require a certain spill width radius and therefore a minimum berm width.
• The break back distance range behind the crest that is likely to occur per spill width radius bin. This
provides an indication of how much berm loss is likely to occur on the berm above, and what berm
width is required to contain the instability, should it occur.
Once the plots have been compiled for each section line and the percentage cutoff has been applied, a table
can be populated with the section line and failure type, percentage cutoff of spill radius, therefore maximum
berm width required and the maximum break back distance, which is illustrated in Table 1.
Table 1 Maximum berm width required and maximum break back distance per section line (example)
Section and failure type % cutoff of spill radius, therefore
maximum berm width required (m)
Maximum break back
distance (m)
Section 1, planar
(fictitious example) 5% and 10 m 1.5 m
4.4 Advanced method for calculating and comparing the minimum berm width
utilising the published criteria
In order to calculate the minimum berm width utilising the criteria discussed, the database per section line
for both the planar and the wedge sliding analysis can be filtered for the input parameters required for the
various formulae. The database is a combined dataset for planar and wedge sliding iterations for each model,
per section line.
The following information should be derived per section line per valid iteration:
• Volume, calculated from the SWedge weight output as SWedge does not provide direct
volume values.
• Plunge of the failure.
• Length of the plane or wedge on the berm.
An overview of bench design for cut slopes with an example of an advanceddataset assessment technique
S Coetsee
744 Slope Stability 2020

The swelling or bulk factor and the angle of repose should be assigned based on the acceptance criteria.
By applying a case specific percentage cutoff to the database, the maximum berm width required and the
maximum break back distance per failure mode and section line can be derived for this approach too. The
largest weight and therefore failure volume for the maximum berm width bin in the database (per failure
mode, per section line) can be filtered and then utilised to compare the minimum berm width calculated
using the published criteria.
The criteria to be compared include:
• Piteau minimum berm width (Piteau & Martin 1977).
• Modified Ritchie Criterion (Hustrulid et al. 2001).
• Haines minimum berm width (Haines et al. 2006), with and without the bench retention
factor applied.
• Gibson Pyramidal and Conical minimum berm width (Gibson et al. 2006), with and without the
bench retention factor applied.
This method provides a departure from published information in that it includes the advanced dataset
analysis technique.
Table 2 details the results of the minimum berm width required utilising the published methods and applying
the various acceptance criteria.
Table 2 Results of the comparison (example)
Section - Planar
Analysis
Criteria
Rit
chie
(1
96
3)
Pit
ea
u
min
imu
m
be
rm w
idth
(19
77
)
Ore
go
n D
itch
Sta
nd
ard
(19
94
) (6
0%
rete
nti
on
)
Ore
go
n D
itch
Sta
nd
ard
(19
94
) (9
0%
rete
nti
on
)
Mo
dif
ied
Rit
chie
(2
00
0)
Ha
ine
s
min
imu
m
be
rm w
idth
(20
06
)
Section 1, option 1
(fictitious example) 6 10.22 4.40 14.00 9.3 5.37
Section - Planar
Analysis
Criteria
Gib
son
min
imu
m
be
rm w
idth
Gib
son
min
imu
m
Co
nic
al
(20
06
)
Sw
ed
ge
(2
01
7)
Ha
ine
s m
inim
um
be
rm w
idth
- 8
0%
vo
lum
e (
20
06
)
Gib
son
Cri
teri
a
Py
ram
ida
l -
80
%
vo
lum
e (
20
06
)
Gib
son
Cri
teri
a
Co
nic
al
- 8
0%
vo
lum
e (
20
06
)
Section 1, option 1
(fictitious example) 6.39 7.20 6.43 4.98 5.71 6.68
5 Conclusion
Having completed the bench design analysis, an assessment of the results can be conducted.
Dependent on the desired outcome of the analysis (refer to Section 2.2), the results can be assessed with the
design criteria in mind.
Assessment and implications for uncertainty in design
Slope Stability 2020 745

5.1 Published criteria
The advanced method for calculating and comparing the minimum berm width utilising the published criteria
provides useful information on the spread of minimum berm widths calculated based on empirical formulae
as well as formulae developed to capture site-specific conditions.
The comparison of the various berm design criteria illustrated that the Ritchie Criterion (Ritchie 1963),
Oregon Ditch Standard (Pierson et al. 1994) and Modified Ritchie Criterion (Hustrulid et al. 2001) give a
constant berm width as they are empirically based.
The Ritchie Criterion (Ritchie 1963) and the Oregon Ditch Standard (Pierson et al. 1994) for a 60% retention
factor provide minimum berm widths of 6.25 m and 6.20 m, respectively. A minimum berm width of 14 m is
prescribed by the Oregon Ditch Standard (Pierson et al. 1994) for a 90% retention factor. This information is
the same for both the planar and wedge sliding assessment as the bench height and bench face angle dictate
the empirical recommendation for these criteria.
The Piteau minimum berm width values (Piteau & Martin 1977) are typically higher than those calculated for
the Haines minimum berm width (Haines et al. 2006) and Gibson pyramidal and conical berm widths (Gibson
et al. 2006).
The Piteau formulae provide a conservative estimation of the minimum berm width required. Interestingly,
a bulk factor has not been applied to these values, as it is not considered in the original formulae. Should a
bulk factor of 1.3 been applied (by multiplying the berm width by 1.3 for shallow failures or applying the
square root for steeply dipping failures), the minimum berm widths calculated would be conservative.
The Haines minimum berm width (Haines et al. 2006) values are typically lower than that of the Gibson
pyramidal and conical berm widths (Gibson et al. 2006). The formula does not take the angle of repose, bench
retention factor nor the failure geometry into account and therefore may be considered as underestimating
the minimum berm widths required as the formula is not specific to the conditions that may be encountered.
The Gibson pyramidal minimum berm widths are typically higher than those calculated using the conical
minimum berm widths formula. The conical minimum berm width formula does not take the wedge
geometry into consideration and it is stated that it may tend to overestimate the minimum berm width
(Gibson et al. 2006). Should this be the case, it is expected that the conical minimum berm widths would all
be greater than those calculated using the pyramidal formula. This does not hold true with the Kao dataset,
and a more detailed assessment utilising project datasets opposed to test datasets as per the publication
should be explored.
Gibson pyramidal and conical berm widths (Gibson et al. 2006) are utilised by SWedge to calculate the
minimum berm width. It is observed that SWedge selects the lesser of the two calculated values based on
the Gibson conical and pyramidal formula, as recommended by Gibson et al. (2006) at the time of the
compilation of this work. Whilst this recommendation is published, it is pertinent to confirm local site
conditions and make a decision based on the geotechnical model and the data available. Jermy et al. (2011)
state that the pyramidal formula was the most relevant to their study.
By applying the 80% berm retention factor to the potential failure volume, the minimum berm widths were
recalculated for Haines minimum berm width (Haines et al. 2006) and Gibson pyramidal and conical berm
widths (Gibson et al. 2006) in order to finalise the bench design.
5.2 Advanced dataset techniques
By assessing the plot data compiled (refer to Section 4.3 and Figure 2), the maximum berm width calculated
(having applied the spill radii cutoff) and the maximum break back distance can be added and compared to
the actual design, planned design or calibration assessments. This completes the assessment of the minimum
berm width required utilising advanced dataset techniques.
An overview of bench design for cut slopes with an example of an advanceddataset assessment technique
S Coetsee
746 Slope Stability 2020
Appendix Comparison of the published criteria
Criteria Reference Empirical Bench height
(m)
Bench face
angle (o)
Plunge of
intersection (o)
Angle of
repose (o)
Volume of
material (m3)
Bulk or swell
factor
Ritchie Criterion Ritchie (1963) Yes Yes Yes – – – –
Modified Ritchie
Criterion
Hustrulid et al.
(2001) Yes Yes Yes – – – –
Minimum
required berm
width
Piteau & Martin
(1977) and Martin &
Piteau (1977)
– Yes Yes Yes Yes – Yes
Oregon Ditch
Standard Pierson et al. (1994) Yes Yes – – – – –
Haines minimum
berm width Haines et al. (2006) – – – – – Yes Yes
Gibson minimum
berm width
conical
Gibson et a. (2006) – Yes Yes – Yes Yes Yes
Gibson minimum
berm width
pyramidal
Gibson et al. (2006) – Yes Yes Yes Yes Yes Yes
Modified Gibson
minimum berm
width
Gibson & Paul 2016 Yes Apply a reduction of between 10% and 20% to either formula
Assessm
ent and implications for uncertainty in design
Slope S
tability 2020747

References
Abrahams, G 2015, Bench-berm design: who really cares?, SRK Consulting (South Africa) (Pty) Ltd, Cape Town.
Carvalho, J ca. 2012, Slope stability analysis for open pits, Golder Associates Ltd, Mississauga.
Coetsee, S 2014, ‘An overview of bench design for cut slopes’, Proceedings of the 8th South African Young Geotechnical Engineers
Conference, The South African Institution of Civil Engineers, Stellenbosch, pp. 561–571.
Gibson, WH, de Bruyn, IA & Walker, DJ 2006, ‘Considerations in the optimisation of bench face angle and berm width geometries for
open pit mines’, Proceedings of the International Symposium on Stability of Rock Slopes in Open Pit Mining and Civil
Engineering, The Southern African Institute of Mining and Metallurgy, Johannesburg, pp. 557–578.
Gibson, W & Paul, J 2016, Comparison for estimating volume of failed wedges, SRK Consulting (Australasia) Pty Ltd, Perth.
Grenon, M & Hadjigeorgiou, J 2010, ‘Integrated structural stability analysis for preliminary open pit design’, International Journal of
Rock Mechanics and Mining Sciences, pp. 450–460.
Grenon, M & Laflamme, AJ 2011, ‘Inter-ramp and bench design of open pit mines: the Portage pit case study’, Canadian Geotechnical
Journal, pp. 1601–1615.
Haines, A, Voulgaris, P, Walker, D & de Bruyn, I 2006, ‘Geotechnical design considerations for the proposed Oyu Tolgoi open pits,
Southern Mongolia’, Proceedings of the International Symposium on Stability of Rock Slopes in Open Pit Mining and Civil
Engineering, The Southern African Institute of Mining and Metallurgy, Johannesburg, pp. 133–154.
Hafid Baroudi, D, Hantz, PD & Piguet, JP 1992, ‘Bench stability in open pit mines: A methodology for jointed rock masses’, Regional
Conference on Fractured and Jointed Rock Masses, International Society for Rock Mechanics, Lisbon, pp. 67–72.
Hoek, E & Bray, JW 1981, Rock slope engineering, The Institute of Mining and Metallurgy, London.
Holley, K, Skayman, P & Zhiwei, H 2006, ‘Geotechnical design for the open pits at Tanjianshan, China’, Proceedings of the International
Symposium on Stability of Rock Slopes in Open Pit Mining and Civil Engineering, The Southern African Institute of Mining and
Metallurgy, Johannesburg, pp. 483–508.
Hustrulid, WA, McCarter, MK & Van Zyl, DJA 2001, Slope Stability in Surface Mining, Society for Mining, Metallurgy, and Exploration,
Englewood.
Jermy, C, Kuppusamy, V, Fietze, CP & Hornsby, PK 2011, ‘Open pit bench failure volume analysis and berm design – is it realistic?’,
Proceedings of the International Symposium on Rock Slope Stability in Open Pit Mining and Civil Engineering, Canadian Rock
Mechanics Association, Vancouver.
Martin, D & Piteau, DR 1977, ‘Select berm width to contain local failures’, Engineering and Mining Journal, vol. 178, no. 6,
pp. 161–164.
Miller, S 1983, ‘Probabilistic analysis of bench stability for the use in designing open pit mines’, Proceedings of the 24th US Symposium
on Rock Mechanics, American Rock Mechanics Association, Alexandria, pp. 621–629.
Miller, S, Girard, JM & McHugh, EL 2000, ‘Computer modelling of catch benches to mitigate rockfall hazards in open pit mines’, in
J Girard, M Liebman, T Doe & C Breeds (eds), Proceedings of the 4th North American Rock Mechanics Symposium, AA Balkema,
Boca Raton, pp. 539–535.
Pierson, L, Davis, SA & Pfeiffer, TJ 1994, The nature of rockfall as the basis for a new fallout area design criteria for 0.25: 1 slopes,
Oregon Department of Transportation, Salem.
Piteau, D & Martin, DC 1977, ‘Slope stability analysis and design based on probability techniques at Cassiar Mine’, CIM Bulletin,
vol. 70, no. 779, pp. 139–150.
Read, J & Stacey, P 2009, Guidelines for Open Pit Slope Design, CSIRO Publishing, Collingwood.
Ritchie, A 1963, Evaluation of rockfall and its control, Washington State Highway Commission, Washington.
Rocscience n.d .a, Bench Design in Rocplane Tutorial, Rocsience, Toronto.
Rocscience n.d. b, Bench Design in SWedge Tutorial, Rocscience, Toronto.
Whyatt, J, McLaughlin, M & Miller, S 2004, ‘Analysis of bench crest performance at the Yellowstone Mine’, in M McLaughlin &
R McNearny (eds), Proceedings of the 39th Symposium on Engineering Geology and Geotechnical Engineering: Research to
Practice, Montana Tech, Butte, pp. 149–163.
Whyatt, J, Miller, S & Dwyer, JG 2004, NIOSH computer programs for bench crest failure analysis in fractured rock, The National
Institute for Occupational Health and Safety, Cincinnati, https://www.cdc.gov/niosh/mining/UserFiles/works/pdfs/ncpfb.pdf
An overview of bench design for cut slopes with an example of an advanceddataset assessment technique
S Coetsee
748 Slope Stability 2020