Embed Size (px)
Citation preview

1
1
An Overview of Direct-push Well Technology for Long-term Groundwater Monitoring
ITRC Technical and Regulatory Guidance: The Use of Direct-push Well Technology for Long-term
Environmental Monitoring in Groundwater Investigations
Welcome – Thanks for joining us.ITRC’s Internet-based Training Program
This training is co-sponsored by the EPA Office of Superfund Remediation and Technology Innovation
Presentation Overview:Direct-push wells have been used for temporary groundwater monitoring purposes for many years but are generally prohibited for use as long-term groundwater monitoring wells. Recent research indicates that direct-push wells are as well suited for long-term environmental groundwater monitoring purposes as conventionally constructed wells. Since they can be installed for much less expense, direct-push wells are an attractive option. However, most states' regulations prohibit their use indirectly due to the requirement of a minimum annular space.This training introduces state regulators, environmental consultants, site owners, and community stakeholders to ITRC Technical and Regulatory Guidance: The Use of Direct-push Well Technology for Long-term Environmental Monitoring in Groundwater Investigations (SCM-2, 2006), created by ITRC's Sampling, Characterization, and Monitoring Team to assist reviewers in assessing the adequacy of direct-push well projects. This course gives the participant a background in the principles of direct-push wells and presents the state of the art regarding recent research.
ITRC (Interstate Technology and Regulatory Council) www.itrcweb.orgTraining Co-Sponsored by: US EPA Office of Superfund Remediation and Technology Innovation (www.clu-in.org) ITRC Training Program: [email protected]; Phone: 402-201-2419

2
2 ITRC (www.itrcweb.org) – Shaping the Future of Regulatory Acceptance
Host organizationNetwork• State regulators
All 50 states and DC• Federal partners
• ITRC Industry Affiliates Program
• Academia• Community stakeholders
Wide variety of topics• Technologies• Approaches• Contaminants• Sites
Products• Documents
Technical and regulatory guidance documentsTechnology overviewsCase studies
• TrainingInternet-basedClassroom
DOE DOD EPA
The Interstate Technology and Regulatory Council (ITRC) is a state-led coalition of regulators, industry experts, citizen stakeholders, academia and federal partners that work to achieve regulatory acceptance of environmental technologies and innovative approaches. ITRC consists of all 50 states (and the District of Columbia) that work to break down barriers and reduce compliance costs, making it easier to use new technologies and helping states maximize resources. ITRC brings together a diverse mix of environmental experts and stakeholders from both the public and private sectors to broaden and deepen technical knowledge and advance the regulatory acceptance of environmental technologies. Together, we’re building the environmental community’s ability to expedite quality decision making while protecting human health and the environment. With our network of organizations and individuals throughout the environmental community, ITRC is a unique catalyst for dialogue between regulators and the regulated community.For a state to be a member of ITRC their environmental agency must designate a State Point of Contact. To find out who your State POC is check out the “contacts” section at www.itrcweb.org. Also, click on “membership” to learn how you can become a member of an ITRC Technical Team.

3
3
ITRC Disclaimer and Copyright
Although the information in this ITRC training is believed to be reliable and accurate, the training and all material set forth within are provided without warranties of any kind, either express or implied, including but not limited to warranties of the accuracy, currency, or completeness of information contained in the training or the suitability of the information contained in the training for any particular purpose. ITRC recommends consulting applicable standards, laws, regulations, suppliers of materials, and material safety data sheets for information concerning safety and health risks and precautions and compliance with then-applicable laws and regulations. ECOS, ERIS, and ITRC shall not be liable for any direct, indirect, incidental, special, consequential, or punitive damages arising out of the use of any information, apparatus, method, or process discussed in ITRC training, including claims for damages arising out of any conflict between this the training and any laws, regulations, and/or ordinances. ECOS, ERIS, and ITRC do not endorse or recommend the use of, nor do they attempt to determine the merits of, any specific technology or technology provider through ITRC training or publication of guidancedocuments or any other ITRC document.
Copyright 2007 Interstate Technology & Regulatory Council, 444 North Capitol Street, NW, Suite 445, Washington, DC 20001
Here’s the lawyer’s fine print. I’ll let you read it yourself, but what it says briefly is:•We try to be as accurate and reliable as possible, but we do not warrantee this material.•How you use it is your responsibility, not ours.•We recommend you check with the local and state laws and experts. •Although we discuss various technologies, processes, and vendor’s products, we are not endorsing any of them.•Finally, if you want to use ITRC information, you should ask our permission.

4
4ITRC Course Topics Planned for 2008 –More information at www.itrcweb.org
Bioremediation of DNAPLsDecontamination and Decommissioning of Radiologically-Contaminated FacilitiesEnhanced Attenuation: Chlorinated SolventsPhytotechnologyQuality Consideration for Munitions ResponseRemediation Technologies for Perchlorate Contamination SensorsSurvey of Munitions Response TechnologiesUnderstanding the Behavior of LNAPL in the SubsurfaceMore in development…
Characterization, Design, Construction, and Monitoring of Bioreactor LandfillsDirect Push Well Technology for Long-term MonitoringEvaluate, Optimize, or End Post-Closure Care at MSW LandfillsPerchlorate: Overview of Issues, Status and Remedial OptionsPerformance-based Environmental ManagementPlanning & Promoting Ecological Re-use of Remediated SitesProtocol for Use of Five Passive SamplersReal-Time Measurement of Radionuclides in SoilRemediation Process Optimization Advanced TrainingRisk Assessment and Risk ManagementVapor Intrusion Pathway: A Practical Guideline
New in 2008Popular courses from 2007
More details and schedules are available from www.itrcweb.org under “Internet-based Training.”
5
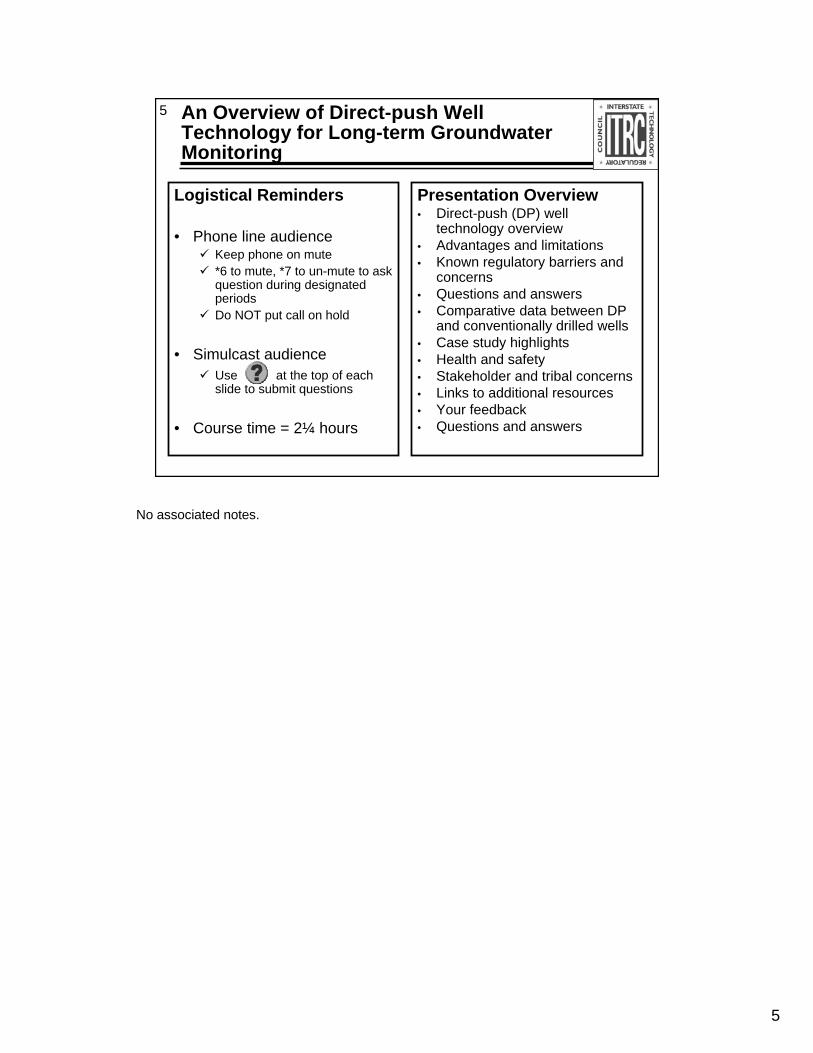
5 An Overview of Direct-push Well Technology for Long-term Groundwater Monitoring
Presentation Overview• Direct-push (DP) well
technology overview• Advantages and limitations • Known regulatory barriers and
concerns• Questions and answers• Comparative data between DP
and conventionally drilled wells • Case study highlights• Health and safety • Stakeholder and tribal concerns• Links to additional resources• Your feedback• Questions and answers
Logistical Reminders
• Phone line audienceKeep phone on mute*6 to mute, *7 to un-mute to ask question during designated periodsDo NOT put call on hold
• Simulcast audienceUse at the top of each slide to submit questions
• Course time = 2¼ hours
No associated notes.

6
6
Meet the ITRC Instructors
Keisha D. LongSouth Carolina Department of Health and
Environmental ControlColumbia, South Carolina(803) [email protected]
Bradley A. CallU.S. Army Corps of EngineersSacramento, California(916) [email protected]
William MajorNavy Facilities Engineering
Service CenterPort Hueneme, California(805) [email protected]
Keisha D. Long is an Environmental Engineer working for the South Carolina Department of Health and Environmental Control since 1998 in Columbia, South Carolina. She is a Project Manager in the State Superfund program. Her responsibilities include overseeing the assessment, remediation, and clean up of Superfund sites in South Carolina; and overseeing the assessment and cleanup of Voluntary Cleanup Program sites. Previously, she worked in the department's RCRA Corrective Action Engineering Program where she guided clean-up actions for dozens of waste management units at Department of Defense bases including: Charleston Air Force Base, Poinsett Electronic Combat Range, and Shaw Air Force Base. She also provided regulatory concurrence to the regulated community and their consultants in Hazardous Waste Management. She has worked as a remedial project manager in the Federal Superfund and Dry-cleaning Restoration programs. Her responsibilities included assisting the US EPA Region 4 with assessment and cleanup of sites in South Carolina that are listed on the National Priorities List (NPL) and assessing registered dry-cleaning sites. Keisha joined ITRC's Sampling, Characterization, and Monitoring team in 2001 and became the team leader in 2008. Keisha earned a bachelor's degree in civil engineering from Clemson University in Clemson, South Carolina in 1998.Bradley A. Call, P.E., is a member of the Interstate Technology Regulatory Council’s Sampling, Characterization and Monitoring Team and is a senior environmental engineer with the Sacramento District of the U.S. Army Corps of Engineers. He also serves as the innovative technology advocate for his District, charged with encouraging consideration of emerging characterization and remediation approaches. The District he serves with provides environmental restoration services to Department of Defense facilities in California, Nevada, Utah and Arizona. Mr. Call also participates with the US EPA’s Triad Approach work group. He obtained his bachelor’s degree in civil engineering from the University of Utah in 1989 and his master’s degree in environmental engineering from the University of California at Davis in 2000. Mr. Call’s interests include improving the effectiveness of decision-making (through application of conceptual site models, improving data evaluation, broadening employment of field analytical technologies, and making electronic data management tools affordable for small projects). He is a registered Civil Engineer in the state of California and is a member of the American Society of Civil Engineers and the National Ground Water Association. William Major works for the Naval Facilities Engineering Service Center in Port Hueneme, CA. He has over 25 years experience with the Navy developing innovative technical solutions to a wide variety of Navy and DoD environmental problems. He currently holds the position of test site manager for the Port Hueneme National Environmental Technology Test Site (NETTS) and is project lead for the ESTCP funded project titled “Demonstration/Validation of Long-Term Monitoring Using Wells Installed by Direct Push Technologies.”

7
7
What You Will Learn…
A description of direct-push well technology and equipment and installation requirementsSampling considerationsTechnology advantages and limitationsKnown regulatory barriers and concernsComparisons between direct push and conventionally drilled wells Case studies Stakeholder concerns
No associated notes.

8
8
Why Monitoring Wells?
Used to collect ground water samples at a fixed location over time (short or long-term monitoring)
Types of wells and method of installation vary
Guidelines for well installation depend upon individual state regulations
Monitoring wells are used to collect groundwater samples for determining the nature and extent of contamination in an aquifer; data collected from wells are used in risk assessment calculations, and are used to verify that remediation goals have been met.
ITRC’s Sampling, Characterization, and Monitoring Team has a mission to develop processes and procedures enabling integration of field sampling and analysis technologies for improved site decision-making. Direct-push wells is one technology that enables us to accomplish that goal.

9
9
What are Direct-push (DP) Wells?
Installed by static or dynamic push
DP wells are smaller in diameter
Were initially deployed for short-term monitoring
An introduction to DP well technology can be found at http://fate.clu-in.org/direct_push/dpp.asp (U.S. EPA Technology Innovation Office)
10
10 What’s the Big Deal About Direct-push Wells? Why Should I Care?
Potential for Dramatic Cost Savings !!
DP wells can be installed at least 2 times faster than conventionally drilled wells
11
11
Annular space barrierLong-term permitted
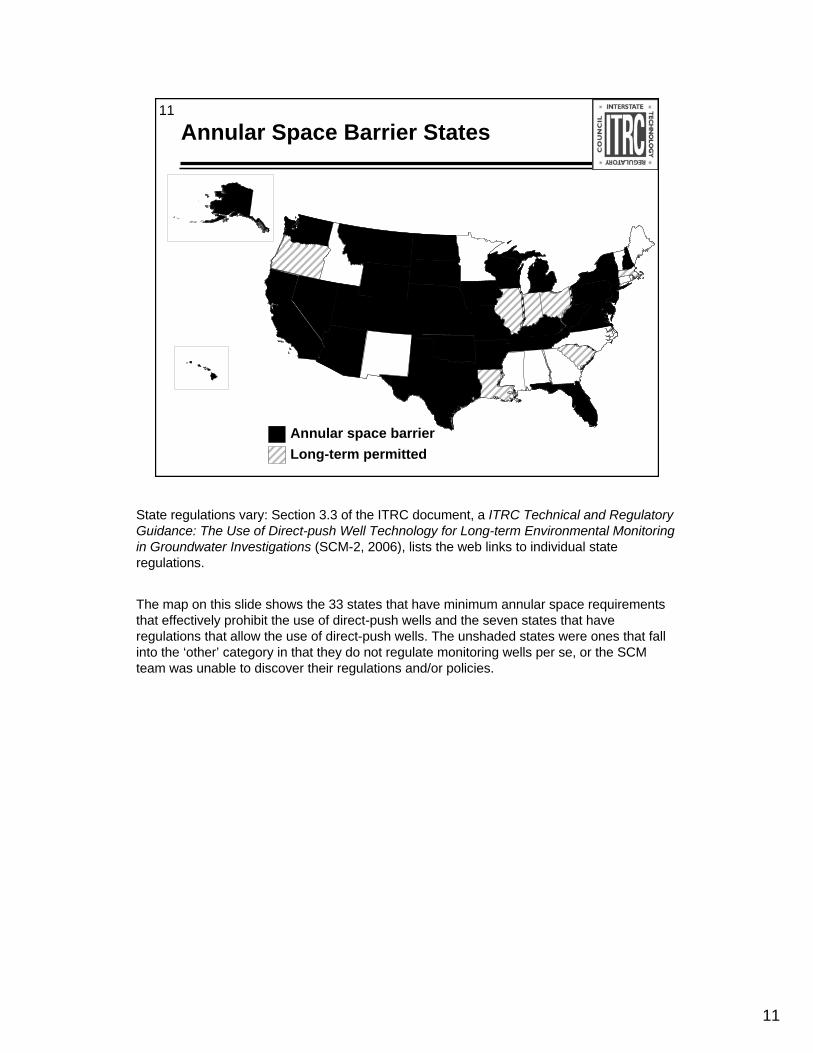
Annular Space Barrier States
State regulations vary: Section 3.3 of the ITRC document, a ITRC Technical and Regulatory Guidance: The Use of Direct-push Well Technology for Long-term Environmental Monitoring in Groundwater Investigations (SCM-2, 2006), lists the web links to individual state regulations.
The map on this slide shows the 33 states that have minimum annular space requirements that effectively prohibit the use of direct-push wells and the seven states that have regulations that allow the use of direct-push wells. The unshaded states were ones that fall into the ‘other’ category in that they do not regulate monitoring wells per se, or the SCM team was unable to discover their regulations and/or policies.

12
12
Direct-push Well Systems
Static force• Cone penetrometer
10-30 ton truckSensors
Dynamic force• Percussion hammer
Truck mounted
The percussion hammer units are the most common and can sometimes maneuver into locations that the larger static force units can’t access.
13
13
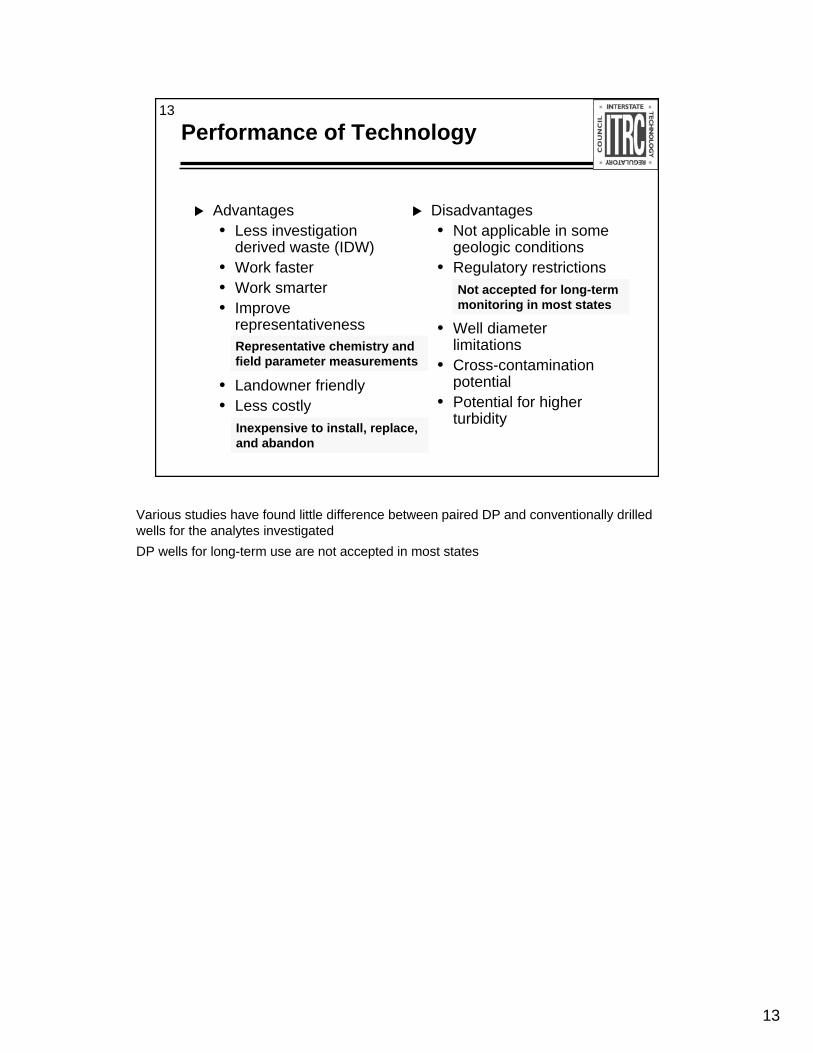
Performance of Technology
Advantages• Less investigation
derived waste (IDW)• Work faster• Work smarter• Improve
representativeness
• Landowner friendly• Less costly
Disadvantages• Not applicable in some
geologic conditions • Regulatory restrictions
• Well diameter limitations
• Cross-contamination potential
• Potential for higher turbidity
Representative chemistry and field parameter measurements
Inexpensive to install, replace, and abandon
Not accepted for long-term monitoring in most states
Various studies have found little difference between paired DP and conventionally drilled wells for the analytes investigatedDP wells for long-term use are not accepted in most states

14
14
Faster
Rapid installation and site characterization• Installation rate two to
five times faster than conventionally drilled monitoring wells
• DP wells can be integrated into a comprehensive dynamic characterization plan (e.g., the Triad approach)
The Triad Approach
Dynamic Work
Strategies
Real-time Measurement Technologies
Systematic Project
Planning
UncertaintyUncertaintyManagementManagement
See ITRC Technical and Regulatory Guidance for the Triad Approach(SCM-1) and associated Internet-based training. More information is available at www.itrcweb.org under “Guidance Documents” and “Internet-based training”
DP wells can be integrated into a comprehensive dynamic work strategy such as the Triad approach. More detail on the Triad approach can be found in the ITRC Technical and Regulatory Guidance for the Triad Approach (SCM-1) available at www.itrcweb.org under “Guidance Documents” and “Sampling, Characterization, and Monitoring” or directly at http://www.itrcweb.org/Documents/SCM-1.pdf. ITRC’s Sampling, Characterization and Monitoring team also offers an Internet-based training title, “Triad Approach – A New Paradigm for Environmental Project Management.” Information on upcoming classes of this Internet-based training is available at www.itrcweb.org under “Internet-based training” and “Triad Approach.” You can access an archive (listen/view slides) of a previous offering of this training by going to: http://cluin.org/live/archive.cfm#itrc (You will have to scroll down to find the course of interest). When you choose to view a course on-line, the link will take you to the course overview page. When you are ready to listen to the training, select Go to Training.

15
15 Adaptable to New Sampling Technologies
DP wells can be integrated with real-time measurement systems such as Membrane Interface Probes (MIPs)The ability to acquire data in real time enhances application of Triad
Above are pictures of the MIP in use in the field

16
16
Regulatory Issues
The primary regulatory issue concerning direct-push wells is that most states require a minimum annulus size for a monitoring well. This requirement cannot be met by the direct-push installation technique.
Definition of annulus space: the space between the well casing and the wall of the drilled hole

17
17
Regulatory Concerns
Well permitting • Annular space• Well seal• Filter pack
Data acceptability • Water level data• Chemical data
State regulations often include an annular space requirement

18
18 Examples of State Regulatory Concerns
Many states require individual variances each time a DP well installation is proposedFlorida• 2” annular space requirement
Illinois• Only temporary (< 1 year) installations allowable
Oklahoma• Borehole requirements restrict DP use
No associated notes.

19
19 DP Technology – Overview of This Part of the Training
DP well installationConstructionDevelopmentSamplingHydraulic conductivity – comparabilityAdvantages/disadvantages
No associated notes.

20
20
Well Types
Conventional hollow-stem auger well
DP well with pre-pack screen
DP well with exposed screen
PVC well
casing
Slotted screen
Sand filter
Bentonite or cement
grout
Bentonite seal
Sand filter inside SS
mesh
Expendable drive point
Natural aquifer material
No associated notes.

21
21
DP Installation Techniques
Two general installation categories• Protected-screen• Exposed-screen
Both involve• Drive rods – typically
steel• Expendable metal
drive points
Direct-push wells can be installed to depths of at least 150 feet. This depends on the available equipment and installation technique used.When a Cone Penetration Test (CPT) rig is used, a electronic soil type log is generated.When a hammer type rig is used it is possible to get continuous cores for geologic logging.

22
22
Installation – Protected-Screen
Within the drive rodRequires seal and filter packWell screen protected from damage and cloggingGenerally similar to conventional well installation
During installation After retracting drive casing
PVC well casing
Drive casingBorehole with drive casing removed
Bentonite/ QuickSeal
sleevePolyethelene
sleevesFoam bridge
Prepack screen
Expendable drive point
Dry Hydrated
Compressed Expanded
No associated notes.

23
23
Installation – Exposed-Screen
Potential damage/ clogging of screen Potential cross-contamination issues Requires careful well developmentFaster installationLess expensiveDoes not allow annular seal
DP well with exposed screen
Expendable drive point
Natural aquifer material
No associated notes.

24
24
Construction Materials
Well configuration and materials similar to conventional wellsCommon casings• Schedule 40 or 80
PVC threaded or flush-jointed casings
Common sizes• ¾, 1, and 2-inch
Screens
No associated notes.

25
25
Construction Materials (continued)
Filter-pack• Pre-installed
Grout barriers• Plastic• Foam
Seal• Pre-installed• Tremie pipe
No associated notes.

26
26
Well Development
Installation alters borehole wall and adjacent formationDevelopment• Improves well/aquifer
hydraulic connection• Removes fines from
filter pack• Reduces sediment in
water samples
Before After
No associated notes.

27
27
Development Techniques
For direct-push wells
Over pumping (purging)Mechanical surgingWater jetting
No associated notes.

28
28
Development Pumping
No associated notes.

29
29
Sampling DP Wells
Similar to conventional wellsPurge and sample• Purge 3 to 5 casing volumes• Ensure groundwater parameters stabilize• Collect sample
Low-flow purge and sample• Similar to above, however purge at slower flow
rateNo purge sampling – passive diffusion bags or other passive samplers
Check www.itrcweb.org for details about ITRC’s internet-based training on “Protocol for Use of Five Passive Samplers”
For more information about passive diffusion bags, visit ITRC’s Diffusion Sampler Information Center (http://diffusionsampler.itrcweb.org).

30
30
Hydraulic Conductivity Study
Participants• Stephen Bartlett (University of Connecticut)• Dr. Gary Robbins (University of Connecticut)• Dr. Mike Barcelona (Western Michigan State University)• Wes McCall (Geoprobe)• Dr. Mark Kram (Naval Facilities Engineering Service Center)
Objective• Compare hydraulic conductivity (K) measurements in DP
and hollow stem auger (conventional) wellsTest Location• Port Hueneme, California
No associated notes.

31
31 Hydraulic Conductivity Study Activities
296 pneumatic slug testsPumping tests• Unsteady state• Constant head steady
stateGeology• Fluvial-deltaic• Sand and gravel
Fully submerged screens
No associated notes.

32
32 Variability in Hydraulic Conductivity (K) – DP Versus Conventional Wells
¾-inch,ASTMpre-pack,DP well
2-inch,ASTMpre-pack,DP well
¾-inch,off-shelfpre-pack,DP well
¾-inch,no filterpack,DP well
2-inch,ASTMfilter pack,conventional well
Hyd
raul
ic C
ondu
ctiv
ity (K
) (cm
/sec
)
0.04
0.03
0.02
0.01
0.00
The hydraulic conductivity (K) of material comprising an aquifer is a measure of the material's capacity to transmit water. Means are indicated by solid circles.

33
33
Conclusions
Short duration pneumatic slug tests (<3 seconds) are feasible for high K formations
K for DP and conventional wells is statistically different but comparable in magnitude
Study results documented in Navy technical report• TR-2252-ENV “Comparison of Hydraulic Conductivity
Determinations in Direct Push and Conventional Wells,” Oct 2004
No associated notes.

34
34
Advantages and Disadvantages
Advantages• Less investigation
derived waste (IDW)• Work faster• Work smarter• Improve
representativeness• Landowner friendly• Less costly
Disadvantages• Not applicable in some
geologic conditions • Regulatory restrictions• Well diameter
limitations• Cross-contamination
potential• Potential for higher
turbidity
No associated notes.

35
35 Advantage – Less Investigation Derived Waste (IDW)
Minimal cutting wastesFewer well development wastesOverall, less investigative derived waste (IDW) to manageReduced exposure to contaminated soilReduced costs
No associated notes.

36
36
Advantage – Work Faster
DP wells can be installed faster• Installation rate two to
five times faster than conventional wells
Site characterization can be completed faster
No associated notes.

37
37
Advantage – Work Smarter
New work strategies like the Triad approach improve• Quality• Cost effectiveness• Time to complete
DP wells integrate well with dynamic work strategies component of Triad
The Triad Approach
Dynamic Work
Strategies
Real-time Measurement Technologies
Systematic Project
Planning
UncertaintyUncertaintyManagementManagement
ITRC Technical and Regulatory Guidance for the Triad Approach (SCM-1) available at www.itrcweb.org under “Guidance Documents” and “Sampling, Characterization, and Monitoring.”
DP wells can be integrated into a comprehensive dynamic work strategy such as the Triad approach. More detail on the Triad approach can be found in the ITRC Technical and Regulatory Guidance for the Triad Approach (SCM-1) available at www.itrcweb.org under “Guidance Documents” and “Sampling, Characterization, and Monitoring” or directly at http://www.itrcweb.org/Documents/SCM-1.pdf. ITRC’s Sampling, Characterization and Monitoring team also offers an Internet-based training title, “Triad Approach – A New Paradigm for Environmental Project Management.” Information on upcoming classes of this Internet-based training is available at www.itrcweb.org under “Internet-based training” and “Triad Approach.” You can access an archive (listen/view slides) of a previous offering of this training by going to: http://cluin.org/live/archive.cfm#itrc (You will have to scroll down to find the course of interest). When you choose to view a course on-line, the link will take you to the course overview page. When you are ready to listen to the training, select Go to Training.

38
38
Advantage – More Representative
Representative chemistry and field parameter measurements• Case studies discussed
laterHydraulic conductivity similar to conventional wells• University of Connecticut/
Port Hueneme studyOverall representativeness improved due to greater affordability of DP wells –install more of them
No associated notes.
39
39
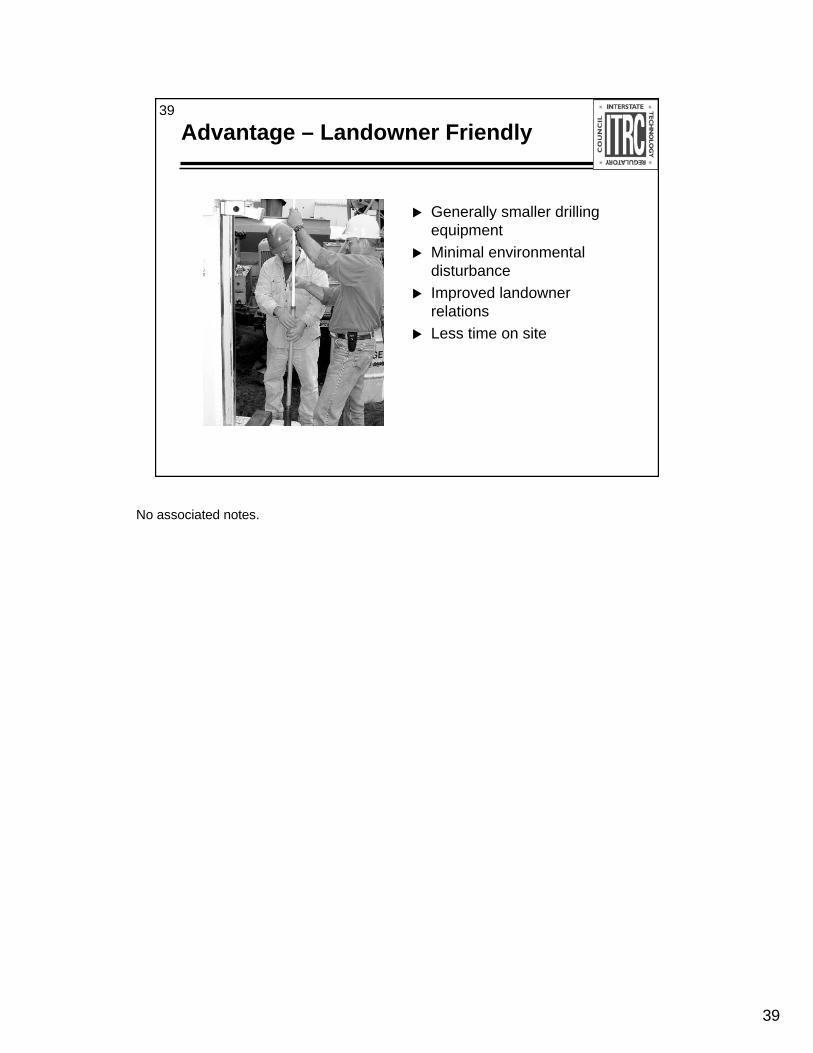
Advantage – Landowner Friendly
Generally smaller drilling equipmentMinimal environmental disturbanceImproved landowner relationsLess time on site
No associated notes.

40
40
Advantage – Less Costly
Less expensive to install, replace, and abandon• DP wells can be
installed at a cost savings ranging from 23% to 65%
No associated notes.
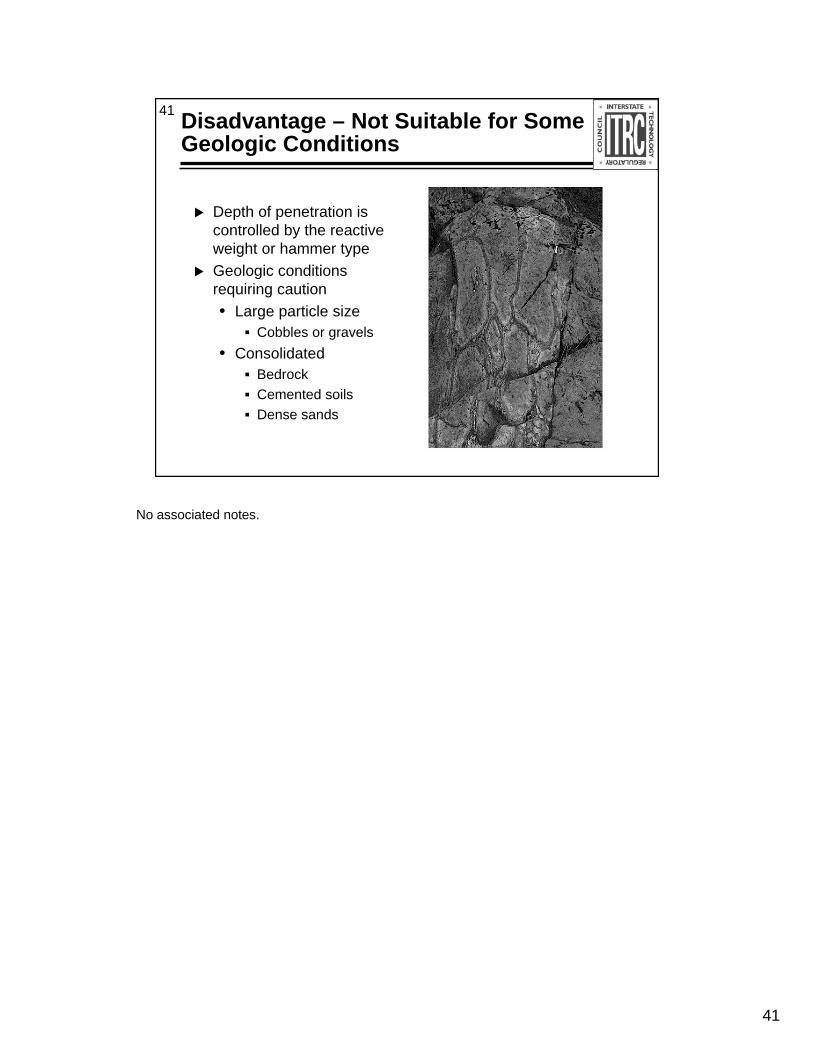
41
41 Disadvantage – Not Suitable for Some Geologic Conditions
Depth of penetration is controlled by the reactive weight or hammer typeGeologic conditions requiring caution• Large particle size
Cobbles or gravels• Consolidated
BedrockCemented soilsDense sands
No associated notes.
42
42 Disadvantage – Regulatory Restrictions
Not accepted for long-term monitoring in most states• Annular space requirement
Filter packsSealing
• Other requirements
No associated notes.

43
43 Disadvantage – Well Diameter Limitations
Wells limited to a maximum diameter of 2-inchesThis may preclude consideration of DP wells in some situationsMay also be a disadvantage if geophysical logging is required
No associated notes.

44
44 Disadvantage – Cross Contamination Potential
Improperly installed well (DP or conventional) may allow aquifer cross-contaminationDuring DP well installation• No outer casing• No drilling mud
Completed DP well• DP wells installed with
the “exposed screen”method have no annular seal
No associated notes.

45
45 Limitation – Potential for Higher Turbidity
DP wells installed with the “exposed screen” method have no filter packNo filter pack may result in higher turbidity in fine-grained soil conditionsProperly developed DP wells installed with the “protected screen” method are not subject to this problem
Source: Ohio EPA Technical Guidance, Feb 05
Drive cap
Coupling
Casing
Coupling
Screen
Wellpoint
No associated notes.

46
46
Evaluating Application of DP Wells
The initial evaluation should consider the following• Do state and local regulations allow use of DP
wells?• If not, can a variance be obtained?• Are geologic conditions suitable in the study area
at the depths of interest?• Do I need wells greater than 2-inches in diameter?
No associated notes.

47
47
Questions and Answers
No associated notes.

48
48 ESTCP Sponsored Study –Background
Environmental Security Technology Certification Program (ESTCP)DoD environmental programs• $3.9B total in FY04• $3.0B in compliance and environmental
restorationDirect-push wells – commonly used throughout DoD
ESTCP supports environmental technology demonstration and validation for priority DoD requirements. Goal: Transition technologies for regulatory and DoD end user acceptance
DoD Environmental Programs -Thousands of facilities; 30 million acres in assets-Over $43B invested in last 10 years-$3.9B total in FY04; $3.0B in compliance and environmental restoration-Significant percentage of budget towards groundwater monitoring and remediation
Direct-push wells are commonly used throughout DoD-Cost-effective, rapid, etc.-Port Hueneme National Environmental Technology Test Sites (NETTS) site DP well installations-Not approved for long-term monitoring and verification sampling-Well performance comparison study: DP vs. hollow-stem auger wells

49
49 Objectives of Direct-push Well Performance Comparison Study
Compare groundwater samples• Analyte concentrations
Address long-term monitoring performance • Five test sites• 13 quarterly sampling events
Compare spatial variability of co-located duplicate • Hollow-stem auger wells • DP wells
Do differences in DP and hollow-stem auger well installation methods and materials impact groundwater analyte concentrations?

50
50 DP Well Study Advisory Committee Directed DP Well Study Design
Site selectionsIndividual and well cluster designs• ½” to 2” DP wells; prepack and no prepack• 2” and 4” conventional hollow-stem auger wells
Well installation methods – static and dynamic forceGeologic cross-sectionTest duration for long-term monitoring and seasonal effectsData QA/QCStatistical analysis and pertinent comparisons
Expert panel-From industry, universities, EPA and California EPA-Major contributors to American Society for Testing and Materials (ASTM)-Convened for Phase I and II
51
51
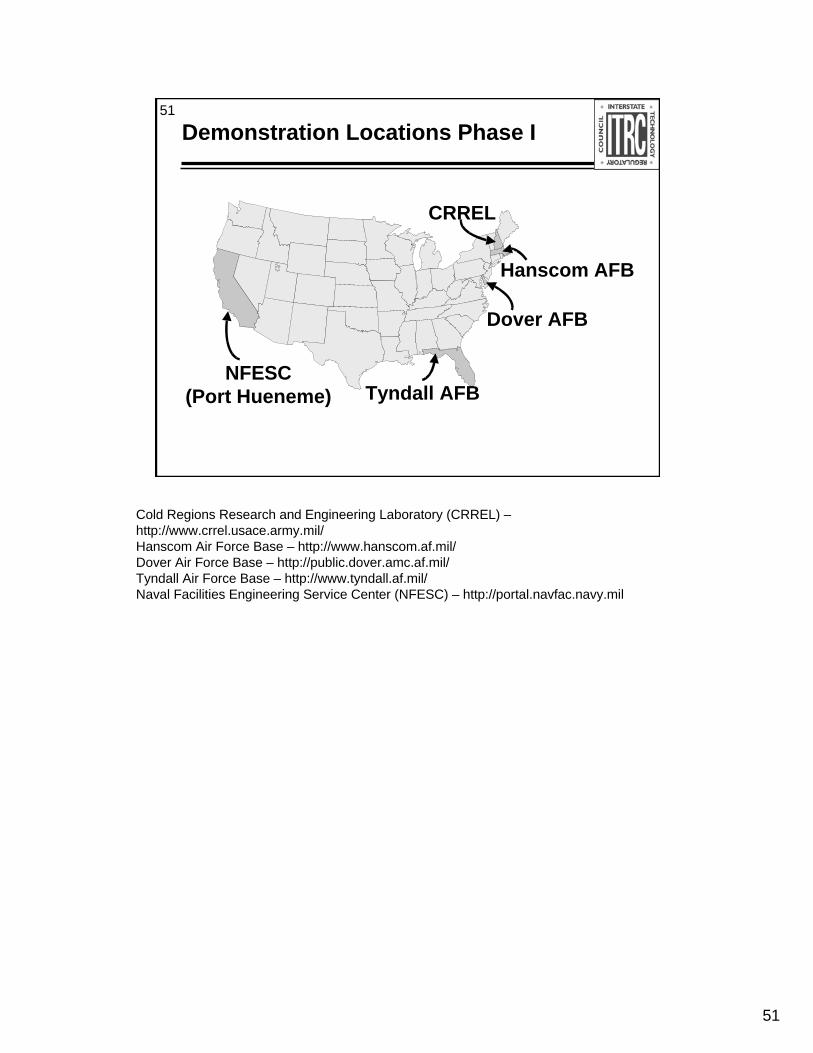
Demonstration Locations Phase I
NFESC(Port Hueneme) Tyndall AFB
Dover AFB
Hanscom AFB
CRREL
Cold Regions Research and Engineering Laboratory (CRREL) –http://www.crrel.usace.army.mil/Hanscom Air Force Base – http://www.hanscom.af.mil/Dover Air Force Base – http://public.dover.amc.af.mil/Tyndall Air Force Base – http://www.tyndall.af.mil/Naval Facilities Engineering Service Center (NFESC) – http://portal.navfac.navy.mil

52
52
Test Sites’ Characteristics
MTBE, Chlorinated and BTEX
5 - 12 ftFluvial Deltaic36Port Hueneme
VOCs3 - 15 ftGlaciolacustrine20Hanscom
VOCs3 - 8 ftMarine Depositional
36Tyndall
VOCs, MTBE, Chlorinated and BTEX
15 - 26 ftMarine Depositional
18Dover
VOCs (TCE), Chlorinated and BTEX
87 - 150 ftGlaciofluvial and Glaciolacustrine
9CRREL
ContaminantsDepth to groundwater
Geologic character
# of wells
Location
No associated notes.

53
53
Typical Well Cluster Design
GW Flow
B4
B3
B2
B1BR-1
BR-2
Duplicate Well Installation
Ground Surface
Water Table
12’ BGS
19’ BGS
No associated notes.

54
54 Typical Well Cluster Results –Dover Air Force Base
29.219.5Ethylbenzene (ug/L)
25.718.5Chloride (mg/L)
9.57.0Magnesium (mg/L)
15.316.2Temperature (oC)
5.45.8pH
0.2520.188Specific conductance (µS/cm)
DP wells (no pack)
Hollow-stem auger (HSA)
wells
Mean Concentrations
No associated notes.

55
55 Typical Well Cluster Results –Port Hueneme
N/AN/A41.540.434.6MTBE (ug/L)
7070686874Chloride (mg/L)
8.34.36.01945Turbidity (NTU)
410405404399415Alkalinity (mg/L)
6.996.996.736.387.52Potassium (mg/L)
2.392.352.242.342.21Manganese (mg/L)
¾-in DP No pack
¾-in DP Conventional
¾-in DP ASTM
2-in DP ASTM
2-in HSA ASTM
Mean Concentrations
Mean values are > +/- 2 standard deviations from HSA well (column 1)
The highlighted values in this table indicate that the mean value of that particular cell is greater than +/- 2 standard deviations (SD) from the mean value of the HSA well in the same table row. It is common statistical nomenclature to refer to mean values that are two standard deviations apart as having “statistical significant difference”.Looking at the "Chloride (mg/L)" row of the table, you will notice that the 2-in DP well's mean of 68 is highlighted while the ¾-in DP well's mean of 68 is not highlighted. While this appears confusing, it is actually just a function of the data variability (i.e., standard deviation of the mean) being higher in one cell than in the other. This can be best explained through example: If the 2-in DP well highlighted cell SD = 1.5 then the “mean plus two SD’s” = 68 + (2 x 1.5) = 71. Therefore, the 2-in HSA well mean of 74 (first column) is greater than 2 SD’s from the 2-in DP well mean of 71 and the two mean values are considered to have a statistical significant difference.If the ¾-in DP well cell SD = 4 then the mean plus two SD’s = 68 + (2 x 4) = 76. Therefore, the 2-in HSA well mean of 74 is less than 2 SD’s from the ¾-in DP well mean of 76 and the two mean values are considered to NOT to have a statistical significant difference.In large data sets, such as the ESTCP study, instances of statistical significant differences between well types are expected due to preferential pathways and large spatial heterogeneities of contaminant concentrations in the groundwater. Therefore, it is most important to consider the entire data set and observe the overall trend of these differences. The ESTCP study found no overall trend in these statistical significant differences that would indicate a DP well would consistently produce higher or lower chemical concentrations than an HSA well (i.e., DP and HSA well performance was comparable).

56
56 Typical Well Cluster Results –Tyndall Air Force Base
4.627545.5Toluene (ug/L)559612754TCE (ug/L)
18225418p-dichlorobenzene (ug/L)
284910430o-Xylene (ug/L)43407130Etylbenzene (ug/L)15161317Sulfate (mg/L)
0.390.370.10.11Manganese (mg/L)36433722Turbidity (NTU)
½-in DP Pre-pack
1-in DP Pre-pack
1½-in DP No pack
2-in HSA
Mean Concentrations
Mean values are > +/- 2 standard deviations from HSA well (column 1)
No associated notes.

57
57
Data Compilation and Analysis
Total of 119 wells in studyDataset includes• 14 organics• 12 inorganics• 7 water quality/field parameters
Over 50,000 analytical data values for 13 sampling eventsAnalysis of variance (ANOVA) statistical analysis compares differences in• Well locations• Well depths• Screen lengths• Temporal • Well type
No associated notes.

58
58
Conclusions
Statistical analyses indicate DP wells compare favorably to HSA wellsWhere statistically significant differences between well types exist• Magnitudes of differences are low • Results are random, no trend in differences favoring either well type• Management decisions will not change
ANOVA revealed large differences due to temporal and well depth parameters BUT NOT due to well typesLow variability for inorganic dataHigh variability for some organic data• Spatial heterogeneity
Trends – temporal and well depthRandom distribution – well types
Triplicate sampling shows very repeatable data
No associated notes.

59
59 BP Amoco and EPA Regions 4 and 5 Study
Objective• Do differences in DP and
HSA well installation methods and materials impact groundwater analyte concentrations?
Locations• Four fuel stations with dissolved-phase
hydrocarbon plumesOhio – 2 sitesGeorgia – 2 sites
No associated notes.

60
60
BP/EPA Study Design
Wells• Each site has 3 DP wells installed 2.5 feet from 3 HSA wells• 12 well pairs, total of 24 wells analyzed in study• HSA wells 2” and 4” diameter• DP wells all 1” diameter• All wells were exposed screen type – no prepacks or seals
Screens• Intervals varied from 10-15 feet• Intervals and depths matched for each DP/HSA well pair
Sampling• Four quarterly samplings events• 8 analytes evaluated over all sites; 768 analytical data values• Additional 9 geochemistry parameters evaluated at two sites
Analysis• Use of ANOVA statistical methods
No associated notes.

61
61
Sites’ Characteristics
17.9 ftSandy silt over sand and gravel outwash
Till PlainGranville, OH
8.8 ftClayey silt with very thin, discontinuous laminae of clay
Interior Plains, Central Lowlands
Toledo, OH
13 ftFine-grained soils and saprolite that mantle bedrock
Piedmont Central Uplands
Marietta, GA
5.1 ftPermeable silty and clayey, fine to medium sands
Barrier IslandSequence Coastal Plain
Brunswick, GA
Mean depth to waterSediment typePhysiographic
provinceSite
No associated notes.

62
62
BP/EPA Study Statistical Results
Chemical analysis• MTBE – no significant differences at 4 sites• BTEX
No significant differences at 3 sitesDP wells significantly higher than HSA at 1 site
• Naphthalene – slightly higher concentrations in DP wells but not across all sites
Geochemical parameters – no significant differencesMean hydraulic conductivity (K) for HSA wells 4.4x greater than DP wellsTotal suspended solids for DP wells > HSA wells• Surge block development methods removed difference
Water levels nearly identical for DP and HSA wells
No associated notes.

63
63 BP/EPA Conclusions and Recommendations
Statistical analyses indicate DP wells compare favorably to HSA wellsWhere differences exist, analyte concentrations in DP wells were generally higherSurge block techniques recommended for development of exposed screen DP wells to reduce turbidityHigher hydraulic conductivity (K) in HSA wells than DP wells• Calculation of effective radius?• Proper DP well development?• Within an order of magnitude—affect management decision?
Researchers found no significant difference in MTBE and BTEX concentrations measured in the DP and conventional wells.
For the geochemical parameters (dissolved oxygen, carbon dioxide, ferrous iron, nitrate, methane, alkalinity, and sulfate), they found no significant difference in the concentrations measured in samples obtained from DP wells vs. those from conventional wells. However, they did note that there was only a small amount of data and it exhibited some variability.

64
64
New Technology: GeoVIS
Direct-push (DP) microscope sensor probeEffective porosity on millimeter scaleMinimal exposure to contaminated soilsSystem used by Navy and Department of Energy Site Characterization and Analysis Penetrometer System (SCAPS)
Lens/ Focusing System
CDD Color Video Camera
Sapphire window
White LED
Mirror
• GeoVIS sensor probe integrated into conventional DP rig• LED light source projected into soil continuously or at selected depths• Light reflected off soil matrix recorded on color video camera• Video images fed back to computer at surface

65
65
GeoVIS Soil Porosity Estimate
High pass filter
Count pixels(white and black)
Calculate porosity (from consecutive
images/slices)
Threshold (130)
• Video camera image is downloaded to computer• Original image signal conditioning with high pass filter for better resolution and contrast• 256 grayscale with black/white threshold set at 130• Processed image now black white• Count pixels, black verses white• Porosity calculated from average of multiple images

66
66
GeoVIS Soil Porosity Estimate
•Example porosity calculation •Screen is 2.5mm x 2.0mm

67
67 New Technology: High-Resolution Piezocone
Direct-push (DP) sensor probe that converts pore pressure to water level or hydraulic headHead values to ± 0.08ft (to >70’ below)Can measure vertical gradientsSimultaneously collect soil type and KMinimal worker exposure to contaminantsNew system installed on Navy Public Works Center (PWC) San Diego SCAPS
• Ability to measure vertical hydraulic gradients is new and so important to understanding groundwater and contaminant flow• Real-time and simultaneous collection of soil type and hydraulic conductivity data is not possible with drilled wells

68
68
High-Resolution Piezocone
• Load cells measure both skin friction along body and force to push tip through soil• Brown ring is permeable enabling pressure transducer inside body to measure pore pressure• Results: real-time soil classification and water level determination

69
69
Dissipation Data
Final pressure corresponds to ‘head’ at given location/depthRate of dissipation is a function of hydraulic conductivityAlso allows for conversion of soil type to K
• T50 is the time (seconds) it takes aquifer to recover to half of the final head at a given depth

70
70
Multiple “head” values per pushFinal pressures yield water table depthCan obtain 3rd dimension and gradients
Water Table Determination
• Blue marks are “stops” where pressure was measured during the push• Extrapolate back to get water table depth• Note straight line through blue marks, this indicates a more homogeneous type soil matrix• Clay lens and other heterogeneous soil matrix conditions can be identified with pressure head measurements do not line up• With pore pressure and soil type data, calculation of vertical hydraulic gradients are possible

71
71
Soil Classification Data
Typical borehole logs – all the things just mentioned – pore pressure, soil classification, K, dissipation, and water level

72
72
Well Design Software Based on CPT
•Takes CPT data and automates design and selection of well screen slot size and filter pack according to ASTM standards for specific soil types •Taking it a step further, the well screen can be placed in higher contaminant zones identified using DP laser induced fluorescence techniques

73
73 Summary – Case Studies andNew Direct Push Technologies
Large DoD savings anticipated from extended use of direct push wellsCase studies presented cover a wide range of:• Contaminants• Soil types• Well parameters• Geographical locations
Data supports DP well data quality• Over 50,000 analytical
data values in ESTCP study strongly support
• BP & EPA study further supports
Data variance • Low for inorganics• High from some organic
contaminantsSignificant differences do exist between well types but no trend was observed in the data setsDP wells being pushed into the subsurface allows a large suite of emerging characterization technologies to be implemented
Large DoD savings anticipated from extended use of direct Push wellsCase studies presented cover a wide range of contaminants, soil types, well parameters, and geographical locationsOver 50,000 analytical data values in ESTCP study strongly supports DP well data qualityBP & EPA study further supports DP well data qualityData variance low for inorganics & high from some organic contaminantsSignificant differences do exist between well types but no trend was observed in the data setsThe fact that DP wells are pushed into the subsurface allows a large suite of emerging characterization technologies to be implemented.

74
74
State Case Studies – Delaware
Types of sites• Brownfield, CERCLA, Solid
Waste, UST, Voluntary Cleanup
Contaminants of concern• Chlorinated solvents,
petroleum, metals, methane gas
Primary uses of DP wells• Permanent and temporary
Depth range• 8-45 ft bgs
Geological conditions• Sandy alluvium, silts, clays,
and weathered bedrock
Some problems encountered include the hole collapsing during installation of the DP filter pack, and casings shattering. However, the pre-packed wells are showing representative results and cost savings of 50 to 60% when compared to conventional wells
75
75
Missouri
Types of sites• CERCLA/SARA, UST,
landfillsContaminants of concern• Volatile organics, methane
Primary uses of DP wells• Permanent and temporary
Depth range• 15-70 ft bgs
Conclusions/findings• DP wells could be installed
at an average savings of 69%, over conventional 2”monitoring wells
Analysis of data generated during a comparative study (conducted by the Missouri DNR in 1994) indicated direct-push wells could be installed at an average savings of approximately 69% over conventionally drilled 2” monitoring wells. Missouri Department of Natural Resources "An Analysis of Landfill Gas Monitoring Well Design and Construction" available from the "Links to Additional Resources page (http://www.clu-in.org/conf/itrc/directpush/resource.cfm)

76
76
South Carolina
Types of sites• Superfund, RCRA, UST,
Drycleaner, BrownfieldContaminants of concern• Volatile and semi-volatile
organics, inorganicsPrimary uses of DP wells• Permanent and
temporaryDepth range• 4-100 ft bgs
Geological conditions• Piedmont• Coastal plain
The SC Drycleaner Restoration Trust Fund has a sampling protocol involving the use of DP technologies
77
77
Wisconsin
Types of sites• Agricultural Chemical
Cleanup Program, Superfund, UST
Contaminants of concern• Range from pesticides to
volatile organicsPrimary uses of DP wells• Permanent and temporary
Depth range• < 45 ft bgs
Geological conditions• Till and moraine deposits,
loess, outwash deposits
Wisconsin Administrative Code chapter NR 141 specifies standards for design, installation, construction, abandonment, and documentation of groundwater monitoring wells

78
78
Washington
Used as standard practiceHas been used at several major site cleanups• Wenatchee Tree Fruit
Orchard• Hanford (US DOE)
Regulations governing use of DP wells codifiedInnovative technologies such as laser head cone attachments being used to break up cobbles which limit DP applications
No associated notes.

79
79
Stakeholders
Communication with stakeholders early and often is keyStakeholders can often drive remediation alternatives• Oxnard Plain: Port
Hueneme, CAStakeholders must be convinced of the technical effectiveness of DP wells before they can be expected to support their use
Effective communication helps stakeholders gain a greater understanding of the regulatory process, technologies and remediation techniques

80
80
Sensitive Locations
DP well rigs can get in and out of sensitive locations quickly

81
81
Monitoring Well Health and Safety
Air monitoring, appropriate respiratory protection, adequate decontamination procedures, adequate personal protective equipment (PPE)
Exposure to hazardous substances
Keeping hands clear of equipment and wearing heavy work gloves
Hands becoming trapped in equipment
Keeping feet clear of equipment and wearing steel-toed boots
Feet becoming trapped under probe foot and/or derrick
Adequate head protection (hard hat)Head injury
Adequate eye protection (safety glasses)Flying dust/debris during hammering
Request/conduct a utilities locate prior to initiating work
Hidden (subsurface) obstacles/utilities
RemedySafety Issue
This table lists various health and safety concerns associated with all types of drilling

82
82
Conclusions
Representative chemistry and field parameter measurementsCost savingsFewer well development wastes
DP wells result in less investigation derived waste (IDW), less exposure to contaminants, save money, and provide representative data

83
83
Conclusions (continued)
Installation rate two to five times faster than conventionally drilled monitoring wellsMinimal environmental disturbanceImproved landowner relations
DP wells can be installed quickly
84
84
Considerations
Not applicable in consolidated materials Not accepted for long-term monitoring in most statesWell diameter limitations
Consolidated materials can limit DP installationsIf it is necessary to install a well using a casing greater than 2” in diameter, then conventional drilling equipment should be used
85
85
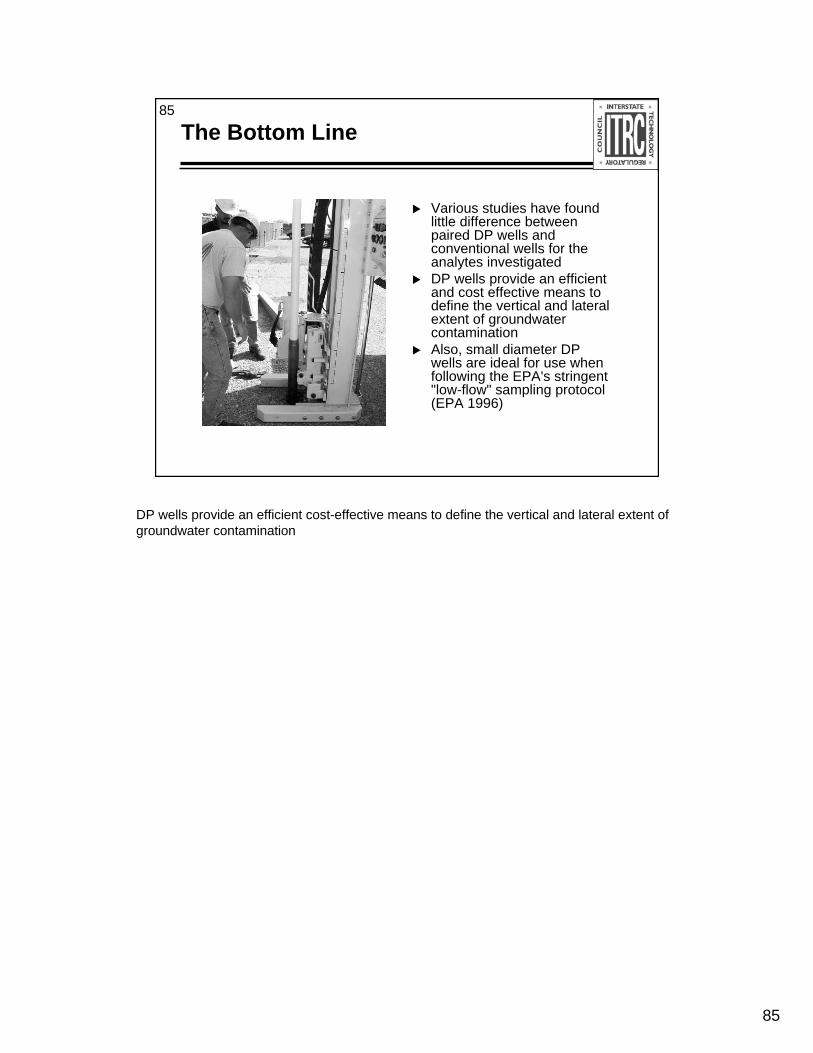
The Bottom Line
Various studies have found little difference between paired DP wells and conventional wells for the analytes investigatedDP wells provide an efficient and cost effective means to define the vertical and lateral extent of groundwater contaminationAlso, small diameter DP wells are ideal for use when following the EPA's stringent "low-flow" sampling protocol (EPA 1996)
DP wells provide an efficient cost-effective means to define the vertical and lateral extent of groundwater contamination

86
86
Thank You for Participating
Links to additional resources• http://www.clu-in.org/conf/itrc/
directpush/resource.cfm
2nd question and answer session
Links to additional resources: http://www.clu-in.org/conf/itrc/directpush/resource.cfm
Your feedback is important – please fill out the form at: http://www.clu-in.org/conf/itrc/directpush
The benefits that ITRC offers to state regulators and technology developers, vendors, and consultants include:
Helping regulators build their knowledge base and raise their confidence about new environmental technologies
Helping regulators save time and money when evaluating environmental technologiesGuiding technology developers in the collection of performance data to satisfy the
requirements of multiple statesHelping technology vendors avoid the time and expense of conducting duplicative and
costly demonstrationsProviding a reliable network among members of the environmental community to focus on
innovative environmental technologies
How you can get involved with ITRC:Join an ITRC Team – with just 10% of your time you can have a positive impact on the
regulatory process and acceptance of innovative technologies and approachesSponsor ITRC’s technical team and other activitiesBe an official state member by appointing a POC (State Point of Contact) to the State
Engagement TeamUse ITRC products and attend training coursesSubmit proposals for new technical teams and projects