Embed Size (px)
Citation preview
IntroductionPropertiesofOpticalFiberMacrobending MacrobendingBackground Fiberparameters&attributesaffectingmacrobending Macrobendinginindustrystandards PracticalconsiderationsofmacrobendingMicrobendingMicrobendingBackgroundFiberparameters&attributesaffectingmicrobending Microbendinginindustrystandards PracticalconsiderationsofmicrobendingTheroleofcoatingtoreducemicrobendingCompare&contrastmacrobendingµbending ConclusionAcknowledgements
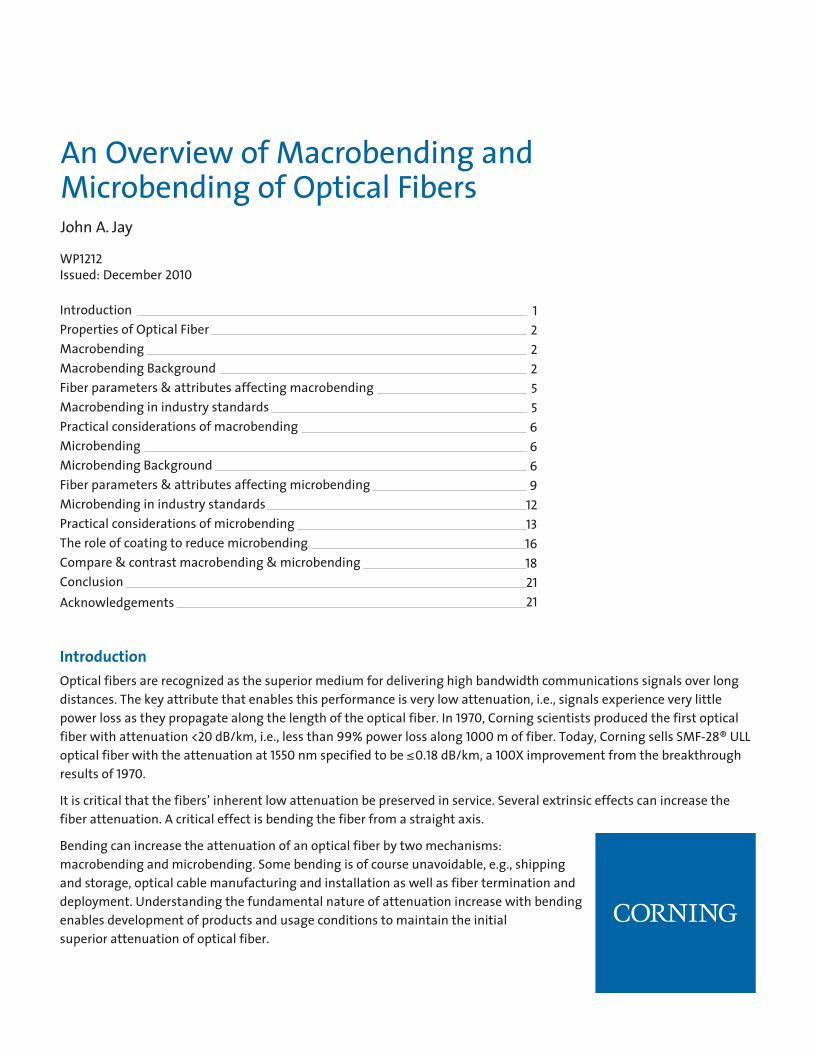
IntroductionOpticalfibersarerecognizedasthesuperiormediumfordeliveringhighbandwidthcommunicationssignalsoverlongdistances.Thekeyattributethatenablesthisperformanceisverylowattenuation,i.e.,signalsexperienceverylittlepowerlossastheypropagatealongthelengthoftheopticalfiber.In1970,Corningscientistsproducedthefirstopticalfiberwithattenuation<20dB/km,i.e.,lessthan99%powerlossalong1000moffiber.Today,CorningsellsSMF-28®ULLopticalfiberwiththeattenuationat1550nmspecifiedtobe≤ 0.18dB/km,a100Ximprovementfromthebreakthroughresultsof1970.
Itiscriticalthatthefibers’inherentlowattenuationbepreservedinservice.Severalextrinsiceffectscanincreasethefiberattenuation.Acriticaleffectisbendingthefiberfromastraightaxis.
Bendingcanincreasetheattenuationofanopticalfiberbytwomechanisms:macrobendingandmicrobending.Somebendingisofcourseunavoidable,e.g.,shippingandstorage,opticalcablemanufacturingandinstallationaswellasfiberterminationanddeployment.Understandingthefundamentalnatureofattenuationincreasewithbendingenablesdevelopmentofproductsandusageconditionstomaintaintheinitialsuperiorattenuationofopticalfiber.
AnOverviewofMacrobendingandMicrobendingofOpticalFibersJohnA.Jay
WP1212Issued:December2010
1222556669
121316182121
2
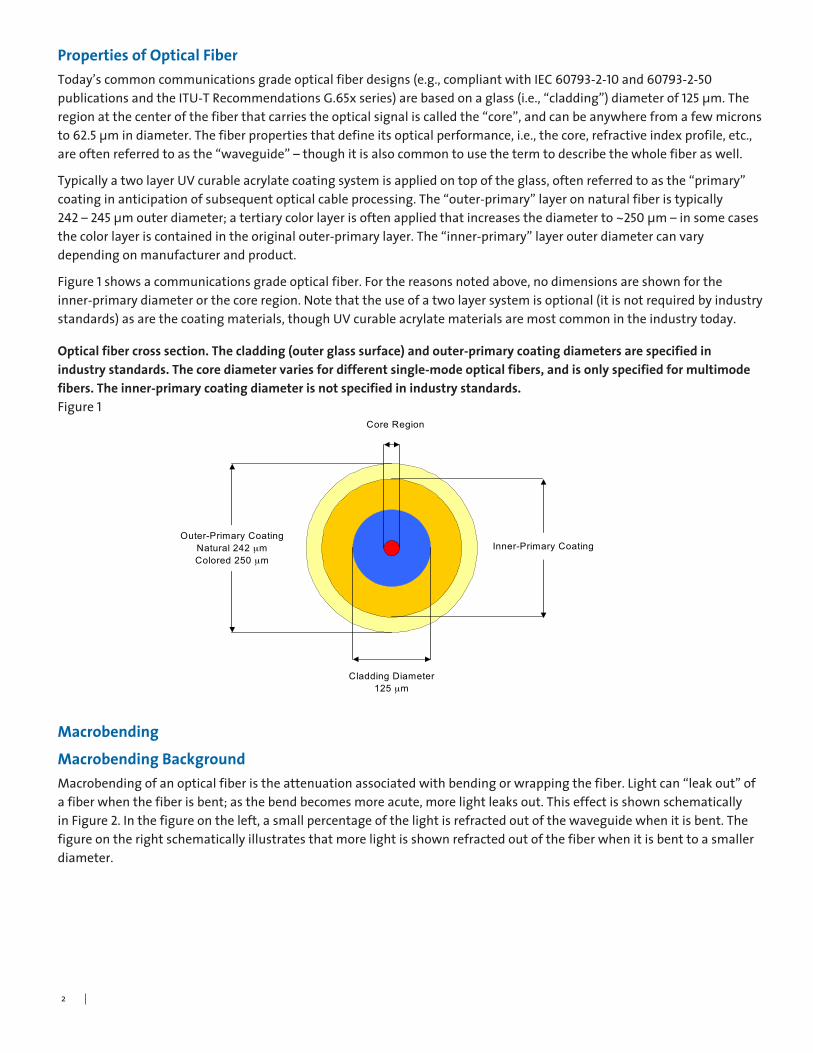
Properties of Optical FiberToday’scommoncommunicationsgradeopticalfiberdesigns(e.g.,compliantwithIEC60793-2-10and60793-2-50publicationsandtheITU-TRecommendationsG.65xseries)arebasedonaglass(i.e.,“cladding”)diameterof125μm.Theregionatthecenterofthefiberthatcarriestheopticalsignaliscalledthe“core”,andcanbeanywherefromafewmicronsto62.5μmindiameter.Thefiberpropertiesthatdefineitsopticalperformance,i.e.,thecore,refractiveindexprofile,etc.,areoftenreferredtoasthe“waveguide”–thoughitisalsocommontousethetermtodescribethewholefiberaswell.
TypicallyatwolayerUVcurableacrylatecoatingsystemisappliedontopoftheglass,oftenreferredtoasthe“primary”coatinginanticipationofsubsequentopticalcableprocessing.The“outer-primary”layeronnaturalfiberistypically242–245μmouterdiameter;atertiarycolorlayerisoftenappliedthatincreasesthediameterto~250μm–insomecasesthecolorlayeriscontainedintheoriginalouter-primarylayer.The“inner-primary”layerouterdiametercanvarydependingonmanufacturerandproduct.
Figure1showsacommunicationsgradeopticalfiber.Forthereasonsnotedabove,nodimensionsareshownfortheinner-primarydiameterorthecoreregion.Notethattheuseofatwolayersystemisoptional(itisnotrequiredbyindustrystandards)asarethecoatingmaterials,thoughUVcurableacrylatematerialsaremostcommonintheindustrytoday.
Macrobending
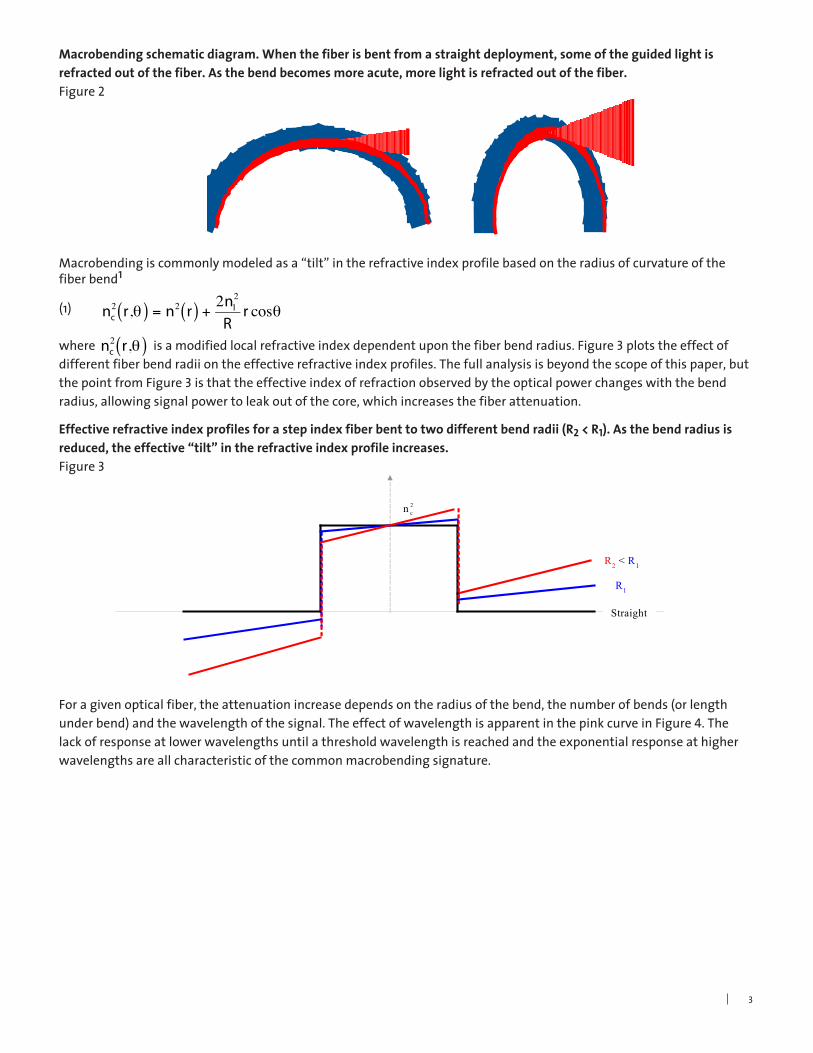
Macrobending BackgroundMacrobendingofanopticalfiberistheattenuationassociatedwithbendingorwrappingthefiber.Lightcan“leakout”ofafiberwhenthefiberisbent;asthebendbecomesmoreacute,morelightleaksout.ThiseffectisshownschematicallyinFigure2.Inthefigureontheleft,asmallpercentageofthelightisrefractedoutofthewaveguidewhenitisbent.Thefigureontherightschematicallyillustratesthatmorelightisshownrefractedoutofthefiberwhenitisbenttoasmallerdiameter.
Optical fiber cross section. The cladding (outer glass surface) and outer-primary coating diameters are specified in industry standards. The core diameter varies for different single-mode optical fibers, and is only specified for multimode fibers. The inner-primary coating diameter is not specified in industry standards.Figure1
Outer-Primary CoatingNatural 242 μmColored 250 μm
Inner-Primary Coating
Cladding Diameter125 μm
Core Region
�
Macrobendingiscommonlymodeledasa“tilt”intherefractiveindexprofilebasedontheradiusofcurvatureofthefiberbend1
(1)
whereisamodifiedlocalrefractiveindexdependentuponthefiberbendradius.Figure3plotstheeffectofdifferentfiberbendradiiontheeffectiverefractiveindexprofiles.Thefullanalysisisbeyondthescopeofthispaper,butthepointfromFigure3isthattheeffectiveindexofrefractionobservedbytheopticalpowerchangeswiththebendradius,allowingsignalpowertoleakoutofthecore,whichincreasesthefiberattenuation.
Foragivenopticalfiber,theattenuationincreasedependsontheradiusofthebend,thenumberofbends(orlengthunderbend)andthewavelengthofthesignal.TheeffectofwavelengthisapparentinthepinkcurveinFigure4.Thelackofresponseatlowerwavelengthsuntilathresholdwavelengthisreachedandtheexponentialresponseathigherwavelengthsareallcharacteristicofthecommonmacrobendingsignature.
€
nc2 r,θ( ) = n2 r( ) +
2n12
Rr cosθ
€
nc2 r,θ( ) = n2 r( ) +
2n12
Rr cosθ
Macrobending schematic diagram. When the fiber is bent from a straight deployment, some of the guided light is refracted out of the fiber. As the bend becomes more acute, more light is refracted out of the fiber. Figure2
Effective refractive index profiles for a step index fiber bent to two different bend radii (R2 < R1). As the bend radius is reduced, the effective “tilt” in the refractive index profile increases.Figure3
2cn
R2 < R1
R1
Straight
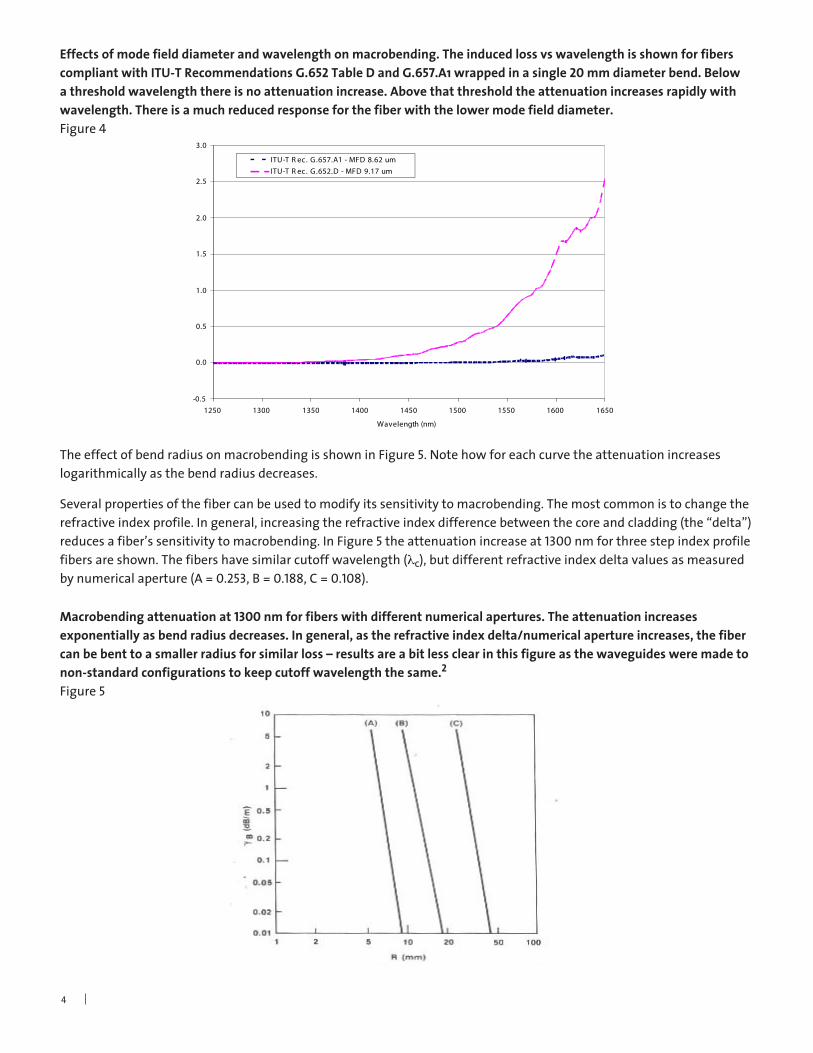
TheeffectofbendradiusonmacrobendingisshowninFigure 5.Notehowforeachcurvetheattenuationincreaseslogarithmicallyasthebendradiusdecreases.
Severalpropertiesofthefibercanbeusedtomodifyitssensitivitytomacrobending.Themostcommonistochangetherefractiveindexprofile.Ingeneral,increasingtherefractiveindexdifferencebetweenthecoreandcladding(the“delta”)reducesafiber’ssensitivitytomacrobending.InFigure5theattenuationincreaseat1300nmforthreestepindexprofilefibersareshown.Thefibershavesimilarcutoffwavelength(lc),butdifferentrefractiveindexdeltavaluesasmeasuredbynumericalaperture(A=0.253,B=0.188,C=0.108).
4
-0.5
0.0
0.5
1.0
1.5
2.0
2.5
3.0
1250 1300 1350 1400 1450 1500 1550 1600 1650
Wavelength (nm)
Macrobend Attenuation Increase (dB)
ITU-T R ec. G.657.A1 - MFD 8.62 umITU-T R ec. G.652.D - MFD 9.17 um
Effects of mode field diameter and wavelength on macrobending. The induced loss vs wavelength is shown for fibers compliant with ITU-T Recommendations G.652 Table D and G.657.A1 wrapped in a single 20 mm diameter bend. Below a threshold wavelength there is no attenuation increase. Above that threshold the attenuation increases rapidly with wavelength. There is a much reduced response for the fiber with the lower mode field diameter.Figure4
Macrobending attenuation at 1300 nm for fibers with different numerical apertures. The attenuation increases exponentially as bend radius decreases. In general, as the refractive index delta/numerical aperture increases, the fiber can be bent to a smaller radius for similar loss – results are a bit less clear in this figure as the waveguides were made to non-standard configurations to keep cutoff wavelength the same.2
Figure5
Macrobending in Industry StandardsMacrobendinghasbeenunderstoodsincetheearlydaysoffiberoptics,andtestmethodsandspecificationshavebeeninplacesincesingle-modefiberwasintroducedcommerciallyintheearly1980’s.4Probablythefirstpracticaldescriptionformacrobendinglimits,andthefirstcommonindustryspecification,wasintroducedbyBellCommunicationsResearch(“Bellcore”)inthemid-1980’s.Theydevelopedaspecificationlimitingtheattenuationincreaseof100x75mmdiameterturnstosimulatethetotalnumberoffiberloopspreparedwhenwrappingexcessfiberlengthsatallsplicepointsinacommonlonghaullink.Fibercutoffwavelengthalsoaffectsmacrobendingperformance,andthetwoattributesarecommonlytakeninto�accountsimultaneouslyusinganempiricalparametercalledthe“MACnumber”.
Today,anindustrystandardexistsformeasuringopticalfibermacrobending,IEC60793-1-47Measurement methods and test procedures – Macrobending loss.Themethodbasicallyconsistsofmeasuringtheinsertionlossofafibersampledeployedinthespecifiedbendradius.Thestandarddescribesthemostcommonapproach,wrappingthefiberonamandrelofthespecifieddiameter,aswellasa“guidinggrooveonaflatsurface”,deployingthefiberin¼-turngroovesmachinedintoaflatsurface.Anothercommontechniqueisthe“parallelplate”deploymentinwhichthesampleis“pinched”betweentwoparallel,flatsurfaces,andthetestbendradiusisdeterminedbyhalftheseparationoftheflatsurfaces.
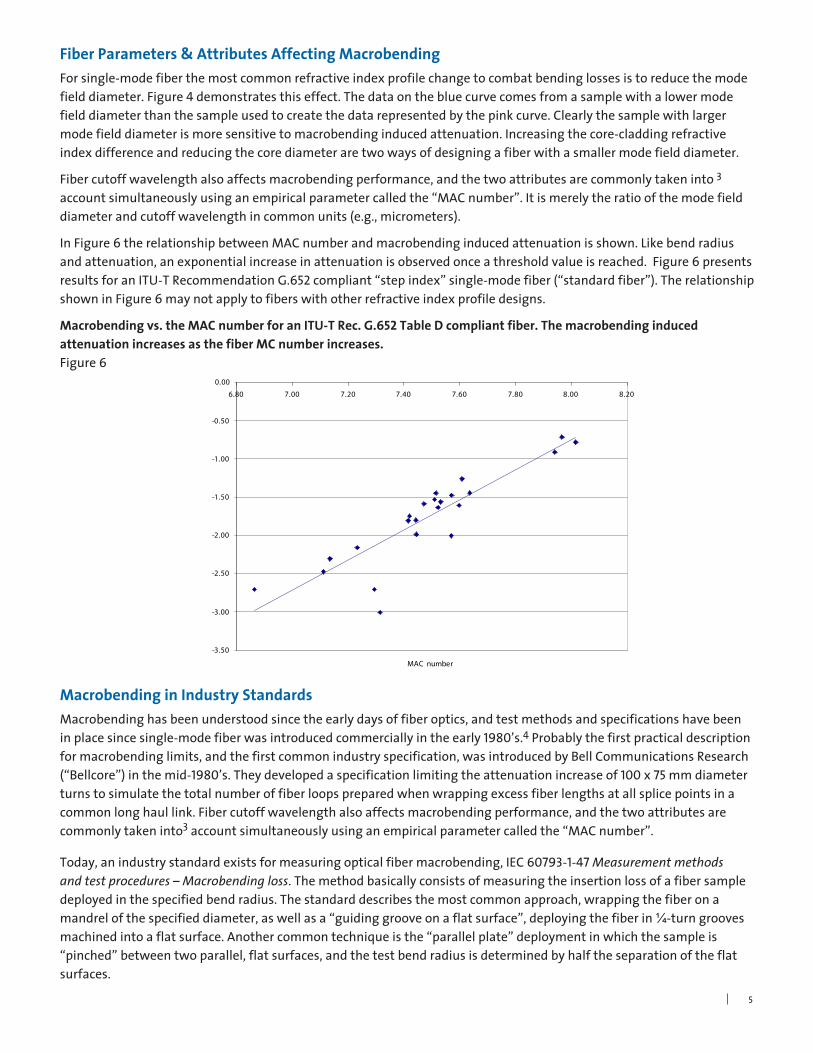
Macrobending vs. the MAC number for an ITU-T Rec. G.652 Table D compliant fiber. The macrobending induced attenuation increases as the fiber MC number increases.Figure6
Fiber Parameters & Attributes Affecting MacrobendingForsingle-modefiberthemostcommonrefractiveindexprofilechangetocombatbendinglossesistoreducethemodefielddiameter.Figure4demonstratesthiseffect.Thedataonthebluecurvecomesfromasamplewithalowermodefielddiameterthanthesampleusedtocreatethedatarepresentedbythepinkcurve.Clearlythesamplewithlargermodefielddiameterismoresensitivetomacrobendinginducedattenuation.Increasingthecore-claddingrefractiveindexdifferenceandreducingthecorediameteraretwowaysofdesigningafiberwithasmallermodefielddiameter.
Fibercutoffwavelengthalsoaffectsmacrobendingperformance,andthetwoattributesarecommonlytakeninto�accountsimultaneouslyusinganempiricalparametercalledthe“MACnumber”.Itismerelytheratioofthemodefielddiameterandcutoffwavelengthincommonunits(e.g.,micrometers).
InFigure6therelationshipbetweenMACnumberandmacrobendinginducedattenuationisshown.Likebendradiusandattenuation,anexponentialincreaseinattenuationisobservedonceathresholdvalueisreached.Figure6presentsresultsforanITU-TRecommendationG.652compliant“stepindex”single-modefiber(“standardfiber”).TherelationshipshowninFigure6maynotapplytofiberswithotherrefractiveindexprofiledesigns.
-3.50
-3.00
-2.50
-2.00
-1.50
-1.00
-0.50
0.00
6.80 7.00 7.20 7.40 7.60 7.80 8.00 8.20
MAC number
Log Attenuation Increase (dB)
�
IndustrystandardscontainingmacrobendingspecificationsincludeIEC60793-2-50Product specifications – Sectional specification for class B singlemode fibres.Type1.3specifiestheattenuationincreaseat1625nmfor100turnsof30-mmradiustobelessthanorequalto0.1dB.ITU-TRecommendationG.652TableDliststhesamespecification.Thespecifieddiameterwasreducedfrom75mmto 60mmintheearly-1990storeflecttheuseofsmallersplicetrays.
Somecustomizedspecificationsfrominfluentialindustryplayersstillexistaswell.Forexample,TPR9430Verizon NEBS™ Compliance: Optical Fiber and Optical Fiber Cablespecifiestheattenuationat1550nmisnottoexceed0.50dBfor100turnsof75-mmdiameter(includingintrinsicattenuationofthetestoffiber)andnottoexceed0.50dBfor1turnof32-mmdiameter.
Practical Considerations of Macrobending TheBellcore75mmspecification�isanexcellentexampleofmappingapracticalusecasetotheproductspecification.Morerecently,asopticalfiberisinstalledclosertothesubscriber,itcanbeinstalledwithevensmallerbendradii.ITU-TRecommendationG.657Characteristics of a bending loss insensitive single mode optical fibre and cable for the access networkspecifiesseveralsmallerbendradiusdeploymentsandsetsfiberproductspecificationsforeachapplication.
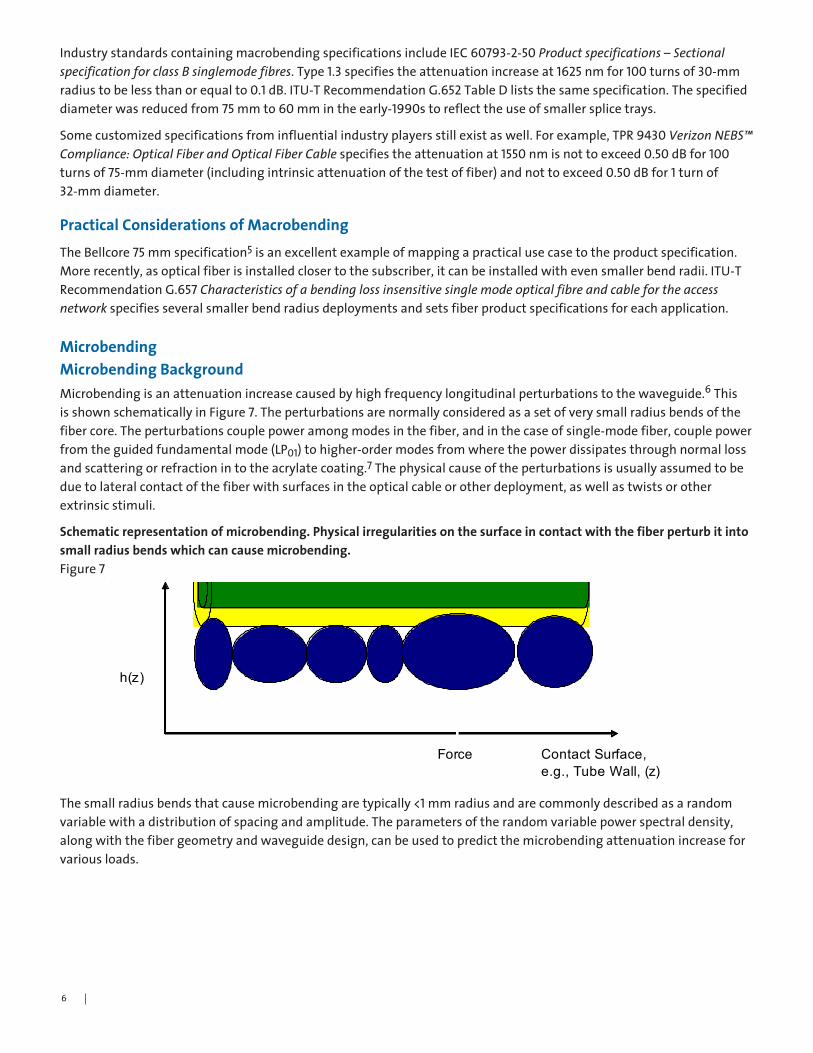
MicrobendingMicrobending BackgroundMicrobendingisanattenuationincreasecausedbyhighfrequencylongitudinalperturbationstothewaveguide.6ThisisshownschematicallyinFigure7.Theperturbationsarenormallyconsideredasasetofverysmallradiusbendsofthefibercore.Theperturbationscouplepoweramongmodesinthefiber,andinthecaseofsingle-modefiber,couplepowerfromtheguidedfundamentalmode(LP01)tohigher-ordermodesfromwherethepowerdissipatesthroughnormallossandscatteringorrefractionintotheacrylatecoating.7Thephysicalcauseoftheperturbationsisusuallyassumedtobeduetolateralcontactofthefiberwithsurfacesintheopticalcableorotherdeployment,aswellastwistsorotherextrinsicstimuli.
Thesmallradiusbendsthatcausemicrobendingaretypically<1mmradiusandarecommonlydescribedasarandomvariablewithadistributionofspacingandamplitude.Theparametersoftherandomvariablepowerspectraldensity,alongwiththefibergeometryandwaveguidedesign,canbeusedtopredictthemicrobendingattenuationincreaseforvariousloads.
Schematic representation of microbending. Physical irregularities on the surface in contact with the fiber perturb it into small radius bends which can cause microbending.Figure7
Force Contact Surface, e.g., Tube Wall, (z)
h(z)
6
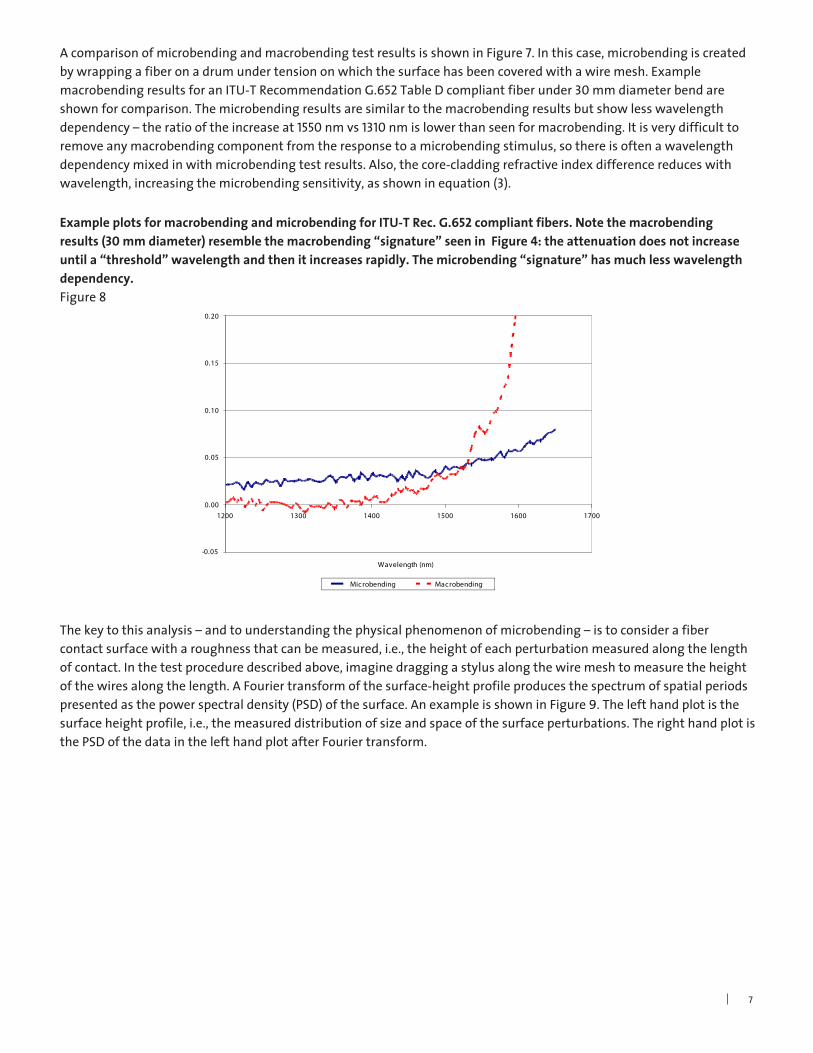
AcomparisonofmicrobendingandmacrobendingtestresultsisshowninFigure7.Inthiscase,microbendingiscreatedbywrappingafiberonadrumundertensiononwhichthesurfacehasbeencoveredwithawiremesh.ExamplemacrobendingresultsforanITU-TRecommendationG.652TableDcompliantfiberunder30mmdiameterbendareshownforcomparison.Themicrobendingresultsaresimilartothemacrobendingresultsbutshowlesswavelengthdependency–theratiooftheincreaseat1550nmvs1310nmislowerthanseenformacrobending.Itisverydifficulttoremoveanymacrobendingcomponentfromtheresponsetoamicrobendingstimulus,sothereisoftenawavelengthdependencymixedinwithmicrobendingtestresults.Also,thecore-claddingrefractiveindexdifferencereduceswithwavelength,increasingthemicrobendingsensitivity,asshowninequation(3).
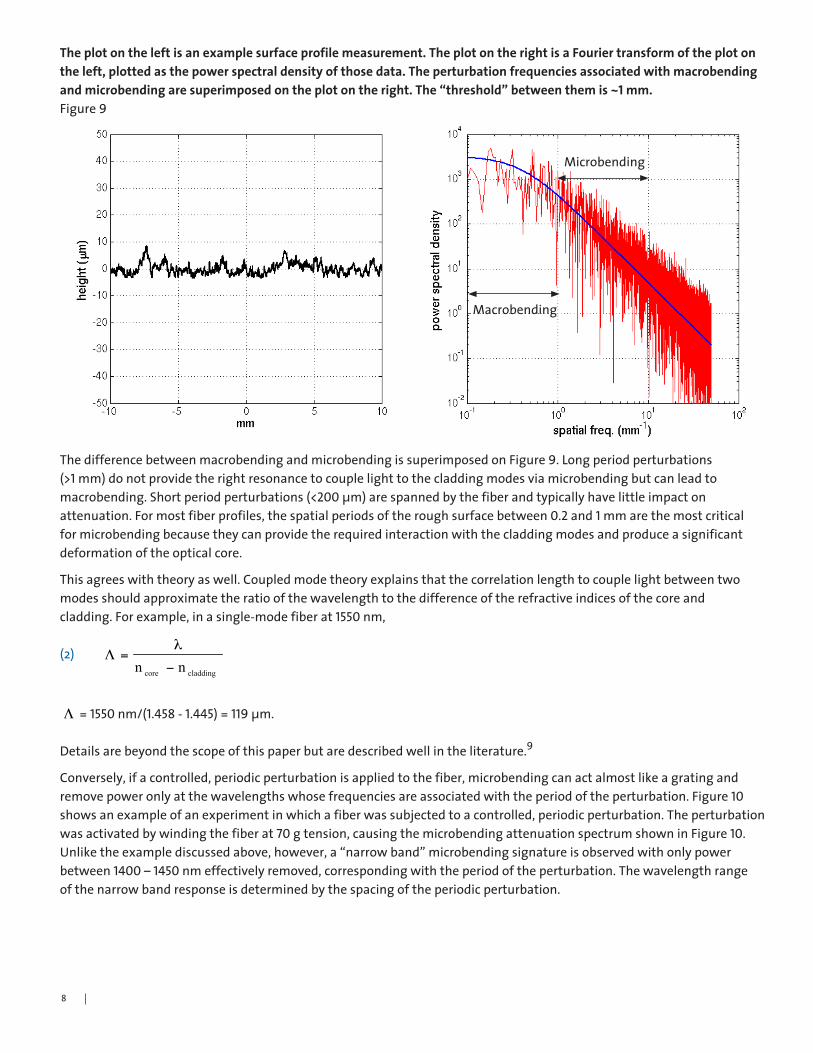
Thekeytothisanalysis–andtounderstandingthephysicalphenomenonofmicrobending–istoconsiderafibercontactsurfacewitharoughnessthatcanbemeasured,i.e.,theheightofeachperturbationmeasuredalongthelengthofcontact.Inthetestproceduredescribedabove,imaginedraggingastylusalongthewiremeshtomeasuretheheightofthewiresalongthelength.AFouriertransformofthesurface-heightprofileproducesthespectrumofspatialperiodspresentedasthepowerspectraldensity(PSD)ofthesurface.AnexampleisshowninFigure9.Thelefthandplotisthesurfaceheightprofile,i.e.,themeasureddistributionofsizeandspaceofthesurfaceperturbations.TherighthandplotisthePSDofthedatainthelefthandplotafterFouriertransform.
Example plots for macrobending and microbending for ITU-T Rec. G.652 compliant fibers. Note the macrobending results (30 mm diameter) resemble the macrobending “signature” seen in Figure 4: the attenuation does not increase until a “threshold” wavelength and then it increases rapidly. The microbending “signature” has much less wavelength dependency.Figure8
-0.05
0.00
0.05
0.10
0.15
0.20
1200 1300 1400 1500 1600 1700
Wavelength (nm)
Attenuation Change (dB/km)
Microbending Macrobending
7
claddingcore nn −
l=Λ =1550nm/(1.458-1.445)=119μm.
Detailsarebeyondthescopeofthispaperbutaredescribedwellintheliterature.9
Conversely,ifacontrolled,periodicperturbationisappliedtothefiber,microbendingcanactalmostlikeagratingandremovepoweronlyatthewavelengthswhosefrequenciesareassociatedwiththeperiodoftheperturbation.Figure10 showsanexampleofanexperimentinwhichafiberwassubjectedtoacontrolled,periodicperturbation.Theperturbationwasactivatedbywindingthefiberat70gtension,causingthemicrobendingattenuationspectrumshowninFigure 10.Unliketheexamplediscussedabove,however,a“narrowband”microbendingsignatureisobservedwithonlypowerbetween1400–1450nmeffectivelyremoved,correspondingwiththeperiodoftheperturbation.Thewavelengthrangeofthenarrowbandresponseisdeterminedbythespacingoftheperiodicperturbation.
ThedifferencebetweenmacrobendingandmicrobendingissuperimposedonFigure9.Longperiodperturbations(>1mm)donotprovidetherightresonancetocouplelighttothecladdingmodesviamicrobendingbutcanleadtomacrobending.Shortperiodperturbations(<200μm)arespannedbythefiberandtypicallyhavelittleimpactonattenuation.Formostfiberprofiles,thespatialperiodsoftheroughsurfacebetween0.2and1mmarethemostcriticalformicrobendingbecausetheycanprovidetherequiredinteractionwiththecladdingmodesandproduceasignificantdeformationoftheopticalcore.
Thisagreeswiththeoryaswell.Coupledmodetheoryexplainsthatthecorrelationlengthtocouplelightbetweentwomodesshouldapproximatetheratioofthewavelengthtothedifferenceoftherefractiveindicesofthecoreandcladding.Forexample,inasingle-modefiberat1550nm,
(2)
The plot on the left is an example surface profile measurement. The plot on the right is a Fourier transform of the plot on the left, plotted as the power spectral density of those data. The perturbation frequencies associated with macrobending and microbending are superimposed on the plot on the right. The “threshold” between them is ~1 mm.Figure9
claddingcore nn −
l=Λ
8
Microbending
Macrobending
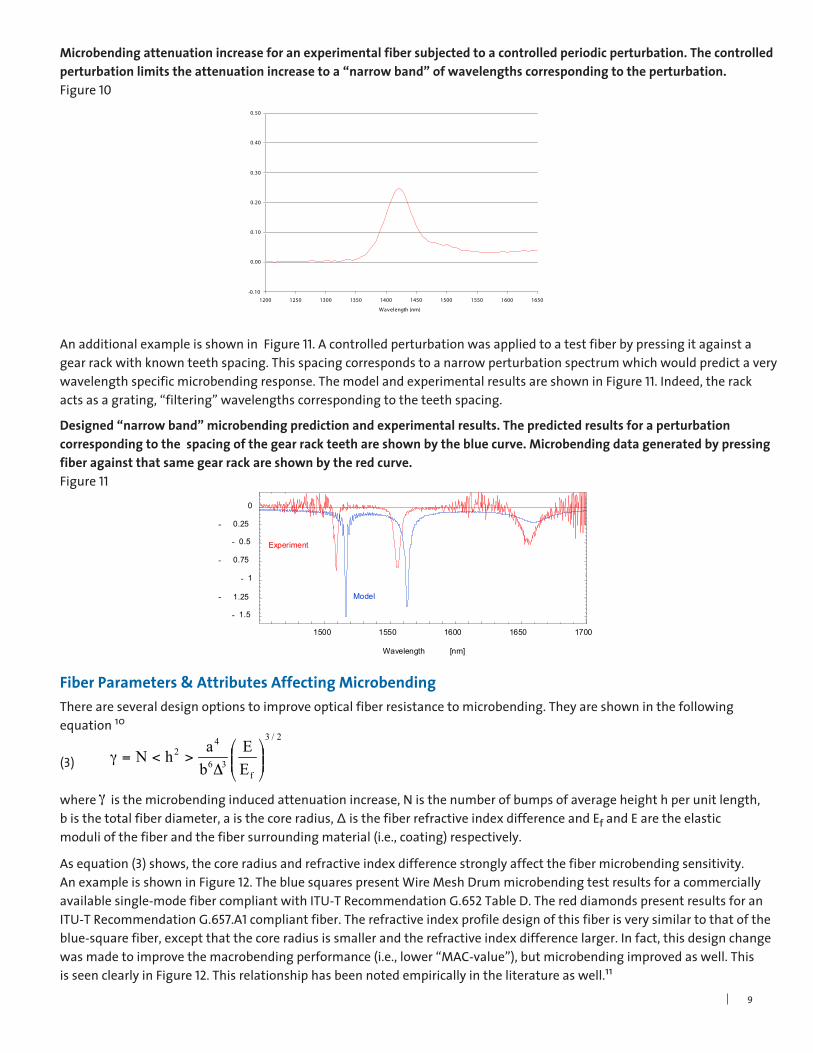
AnadditionalexampleisshowninFigure11.Acontrolledperturbationwasappliedtoatestfiberbypressingitagainstagearrackwithknownteethspacing.Thisspacingcorrespondstoanarrowperturbationspectrumwhichwouldpredictaverywavelengthspecificmicrobendingresponse.ThemodelandexperimentalresultsareshowninFigure11.Indeed,therackactsasagrating,“filtering”wavelengthscorrespondingtotheteethspacing.
Fiber Parameters & Attributes Affecting Microbending Thereareseveraldesignoptionstoimproveopticalfiberresistancetomicrobending.Theyareshowninthefollowingequation10
(3)
whereisthemicrobendinginducedattenuationincrease,Nisthenumberofbumpsofaverageheighthperunitlength,bisthetotalfiberdiameter,aisthecoreradius,ΔisthefiberrefractiveindexdifferenceandEfandEaretheelasticmoduliofthefiberandthefibersurroundingmaterial(i.e.,coating)respectively.
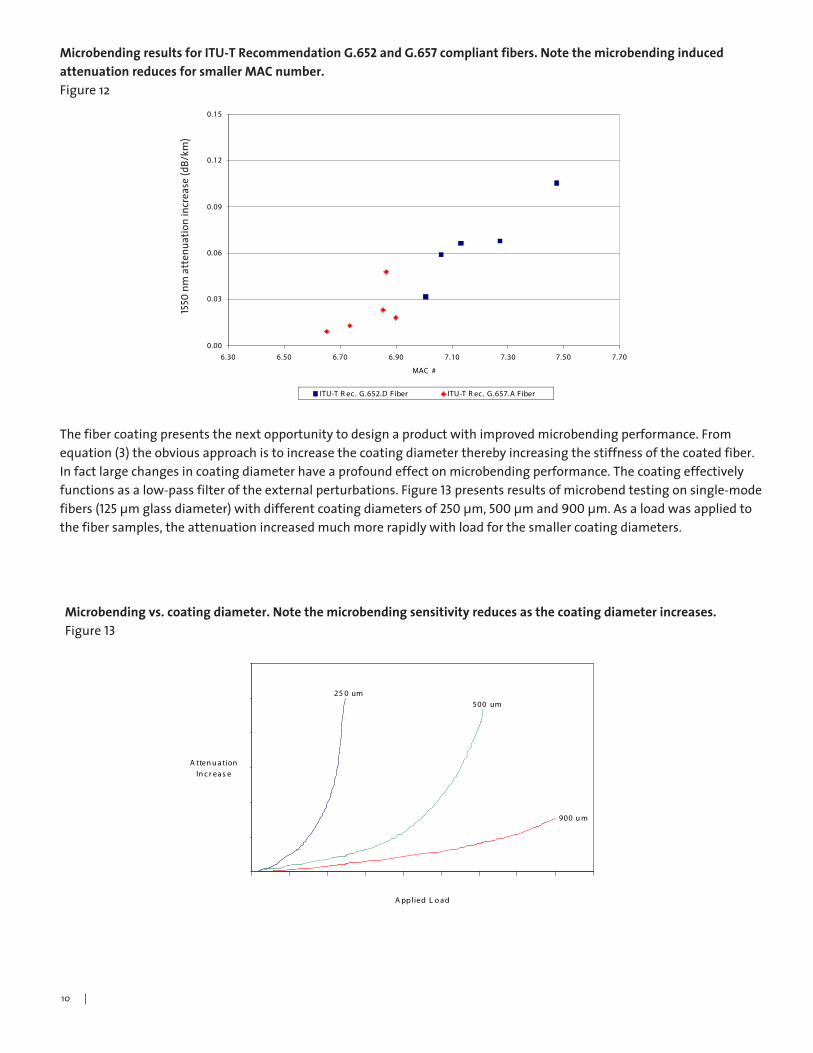
Asequation(3)shows,thecoreradiusandrefractiveindexdifferencestronglyaffectthefibermicrobendingsensitivity.AnexampleisshowninFigure12.ThebluesquarespresentWireMeshDrummicrobendingtestresultsforacommerciallyavailablesingle-modefibercompliantwithITU-TRecommendationG.652TableD.ThereddiamondspresentresultsforanITU-TRecommendationG.657.A1compliantfiber.Therefractiveindexprofiledesignofthisfiberisverysimilartothatoftheblue-squarefiber,exceptthatthecoreradiusissmallerandtherefractiveindexdifferencelarger.Infact,thisdesignchangewasmadetoimprovethemacrobendingperformance(i.e.,lower“MAC-value”),butmicrobendingimprovedaswell.ThisisseenclearlyinFigure12.Thisrelationshiphasbeennotedempiricallyintheliteratureaswell.11
Microbending attenuation increase for an experimental fiber subjected to a controlled periodic perturbation. The controlled perturbation limits the attenuation increase to a “narrow band” of wavelengths corresponding to the perturbation. Figure10
Designed “narrow band” microbending prediction and experimental results. The predicted results for a perturbation corresponding to the spacing of the gear rack teeth are shown by the blue curve. Microbending data generated by pressing fiber against that same gear rack are shown by the red curve.Figure11
-0.10
0.00
0.10
0.20
0.30
0.40
0.50
1200 1250 1300 1350 1400 1450 1500 1550 1600 1650
Wavelength (nm)
Attenuation Change (dB/km)
2/3
f36
42
E
E
b
ahN ⎟⎟
⎠
⎞⎜⎜⎝
⎛
Δ><=γ
9
2/3
f36
42
E
E
b
ahN ⎟⎟
⎠
⎞⎜⎜⎝
⎛
Δ><=γ
1500 1550 1600 1650 1700
- 1.5
- 1.25
- 1
- 0.75
- 0.5
- 0.25
0
noissimsnarT
B][d
Wavelength [nm]
Experiment
Model
Microbending vs. coating diameter. Note the microbending sensitivity reduces as the coating diameter increases.Figure 13
Microbending results for ITU-T Recommendation G.652 and G.657 compliant fibers. Note the microbending induced attenuation reduces for smaller MAC number.Figure12
Thefibercoatingpresentsthenextopportunitytodesignaproductwithimprovedmicrobendingperformance.Fromequation(3)theobviousapproachistoincreasethecoatingdiametertherebyincreasingthestiffnessofthecoatedfiber.Infactlargechangesincoatingdiameterhaveaprofoundeffectonmicrobendingperformance.Thecoatingeffectivelyfunctionsasalow-passfilteroftheexternalperturbations.Figure13presentsresultsofmicrobendtestingonsingle-modefibers(125μmglassdiameter)withdifferentcoatingdiametersof250μm,500μmand900μm.Asaloadwasappliedtothefibersamples,theattenuationincreasedmuchmorerapidlywithloadforthesmallercoatingdiameters.
10
Mic r oben din g fo r V a rio us F iber Dia meters
0
2
4
6
8
10
12
0 2 4 6 8 1 0 1 2 14 16 18
A pp lied L o a d
A tten u a tion In c r ea s e
25 0 um500 um
900 u m
0.00
0.03
0.06
0.09
0.12
0.15
6.30 6.50 6.70 6.90 7.10 7.30 7.50 7.70
MAC #
1550 nm attenuation increase (dB/km)
ITU-T R ec. G.652.D Fiber ITU-T R ec. G.657.A Fiber
1550nmattenuationincrease(dB/km)
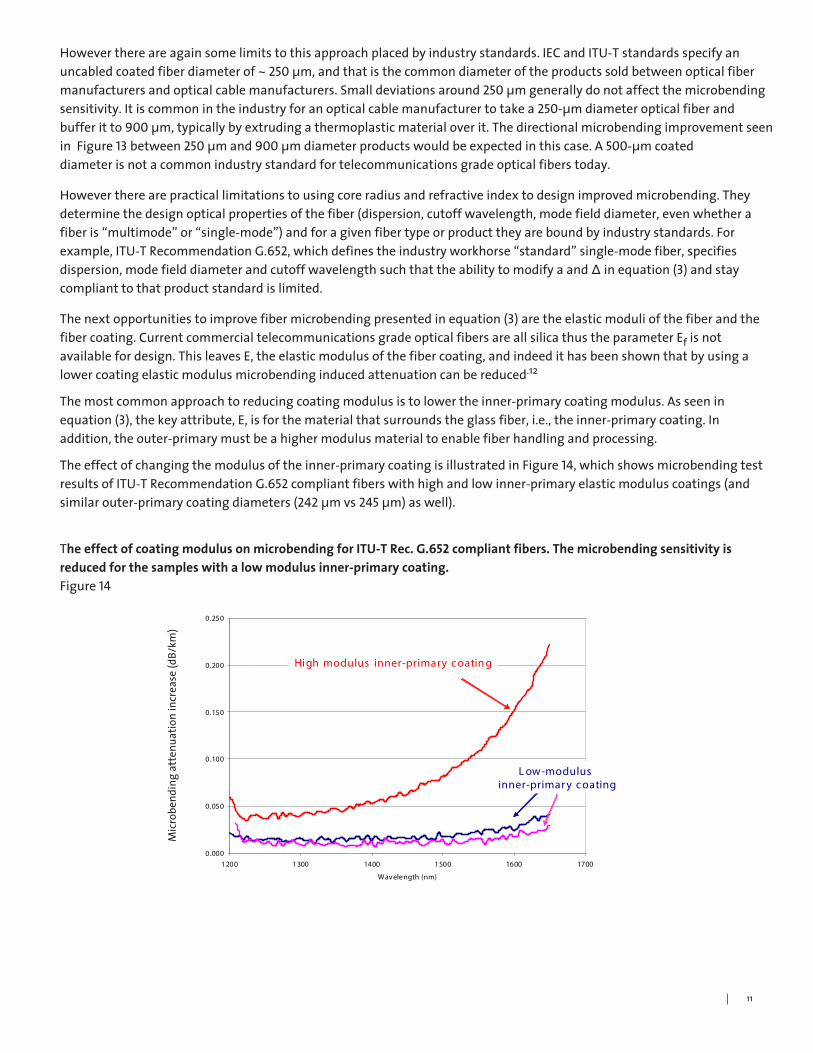
Howeverthereareagainsomelimitstothisapproachplacedbyindustrystandards.IECandITU-Tstandardsspecifyanuncabledcoatedfiberdiameterof~250μm,andthatisthecommondiameteroftheproductssoldbetweenopticalfibermanufacturersandopticalcablemanufacturers.Smalldeviationsaround250μmgenerallydonotaffectthemicrobendingsensitivity.Itiscommonintheindustryforanopticalcablemanufacturertotakea250-μmdiameteropticalfiberandbufferitto900μm,typicallybyextrudingathermoplasticmaterialoverit.ThedirectionalmicrobendingimprovementseeninFigure13between250μmand900μmdiameterproductswouldbeexpectedinthiscase.A500-μmcoateddiameterisnotacommonindustrystandardfortelecommunicationsgradeopticalfiberstoday.
Howevertherearepracticallimitationstousingcoreradiusandrefractiveindextodesignimprovedmicrobending.Theydeterminethedesignopticalpropertiesofthefiber(dispersion,cutoffwavelength,modefielddiameter,evenwhetherafiberis“multimode”or“single-mode”)andforagivenfibertypeorproducttheyareboundbyindustrystandards.Forexample,ITU-TRecommendationG.652,whichdefinestheindustryworkhorse“standard”single-modefiber,specifiesdispersion,modefielddiameterandcutoffwavelengthsuchthattheabilitytomodifyaandΔinequation(3)andstaycomplianttothatproductstandardislimited.
Thenextopportunitiestoimprovefibermicrobendingpresentedinequation(3)aretheelasticmoduliofthefiberandthefibercoating.CurrentcommercialtelecommunicationsgradeopticalfibersareallsilicathustheparameterEfisnotavailablefordesign.ThisleavesE,theelasticmodulusofthefibercoating,andindeedithasbeenshownthatbyusingalowercoatingelasticmodulusmicrobendinginducedattenuationcanbereduced.12
Themostcommonapproachtoreducingcoatingmodulusistolowertheinner-primarycoatingmodulus.Asseeninequation(3),thekeyattribute,E,isforthematerialthatsurroundstheglassfiber,i.e.,theinner-primarycoating.Inaddition,theouter-primarymustbeahighermodulusmaterialtoenablefiberhandlingandprocessing.
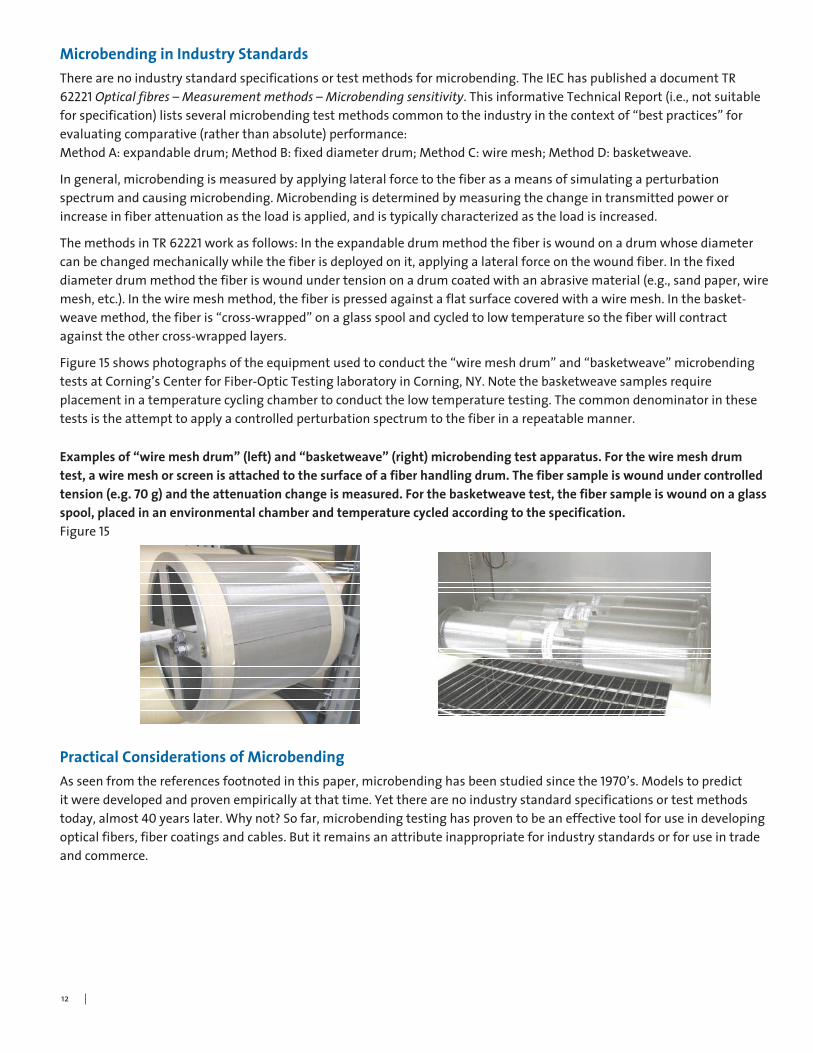
Theeffectofchangingthemodulusoftheinner-primarycoatingisillustratedinFigure14,whichshowsmicrobendingtestresultsofITU-TRecommendationG.652compliantfiberswithhighandlowinner-primaryelasticmoduluscoatings(andsimilarouter-primarycoatingdiameters(242μmvs245μm)aswell).
The effect of coating modulus on microbending for ITU-T Rec. G.652 compliant fibers. The microbending sensitivity is reduced for the samples with a low modulus inner-primary coating.Figure14
0.000
0.050
0.100
0.150
0.200
0.250
1200 1300 1400 1500 1600 1700
Wavelength (nm)
Microbending attenuation increase (dB/km)
High modulus inner-primary c oatin g
L ow-modulus inner-primar y c oating
11
Microbendingattenuationincrease(dB/km)
Microbending in Industry StandardsTherearenoindustrystandardspecificationsortestmethodsformicrobending.TheIEChaspublishedadocumentTR62221Optical fibres – Measurement methods – Microbending sensitivity.ThisinformativeTechnicalReport(i.e.,notsuitableforspecification)listsseveralmicrobendingtestmethodscommontotheindustryinthecontextof“bestpractices”forevaluatingcomparative(ratherthanabsolute)performance:MethodA:expandabledrum;MethodB:fixeddiameterdrum;MethodC:wiremesh;MethodD:basketweave.
Ingeneral,microbendingismeasuredbyapplyinglateralforcetothefiberasameansofsimulatingaperturbationspectrumandcausingmicrobending.Microbendingisdeterminedbymeasuringthechangeintransmittedpowerorincreaseinfiberattenuationastheloadisapplied,andistypicallycharacterizedastheloadisincreased.
ThemethodsinTR62221workasfollows:Intheexpandabledrummethodthefiberiswoundonadrumwhosediametercanbechangedmechanicallywhilethefiberisdeployedonit,applyingalateralforceonthewoundfiber.Inthefixeddiameterdrummethodthefiberiswoundundertensiononadrumcoatedwithanabrasivematerial(e.g.,sandpaper,wiremesh,etc.).Inthewiremeshmethod,thefiberispressedagainstaflatsurfacecoveredwithawiremesh.Inthebasket-weavemethod,thefiberis“cross-wrapped”onaglassspoolandcycledtolowtemperaturesothefiberwillcontractagainsttheothercross-wrappedlayers.
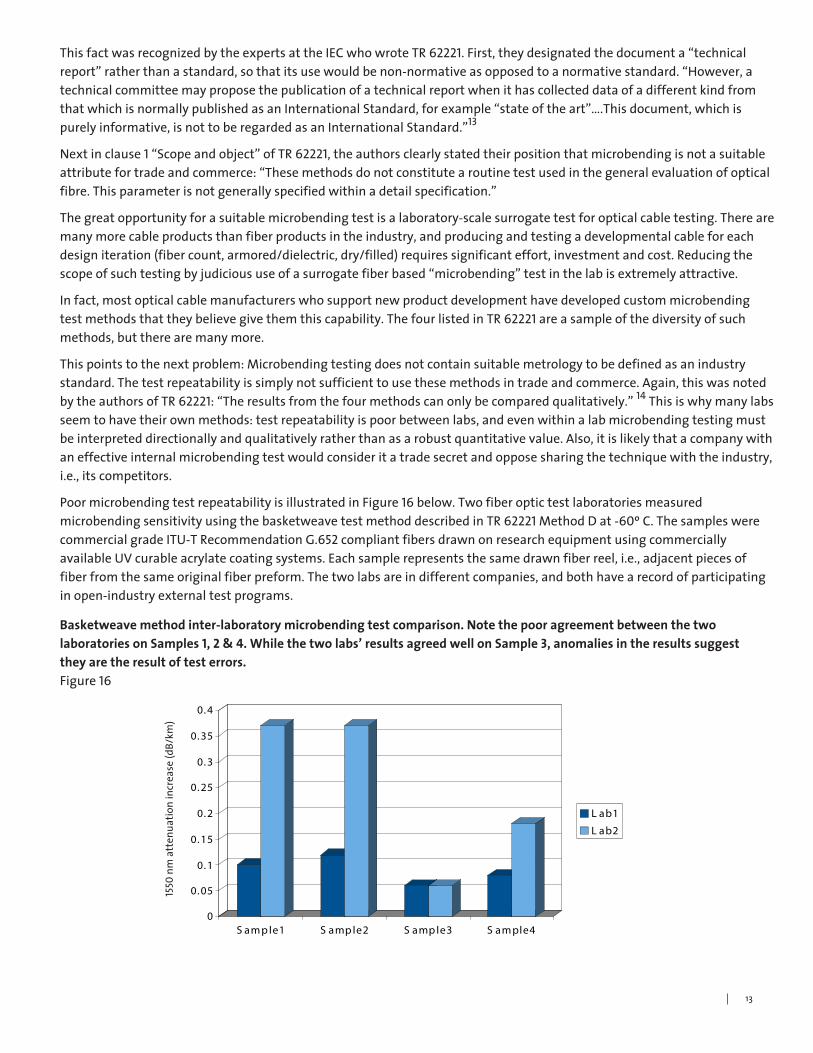
Figure15showsphotographsoftheequipmentusedtoconductthe“wiremeshdrum”and“basketweave”microbendingtestsatCorning’sCenterforFiber-OpticTestinglaboratoryinCorning,NY.Notethebasketweavesamplesrequireplacementinatemperaturecyclingchambertoconductthelowtemperaturetesting.Thecommondenominatorinthesetestsistheattempttoapplyacontrolledperturbationspectrumtothefiberinarepeatablemanner.
Practical Considerations of MicrobendingAsseenfromthereferencesfootnotedinthispaper,microbendinghasbeenstudiedsincethe 1970’s.Modelstopredictitweredevelopedandprovenempiricallyatthattime.Yettherearenoindustrystandardspecificationsortestmethodstoday,almost40yearslater.Whynot?Sofar,microbendingtestinghasproventobeaneffectivetoolforuseindevelopingopticalfibers,fibercoatingsandcables.Butitremainsanattributeinappropriateforindustrystandardsorforuseintradeandcommerce.
Examples of “wire mesh drum” (left) and “basketweave” (right) microbending test apparatus. For the wire mesh drum test, a wire mesh or screen is attached to the surface of a fiber handling drum. The fiber sample is wound under controlled tension (e.g. 70 g) and the attenuation change is measured. For the basketweave test, the fiber sample is wound on a glass spool, placed in an environmental chamber and temperature cycled according to the specification.Figure 15
12
ThisfactwasrecognizedbytheexpertsattheIECwhowroteTR62221.First,theydesignatedthedocumenta“technicalreport”ratherthanastandard,sothatitsusewouldbenon-normativeasopposedtoanormativestandard.“However,atechnicalcommitteemayproposethepublicationofatechnicalreportwhenithascollecteddataofadifferentkindfromthatwhichisnormallypublishedasanInternationalStandard,forexample“stateoftheart”….Thisdocument,whichispurelyinformative,isnottoberegardedasanInternationalStandard.”13
Nextinclause1“Scopeandobject”ofTR62221,theauthorsclearlystatedtheirpositionthatmicrobendingisnotasuitableattributefortradeandcommerce:“Thesemethodsdonotconstitutearoutinetestusedinthegeneralevaluationofopticalfibre.Thisparameterisnotgenerallyspecifiedwithinadetailspecification.”
Thegreatopportunityforasuitablemicrobendingtestisalaboratory-scalesurrogatetestforopticalcabletesting.Therearemanymorecableproductsthanfiberproductsintheindustry,andproducingandtestingadevelopmentalcableforeachdesigniteration(fibercount,armored/dielectric,dry/filled)requiressignificanteffort,investmentandcost.Reducingthescopeofsuchtestingbyjudicioususeofasurrogatefiberbased“microbending”testinthelabisextremelyattractive.
Infact,mostopticalcablemanufacturerswhosupportnewproductdevelopmenthavedevelopedcustommicrobendingtestmethodsthattheybelievegivethemthiscapability.ThefourlistedinTR62221areasampleofthediversityofsuchmethods,buttherearemanymore.
Thispointstothenextproblem:Microbendingtestingdoesnotcontainsuitablemetrologytobedefinedasanindustrystandard.Thetestrepeatabilityissimplynotsufficienttousethesemethodsintradeandcommerce.Again,thiswasnotedbytheauthorsofTR62221:“Theresultsfromthefourmethodscanonlybecomparedqualitatively.”14Thisiswhymanylabsseemtohavetheirownmethods:testrepeatabilityispoorbetweenlabs,andevenwithinalabmicrobendingtestingmustbeinterpreteddirectionallyandqualitativelyratherthanasarobustquantitativevalue.Also,itislikelythatacompanywithaneffectiveinternalmicrobendingtestwouldconsideritatradesecretandopposesharingthetechniquewiththeindustry,i.e.,itscompetitors.
PoormicrobendingtestrepeatabilityisillustratedinFigure16below.TwofiberoptictestlaboratoriesmeasuredmicrobendingsensitivityusingthebasketweavetestmethoddescribedinTR62221MethodDat-60ºC.ThesampleswerecommercialgradeITU-TRecommendationG.652compliantfibersdrawnonresearchequipmentusingcommerciallyavailableUVcurableacrylatecoatingsystems.Eachsamplerepresentsthesamedrawnfiberreel,i.e.,adjacentpiecesoffiberfromthesameoriginalfiberpreform.Thetwolabsareindifferentcompanies,andbothhavearecordofparticipatinginopen-industryexternaltestprograms.
Basketweave method inter-laboratory microbending test comparison. Note the poor agreement between the two laboratories on Samples 1, 2 & 4. While the two labs’ results agreed well on Sample 3, anomalies in the results suggest they are the result of test errors.Figure16
0
0. 05
0. 1
0. 15
0. 2
0. 25
0. 3
0. 35
0. 4
S am p le1 S amp le2 S amp le3 S am ple4
L ab1
L ab2
1550 nm attenuation increase (dB/km)
1�
1550nmattenuationincrease(dB/km)
Notethepooragreementbetweenthetwolabs.ResultsfromLab2canbe3XthemagnitudeoftheresultsfromLab1onthesamefiber.InthecaseofSample3,whileagreementlookedgoodbetweenthelabs,additionalresultscastdoubtontheLab2data:Anomalously,Lab2measureda1625nmattenuationincreasemuchlowerthanthe1550nmincreaseshowninFigure16,whichiscounterintuitiveanddisagreeswiththephysicsofthetest.
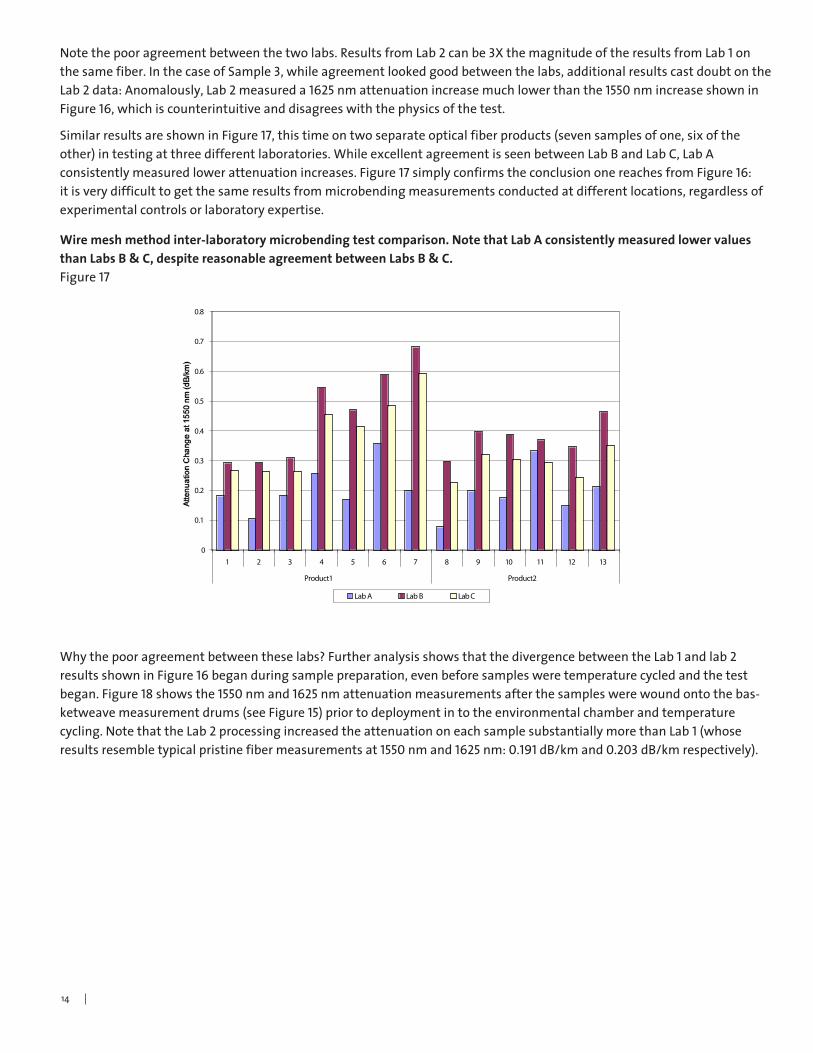
SimilarresultsareshowninFigure17,thistimeontwoseparateopticalfiberproducts(sevensamplesofone,sixoftheother)intestingatthreedifferentlaboratories.WhileexcellentagreementisseenbetweenLabBandLabC,LabAconsistentlymeasuredlowerattenuationincreases.Figure17simplyconfirmstheconclusiononereachesfromFigure16:itisverydifficulttogetthesameresultsfrommicrobendingmeasurementsconductedatdifferentlocations,regardlessofexperimentalcontrolsorlaboratoryexpertise.
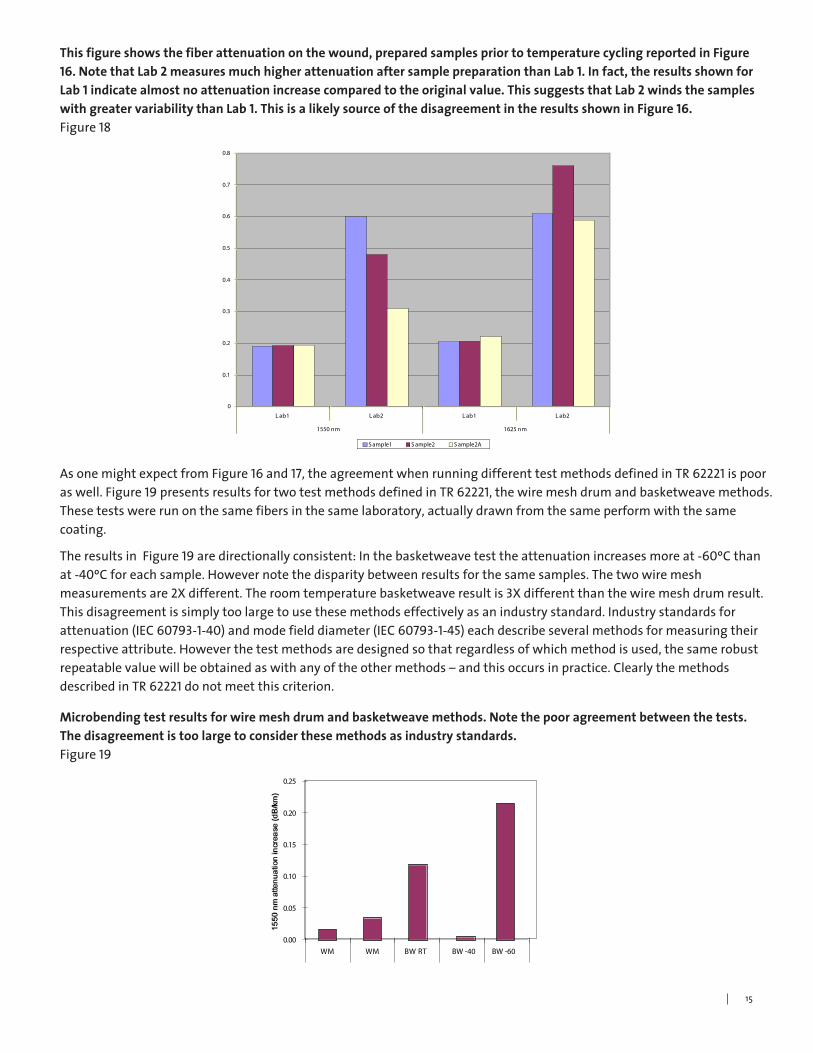
Whythepooragreementbetweentheselabs?FurtheranalysisshowsthatthedivergencebetweentheLab1andlab2resultsshowninFigure16beganduringsamplepreparation,evenbeforesamplesweretemperaturecycledandthetestbegan.Figure18showsthe1550nmand1625nmattenuationmeasurementsafterthesampleswerewoundontothebas-ketweavemeasurementdrums(seeFigure15)priortodeploymentintotheenvironmentalchamberandtemperaturecycling.NotethattheLab2processingincreasedtheattenuationoneachsamplesubstantiallymorethanLab1(whoseresultsresembletypicalpristinefibermeasurementsat1550nmand1625nm:0.191dB/kmand0.203dB/kmrespectively).
Wire mesh method inter-laboratory microbending test comparison. Note that Lab A consistently measured lower values than Labs B & C, despite reasonable agreement between Labs B & C.Figure17
14
0
0.1
0.2
0.3
0.4
0.5
0.6
0.7
0.8
1 2 3 4 5 6 7 8 9 10 11 12 13
Product1 Product2
Attenuation Change at 1550 nm (dB/km)
Lab A Lab B Lab C
Microbending test results for wire mesh drum and basketweave methods. Note the poor agreement between the tests. The disagreement is too large to consider these methods as industry standards.Figure19
This figure shows the fiber attenuation on the wound, prepared samples prior to temperature cycling reported in Figure 16. Note that Lab 2 measures much higher attenuation after sample preparation than Lab 1. In fact, the results shown for Lab 1 indicate almost no attenuation increase compared to the original value. This suggests that Lab 2 winds the samples with greater variability than Lab 1. This is a likely source of the disagreement in the results shown in Figure 16. Figure18
0
0.1
0.2
0.3
0.4
0.5
0.6
0.7
0.8
L ab1 L ab2 L ab1 L ab2
1550 nm 1625 nm
S ample1 S ample2 S ample2A
AsonemightexpectfromFigure16and17,theagreementwhenrunningdifferenttestmethodsdefinedinTR62221ispooraswell.Figure19presentsresultsfortwotestmethodsdefinedinTR62221,thewiremeshdrumandbasketweavemethods.Thesetestswererunonthesamefibersinthesamelaboratory,actuallydrawnfromthesameperformwiththesamecoating.
TheresultsinFigure19aredirectionallyconsistent:Inthebasketweavetesttheattenuationincreasesmoreat-60ºCthanat-40ºCforeachsample.Howevernotethedisparitybetweenresultsforthesamesamples.Thetwowiremeshmeasurementsare2Xdifferent.Theroomtemperaturebasketweaveresultis3Xdifferentthanthewiremeshdrumresult.Thisdisagreementissimplytoolargetousethesemethodseffectivelyasanindustrystandard.Industrystandardsforattenuation(IEC60793-1-40)andmodefielddiameter(IEC60793-1-45)eachdescribeseveralmethodsformeasuringtheirrespectiveattribute.Howeverthetestmethodsaredesignedsothatregardlessofwhichmethodisused,thesamerobustrepeatablevaluewillbeobtainedaswithanyoftheothermethods–andthisoccursinpractice.ClearlythemethodsdescribedinTR62221donotmeetthiscriterion.
1�
0.00
0.05
0.10
0.15
0.20
0.25
WM WM BW RT BW -40 BW -60
1550 nm attenuation increase (dB/km)
0
0.05
0.1
0.15
0.2
0.25
A B C
1550 nm attenuation increase
Theseresultshighlightthedilemmafacedfordevelopingmicrobendingtestmethods:thecompromisebetweenmetrologyandapplicability.Thefactthatmanycompaniesusetheirown“homegrown”microbendingtestsqualitativelyisevidenceofthepoorlab-to-labrepeatabilityofthesetests–iftherewasasuitablestandard,theywoulduseit.Ontheotherhand,themethodsdescribedinTR62221areresultsofeffortstoimprovethemetrologyofmicrobendingtesting,improvingrepeatabilityoftheresults,engineeringeffortstostandardizedeploymentconditions,theperturbationspectra,theforceapplication,etc.Asthemetrologyimprovesonthesecommonmethods,theyseemtodivergefromprovidingpracticalresultscorrelatingtoactualcableproductsanduse.
Insummary,microbendingiseffectiveasasurrogatetesttopredictfiberperformanceincable–butitbecomesunnecessaryoncethecableisspecified,madeandtested.Thereforemicrobendingtestinghasnobenefitintheopenmarket.Specifyingandtestingthefinishedproductsboughtbyendusersisthesurestmethodtoensurecompliancewithspecifiedproductperformanceandreliability.
The Role of Coating to Reduce MicrobendingThecoatingisofcourseanimportantcomponentoftheopticalfiber.Poordesign,chemistry,orapplicationcandegradeperformanceandreliability.Howevercoatingisonlyoneofseveralcontributorstotheperformanceandreliabilityoftheopticalfiberproduct.Itworkstogetherwiththeglassfiberandthecabledesigntodeliveracompletefinishedproductwiththeperformanceandreliabilityexpectedbythemarket.Theinteractionsbetweenthecoatingandglassarecomplex;managingthosetogetherasatechnologytoproduceahighqualityproductconsistentlytakesyearsofexperienceintheindustry.
Asshowninequation(3),thecoatingcanbeakeydesignvariabletoreduceopticalfibermicrobendsensitivity.(NoteaccordingtoFigure3andtheaccompanyingtheory,thefibercoatingdoesnotaffectmacrobending).Butspecifyingthecoatingaloneisnotsufficienttoensureperformanceandreliabilityoftheentireopticalfiberproduct.
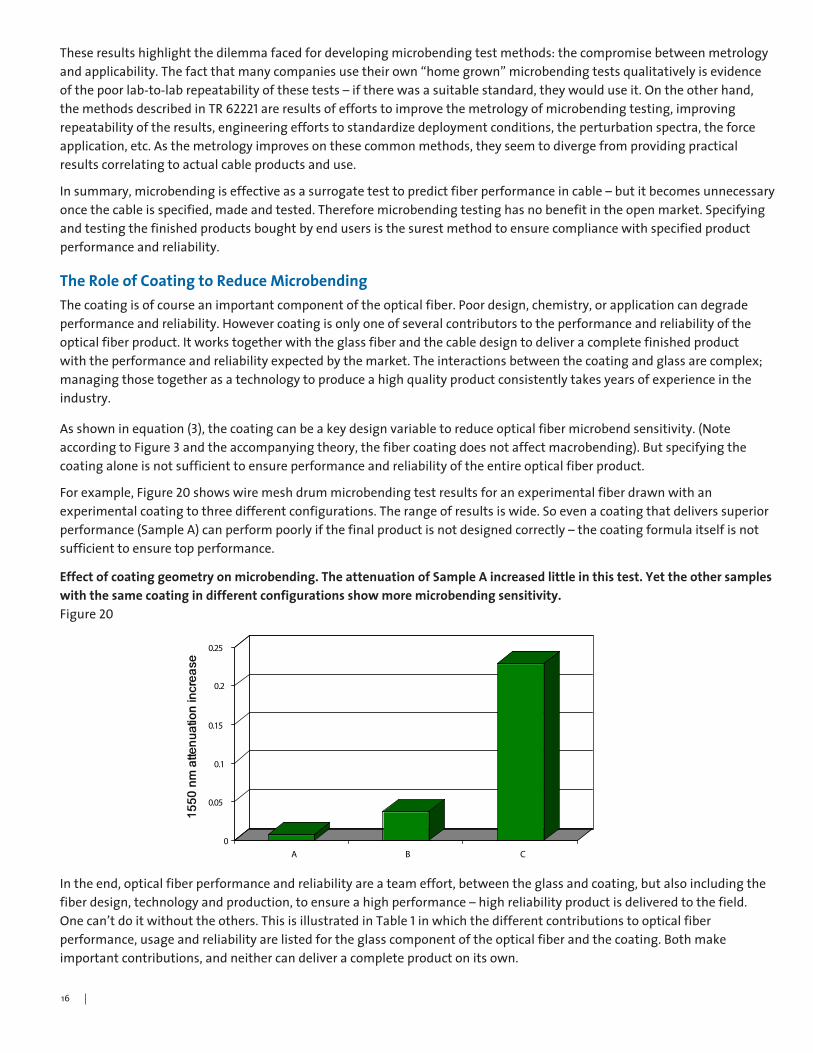
Forexample,Figure20showswiremeshdrummicrobendingtestresultsforanexperimentalfiberdrawnwithanexperimentalcoatingtothreedifferentconfigurations.Therangeofresultsiswide.Soevenacoatingthatdeliverssuperiorperformance(SampleA)canperformpoorlyifthefinalproductisnotdesignedcorrectly–thecoatingformulaitselfisnotsufficienttoensuretopperformance.
Intheend,opticalfiberperformanceandreliabilityareateameffort,betweentheglassandcoating,butalsoincludingthefiberdesign,technologyandproduction,toensureahighperformance–highreliabilityproductisdeliveredtothefield.Onecan’tdoitwithouttheothers.ThisisillustratedinTable1inwhichthedifferentcontributionstoopticalfiberperformance,usageandreliabilityarelistedfortheglasscomponentoftheopticalfiberandthecoating.Bothmakeimportantcontributions,andneithercandeliveracompleteproductonitsown.
Effect of coating geometry on microbending. The attenuation of Sample A increased little in this test. Yet the other samples with the same coating in different configurations show more microbending sensitivity.Figure20
16

Table 1 - The roles of glass and coating in an optical fiber
Glass CoatingDetermines the optical properties Determines the coating properties-Attenuation -Diameter-Macrobendingµbending -Concentricity-Bandwidth/Dispersion -Stripforce-Cutoffwavelength Determines some environmental performance-ModeFieldDiameter -Temperaturestability-PMD -HumiditystabilityDetermines the geometric properties -Waterstability-Diameter Visual/perception features-Circularity -Clarity/translucence-Core-CladdingConcentricity -YellowingDetermines the mechanical properties -Internaldefects-Strength -Adhesiontotheglass-Fatigue Application featuresDetermines some environmental performance -Fiberprotection-Hydrogenagingresistance -Cablingability-Hightemperatureaging -MicrobendingresistanceApplication features -Coloring&identification-Transmissioncapability -Environmentalstability-Spliceloss -Handleability-Connectorloss -Strippingandterminationexperience
Furthermore,well-engineeredcabledesignscanoftenbeusedwithmoremicrobendsensitivecoatingstoprovideequivalentperformancetobettercoatingwithpoorercabledesigns.
Compare & Contrast Macrobending & MicrobendingSowhat’sthedifferencebetweenmacrobendingandmicrobending?Asnotedabovetheyaredifferent–buttheyarealsothesame!Rememberthatthesetofperturbationsthatcausemicrobendingcanbeconsideredasaspectrum.Thelowfrequency/highamplitudeportionofthespectrumproducesamacrobendingtyperesponse.Thehighfrequency/lowamplitudeportionproducesthemicrobendingresponse.
ThedifferencebetweenmacrobendingandmicrobendingcanbeseenintheresultsshowninFigure21.Theseresultsareforrackgeartestingwithtwogearsof665μmand4mmperiods.The665μmperiodgearproducesthenarrowbandmicrobendingresponsesimilartotheoneseeninFigure11,withtheaffectedwavelengthsassociatedwiththe665μmteethspacingontherackgear.Howeverforthe4mmperiodrack,theresponseismuchdifferent.TheresultsshowthemacrobendingsignatureofFigure4andFigure8withlossincreasingexponentiallywithwavelength.Notethat4mmapproachesthe5mmradiuslistedinindustrystandardmacrobendingspecificationITU-TRecommendationG.657.
17
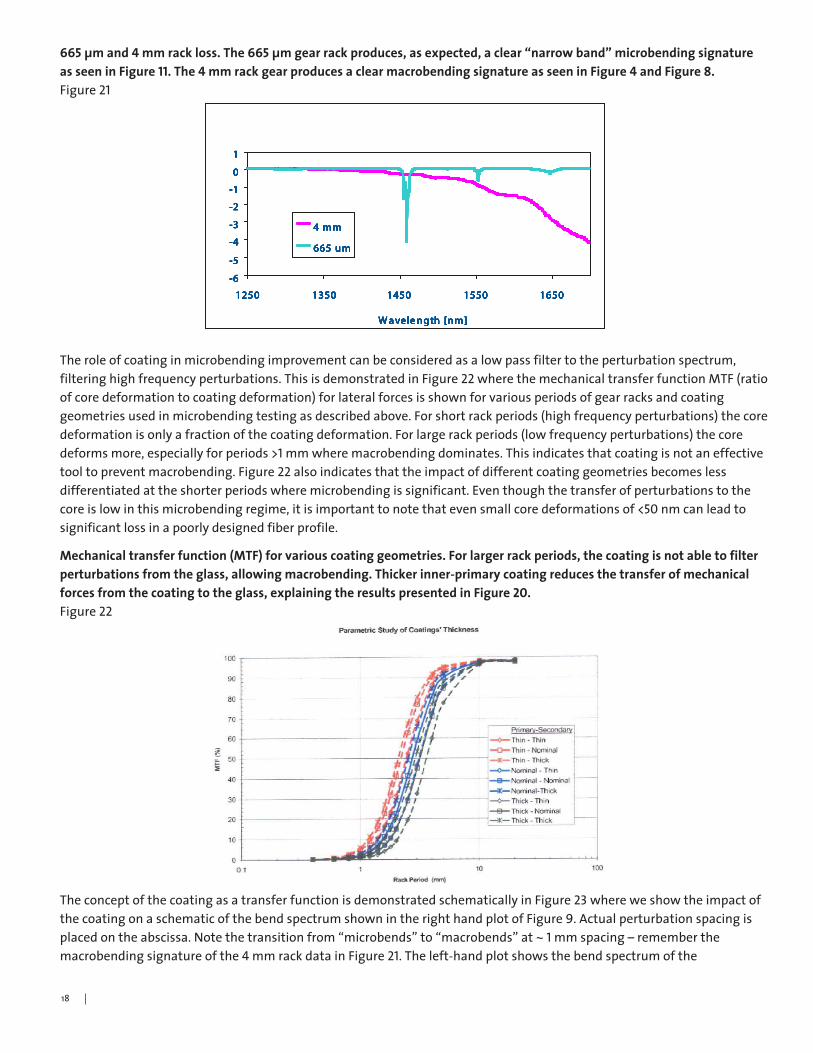
Theroleofcoatinginmicrobendingimprovementcanbeconsideredasalowpassfiltertotheperturbationspectrum,filteringhighfrequencyperturbations.ThisisdemonstratedinFigure22wherethemechanicaltransferfunctionMTF(ratioofcoredeformationtocoatingdeformation)forlateralforcesisshownforvariousperiodsofgearracksandcoatinggeometriesusedinmicrobendingtestingasdescribedabove.Forshortrackperiods(highfrequencyperturbations)thecoredeformationisonlyafractionofthecoatingdeformation.Forlargerackperiods(lowfrequencyperturbations)thecoredeformsmore,especiallyforperiods>1mmwheremacrobendingdominates.Thisindicatesthatcoatingisnotaneffectivetooltopreventmacrobending.Figure22alsoindicatesthattheimpactofdifferentcoatinggeometriesbecomeslessdifferentiatedattheshorterperiodswheremicrobendingissignificant.Eventhoughthetransferofperturbationstothecoreislowinthismicrobendingregime,itisimportanttonotethatevensmallcoredeformationsof<50nmcanleadtosignificantlossinapoorlydesignedfiberprofile.
TheconceptofthecoatingasatransferfunctionisdemonstratedschematicallyinFigure23 whereweshowtheimpactofthecoatingonaschematicofthebendspectrumshownintherighthandplotofFigure9.Actualperturbationspacingisplacedontheabscissa.Notethetransitionfrom“microbends”to“macrobends”at~ 1mmspacing–rememberthemacrobendingsignatureofthe4 mmrackdatainFigure21.Theleft-handplotshowsthebendspectrumofthe
665 μm and 4 mm rack loss. The 665 μm gear rack produces, as expected, a clear “narrow band” microbending signature as seen in Figure 11. The 4 mm rack gear produces a clear macrobending signature as seen in Figure 4 and Figure 8. Figure21
Mechanical transfer function (MTF) for various coating geometries. For larger rack periods, the coating is not able to filter perturbations from the glass, allowing macrobending. Thicker inner-primary coating reduces the transfer of mechanical forces from the coating to the glass, explaining the results presented in Figure 20. Figure22
-6
-5
-4
-3
-2
-1
0
1
1250 1350 1450 1550 1650
W avele ngth [nm]
Transmission [dB]4 mm
665 um
-6
-5
-4
-3
-2
-1
0
1
1250 1350 1450 1550 1650
W avele ngth [nm]
Transmission [dB]4 mm
665 um
-6
-5
-4
-3
-2
-1
0
1
1250 1350 1450 1550 1650
W avele ngth [nm]
Transmission [dB]4 mm
665 um
-6
-5
-4
-3
-2
-1
0
1
1250 1350 1450 1550 1650
W avele ngth [nm]
Transmission [dB]4 mm
665 um
-6
-5
-4
-3
-2
-1
0
1
1250 1350 1450 1550 1650
W avele ngth [nm]
Transmission [dB]4 mm
665 um
-6
-5
-4
-3
-2
-1
0
1
1250 1350 1450 1550 1650
W avele ngth [nm]
Transmission [dB]4 mm
665 um
-6
-5
-4
-3
-2
-1
0
1
1250 1350 1450 1550 1650
W avele ngth [nm]
Transmission [dB]4 mm
665 um
-6
-5
-4
-3
-2
-1
0
1
1250 1350 1450 1550 1650
W avele ngth [nm]
Transmission [dB]4 mm
665 um
18
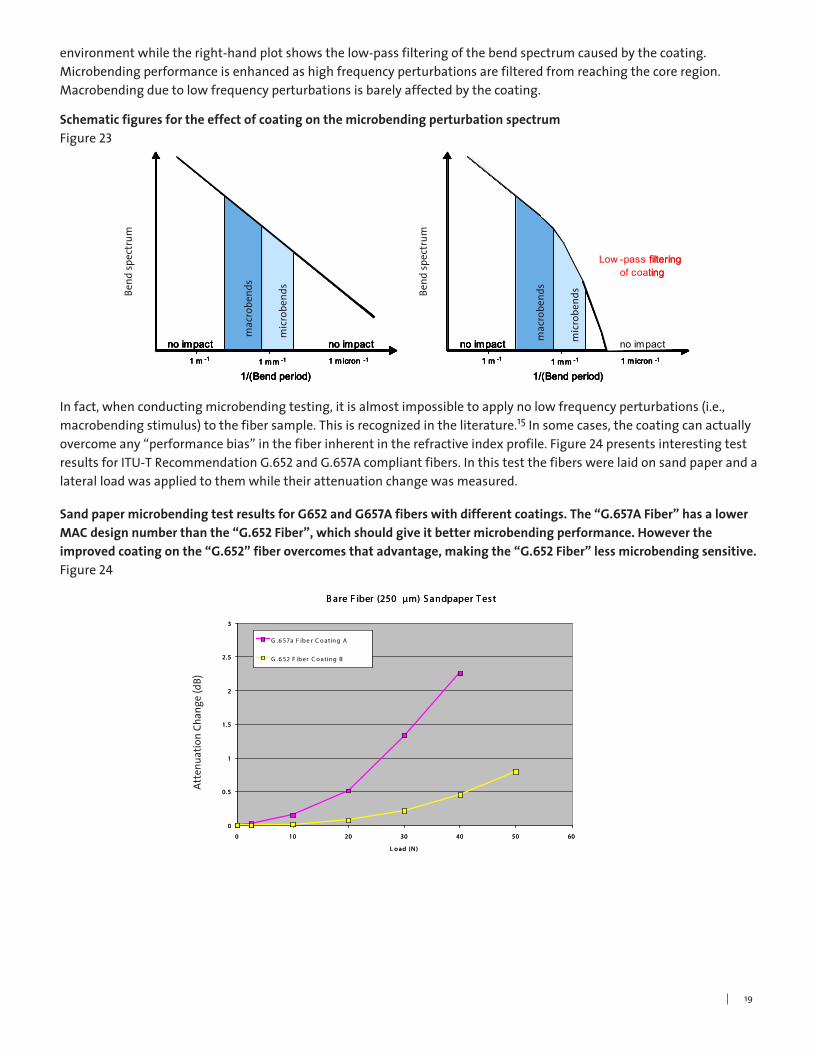
environmentwhiletheright-handplotshowsthelow-passfilteringofthebendspectrumcausedbythecoating.Microbendingperformanceisenhancedashighfrequencyperturbationsarefilteredfromreachingthecoreregion.Macrobendingduetolowfrequencyperturbationsisbarelyaffectedbythecoating.
Infact,whenconductingmicrobendingtesting,itisalmostimpossibletoapplynolowfrequencyperturbations(i.e.,macrobendingstimulus)tothefibersample.Thisisrecognizedintheliterature.1�Insomecases,thecoatingcanactuallyovercomeany“performancebias”inthefiberinherentintherefractiveindexprofile.Figure24presentsinterestingtestresultsforITU-TRecommendationG.652andG.657Acompliantfibers.Inthistestthefiberswerelaidonsandpaperandalateralloadwasappliedtothemwhiletheirattenuationchangewasmeasured.
Schematic figures for the effect of coating on the microbending perturbation spectrumFigure23
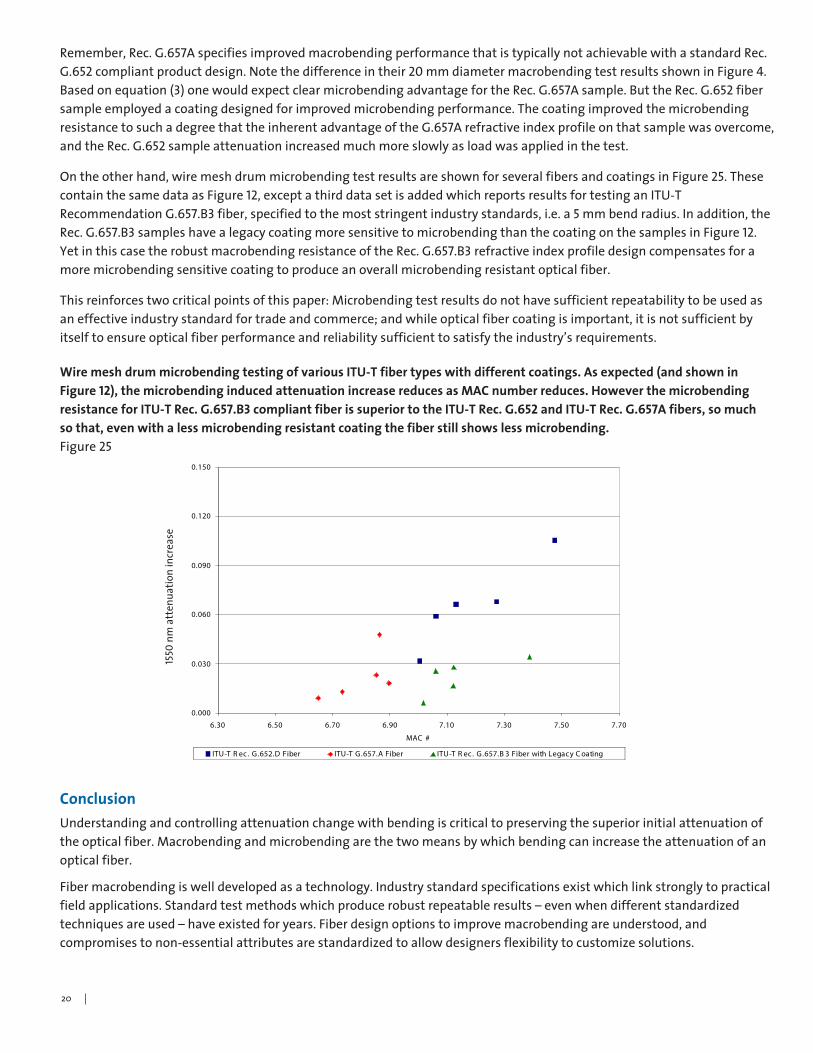
Sand paper microbending test results for G652 and G657A fibers with different coatings. The “G.657A Fiber” has a lower MAC design number than the “G.652 Fiber”, which should give it better microbending performance. However the improved coating on the “G.652” fiber overcomes that advantage, making the “G.652 Fiber” less microbending sensitive.Figure24
B are F iber (250 µm) S andpaper T est
0
0.5
1
1.5
2
2.5
3
0 10 20 30 40 50 60
L o ad ( N )
Attenuation Change (dB)
G .6 57a F ib e r C o atin g A
G .6 52 F ib er C o atin g B
B are F iber (250 µm) S andpaper T est
0
0.5
1
1.5
2
2.5
3
0 10 20 30 40 50 60
L o ad ( N )
Attenuation Change (dB)
G .6 57a F ib e r C o atin g A
G .6 52 F ib er C o atin g B
19
1 m icron -11 mm -11 m -1
Bend spectrum
macrobendsmicrobendsno impact
1/(Bend period)
no impact
1 m icron -11 mm -11 m -1
Bend spectrum
macrobendsmicrobendsno impact
1/(Bend period)
no impact
Low -pass filtering of coating
1 m icron -11 mm -11 m -1
Bend spectrum
macrobendsmicrobendsno impact
1/(Bend period)
no impact
1 m icron -11 mm -11 m -1
Bend spectrum
macrobendsmicrobendsno impact
1/(Bend period)
no impact
1 m icron -11 mm -11 m -1
Bend spectrum
macrobendsmicrobendsno impact
1/(Bend period)
no impact
1 m icron -11 mm -11 m -1
Bend spectrum
macrobendsmicrobendsno impact
1/(Bend period)
no impact
1 m icron -11 mm -11 m -1
Bend spectrum
macrobendsmicrobendsno impact
1/(Bend period)
no impact
1 m icron -11 mm -11 m -1
Bend spectrum
macrobendsmicrobendsno impact
1/(Bend period)
no impact
Low -pass filtering of coating
Bendspectrum
Bendspectrum
macrobends
microbends
macrobends
microbends
AttenuationChange(dB)
Remember,Rec.G.657AspecifiesimprovedmacrobendingperformancethatistypicallynotachievablewithastandardRec.G.652compliantproductdesign.Notethedifferenceintheir20mmdiametermacrobendingtestresultsshowninFigure4.Basedonequation(3)onewouldexpectclearmicrobendingadvantagefortheRec.G.657Asample.ButtheRec.G.652fibersampleemployedacoatingdesignedforimprovedmicrobendingperformance.ThecoatingimprovedthemicrobendingresistancetosuchadegreethattheinherentadvantageoftheG.657Arefractiveindexprofileonthatsamplewasovercome,andtheRec.G.652sampleattenuationincreasedmuchmoreslowlyasloadwasappliedinthetest.
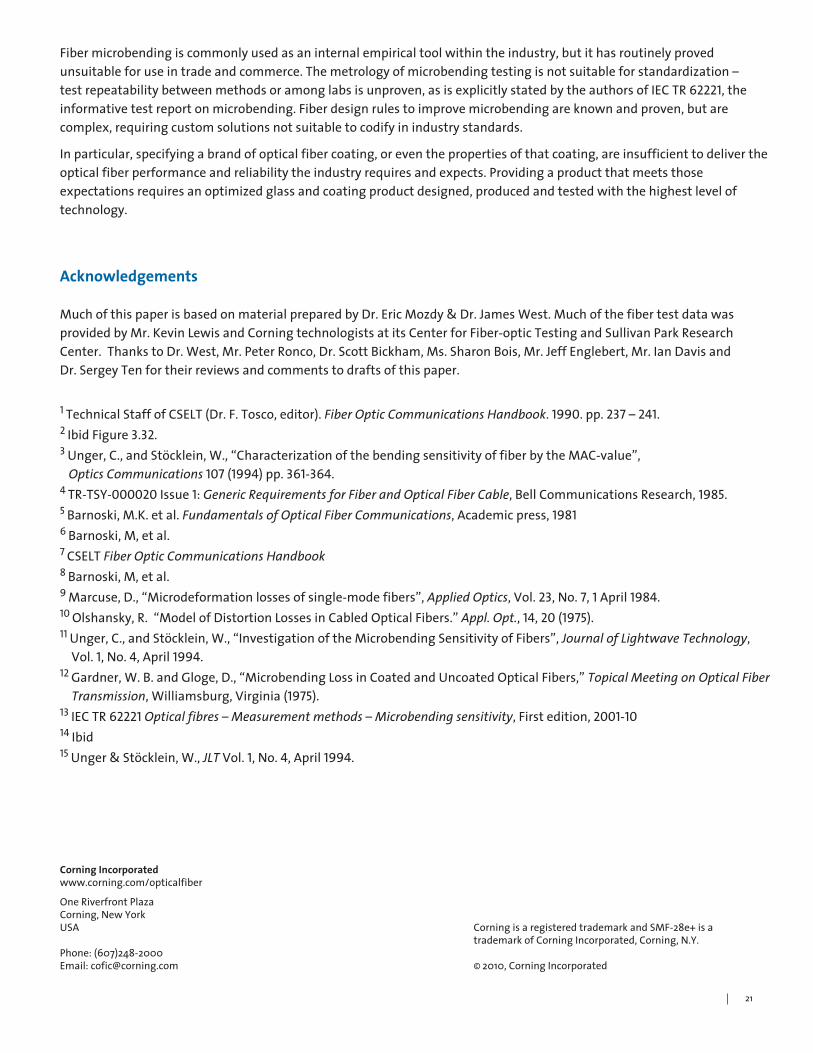
Ontheotherhand,wiremeshdrummicrobendingtestresultsareshownforseveralfibersandcoatingsinFigure25.ThesecontainthesamedataasFigure12,exceptathirddatasetisaddedwhichreportsresultsfortestinganITU-TRecommendationG.657.B3fiber,specifiedtothemoststringentindustrystandards,i.e.a5mmbendradius.Inaddition,theRec.G.657.B3sampleshavealegacycoatingmoresensitivetomicrobendingthanthecoatingonthesamplesinFigure12.YetinthiscasetherobustmacrobendingresistanceoftheRec.G.657.B3refractiveindexprofiledesigncompensatesforamoremicrobendingsensitivecoatingtoproduceanoverallmicrobendingresistantopticalfiber.
Thisreinforcestwocriticalpointsofthispaper:Microbendingtestresultsdonothavesufficientrepeatabilitytobeusedasaneffectiveindustrystandardfortradeandcommerce;andwhileopticalfibercoatingisimportant,itisnotsufficientbyitselftoensureopticalfiberperformanceandreliabilitysufficienttosatisfytheindustry’srequirements.
Wire mesh drum microbending testing of various ITU-T fiber types with different coatings. As expected (and shown in Figure 12), the microbending induced attenuation increase reduces as MAC number reduces. However the microbending resistance for ITU-T Rec. G.657.B3 compliant fiber is superior to the ITU-T Rec. G.652 and ITU-T Rec. G.657A fibers, so much so that, even with a less microbending resistant coating the fiber still shows less microbending.Figure25
20
ConclusionUnderstandingandcontrollingattenuationchangewithbendingiscriticaltopreservingthesuperiorinitialattenuationoftheopticalfiber.Macrobendingandmicrobendingarethetwomeansbywhichbendingcanincreasetheattenuationofanopticalfiber.
Fibermacrobendingiswelldevelopedasatechnology.Industrystandardspecificationsexistwhichlinkstronglytopracticalfieldapplications.Standardtestmethodswhichproducerobustrepeatableresults–evenwhendifferentstandardizedtechniquesareused–haveexistedforyears.Fiberdesignoptionstoimprovemacrobendingareunderstood,andcompromisestonon-essentialattributesarestandardizedtoallowdesignersflexibilitytocustomizesolutions.
0.000
0.030
0.060
0.090
0.120
0.150
6.30 6.50 6.70 6.90 7.10 7.30 7.50 7.70
MAC #
1550 nm Delta (dB/km)
ITU-T R ec. G.652.D Fiber ITU-T G.657.A Fiber ITU-T R ec. G.657.B 3 Fiber with Legacy C oating
1550nmattenuationincrease
Corning Incorporatedwww.corning.com/opticalfiber
OneRiverfrontPlazaCorning,NewYorkUSAPhone:(607)248-2000Email:[email protected]
CorningisaregisteredtrademarkandSMF-28e+isatrademarkofCorningIncorporated,Corning,N.Y.
©2010,CorningIncorporated
1 TechnicalStaffofCSELT(Dr.F.Tosco,editor).Fiber Optic Communications Handbook.1990.pp.237–241.2 IbidFigure3.32.3 Unger,C.,andStöcklein,W.,“CharacterizationofthebendingsensitivityoffiberbytheMAC-value”,Optics Communications107(1994)pp.361-364.4 TR-TSY-000020Issue1:Generic Requirements for Fiber and Optical Fiber Cable,BellCommunicationsResearch,1985.5 Barnoski,M.K.etal.Fundamentals of Optical Fiber Communications,Academicpress,19816 Barnoski,M,etal.7 CSELTFiber Optic Communications Handbook8 Barnoski,M,etal.9 Marcuse,D.,“Microdeformationlossesofsingle-modefibers”,Applied Optics,Vol.23,No.7,1 April1984.10 Olshansky,R.“ModelofDistortionLossesinCabledOpticalFibers.”Appl. Opt.,14,20(1975).11 Unger,C.,andStöcklein,W.,“InvestigationoftheMicrobendingSensitivityofFibers”,Journal of Lightwave Technology,Vol.1,No.4,April1994.12 Gardner,W.B.andGloge,D.,“MicrobendingLossinCoatedandUncoatedOpticalFibers,”Topical Meeting on Optical Fiber Transmission,Williamsburg,Virginia(1975).13 IECTR62221Optical fibres – Measurement methods – Microbending sensitivity,Firstedition,2001-1014 Ibid15 Unger&Stöcklein,W.,JLT Vol.1,No.4,April1994.
Acknowledgements
MuchofthispaperisbasedonmaterialpreparedbyDr.EricMozdy&Dr.JamesWest.MuchofthefibertestdatawasprovidedbyMr.KevinLewisandCorningtechnologistsatitsCenterforFiber-opticTestingandSullivanParkResearchCenter.ThankstoDr.West,Mr.PeterRonco,Dr.ScottBickham,Ms.SharonBois,Mr.JeffEnglebert,Mr.IanDavisandDr.SergeyTenfortheirreviewsandcommentstodraftsofthispaper.
21
Fibermicrobendingiscommonlyusedasaninternalempiricaltoolwithintheindustry,butithasroutinelyprovedunsuitableforuseintradeandcommerce.Themetrologyofmicrobendingtestingisnotsuitableforstandardization–testrepeatabilitybetweenmethodsoramonglabsisunproven,asisexplicitlystatedbytheauthorsofIECTR62221,theinformativetestreportonmicrobending.Fiberdesignrulestoimprovemicrobendingareknownandproven,butarecomplex,requiringcustomsolutionsnotsuitabletocodifyinindustrystandards.
Inparticular,specifyingabrandofopticalfibercoating,oreventhepropertiesofthatcoating,areinsufficienttodelivertheopticalfiberperformanceandreliabilitytheindustryrequiresandexpects.Providingaproductthatmeetsthoseexpectationsrequiresanoptimizedglassandcoatingproductdesigned,producedandtestedwiththehighestleveloftechnology.