Embed Size (px)
Citation preview
AN OVERVIEW OF MITIGATION STRATEGIES FOR SETTLEMENTS
UNDER BRIDGE APPROACH SLABS
by
RAJA VEERENDRA YENIGALLA
Presented to the Faculty of the Graduate School of
The University of Texas at Arlington in Partial Fulfillment
of the Requirements
for the Degree of
MASTER OF SCIENCE IN CIVIL ENGINEERING
THE UNIVERSITY OF TEXAS AT ARLINGTON
December 2011

Copyright © by Raja Veerendra Yenigalla, 2011
All Rights Reserved

iii
ACKNOWLEDGEMENTS
I would like to convey my gratitude and appreciation to Dr. Anand J Puppala, my
supervising professor, for his guidance given to me for my study at The University of Texas at
Arlington, Dr. Laureano R. Hoyos, and Dr. Xinbao Yu, members of the supervising committee
for their valuable time and suggestions and Dr. Bhaskar Chittoori, research associate and
faculty associate for his help and support during my research. I also thank them for enhancing
my knowledge of soil and soil mechanics.
I would like to thank the UTA staff, Ginny Bowers, Sarah Ridenour, Ava Chapman, and
Paul Shover for their assistance during my study and also the Texas Department of
Transportation (TxDOT) for funding this research.
I also would like to extend my special thanks to my friends and colleagues Dr. Ekarut
Archeewa, Ahmed Gaily, Anil Kumar Raavi, Aravind Pederla, Harshan Ravi, Nagasreenivasu
Talluri, Rajini Kanth Reddy, Ranjan Kumar Rout, Ruttanaporamakul Pinit, Seema Kalla,
Thornchaya Wejrungsikul and Varagorn Puljan for their help during field monitoring, laboratory
tests and their support for my stay in the United States.
November 8, 2011
iv
ABSTRACT
AN OVERVIEW OF MITIGATION STRATEGIES FOR SETTLEMENTS
UNDER BRIDGE APPROACH SLABS
Raja Veerendra Yenigalla, M.S.
The University of Texas at Arlington, 2011
Supervising Professor: Anand J Puppala
Settlement and heave related movements of bridge approach slabs relative to bridge
decks create a bump in the roadway causing inconvenience to the travelling public and at times
so large as to make travelling unsafe. Hence, it is important to adopt suitable remedial methods
to mitigate the approach settlements so as to ensure safe traveling conditions and also to
decrease the repair/maintenance costs. This thesis presents an overview of a few case studies
on different mitigation techniques applied on bridge approach settlement problems at various
locations in the state of Texas. The methods employed to mitigate the settlement including
Polyurethane injection, soil nailing, and potential utilization of Geofoam and flowable fill are
discussed. Also, the development of design charts for the construction of light weight fill
embankments using Expanded Clay and Shale (ECS) aggregate material is presented.
Methods on how to use the design charts for various embankments are also covered.
v
TABLE OF CONTENTS
ACKNOWLEDGEMENTS…………………………….…………………………………………….......iii
ABSTRACT……………………………………………………………………………………………….iv
LISTOFILLUSTRATIONS……………………………………………………………………………...viii
LIST OF TABLES…………………………………………………………………………………….....xii
Chapter Page 1 INTRODUCTION........................................................................................................................ 1
1.1 General ......................................................................................................1
1.2 Research Objectives..................................................................................2
1.3 Research Report Organization ..................................................................3
2 LITERATURE REVIEW ............................................................................................................. 5
2.1 Introduction ................................................................................................5
2.2 Definition of Bump and Bump Tolerance ...................................................5
2.2.1 Definition of Bump .....................................................................5
2.2.2 Bump Tolerances.......................................................................6
2.3 Mechanisms Causing the Formation of Bump...........................................7
2.4 Mitigation Techniques for Approach Settlements of New Bridges ..........14
2.5 Maintenance Measures For Distressed Approach Slabs ........................21
2.5.1 Replacement Method...............................................................23
2.5.2 Mud/Slab Jacking ....................................................................24
2.5.3 Grouting ...................................................................................26
2.5.3.1 Pressure grouting under the slab................................26
2.5.3.2 Compaction or High Pressure Grouting......................27
vi
2.5.3.3 Urethane Injection Technique.....................................29
2.5.3.4 Flowable fill .................................................................31
2.5.4 Other Methods .........................................................................33
2.5.4.1 Precambering..............................................................33
2.5.4.2 Lightweight Fill Materials.............................................35
2.5.4.3 Expanded Polystyrene (EPS) Geofoam .....................35
2.6 Summary..................................................................................................36
3 MAINTENANCE MEASURES FOR DISTRESSED APPROACH SLABS............................... 38
3.1 Introduction ..............................................................................................38
3.2 Bridge Identification and Repair...............................................................38
3.2.1 FM 1947 Hillsboro Waco Dt. Texas.........................................39
3.2.2 US 67/SH 174 Cleburne Fort Worth Dt. Texas........................47
3.2.3 SH 6, Quanah, Childress District Texas ..................................52
3.2.4 IH 410 San Antonio San Antonio Dt. Texas ............................64
3.3 Summary..................................................................................................77
4 MITIGATION OF SETTLEMNTS USING EXPANDED CLAY AND SHALE (ECS) AGGREGATE EMBANKMENT FILL SYSTEM........................................................................... 79
4.1 Introduction ..............................................................................................79
4.2 Construction of the Embankment with ECS.............................................79
4.3 Finite Element Method .............................................................................80
4.4 Modeling of Light Weight Embankment System......................................82
4.4.1 Geometry and boundary conditions of the test section ...........82
4.4.2 Material property values in a numerical analysis ......................83
4.4.3 Discretization of the test section ..............................................84
4.4.3.1 Settlement Analysis ....................................................85
4.4.3.2 Results of the numerical modeling analysis................87
vii
4.4.3.3 Model Validation .........................................................89
4.4.3.4 Comparison for the Results of Vertical Displacements with Elevation Surveys ..........91
4.4.3.5 Comparison for the Results of Vertical Displacements with Inclinometer Surveys .....91
4.4.4 Control Embankment Section ..................................................95
4.4.4.1 Settlement Analysis ....................................................95
4.4.4.2 Results of Numerical Analysis ....................................96
4.4.4.3 Model Validation .........................................................99
4.4.4.4 Comparison for the Results of Vertical Displacements with Elevation Surveys ........101
4.4.5 Design Charts for Construction of Light Weight Fill Embankments for New Bridges ..................102
4.5 Summary................................................................................................106
5 SUMMARY AND CONCLUSIONS......................................................................................... 108
5.1 General ..................................................................................................108
5.2 Summary and Conclusions....................................................................109
5.3 Limitations and Recommendations........................................................111
REFERENCES……………………………………………….………………………………….........112
BIOGRAPHICAL INFORMATION………………………..……………………………………........140
viii
LIST OF ILLUSTRATIONS
Figure page
2.1 Schematic of different origins leading to formation of bump at the end of the bridge (Briaud et al., 1997) ........................................................................ 12
2.2 A design alternative by using geofoam as a backfill (Horvath, 2000) ................................... 21
2.3 Simulated approach slab deflection due to washout by UC Davis research team ............... 24
2.4 Mud-jacking injection sequences (MoDOT, EPC)................................................................. 26
2.5 Location of holes drilled on an approach slab (White et al., 2005) ....................................... 28
2.6 The flowable mortar used under a roadway pavement (Smadi, 2001) ................................. 32
2.7 The flowable fill used as a base material (Du, 2008) ............................................................ 33
2.8 Pre-cambered Approach Design (Hoppe, 1999)................................................................... 35
2.9 Emergency Ramp and High Embankment constructed using EPS Geofoam at Kaneohe interchange in Oahu, Hawaii............................................ 36
3.1 Bridge site location, FM 1947 Hillsboro................................................................................. 39
3.2 Problem definition sketch of FM 1947 Bridge site, Hillsboro, Texas..................................... 40
3.3 Settlement of the approach slab. .......................................................................................... 41
3.4 Void devoloped adjacent to abutment................................................................................... 41
3.5 Closer view of the void gap ................................................................................................... 42
3.6 Drilling holes into the approach slab ..................................................................................... 43
3.7 Another view of drilling holes ................................................................................................ 43
3.8 Sealing the void from exterior face to protect loss of injected Urethane............................... 44
3.9 Taking levels during the injection process to check for extra injection ................................. 44
3.10 Uplift of approach slab during the injection process ........................................................... 45
3.11 Another view of uplift of approach slab ............................................................................... 45
ix
3.12 Level-up of uneven sections with cold asphalt mix ............................................................. 46
3.13 Bridge site location US 67/SH 174 Cleburne, Texas .......................................................... 47
3.14 Bridge along US 67, crossing over SH 174 in Cleburne ..................................................... 48
3.15 Failure of the MSE wall ....................................................................................................... 49
3.16 Erosion of soil under the slab.............................................................................................. 49
3.17 Drilling of holes to place the soil nails ................................................................................. 50
3.18 Placing of nails and grouting the holes ............................................................................... 51
3.19 Shotcreting the exterior ........................................................................................................ 51
3.20 Bridge Site Location, SH 6 Quanah .................................................................................... 52
3.21 GSSI GPR System and Antennas used in this study.......................................................... 54
3.22 Test section along SH 6 in Quanah .................................................................................... 55
3.23 Field Pictures from Quanah Bridge ..................................................................................... 56
3.24 Typical Linescans from Quanah Bridge with High Frequency Antenna.............................. 57
3.25 Typical Linescans from Quanah Bridge with Low Frequency Antenna .............................. 58
3.26 Typical Linescans from Quanah Abutment ......................................................................... 59
3.27 Overall results from Quanah Bridge (North Side) ............................................................... 60
3.28 Overall results from Quanah Bridge (South Side)............................................................... 61
3.29 Selection of points from GPR Linescan .............................................................................. 62
3.30 Estimated Depth Profile....................................................................................................... 62
3.31 Bridge site location, IH 410, San Antonio ........................................................................... 64
3.32 Overall section view of San Antonio site ............................................................................. 65
3.33 Sectional views of west and east approach slabs............................................................... 65
3.34 Detailed location of each line .............................................................................................. 66
3.35 Typical linescan of west approach slab with High Frequency Antenna .............................. 67
3.36 Typical linescan of west approach slab with Medium Frequency Antenna......................... 68
x
3.37 Proposed Core layout for San Antonio Bridge .................................................................... 69
3.38 Retrieved cores from west slab........................................................................................... 70
3.39 Retrieved cores from east slab of San Antonio Bridge ....................................................... 71
3.40 DCP sample results............................................................................................................. 73
3.41 Selection of points from GPR linescan................................................................................ 75
3.42 Estimated depth profile........................................................................................................ 76
4.1 Details of ECS Bridge Site, SH 360, Arlington, TX ............................................................... 80
4.2 Six noded triangular element (Plaxis manual) ...................................................................... 80
4.3 The results of excess pore pressure as a function of height from ........................................ 82
4.4 Geometry and boundary conditions of the ECS test section ................................................ 83
4.5 Nodes and elements in the test section.................................................................................. 85
4.6 Calculation phase in the settlement analyses ........................................................................ 86
4.7 Observation points in the settlement calculation .................................................................... 86
4.8 Deformed mesh of the test section (displacement scaled up 50 times) ............................... 87
4.9 Total displacements in the test section ................................................................................. 88
4.10 Horizontal displacements in the test section....................................................................... 88
4.11 Vertical displacements in the test section ........................................................................... 89
4.12 Comparison of vertical displacements in a test section between data obtained from elevation surveys and results from numerical analysis................................ 91
4.13 Location of vertical inclinometers installed on ECS embankment, SH 360. ....................... 92
4.14 Comparisons of lateral soil movements between monitored data and numerical results in the vertical inclinometers (a) V1and (b) V4......................................... 94
4.15 Nodes and elements in the control section ......................................................................... 95
4.16 Deformed mesh of the control section (displacement scaled up 20 times) ........................ 97
4.17 Total displacements in the control section .......................................................................... 97
4.18 Horizontal displacements in the control section.................................................................. 98

xi
4.19 Vertical displacements in the control section ...................................................................... 98
4.20 Comparison of vertical displacements in a test section between data obtained from elevation surveys and results from numerical analysis.............................. 101
4.21 Geometry of the test section with a height of 20 ft (6.0 m) and subgrade thickness of 10 ft (5.0 m)............................................................................ 102
4.22 (a) & (b) Geometry of the test section with a height of 20 ft (6.0 m) and subgrade thicknesses of 15 ft (5 m) and 20 ft (6.0 m) respectively ........................... 103
4.23 Design chart for ECS embankment with subgrade thickness 10 ft................................... 104
4.24 Design chart for ECS embankment with subgrade thickness 15 ft................................... 105
4.25 Design chart for ECS embankment with subgrade thickness 20 ft................................... 105
xii
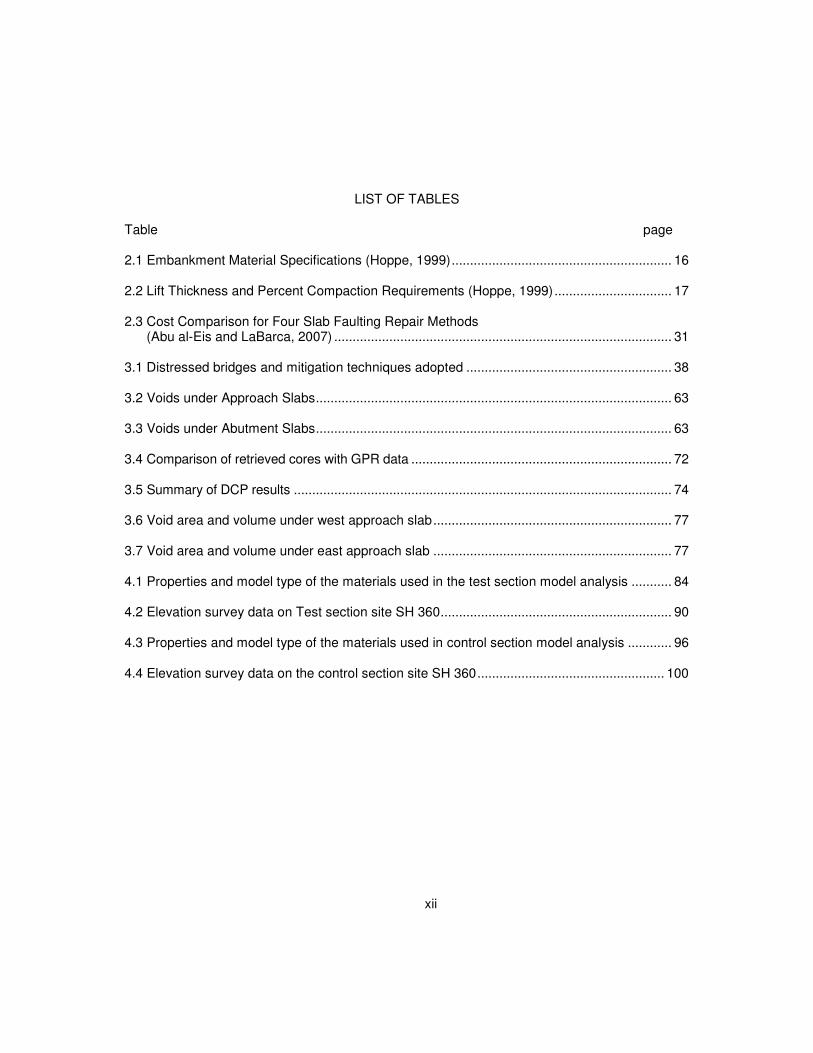
LIST OF TABLES
Table page
2.1 Embankment Material Specifications (Hoppe, 1999)............................................................ 16
2.2 Lift Thickness and Percent Compaction Requirements (Hoppe, 1999)................................ 17
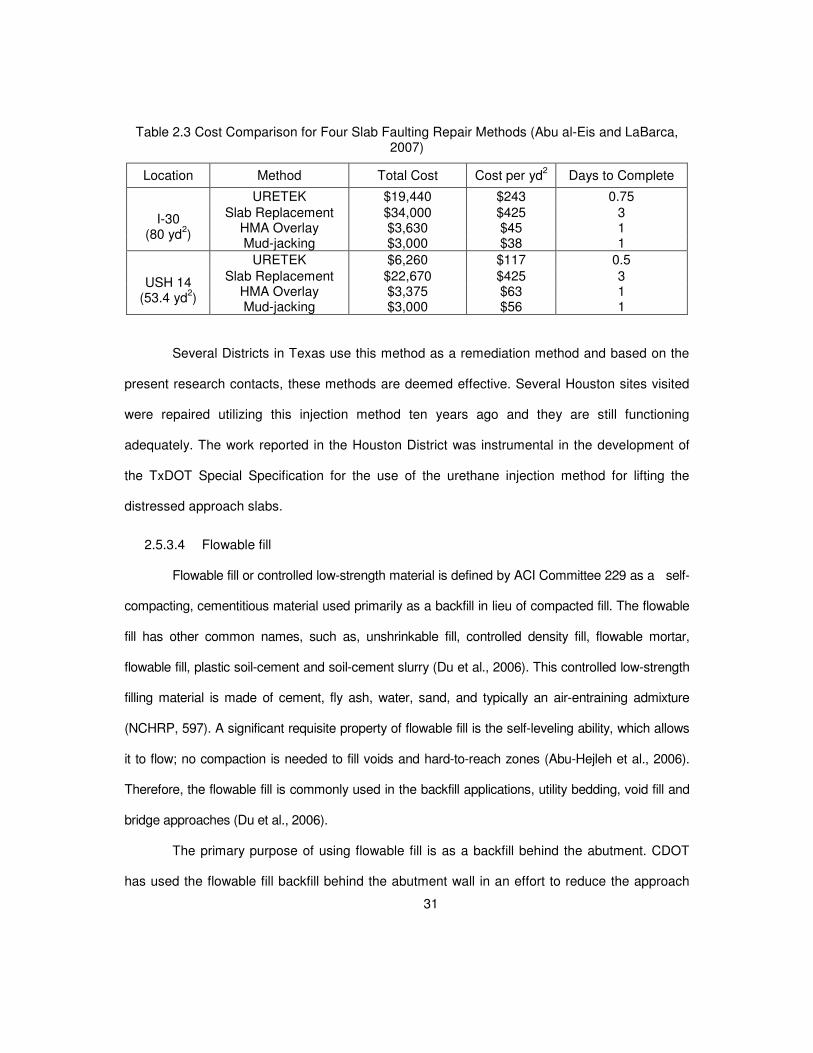
2.3 Cost Comparison for Four Slab Faulting Repair Methods (Abu al-Eis and LaBarca, 2007) ............................................................................................ 31
3.1 Distressed bridges and mitigation techniques adopted ........................................................ 38
3.2 Voids under Approach Slabs................................................................................................. 63
3.3 Voids under Abutment Slabs................................................................................................. 63
3.4 Comparison of retrieved cores with GPR data ....................................................................... 72
3.5 Summary of DCP results ....................................................................................................... 74
3.6 Void area and volume under west approach slab................................................................. 77
3.7 Void area and volume under east approach slab ................................................................. 77
4.1 Properties and model type of the materials used in the test section model analysis ........... 84
4.2 Elevation survey data on Test section site SH 360............................................................... 90
4.3 Properties and model type of the materials used in control section model analysis ............ 96
4.4 Elevation survey data on the control section site SH 360................................................... 100
1
CHAPTER 1
1INTRODUCTION
1.1 General
Bridge approach settlement and the formation of the bump near a bridge are
extensively reported (Briaud et al., 1997). This problem usually emanates from soil settlement
related problems arising from both embankment fill and subgrade foundation materials.
Maintenance of these bridge approach slab settlements cost millions of dollars to repair
annually and this mainly absorbs all the maintenance resources. Briaud et al. (1997) reported
that 30% of bridges in Texas, i.e., 13,800 out of 46,000 bridges were subjected to the bump
problem, while another study cited annual costs for “bump” repairs in Texas is around $7 million
(Seo, 2003). These indicate that the bump is a premier maintenance problem in Texas.
There have been several researchers studied the bridge approach settlement to
determine both the causes of the bump, and the techniques to mitigate the problem. From the
literature review, it is found out that the causes of the bump are various and still too complex to
identify. However, the primary sources of the problem can be broadly divided into four
categories: 1) Material properties of foundation and embankment, 2) Design criteria for bridge
foundation, abutment and deck, 3) Construction method, and 4) Maintenance criteria. It should
be noted that not all the factors contribute to the formation of the bump or differential settlement
concurrently as one factor may be more problematic than the other. Also, one model cannot be
developed for capturing the response of settlements underneath the approach slabs.
For the mitigation techniques, it is found that there have already been several methods
employed to alleviate the bump problem, which can be summarized based on the groups of
treatments as followings; 1) improvement of foundation soil, 2) improvement of backfill material,

2
3) design of bridge foundation, 4) design of approach slab, and 5) provide effective drainage
and erosion control measures.
One of the major contributors to settlement is the weight of embankment. Hence this
research made a comprehensive attempt to address the mitigation technique using Expanded
Clay and Shale (ECS) aggregate as a light weight fill material to reduce the weight of the
embankment.
The present thesis work primarily focused on the different repair methods including
urethane injection, soil nailing and others. Geophysical studies are primarily adopted to identify
the settlements under bridge approach slabs of existing bridges and this information is valuable
in developing treatment methods. One case study using urethane injection is extensively
monitored whereas another with soil nailing is monitored for a short time frame.
Also, charts to design embankments for new bridges using a light weight fill material
known as Expanded Clay and Shale (ECS) are introduced. The ECS is a lightweight granular
material and is used as a backfill material for embankment construction. With its lightweight
property, the ECS fill is expected to decrease the load exerts on the soft foundation soil. As a
consequence, the settlement due to consolidation phenomenon will be decreased. .
1.2 Research Objectives
The objectives of this research are to evaluate the effectiveness of different mitigation
techniques adapted to repair distressed bridge approach slabs and to develop comprehensive
design charts to design bridge embankments using light weight embankment fill material using
data from a previous research by Archeewa (2010). Although these methods have already been
utilized in other places, they have not been employed in Texas conditions to serve the purpose
related to the bump mitigation problem. If this study shows that the different methods employed
to repair the distressed bridge approaches of existing bridges and the use of Expanded Clay
Shale (ECS) aggregate as a light weight fill material to address the settlement problems in new
3
bridges, then the results of this study will not only help agencies in lowering their maintenance
and repair works of bridge embankments built with clayey soils, but will also reduce traffic
congestion problems arisen due to constant repair works.
1.3 Research Report Organization
This thesis consists of five chapters. The first Chapter is an introduction, which presents
the background, objectives and tasks involved to accomplish this research.
Chapter 2 presents details of the review from available literature addressing the
settlement at bridge approach problem. In the chapter, definition of the bump and the causes of
the bump are presented first, and followed by viable techniques used to mitigate the settlement
at the bridge approach problem, both for new bridge constructions, and for distressed bridge
approach mitigation measures.
Chapter 3 presents the maintenance measures for existing bridges that are primarily
remedial methods to repair the settlements under approach slabs. A brief introduction to the
need and importance of adopting suitable remedial measures to mitigate the settlement related
problems in distressed bridge approach slabs is presented. This chapter provides appropriate
mitigation techniques that can be investigated to treat the distressed bridges. Four bridge
approach slabs with settlement related problems are identified; the location of the bridges,
corrective methods employed, procedure of the method used and the geophysical studies
performed on the bridges along with recommendations are discussed.
Chapter 4 presents the study results of a light weight embankment using ECS for new
bridge embankment construction. Results discussed in this chapter are from numerical analysis
and modeling of the test sections. The results from the laboratory study on ECS that are used
as input soil parameters in a finite element numerical model, and the field monitored data of the
ECS fill embankment were adopted from previous studies by Archeewa (2010). The
comparisons between the results from the FEM modeling and the field data are performed to

4
validate the numerical model, which are used further to predict the settlements over a long-term
condition. Design charts were developed for different heights of embankments, varying
subgrade thicknesses and varying compression indices of the subgrade soil.
Summary and conclusions, which include the significant findings from field monitoring
and numerical analysis studies, and also limitation of this research and the future needs, are
addressed in Chapter 5.

5
CHAPTER 2
2LITERATURE REVIEW
2.1 Introduction
This chapter presents comprehensive information collected from available literature
addressing the problem about the differential settlement at the bridge approach. As a part of this
research, the literature review in this chapter was carried out to obtain comprehensive details in
five sections. In the first part of this chapter, general information of the definitions of the bump at
the end of the bridge and the tolerance of the bump are given. Thereafter, in the second part the
various mechanisms causing the formation of the bump such as consolidation of foundation soil,
poor compaction of the backfill material, poor water drainage and soil erosion closed to the
bridge abutments, types of bridge abutments, traffic volume passing over the bridge decks, age
of the approach slab, design of the approach slab, skewness of the bridge and seasonal
temperature variations are mentioned. The third part presents the techniques used to mitigate
the bump at the end of the bridge for a new bridge. Subsequently, the maintenance measures
normally employed by highway agencies to alleviate distressed approach slabs are presented.
The final section of the chapter is a summary.
2.2 Definition of Bump and Bump Tolerance
2.2.1 Definition of Bump
Generally, roadway and embankments are built on subgrade foundation and compacted
fill materials respectively, which undergo load induced compression and settlements with time.
In contrast, the bridges typically need to rest on deep foundations such as pile, pier or other
types of deep foundation systems resting on a firm foundation material such as bedrock.
Therefore, by resting on a firm foundation the total settlement of the bridge is usually much
6
smaller than the total settlement of the roadway or adjacent embankment. As a result, a
considerable differential settlement occurs at the area between the bridge and roadway
interfaces, and a noticeable bump can develop at the bridge ends.
The “Bump” can affect drivers varying from feeling uncomfortable to being hazardous to
their lives (Hopkins, 1969; Ardani, 1987). To eliminate the effects of the bump, the approach
slab must be built to provide a smooth grade transition between these two structures (bridge
and roadway). Another function of the approach slab is to keep the magnitude of differential
settlement within a control limit (Mahmood, 1990; Hoppe, 1999). However, in practice it is found
that the approach slabs also exceed differential settlements (Mahmood, 1990, Hoppe, 1999). In
such cases, the approach slab moves the differential settlement problem at the end of the
bridge to the end of the slab connecting with the roadway. Hence, the “Bump” or “Approach
Settlement” can be defined as the differential settlement or heave of the approach slab with
reference to the bridge abutment structure.
2.2.2 Bump Tolerances
The differential settlement near the bridge approach is a common problem that plagues
several bridges in the state of Texas (Jayawikrama et al, 2005). One of the major maintenance
problems is to establish severity levels of the bump that require remedial measures. The
differential settlement tolerances need to be established for consideration of when to initiate the
repair works.
Walkinshaw (1978) suggested that bridges with a differential settlement of 2.5 in. (63
mm) or greater needs to be repaired. Bozozuk (1978) stated that settlement bumps could be
allowed up to 3.9 in. (100 mm) in the vertical direction and 2.0 in. (50 mm) in the horizontal
direction. Several researchers define the allowable bumps in terms of gradients as a function of
the length of the approach slab. Wahls (1990) and Stark et al. (1995) suggested an allowable
7
settlement gradient as 1/200 of the approach slab length. This critical gradient was also referred
by Long et al. (1998), and was used by the Illinois DOT for initiating maintenance operations.
Das et al. (1990) used the International Roughness Index (IRI) to describe the riding
quality. The IRI is defined as the accumulations of undulations of a given segment length and is
usually reported in m/km or mm/m. The IRI values at the bridge approaches of 3.9 (mm/m) or
less indicates a very good riding quality. On the other hand, if the IRI value is equal to 10 or
greater, then the approach leading to the bridge is considered as a very poor riding quality.
Albajar et al. (2005) established a vertical settlement on the transition zone of 1.6 in. (4 cm) as a
threshold value to initiate maintenance procedures on bridge approach areas. In Australia, a
differential settlement or change in grade of 0.3% both in the transverse and the longitudinal
direction and a residual settlement of 100 mm (for a 40 year design period) are considered as
limiting values for bridge approach settlement problems (Hsi and Martin, 2005; Hsi, 2007).
In Texas, the state of practice for repair strategies is different from District to District
and these repairs are typically based on visual surveys (Jayawickrama et al., 2005) and
International Roughness Index (IRI) values (James et al., 1991). In the study by James et al.,
(1991), it was indicated that several Districts in Texas have reported bump problems and a few
Districts have explored methods such as Urethane injection to moisture control to mitigate
settlements. However, these methods have only provided temporary relief as the settlement
continues to increase with the service life. As a part of Jayawickrama et al. (2005) study,
researchers visited three bridge sites in the Waco, Houston, and San Antonio Districts where
Urethane injection was adopted to mitigate approach settlement problems. Their findings are
discussed in detail in the subsequent sections of this chapter.
2.3 Mechanisms Causing the Formation of Bump
Bridge approach settlement and the formation of the bump is a common problem that
draws significant resources for maintenance, and also creates a negative perception about the

8
state agencies in the minds of transportation users. From thorough studies compiled from the
existing and on-going research studies on the bridge approach settlement, the causes of the
problem can be very variable and are still too complex to identify them easily. However, the
primary sources of the problem can be broadly divided into four categories; material properties
of foundation and embankment, design criteria for bridge foundation, abutment and deck,
construction supervision of the structures, and maintenance criteria. It should be noted that not
all the factors contribute to the formation of the bump concurrently.
There have been many studies employed across the states in the USA to study the
causes of the problem and the methodologies to solve it (Hopkins, 1969, 1985; Stewart, 1985;
Greimann et al., 1987; Laguros et al, 1990; Kramer and Sajer, 1991; Ha et al, 2002;
Jayawikrama et al, 2005; White et al, 2005, 2007).
White et al. (2005) define the term “bridge approach,” not just in terms of the approach
slab alone, but in terms of a larger area, covering from the bridge structure (abutment) to a
distance of about 100 ft away from the abutment. This definition includes the backfill and
embankment areas under and beyond the approach slab as significant contributors to the
settlements in the bridge approach region.
Many factors are reported in the literatures that explain the mechanisms causing the
formation of bumps on the bridge transition (Hopkins, 1969; Stewart, 1985; Kramer and Sajer,
1991). According to Hopkins (1969), the factors causing differential settlement of the bridge
approaches are listed as:
a. Type and compressibility of the soil or fill material used in the embankment and
foundation
b. Thickness of the compressible foundation soil layer
c. Height of the embankment
d. Type of abutment.
9
Kramer and Sajer (1991) and Briaud et al. (1997) concurred with these observations
later based on extensive surveys of various State DOTs in the USA. Stewart (1985) performed
a research study for Caltrans and this study concurred with the finding reported by Hopkins
(1969), in particular the observations noting that the original ground and fill materials contribute
the maximum settlement to the approach slab. Based on the results obtained from a field study
performed at Nebraska, Tadros and Benak (1989) confirmed that the primary cause of this
problem is due to the consolidation of foundation soil but not the consolidation of the compacted
embankment fill. The proper compaction of the embankment in accordance with the
construction specifications has an important influence on the settlement of embankment fill
material. Also, the swell and shrink behaviors of the foundation/ backfill soil and vibration or
movements of the backfill soil (in case of granular fill) due to moving traffic loads may
significantly impact the development of the approach faults (Hopkins, 1969, 1985).
Ardani (1987), Wahls (1990), and Jayawikrama et al. (2005) also reported that both the
time-dependent settlement (primary/secondary consolidation) of foundation soil beneath the
embankment and the approach slab embankment as well as the poor compaction of
embankment adjacent to the abutment, and erosion of soil at the abutment face and poor
drainage system around the abutment are the major contributors to approach settlement
problems.
Wahls (1990) stated that the approach-slab design and the type of abutment and
foundation can affect the relative settlement of the slab and bridge abutment. Abutments
supported by the shallow foundations and when these foundations lay within the approach
embankment fill will settle along with the embankment. In addition, Wahls (1990) concluded that
the lateral creep of foundation soils and lateral movement of abutments can potentially cause
this problem.
10
Laguros et al. (1990) reported that factors including the age of the approach slab,
height of embankment, skewness of the bridge and traffic volume influence the bridge approach
settlement. The flexibility of the approach pavements has a considerable influence as well.
Laguros et al. (1990) observed greater differential settlement in flexible pavements than rigid
pavements during initial stages following construction (short term performance), while both
pavement types performed similarly over the long term. More details are provided in later
sections.
Other factors that influence the creation of the bump include the type of bridge
abutment and approach slab design (Mahmood, 1990; Wahls, 1990). Design of abutment
structures is not unique and varies as per the connection of the slab with the abutment. The
abutments are characterized as mainly integral (movable) or non-integral (conventional or stub)
type of abutments (Greimann et al., 1987). For an integral abutment, the bridge deck slab is
monolithically connected to the abutment, and the abutment is allowed to move laterally along
with the bridge deck slab; while for a non-integral one, the bridge deck is independent of the
abutment, and the longitudinal movements of the bridge deck are taken care of by roller/pin-
bearing plates.
Weather changes also contribute to the differential settlement between the bridge and
the approach slab as in the case of integral abutments when seasonal temperature changes
from summer to winter (Schaefer and Koch, 1992). Weather changes often lead to soil
displacement behind the abutment eventually leading to void development under the approach
slab (Schaefer and Koch, 1992; White et al., 2005). This creates water infiltration under the
slab, which leads to erosion and loss of backfill material (Jayawikrama et al., 2005).
White et al. (2007) carried a comprehensive field study of 74 bridges in Iowa to
characterize problems leading to poor performance of bridge approach pavement systems.
White et al. (2007) claimed that subsurface void development caused by water infiltration

11
through unsealed expansion joints; collapse and erosion of the granular backfill, and poor
construction practices were found to be the main contributing factors of the approach slab
settlements in Iowa.
Other research studies from outside the USA, including Australia and China show that
the bump at the end of the bridge is a major concern in highway and freeway constructions. Hsi
and Martin (2005) and Hsi (2007) reported that the approach settlement problems were
observed due to very soft estuarine and marine clays in subsoils at the construction of the
Yelgun-Chinderah Freeway in New South Wales, Australia. Hsi (2007) reported that rapid
construction of deep approach embankments over very soft clay subgrades often experienced
the long term settlement of the soft subgrade which has attributed to causing settlements at the
approach slabs.
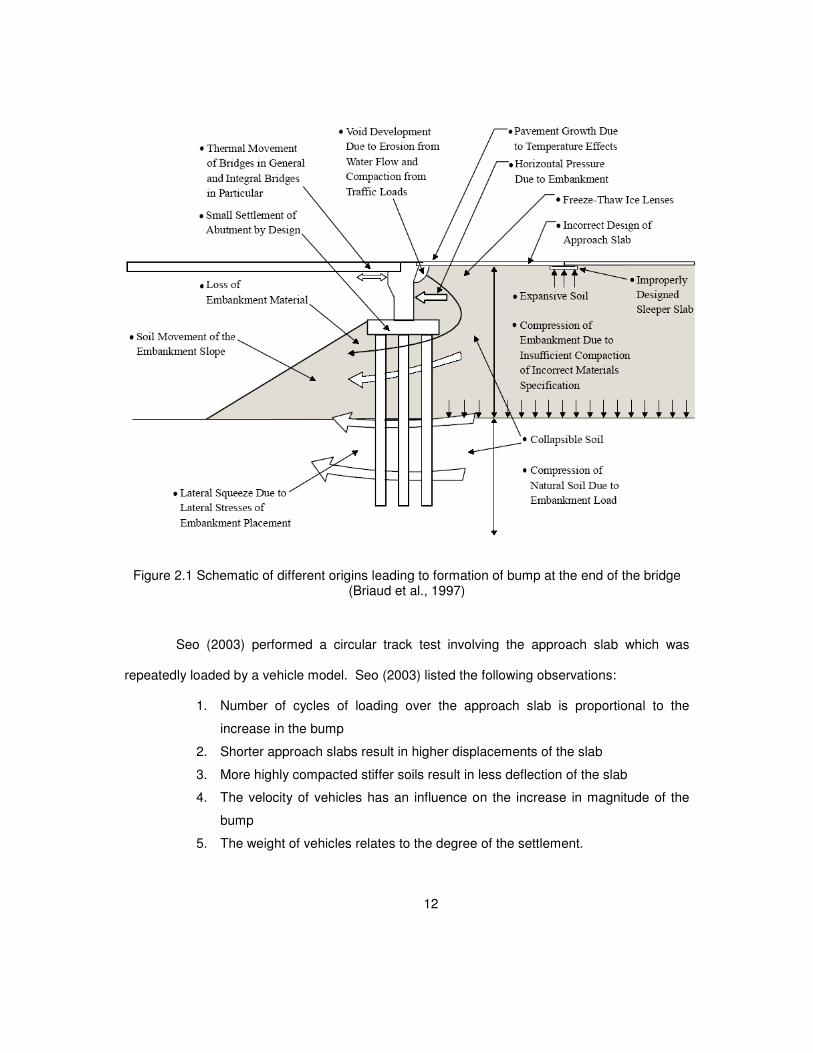
In the following, three studies by Briaud et al. (1997), Seo (2003) and White et al.
(2007) listed factors that contribute to bumps. Briaud et al. (1997) summarized various factors
that contributed to the formation of bumps/settlements at the approach slabs in Figure 2.1.
These factors were grouped and ranked in the following order in which they contribute to the
soil movements: fill on compressible foundation; approach slab too short; poor fill material;
compressible fill; high deep embankment; poor drainage; soil erosion; and poor joint design and
maintenance.
12
Figure 2.1 Schematic of different origins leading to formation of bump at the end of the bridge (Briaud et al., 1997)
Seo (2003) performed a circular track test involving the approach slab which was
repeatedly loaded by a vehicle model. Seo (2003) listed the following observations:
1. Number of cycles of loading over the approach slab is proportional to the
increase in the bump
2. Shorter approach slabs result in higher displacements of the slab
3. More highly compacted stiffer soils result in less deflection of the slab
4. The velocity of vehicles has an influence on the increase in magnitude of the
bump
5. The weight of vehicles relates to the degree of the settlement.

13
A recent study conducted by White et al. (2007) summarized the following factors as
contributors to differential settlements of the approach slab:
1. Backfill materials under poorly performing approach slabs are often loose and
under compacted.
2. The foundation soil or embankment fill settles.
3. Many bridge approach elevation profiles have slopes higher than 1/200, which
is considered a maximum acceptable gradient for bridge approaches.
4. Voids develop under bridge approaches within one year of construction,
indicating insufficiently compacted and erodible backfill material.
5. Inadequate drainage is a major bridge approach problem. Many abutment
subdrains are dry with no evidence of water, are blocked with soil and debris, or
have collapsed.
6. Many expansion joints are not sufficiently filled, allowing water to flow into the
underlying fill materials.
By summarizing the above studies as well as a review of other investigations that
addressed this bump problem, the major factors that cause approach bumps can be listed as:
1. Consolidation settlement of foundation soil
2. Poor compaction and consolidation of backfill material
3. Poor drainage and soil erosion
4. Types of bridge abutments
5. Traffic volume
6. Age of the approach slab
7. Approach slab design
8. Skewness of the bridge
9. Seasonal temperature variations

14
2.4 Mitigation Techniques for Approach Settlements of New Bridges
This sub-section is a summary of methods adopted for mitigating potential settlements
expected in new bridges. The treatment techniques adopted to mitigate the settlements can be
classified based on their area of application such as
1. Improvement of foundation soil
2. Improvement of backfill material
3. Design of bridge foundation
4. Design of approach slab
5. Effective drainage and erosion control methods
The objective of this research is to establish the use of light weight fill material to reduce
the settlements under approach slab. Hence the treatment techniques adopted to improve the
backfill material are considered.
The bridge approach embankment has two functions; first to support the highway
pavement system, and second to connect the main road with the bridge deck. Most of the
approach embankments are normally constructed by conventional compaction procedures
using materials from nearby roadway excavation or a convenient borrow pit close to the bridge
site. This implies that the serviceability of the embankment, in the aspects of slope stability,
settlement, consolidation, or bearing capacity issues, depends on the geotechnical properties of
the fill materials (Wahls, 1990). In addition, since the embankment must provide a good
transition between the roadway and the bridge, the standards for design and construction
considerations both in materials quality requirements and compaction specifications must be
specified in order to limit the settlement magnitude within a small acceptable degree (Wahls,
1990).
15
Generally, the materials for embankment construction should have the following
properties (White, 2005):
a. being easily compacted,
b. not time-dependent,
c. not sensitive to moisture,
d. providing good drainage,
e. erosion resistance and
f. shear resistance.
Dupont and Allen (2002) cited that the most successful method to construct the
approach embankments is to select high quality fill material, with the majority of them being a
coarse granular material with high internal frictional characteristics. Several research methods
have been attempted to define methods to minimize potential of settlement and lateral
movement development in the approach embankments and these studies are discussed in the
following.
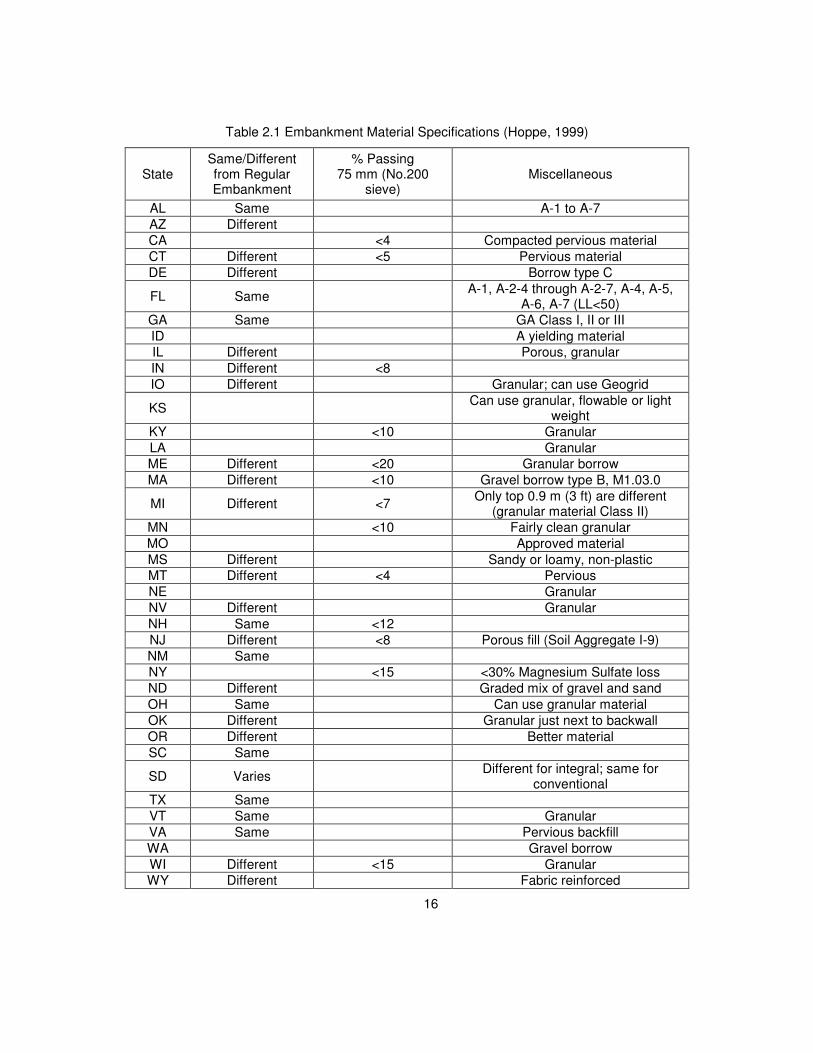
Hoppe (1999) studied the embankment material specifications from various DOTs. The
results from his survey are presented in Tables 2.1 and 2.2. It can be seen from Table 3 that
forty-nine (49) percent of the state agencies use more rigorous material specifications for an
approach fill than for a regular highway embankment fill. Furthermore, the study also shows
that typical requirements for the backfill materials among the different states varied with one
another. One common requirement followed by several states is to limit the percentage of fine
particles in the fill material in order to reduce the material plasticity. As an example, the
allowable percentage of material passing the No. 200 (75-micron) sieve varies from less than
4% to less than 20%. Another requirement commonly found is to enhance the fill drainage
properties by a requisite of pervious granular material.
16
Table 2.1 Embankment Material Specifications (Hoppe, 1999)
State Same/Different from Regular Embankment
% Passing 75 mm (No.200
sieve) Miscellaneous
AL Same A-1 to A-7 AZ Different CA <4 Compacted pervious material CT Different <5 Pervious material DE Different Borrow type C
FL Same A-1, A-2-4 through A-2-7, A-4, A-5,
A-6, A-7 (LL<50) GA Same GA Class I, II or III ID A yielding material IL Different Porous, granular IN Different <8 IO Different Granular; can use Geogrid
KS Can use granular, flowable or light
weight KY <10 Granular LA Granular ME Different <20 Granular borrow MA Different <10 Gravel borrow type B, M1.03.0
MI Different <7 Only top 0.9 m (3 ft) are different
(granular material Class II) MN <10 Fairly clean granular MO Approved material MS Different Sandy or loamy, non-plastic MT Different <4 Pervious NE Granular NV Different Granular NH Same <12 NJ Different <8 Porous fill (Soil Aggregate I-9) NM Same NY <15 <30% Magnesium Sulfate loss ND Different Graded mix of gravel and sand OH Same Can use granular material OK Different Granular just next to backwall OR Different Better material SC Same
SD Varies Different for integral; same for
conventional TX Same VT Same Granular VA Same Pervious backfill WA Gravel borrow WI Different <15 Granular WY Different Fabric reinforced
17
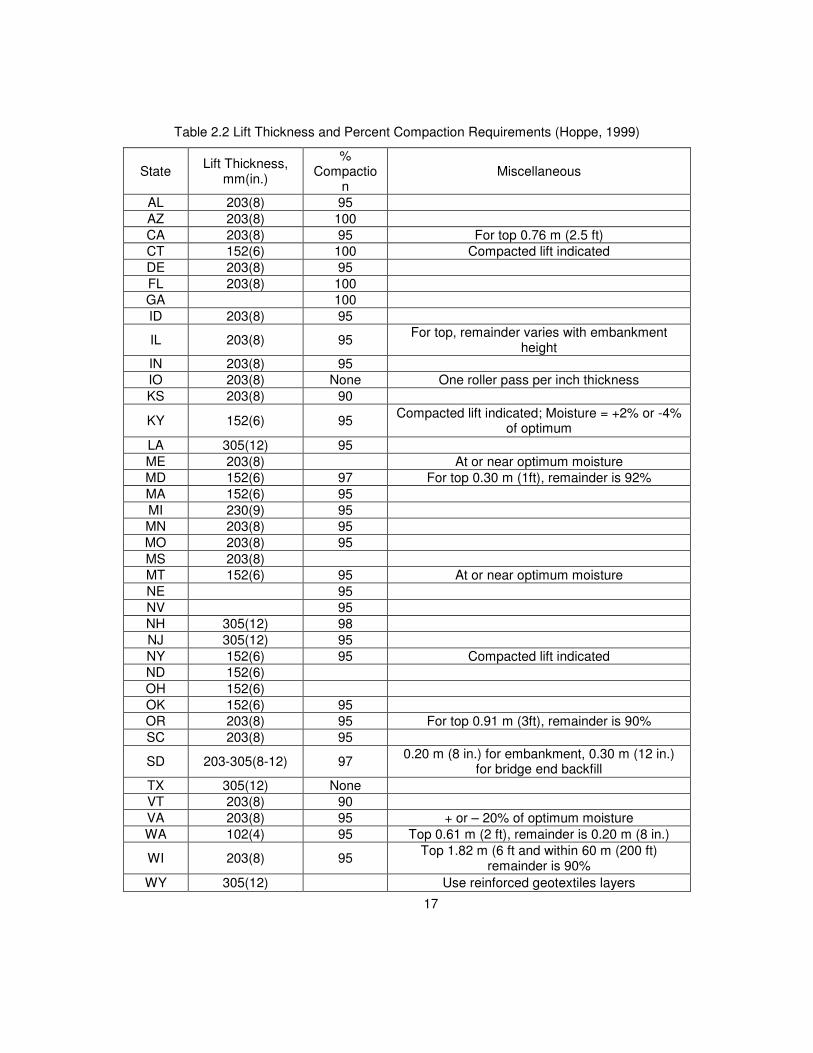
Table 2.2 Lift Thickness and Percent Compaction Requirements (Hoppe, 1999)
State Lift Thickness,
mm(in.)
% Compactio
n Miscellaneous
AL 203(8) 95 AZ 203(8) 100 CA 203(8) 95 For top 0.76 m (2.5 ft) CT 152(6) 100 Compacted lift indicated DE 203(8) 95 FL 203(8) 100 GA 100 ID 203(8) 95
IL 203(8) 95 For top, remainder varies with embankment
height IN 203(8) 95 IO 203(8) None One roller pass per inch thickness KS 203(8) 90
KY 152(6) 95 Compacted lift indicated; Moisture = +2% or -4%
of optimum
LA 305(12) 95 ME 203(8) At or near optimum moisture MD 152(6) 97 For top 0.30 m (1ft), remainder is 92% MA 152(6) 95 MI 230(9) 95 MN 203(8) 95 MO 203(8) 95 MS 203(8) MT 152(6) 95 At or near optimum moisture NE 95 NV 95 NH 305(12) 98 NJ 305(12) 95 NY 152(6) 95 Compacted lift indicated ND 152(6) OH 152(6) OK 152(6) 95 OR 203(8) 95 For top 0.91 m (3ft), remainder is 90% SC 203(8) 95
SD 203-305(8-12) 97 0.20 m (8 in.) for embankment, 0.30 m (12 in.)
for bridge end backfill
TX 305(12) None VT 203(8) 90 VA 203(8) 95 + or – 20% of optimum moisture WA 102(4) 95 Top 0.61 m (2 ft), remainder is 0.20 m (8 in.)
WI 203(8) 95 Top 1.82 m (6 ft and within 60 m (200 ft)
remainder is 90%
WY 305(12) Use reinforced geotextiles layers
18
From the same study by Hoppe (1999), two other conclusions can be further drawn
from Table 2.2 above. First, in many states, a 95% of the standard proctor test compaction
condition is generally specified for the compaction of approach fill.
Second, the approach fill material is normally constructed at a lift thickness of 8 in. In
Texas, a loose thickness of 12 in. compacted to 8 in. of fill is commonly used and the percent
compaction is not always specified. Dupont and Allen (2002) also conducted another survey of
50 state highway agencies in the USA in order to identify the most common type of backfill
material used in the embankments near bridge approaches. Their study shows that most of the
state agencies, i.e. 38 states use granular material as the backfill; 3 states use sands; 6 states
use flowable fill; while 17 states use compacted soil in the abutment area.
A few other research studies were conducted to study the limitations of the percent fine
material used in the embankment fill. Wahls (1990) recommended that the fill materials should
have a plasticity index (PI) less than 15 with percent fines not more than 5%. The FHWA (2000)
recommended backfill materials with less than 15% passing the No. 200 sieve. Another
recommendation of the backfill material by Seo (2003) specifies the use of a backfill material
with a plasticity index (PI) less than 15, with less than 20 percent passing the No. 200 sieve and
with a coefficient of uniformity greater than 3. This fill material is recommended to be used
within 100 ft of the abutment.
For the density requirements, Wahls (1990) suggested two required density values; one
for roadway embankments and the other for bridge approaches. For embankment material, the
recommended compaction density is 90 to 95 percent of maximum dry density from the
AASHTO T-99 test method, while the density for the bridge approach fill material is
recommended from 95 to 100 percent of maximum dry density from the AASHTO T-99 test
method. Wahls (1990) also stated that well-graded materials with less than 5% passing the

19
No. 200 sieve are easy to be compacted and such material can minimize post construction
compression of the backfill and can eliminate frost heave problems.
Seo (2003) suggested that the embankment and the backfill materials within the 100
foot-length from the abutment should be compacted to 95% density of the modified proctor test.
White et al. (2005) also recommended the same compaction of 95% of the modified proctor
density for the backfill. White et al. (2005) also used a Collapse Index (CI) as a parameter to
identify an adequacy of the backfill material in their studies. The CI is an index, which
measures the change in soil volume as a function of placement water content. It was found that
materials placed at moisture contents in the bulking range from 3% to 7% with a CI value up to
6% meet the Iowa DOT specifications for granular backfills.
In the current TxDOT Bridge Design Manual (2001), the approach slab should be
supported by the abutment backwall and the approach backfill. Therefore, the backfill materials
become a very important aspect in an approach embankment construction. As a result, the
placement of a Cement Stabilized Sand (CSS) “wedge” in the zone behind the abutment is
currently practiced by TxDOT. The placement of the CSS “wedge” in the zone behind the
abutment is to solve the problems experienced while compacting the fill material right behind
the abutment. This placement also provides a resistance to the moisture gain and loss of
material, which are commonly experienced under approach slabs. The use of CSS has become
standard practice in several Districts and has shown good results according to the TxDOT
manual.
Apart from the embankment backfill material and construction specifications, the other
alternatives, such as using flowable fills (low strength and flowable concrete mixes) as backfill
around the abutment, wrapping layers of backfill material with Geosynthetic or grouting have
also been employed to solve the problem of the excessive settlements induced by the
embankment. The use of these construction materials and new techniques increases
20
construction costs inevitably. However, the increased costs can be balanced by the benefits
obtained by less settlement problems. For example, the use of Geosynthetic can prevent
infiltration of backfill into the natural soil, resistance against lateral movements and improves the
quality of the embankment (Burke, 1987).
Another concept to reduce the vertical loading or stress exerted by the embankment on
the foundation subsoil is the use of lightweight material as an embankment fill material. The
reduction of embankment weight or load increases the stabilities of the embankment and also
reduces the compression on the underlying foundation soil. As a result, the settlement potential
of the embankment will be decreased.
The lightweight fills such as lightweight aggregate, expanded polystyrene, lightweight
concrete, or others can be used to achieve this benefit (Luna et al., 2004, Dupont and Allen,
2002, Mahmood, 1990). Based on the surveys conducted by Hoppe (1999) approximately 27%
of responding DOTs have already experimented with the use of non-soil materials behind bridge
abutments.
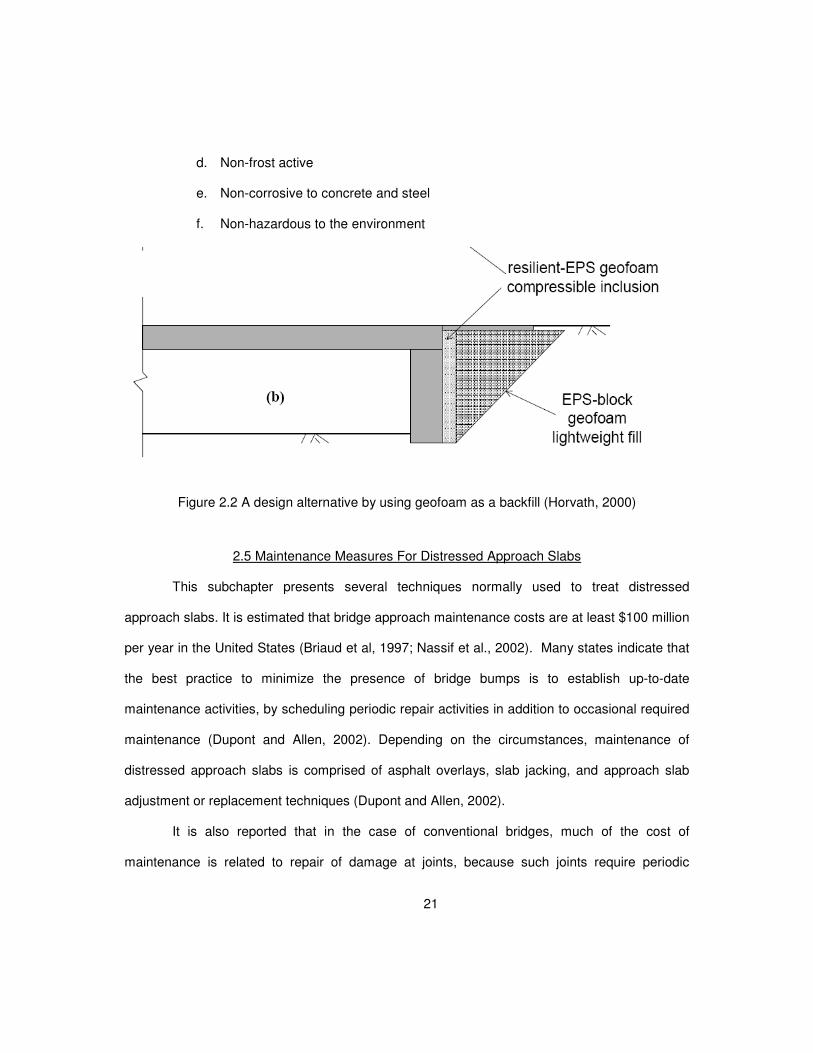
Horvath (2000) recommended the use of Geofoam as a light weight compressible fill
material (Figure 2.2). Other materials could be used as alternative lightweight backfill material;
some of these alternative construction materials included shredded tires and expanded
polystyrene. However, it must be kept in mind that the suitable fill material must not have only
the lightweight property, but it must have other required properties, such as, high strength, high
stiffness and low compressibility properties.
Hartlen (1985) listed some satisfactory requirements for the lightweight fill material as
follows;
a. Bulk density less than 63 pcf. (1000 kg/m3)
b. High modulus of elasticity and high angle of internal friction
c. Good stability and resistance against crushing and chemical deterioration
21
d. Non-frost active
e. Non-corrosive to concrete and steel
f. Non-hazardous to the environment
Figure 2.2 A design alternative by using geofoam as a backfill (Horvath, 2000)
2.5 Maintenance Measures For Distressed Approach Slabs
This subchapter presents several techniques normally used to treat distressed
approach slabs. It is estimated that bridge approach maintenance costs are at least $100 million
per year in the United States (Briaud et al, 1997; Nassif et al., 2002). Many states indicate that
the best practice to minimize the presence of bridge bumps is to establish up-to-date
maintenance activities, by scheduling periodic repair activities in addition to occasional required
maintenance (Dupont and Allen, 2002). Depending on the circumstances, maintenance of
distressed approach slabs is comprised of asphalt overlays, slab jacking, and approach slab
adjustment or replacement techniques (Dupont and Allen, 2002).
It is also reported that in the case of conventional bridges, much of the cost of
maintenance is related to repair of damage at joints, because such joints require periodic
22
cleaning and replacement (Briaud, 1997, Arsoy, 1999). Other times, pavement patching at the
ends of the bridge represents most of the maintenance costs. For longer bridges, the pavement
patching lengths are longer due to problems experienced by the temperature induced cyclic
movements (Hoppe, 1999). However, Arsoy (1999) noted that Integral abutment bridges
perform well with fewer maintenance problems than conventional bridges.
Also, a periodic cleanout and maintenance schedule is required for all drainage
structures on the bridge and bridge approach system to insure proper removal of water away
from the structure and to minimize runoff infiltration into underlying fill layers (Lenke, 2006).
Most frequently, maintenance of drainage structures and joints is lacking and must be improved
in order to take full advantage of these design features (Lenke, 2006, Wu et al., 2006).
Lenke (2006) presented his study showing many cases of poor maintenance at the
expansion joints between the bridge deck, approach slab, and approach pavement, and
drainage systems, resulting in many bridge replacement and rehabilitation costs. He suggested
that to prevent stress buildup at the expansion joints between the bridge structure, the approach
slab and the pavement system, a good maintenance by cleaning and replacement (when
necessary) is required. Such stresses can not only cause damage to the deck and the
abutment, but can also cause distortions of the approach slab.
Lenke (2006) also identified another maintenance issue resulting from Alkali-Silica
Reactivity (ASR) problems. The stresses caused by ASR expansion can lead to severe damage
at the joints connecting the bridge deck to the approach slab and the approach slab to the
preceding concrete pavement. These ASR expansion stresses can cause spalling and
resultant crack widening, which regularly requires joint filling with bituminous materials work
(Lenke, 2006).
White et al. (2005) also conducted a comprehensive study in a case of lack of
maintenance of drainage structures, such as clogged or blocked drains, animal interaction, and
23
deterioration of joint fillers, gutters and channels. The study showed that due to the lack of
maintenance many problems about maintenance occurred, resulting in numerous and costly
repair operations. White et al. (2005) also pointed out some potential causes of bridge
approach settlement discovered during the maintenance activities. For example, they
mentioned that the loose and not properly compacted backfill materials can cause poorly
performing approach slabs. Coring operations revealed that voids are highest near the bridge
abutment and decreased with distance with void sizes ranging from 0.5 in. to 12 in. Snake
cameras used at sub-drain outlets demonstrated that most of the investigated sub drains were
not functioning properly. The sub drains were either dry with no evidence of water or blocked
with soil fines and debris or had collapsed. Some of these problems are attributed to erosion
induced movements in the fill material from moisture infiltration. This signifies the need for
constant maintenance of joints and drains so that infiltration into the soil layers will be low.
Along with the maintenance, reconstruction or rehabilitation of distressed approach slabs are
very necessary.
Several soil stabilization techniques were found in the literature to stabilize the fill under
the approach slab. These techniques are intended to smooth the approaches by raising the
sleeper slab and approaches, especially if application of an asphalt overlay is not feasible (Abu-
Hejleh et al., 2006). The most important techniques are pressure grouting under the slab, slab-
jacking or mud-jacking technique, the Urethane method, and compaction or high pressure
grouting. Most of these techniques are often used as remedial measures after problems are
detected. However, the same could be applied even in new bridge constructions. A brief
overview of these methods is presented below.
2.5.1 Replacement Method
Highly deteriorated approach slabs due to the formation of a bump are mostly replaced
with the new approach slabs. This process is the most expensive and time taking process as
24
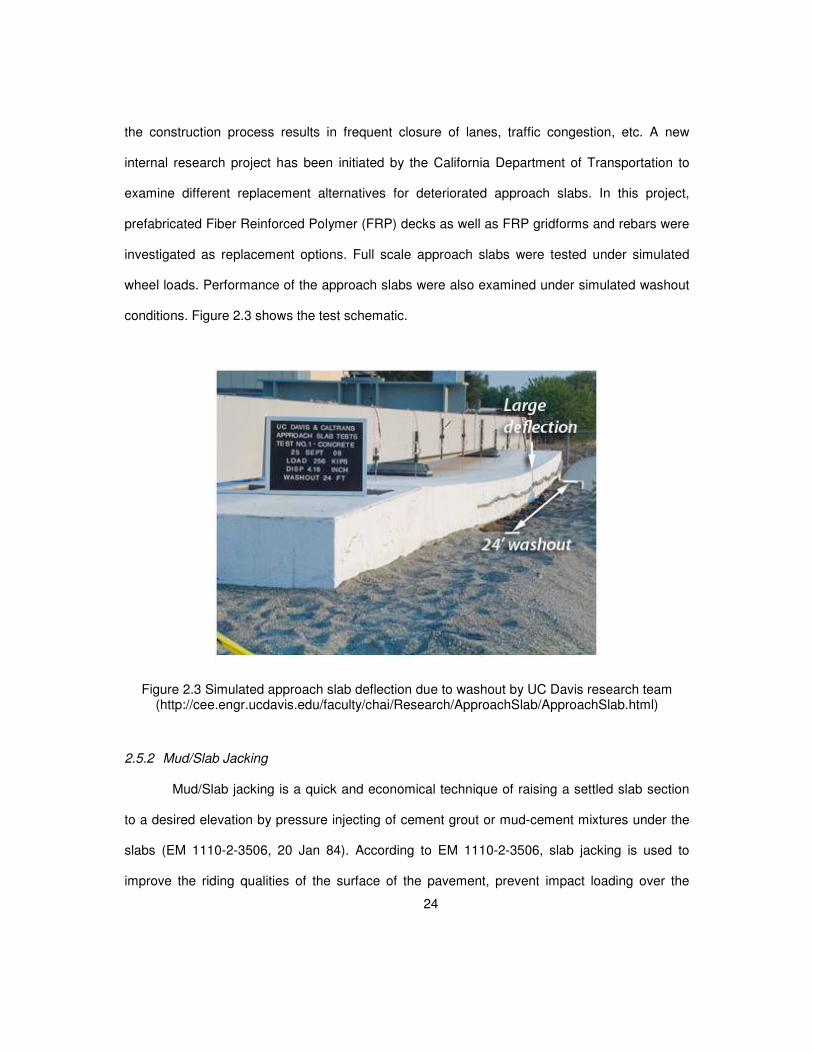
the construction process results in frequent closure of lanes, traffic congestion, etc. A new
internal research project has been initiated by the California Department of Transportation to
examine different replacement alternatives for deteriorated approach slabs. In this project,
prefabricated Fiber Reinforced Polymer (FRP) decks as well as FRP gridforms and rebars were
investigated as replacement options. Full scale approach slabs were tested under simulated
wheel loads. Performance of the approach slabs were also examined under simulated washout
conditions. Figure 2.3 shows the test schematic.
Figure 2.3 Simulated approach slab deflection due to washout by UC Davis research team (http://cee.engr.ucdavis.edu/faculty/chai/Research/ApproachSlab/ApproachSlab.html)
2.5.2 Mud/Slab Jacking
Mud/Slab jacking is a quick and economical technique of raising a settled slab section
to a desired elevation by pressure injecting of cement grout or mud-cement mixtures under the
slabs (EM 1110-2-3506, 20 Jan 84). According to EM 1110-2-3506, slab jacking is used to
improve the riding qualities of the surface of the pavement, prevent impact loading over the
25
irregularities by fast-moving traffic, correct faulty drainage, prevent pumping at transverse joints,
lift or level other structures, and prevent additional settlement.
In this method, the mud grout is prepared using the topsoil which is free from roots,
rocks and debris mixed with cement and enough water to produce a thick grout. This grout is
injected to fill the void spaces underneath the approach slab through grout holes made through
the approach slabs (Bowders et al, 2002). The injection is performed in a systematic manner to
avoid cracks on the approach slab as shown in Figure 2.4. Precautionary measures need to be
taken near to side retaining walls and abutment walls (Luna et al., 2004).
Even though this technique has been successfully adopted by several states including
Kentucky, Missouri, Minnesota, North Dakota, Oklahoma, Oregon, and Texas for lifting the
settled approach slabs, the mud/slab jacking can be quite expensive. Mud jacking may also
cause drainage systems next to the abutment to become clogged, and is difficult sometimes to
control the placement of the material (Dupont and Allen, 2002). Other difficulties including
limited spread of grout into voids, large access holes which must be filled and lack of sufficient
procedural process made this technique as uneconomical (Soltesz, 2002). Abu al-Eis and
LaBarca, (2007) reported that the cost of this technique was between $40 and $60 per one
square yard of pavement used based on two test sections constructed in Columbia and Dane
counties in Wisconsin.

26
Figure 2.4 Mud-jacking injection sequences (MoDOT, EPC)
2.5.3 Grouting
2.5.3.1 Pressure grouting under the slab
The presence of voids beneath the approach slab can lead to instability, cracking,
sinking and pounding problems (Abu-Hejleh et al., 2006). In order to mitigate the problem,
pressure grouting is commonly used for bridge approach maintenance practice as a preventive
measure (White et al., 2005 and 2007). Pressure grouting under the slab is used to fill the voids
beneath the approach slab through injection of flowable grout, without raising the slab (Abu-
Hejleh et al., 2006).
According to White et al. (2007), under sealing the approach slab by pressure grouting
normally has two operations within the first year after completion of approach pavement
construction. The first operation is done within the first 2–6 months, while the second one is
employed within 6 months after the first under sealing. The grout mix design consists of Type 1
Portland cement and Class C fly ash at a ratio of 1:3. Water is also added in the grouting
material to achieve the specified fluidity (Buss, 1989). Moreover, in order to avoid the lifting of
the approach slab, grout injection pressures are kept to less than 35 kPa (White et al., 2007).
27
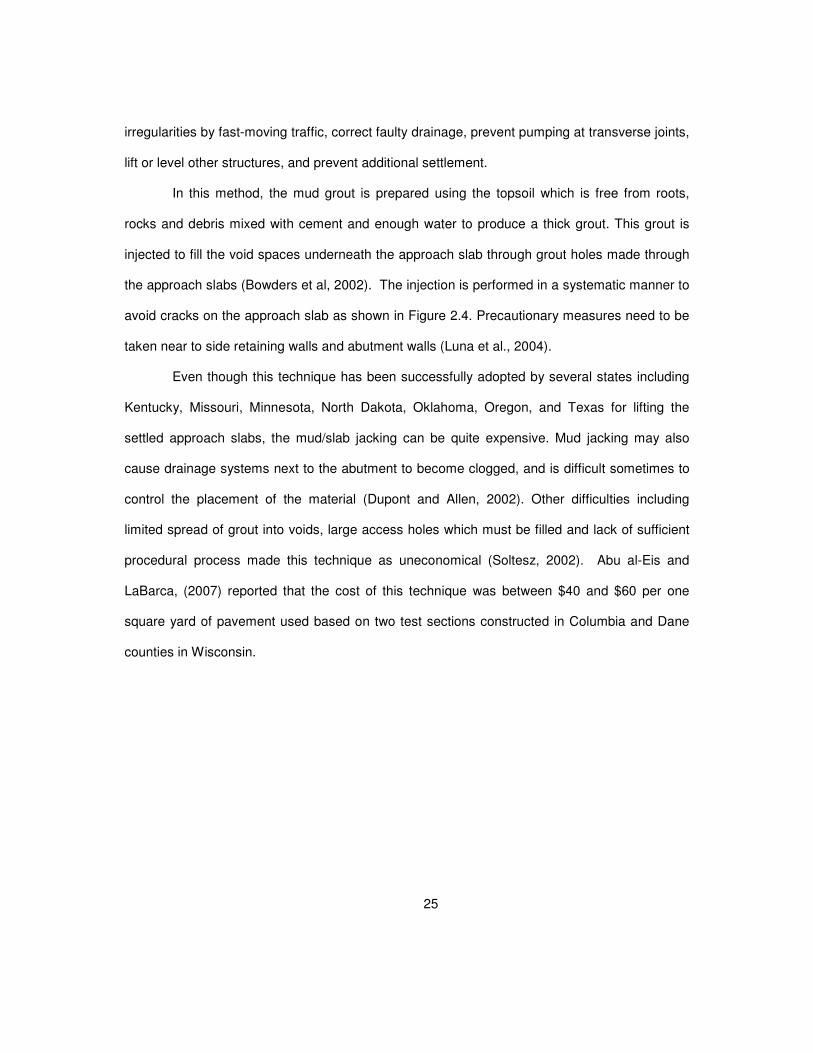
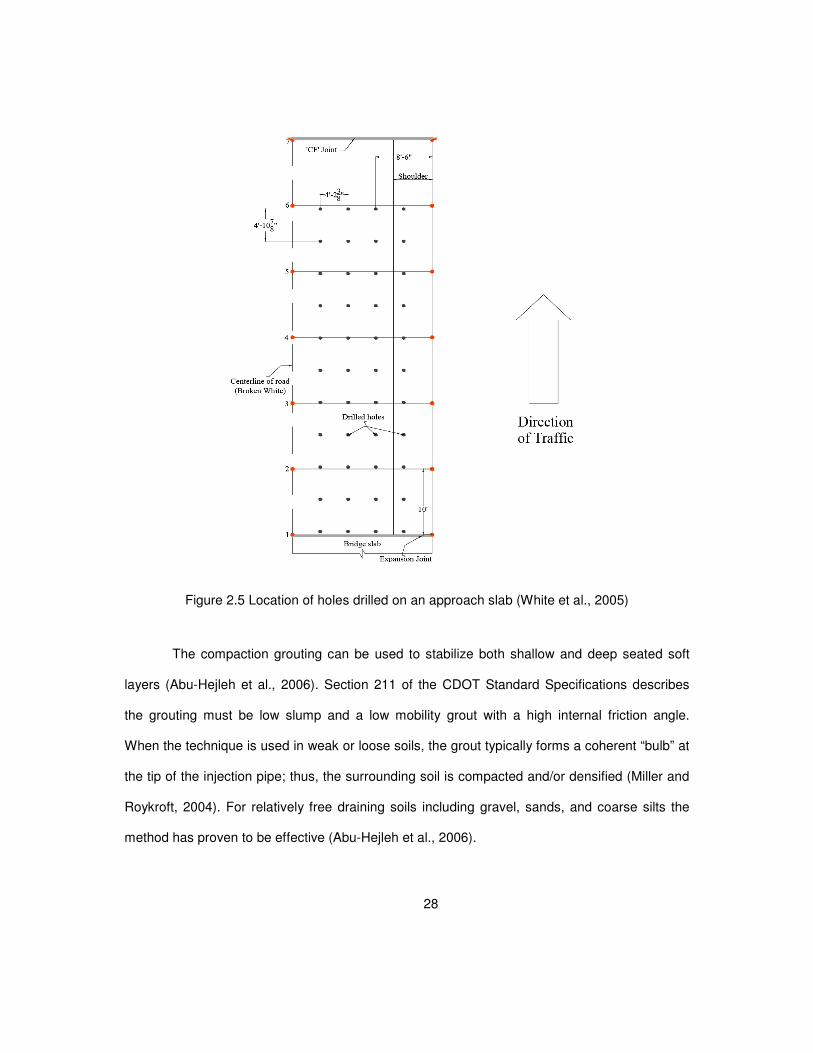
Abu-Hejleh et al. (2006) stated that the construction techniques for this method are to
drill 1-7/8" holes through the concrete or asphalt approach slabs using a rectangular spacing as
shown in Figure 2.5. The depth is determined by the ease of driving the stinger or outlet tube,
which is pounded into the hole (Abu-Hejleh et al., 2006). A fence post pounder is used to
hammer the stinger and extension pieces into the soil (Abu-Hejleh et al., 2006). As the stinger
is pounded down, the operator can determine if the soil is loose or soft and if there are voids
under the slab.
Although grouting under the approach slab is commonly used for bridge approach
settlement as a mitigation method, White et al. (2007) stated that the grouting is not a long term
solution for this problem. The grouting does not prevent further settlement or loss of backfill
material due to erosion (White et al., 2005 and 2007).
2.5.3.2 Compaction or High Pressure Grouting
Compaction grouting is a method for improving soil by densifying loose and liquefaction
soils and resulting in increasing the soil strength (Miller and Roykroft, 2004). The compaction
grouting is a physical process, involving pressure-displacement of soils with stiff, low-mobility
sand-cement grout (Strauss et al., 2004).
According to the ASCE Grouting Committee (1980), the grout generally does not enter
the soil pores but remains as a homogenous mass that gives controlled displacement to
compact loose soils, gives controlled displacement for lifting of structures, or both. The FHWA
(1998) also stated that apart from soil densification, the compaction grouting is also employed to
lift and level the approach slab and adjacent roadways.
28
Figure 2.5 Location of holes drilled on an approach slab (White et al., 2005)
The compaction grouting can be used to stabilize both shallow and deep seated soft
layers (Abu-Hejleh et al., 2006). Section 211 of the CDOT Standard Specifications describes
the grouting must be low slump and a low mobility grout with a high internal friction angle.
When the technique is used in weak or loose soils, the grout typically forms a coherent “bulb” at
the tip of the injection pipe; thus, the surrounding soil is compacted and/or densified (Miller and
Roykroft, 2004). For relatively free draining soils including gravel, sands, and coarse silts the
method has proven to be effective (Abu-Hejleh et al., 2006).
29
2.5.3.3 Urethane Injection Technique
The Urethane injection technique was first developed in 1975 in Finland to lift and under
seal concrete pavements and subsequently adopted in several US States in lifting concrete
pavements (Abu al-Eis and LaBarca, 2007). In this process, a resin manufactured from high
density polyurethane is injected through grout holes (5/8 inch diameter) made through the
approach slab to lift, fill the voids and to under seal the slab (Abu al-Eis and LaBarca, 2007).
The injected resin will gain 90% of its maximum compressive strength (minimum compressive
strength is 40 psi) within 15 minutes. Once the voids are filled, the grout holes are filled with
inexpansive grout material. Elevation levels are taken before and after the process to ensure
the required lifting is achieved (Abu al-Eis and LaBarca, 2007).
As reported by Abu al-Eis and LaBarca, (2007), the Louisiana Department of
Transportation successfully adopted this technique for two different bridge approaches and
observed that the international roughness index (IRI) values were reduced by 33% to 57% after
monitoring for four years. This method involves the precise liquid injection of high-density
polyurethane plastic through small (5/8") holes drilled in the sagging concrete slab (Abu al-Eis
and LaBarca, 2007). Once it is applied, the material expands to lift and stabilize the slab, while
filling voids in the underlying soil and under sealing the existing concrete (Concrete Stabilize
Technology Inc.,http://www.stableconcrete.com/uretek.html). Based on the manufacturer
provided information, this technology is simple and rapid. It can lead to a permanent solution
and also can resist erosion and compression over a time period.
Brewer et al., (1994) first evaluated the Urethane injection technique to raise bridge
approach slabs in Oklahoma. They reported that three test slabs out of six were cracked during
or after the injection and in one case, the PCC slab broke in half during the injection. The
Michigan Department of Transportation reported that this technique provided temporary increase
in base stability and improvement in ride quality for one year (Opland and Barnhart, 1995).
30
Soltesz (2002) noticed that the Urethane treatment was successful even after two years where
the injection holes are properly sealed. The Oregon Department of Transportation researchers
reported that the Urethane material was able to penetrate holes with diameters as small as 1/8 in.
and which was added advantage of this technique to fill the minor pores of the subbase and lift
the pavement slabs (Soltesz, 2002).
Abu al-Eis and LaBarca, (2007) reported that the cost of this technique was between
$6 to $7 per pound of foam used which was calculated based on two test sections constructed
in Columbia and Dane counties in Wisconsin. They summarized the cost comparison of this
technique with other slab lifting methods (as shown in Table 2.3) and concluded that this
technique is expensive when compared to other methods if calculated based on direct costs.
They also reported that this technique is very fast and can open the lanes for traffic immediately
after the treatment. The amount of urethane resin used in each project is also questionable as
this quantity is directly used in the cost analysis. Considering this fact, TXDOT amended its
Special Specification 3043-001 which requires a Special Provision for determining the quantity
of polymer resin used for “Raising and Undersealing Concrete Slabs”. Regarding the Special
Specification 3043-001, the quantity of the resin utilized will be calculated by one of the
following methods:
Payment will be made according to the actual quantity of polymer resin used in the work
by determining the weight of material placed by measuring the depth of polymer resin in the
holding tanks before and after each day’s work. A Professional Engineer and a site engineer
must approve the calculation method which is based on the certified measured volume of each
tank and the unit weight of each component to determine the weight of resins used in the work.
31
Table 2.3 Cost Comparison for Four Slab Faulting Repair Methods (Abu al-Eis and LaBarca, 2007)
Location Method Total Cost Cost per yd2 Days to Complete
URETEK $19,440 $243 0.75 Slab Replacement $34,000 $425 3
HMA Overlay $3,630 $45 1
I-30
(80 yd2)
Mud-jacking $3,000 $38 1
URETEK $6,260 $117 0.5 Slab Replacement $22,670 $425 3
HMA Overlay $3,375 $63 1
USH 14
(53.4 yd2)
Mud-jacking $3,000 $56 1
Several Districts in Texas use this method as a remediation method and based on the
present research contacts, these methods are deemed effective. Several Houston sites visited
were repaired utilizing this injection method ten years ago and they are still functioning
adequately. The work reported in the Houston District was instrumental in the development of
the TxDOT Special Specification for the use of the urethane injection method for lifting the
distressed approach slabs.
2.5.3.4 Flowable fill
Flowable fill or controlled low-strength material is defined by ACI Committee 229 as a self-
compacting, cementitious material used primarily as a backfill in lieu of compacted fill. The flowable
fill has other common names, such as, unshrinkable fill, controlled density fill, flowable mortar,
flowable fill, plastic soil-cement and soil-cement slurry (Du et al., 2006). This controlled low-strength
filling material is made of cement, fly ash, water, sand, and typically an air-entraining admixture
(NCHRP, 597). A significant requisite property of flowable fill is the self-leveling ability, which allows
it to flow; no compaction is needed to fill voids and hard-to-reach zones (Abu-Hejleh et al., 2006).
Therefore, the flowable fill is commonly used in the backfill applications, utility bedding, void fill and
bridge approaches (Du et al., 2006).
The primary purpose of using flowable fill is as a backfill behind the abutment. CDOT
has used the flowable fill backfill behind the abutment wall in an effort to reduce the approach
32
settlements since 1992 (Abu-Hejleh et al., 2006). The other new applications for the flowable fill
are for use as a sub base under bridge approaches and a repair work of the approaches (Du et
al., 2006). Historically, the application of using flowable fill as a sub base was first employed in
Ohio by ODOT (Brewer, 1992).
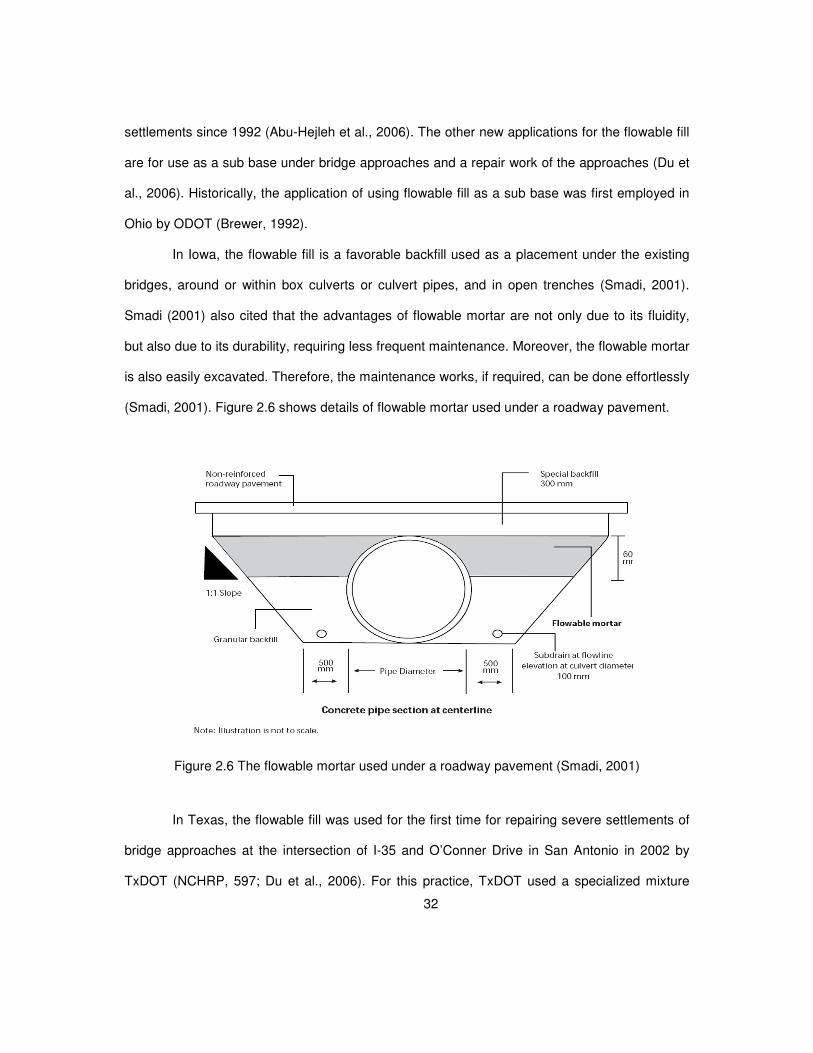
In Iowa, the flowable fill is a favorable backfill used as a placement under the existing
bridges, around or within box culverts or culvert pipes, and in open trenches (Smadi, 2001).
Smadi (2001) also cited that the advantages of flowable mortar are not only due to its fluidity,
but also due to its durability, requiring less frequent maintenance. Moreover, the flowable mortar
is also easily excavated. Therefore, the maintenance works, if required, can be done effortlessly
(Smadi, 2001). Figure 2.6 shows details of flowable mortar used under a roadway pavement.
Figure 2.6 The flowable mortar used under a roadway pavement (Smadi, 2001)
In Texas, the flowable fill was used for the first time for repairing severe settlements of
bridge approaches at the intersection of I-35 and O’Conner Drive in San Antonio in 2002 by
TxDOT (NCHRP, 597; Du et al., 2006). For this practice, TxDOT used a specialized mixture
33
using flowable fill, which consisted of sand, flyash and water; no cement (Williammee, 2008).
The compressive strength of cored samples indicated that the long-term strength and rigidity of
the flowable fill were strong enough to serve this purpose (NCHRP, 597). After the mixture
proportions were adjusted to have adequate flowability for the application, the flowable fill has
shown a great success for repairing the approaches (Du et al., 2006 and Williammee, 2008).
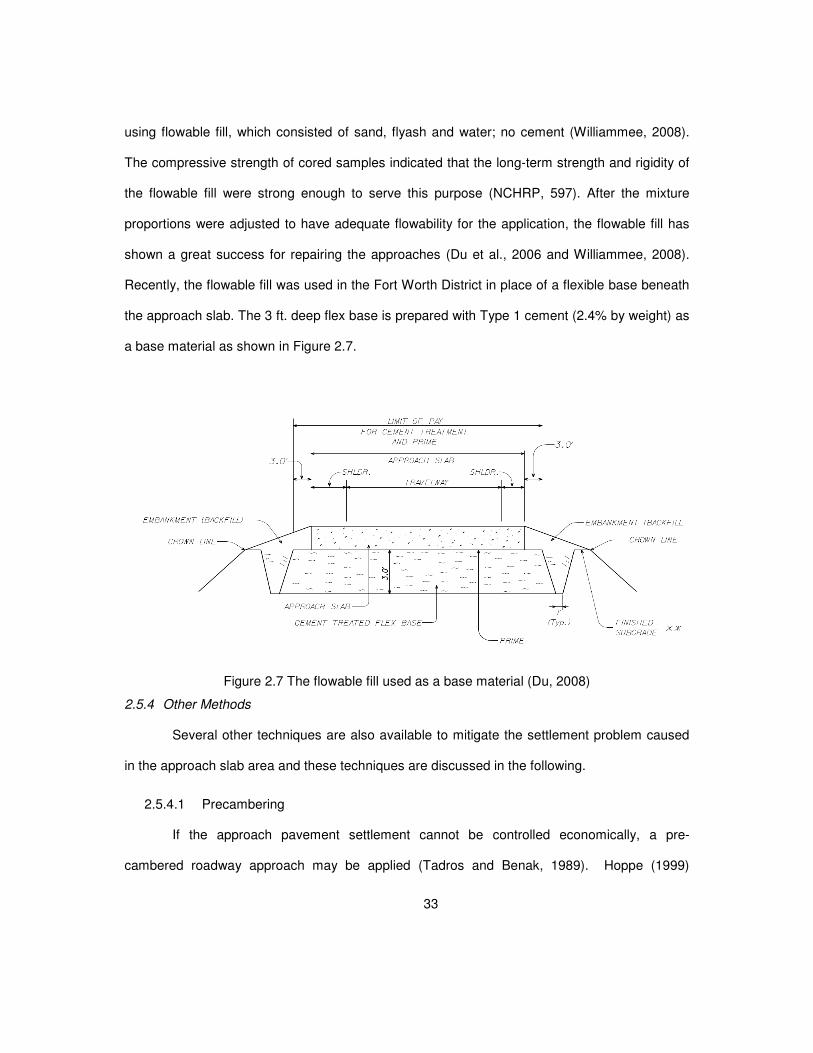
Recently, the flowable fill was used in the Fort Worth District in place of a flexible base beneath
the approach slab. The 3 ft. deep flex base is prepared with Type 1 cement (2.4% by weight) as
a base material as shown in Figure 2.7.
Figure 2.7 The flowable fill used as a base material (Du, 2008)
2.5.4 Other Methods
Several other techniques are also available to mitigate the settlement problem caused
in the approach slab area and these techniques are discussed in the following.
2.5.4.1 Precambering
If the approach pavement settlement cannot be controlled economically, a pre-
cambered roadway approach may be applied (Tadros and Benak, 1989). Hoppe (1999)
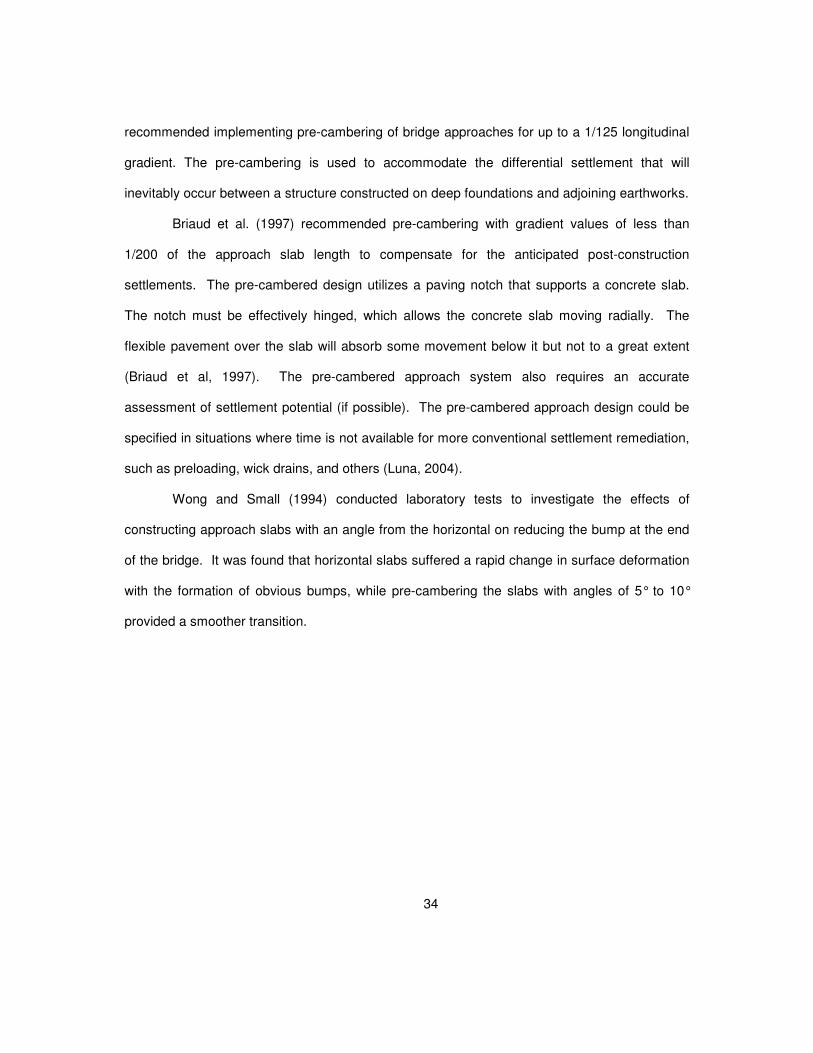
34
recommended implementing pre-cambering of bridge approaches for up to a 1/125 longitudinal
gradient. The pre-cambering is used to accommodate the differential settlement that will
inevitably occur between a structure constructed on deep foundations and adjoining earthworks.
Briaud et al. (1997) recommended pre-cambering with gradient values of less than
1/200 of the approach slab length to compensate for the anticipated post-construction
settlements. The pre-cambered design utilizes a paving notch that supports a concrete slab.
The notch must be effectively hinged, which allows the concrete slab moving radially. The
flexible pavement over the slab will absorb some movement below it but not to a great extent
(Briaud et al, 1997). The pre-cambered approach system also requires an accurate
assessment of settlement potential (if possible). The pre-cambered approach design could be
specified in situations where time is not available for more conventional settlement remediation,
such as preloading, wick drains, and others (Luna, 2004).
Wong and Small (1994) conducted laboratory tests to investigate the effects of
constructing approach slabs with an angle from the horizontal on reducing the bump at the end
of the bridge. It was found that horizontal slabs suffered a rapid change in surface deformation
with the formation of obvious bumps, while pre-cambering the slabs with angles of 5° to 10°
provided a smoother transition.
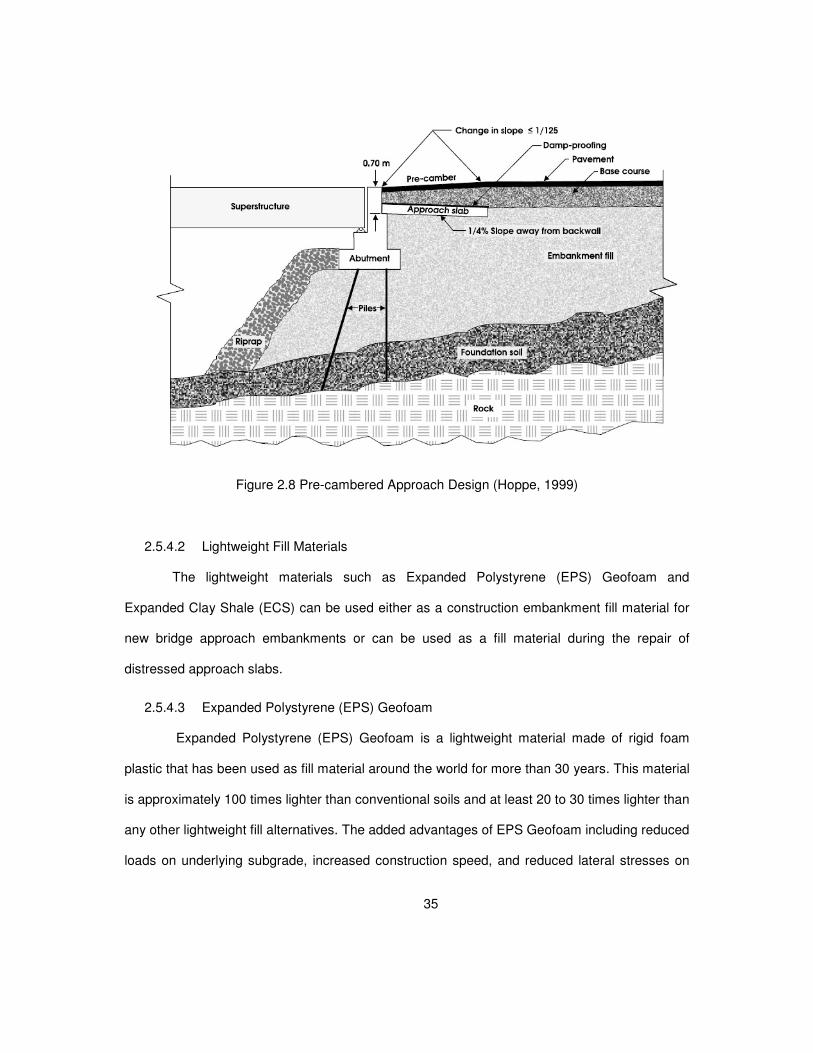
35
Figure 2.8 Pre-cambered Approach Design (Hoppe, 1999)
2.5.4.2 Lightweight Fill Materials
The lightweight materials such as Expanded Polystyrene (EPS) Geofoam and
Expanded Clay Shale (ECS) can be used either as a construction embankment fill material for
new bridge approach embankments or can be used as a fill material during the repair of
distressed approach slabs.
2.5.4.3 Expanded Polystyrene (EPS) Geofoam
Expanded Polystyrene (EPS) Geofoam is a lightweight material made of rigid foam
plastic that has been used as fill material around the world for more than 30 years. This material
is approximately 100 times lighter than conventional soils and at least 20 to 30 times lighter than
any other lightweight fill alternatives. The added advantages of EPS Geofoam including reduced
loads on underlying subgrade, increased construction speed, and reduced lateral stresses on
36
retaining structures has increased the adoptability of this material to many highway construction
projects. More than 20 State DOTs including Minnesota, New York, Massachusetts, and Utah
adopted the EPS Geofoam to mitigate the differential settlement at the bridge abutments, slope
stability, alternate construction on fill for approach embankments and reported high success in
terms of ease and speed in construction, and reduced total project costs.
Lightweight EPS Geofoam was used as an alternate fill material at Kaneohe
Interchange in Oahu, Hawaii while encountering a 6m thick layer of very soft organic soil during
construction. 17,000 m3 of EPS Geofoam was used to support a 21 m high embankment
construction (Mimura and Kimura, 1995). They reported the efficiency of the material in
reducing the pre- and post-construction settlements. Figure 2.9 shows the construction of the
embankment with the EPS Geofoam.
Figure 2.9 Emergency Ramp and High Embankment constructed using EPS Geofoam at Kaneohe interchange in Oahu, Hawaii
2.6 Summary
This chapter presented a thorough review of the literature review on settlement at the
bridge approach. The definition of the settlement at the bridge approach problem is firstly
presented following with the magnitude of the bump tolerance. Afterward, major mechanisms
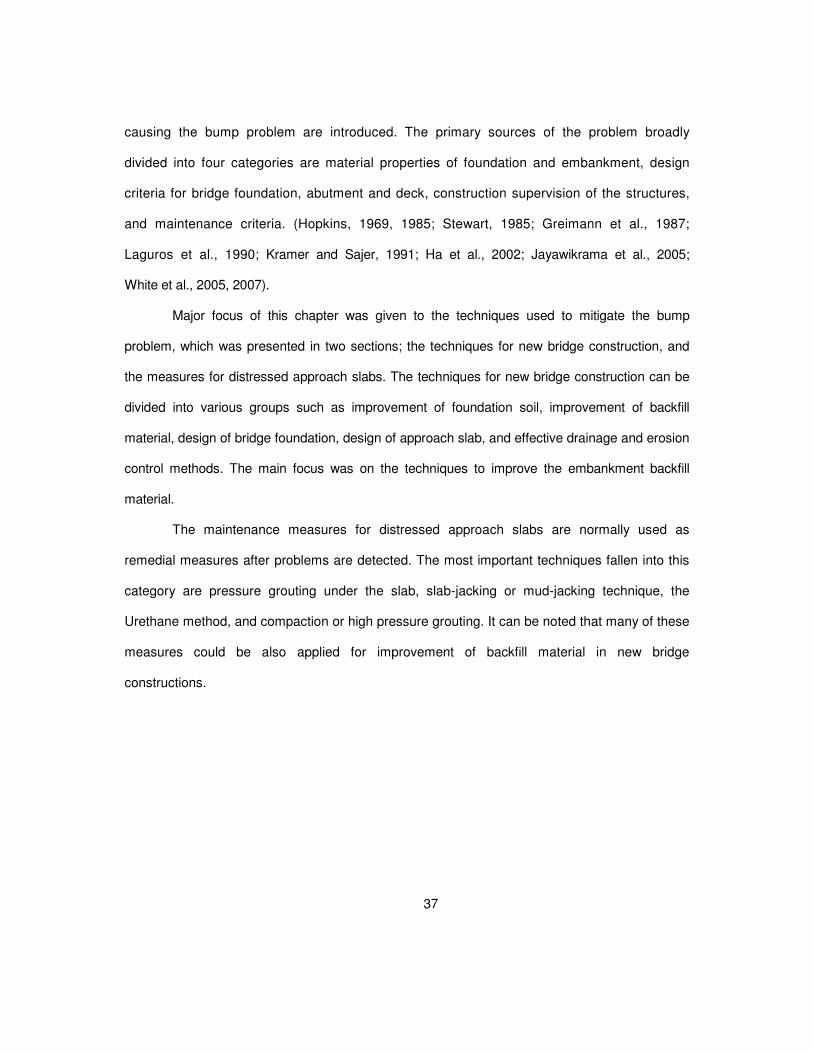
37
causing the bump problem are introduced. The primary sources of the problem broadly
divided into four categories are material properties of foundation and embankment, design
criteria for bridge foundation, abutment and deck, construction supervision of the structures,
and maintenance criteria. (Hopkins, 1969, 1985; Stewart, 1985; Greimann et al., 1987;
Laguros et al., 1990; Kramer and Sajer, 1991; Ha et al., 2002; Jayawikrama et al., 2005;
White et al., 2005, 2007).
Major focus of this chapter was given to the techniques used to mitigate the bump
problem, which was presented in two sections; the techniques for new bridge construction, and
the measures for distressed approach slabs. The techniques for new bridge construction can be
divided into various groups such as improvement of foundation soil, improvement of backfill
material, design of bridge foundation, design of approach slab, and effective drainage and erosion
control methods. The main focus was on the techniques to improve the embankment backfill
material.
The maintenance measures for distressed approach slabs are normally used as
remedial measures after problems are detected. The most important techniques fallen into this
category are pressure grouting under the slab, slab-jacking or mud-jacking technique, the
Urethane method, and compaction or high pressure grouting. It can be noted that many of these
measures could be also applied for improvement of backfill material in new bridge
constructions.

38
CHAPTER 3
3MAINTENANCE MEASURES FOR DISTRESSED APPROACH SLABS
3.1 Introduction
The bridge approach maintenance costs in the United States are estimated to be at
least $100 million per year (Briaud et al., 1997; Nassif et al., 2002). The best practice to
minimize the occurrence of bridge bumps is to establish up-to-date maintenance activities, by
scheduling periodic repair activities in addition to the required occasional maintenance (Dupont
and Allen, 2002). Hence it is important to understand the different mitigation techniques in use
to repair the distressed bridge approach slabs. This chapter presents an overview of the repair
methods adopted for treatment of settled bridge approach slabs in various districts in Texas.
Also, the results and details of the geophysical studies performed to implement a few of these
technologies are summarized.
3.2 Bridge Identification and Repair
A total of four bridges with distressed approach slabs in Texas were identified. Table
3.1 gives the identification and location of the bridges along with the mitigation technique either
adapted or proposed as a part of the present research.
Table 3.1 Distressed bridges and mitigation techniques adopted
S. No. Identification Location Mitigation Technique
Proposed
1 FM 1947 Hillsboro, Waco Dt. Urethane Injection
2 US 67/SH 174 Cleburne, Fort Worth Dt. Soil Nailing
3* SH 6 Quanah, Childress Dt. Geo Foams and Flowable
Fills
4* IH 410 San Antonio, San Antonio Dt. Flowable fills
* Repair solution recommended but not implemented
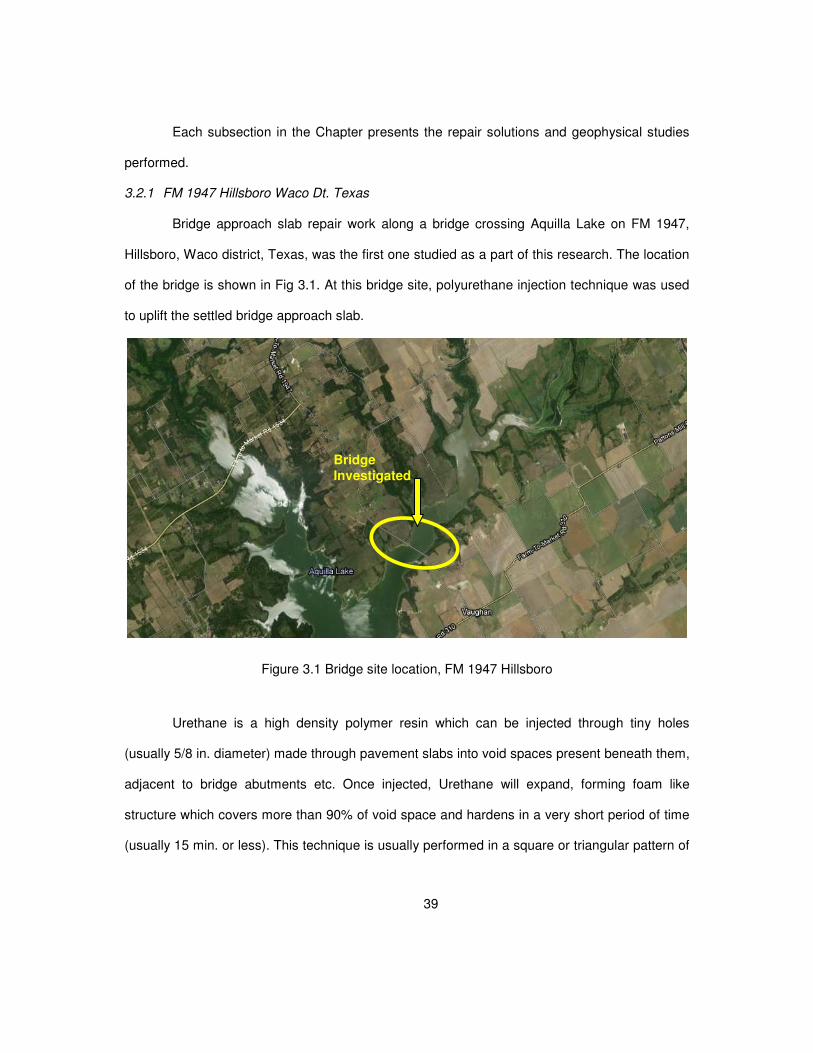
39
Each subsection in the Chapter presents the repair solutions and geophysical studies
performed.
3.2.1 FM 1947 Hillsboro Waco Dt. Texas
Bridge approach slab repair work along a bridge crossing Aquilla Lake on FM 1947,
Hillsboro, Waco district, Texas, was the first one studied as a part of this research. The location
of the bridge is shown in Fig 3.1. At this bridge site, polyurethane injection technique was used
to uplift the settled bridge approach slab.
Figure 3.1 Bridge site location, FM 1947 Hillsboro
Urethane is a high density polymer resin which can be injected through tiny holes
(usually 5/8 in. diameter) made through pavement slabs into void spaces present beneath them,
adjacent to bridge abutments etc. Once injected, Urethane will expand, forming foam like
structure which covers more than 90% of void space and hardens in a very short period of time
(usually 15 min. or less). This technique is usually performed in a square or triangular pattern of
Bridge Investigated
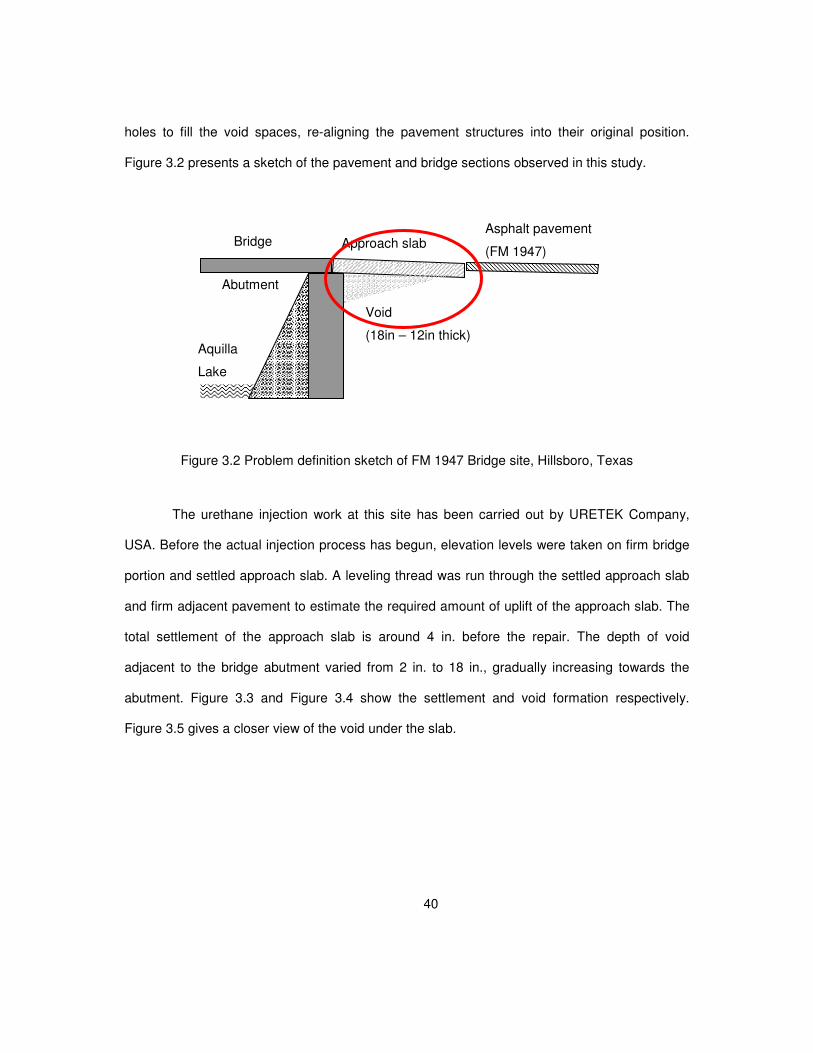
40
holes to fill the void spaces, re-aligning the pavement structures into their original position.
Figure 3.2 presents a sketch of the pavement and bridge sections observed in this study.
Figure 3.2 Problem definition sketch of FM 1947 Bridge site, Hillsboro, Texas
The urethane injection work at this site has been carried out by URETEK Company,
USA. Before the actual injection process has begun, elevation levels were taken on firm bridge
portion and settled approach slab. A leveling thread was run through the settled approach slab
and firm adjacent pavement to estimate the required amount of uplift of the approach slab. The
total settlement of the approach slab is around 4 in. before the repair. The depth of void
adjacent to the bridge abutment varied from 2 in. to 18 in., gradually increasing towards the
abutment. Figure 3.3 and Figure 3.4 show the settlement and void formation respectively.
Figure 3.5 gives a closer view of the void under the slab.
Bridge Asphalt pavement
(FM 1947) Approach slab
Void
(18in – 12in thick)
Abutment
Aquilla
Lake
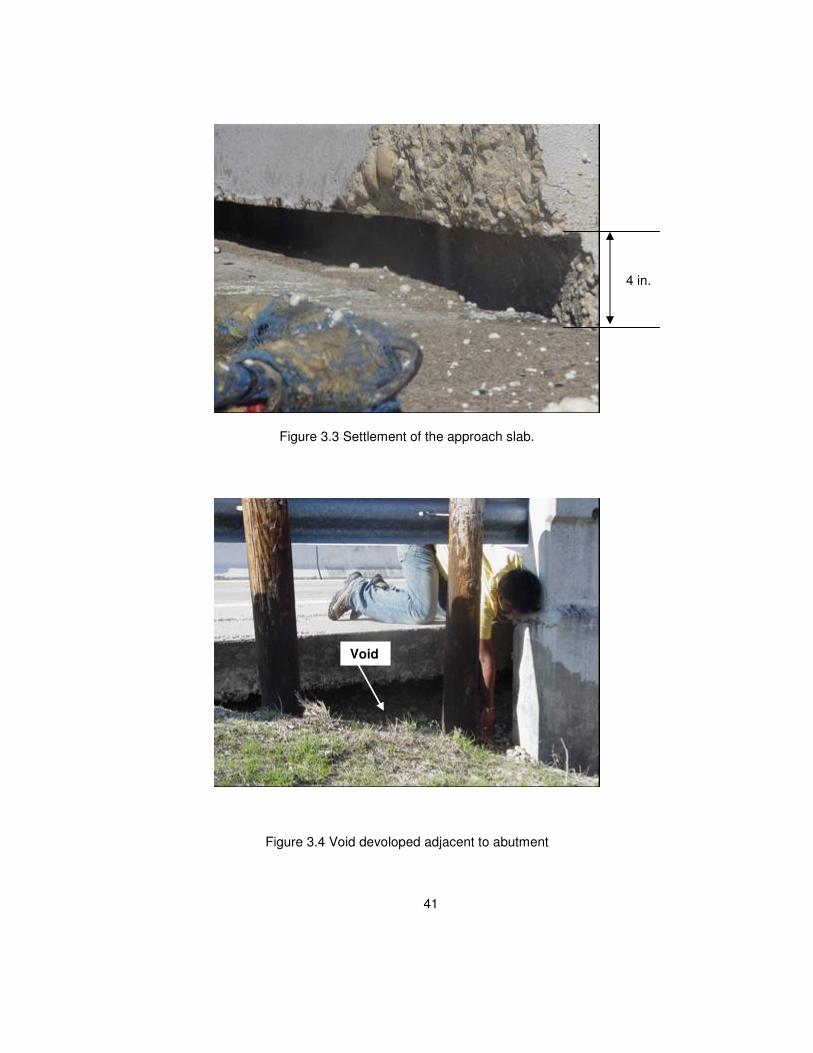
41
Figure 3.3 Settlement of the approach slab.
Figure 3.4 Void devoloped adjacent to abutment
4 in.
Void
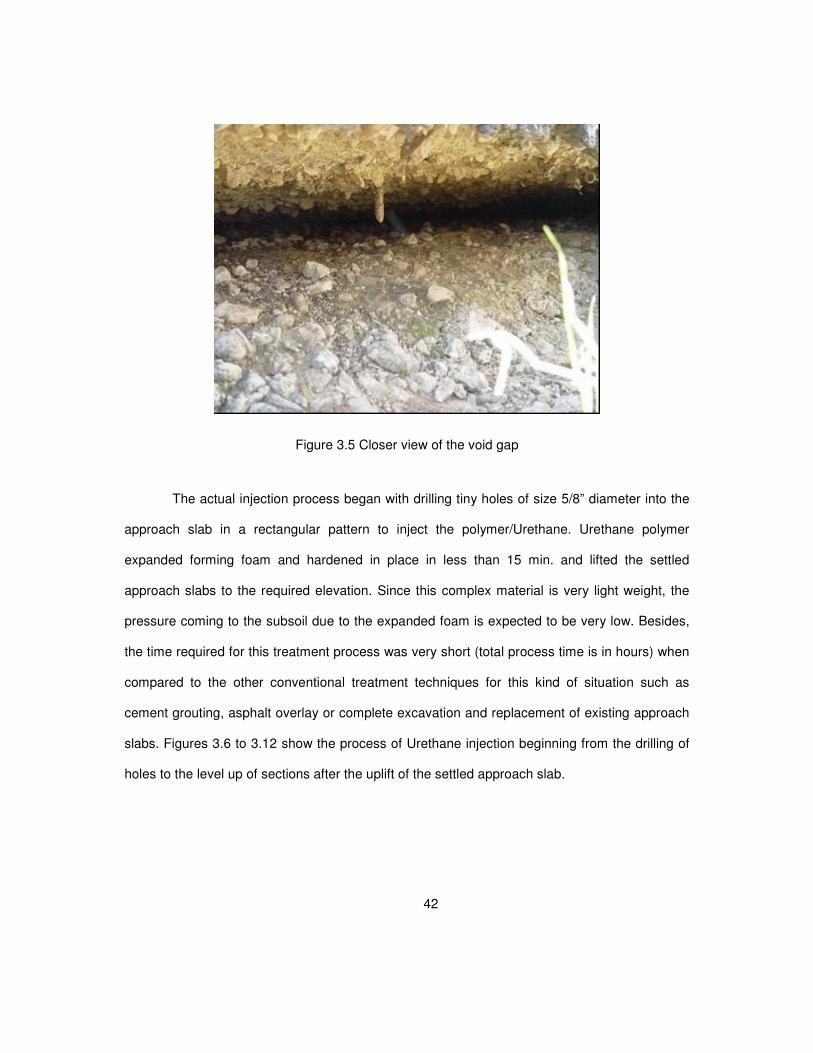
42
Figure 3.5 Closer view of the void gap
The actual injection process began with drilling tiny holes of size 5/8” diameter into the
approach slab in a rectangular pattern to inject the polymer/Urethane. Urethane polymer
expanded forming foam and hardened in place in less than 15 min. and lifted the settled
approach slabs to the required elevation. Since this complex material is very light weight, the
pressure coming to the subsoil due to the expanded foam is expected to be very low. Besides,
the time required for this treatment process was very short (total process time is in hours) when
compared to the other conventional treatment techniques for this kind of situation such as
cement grouting, asphalt overlay or complete excavation and replacement of existing approach
slabs. Figures 3.6 to 3.12 show the process of Urethane injection beginning from the drilling of
holes to the level up of sections after the uplift of the settled approach slab.
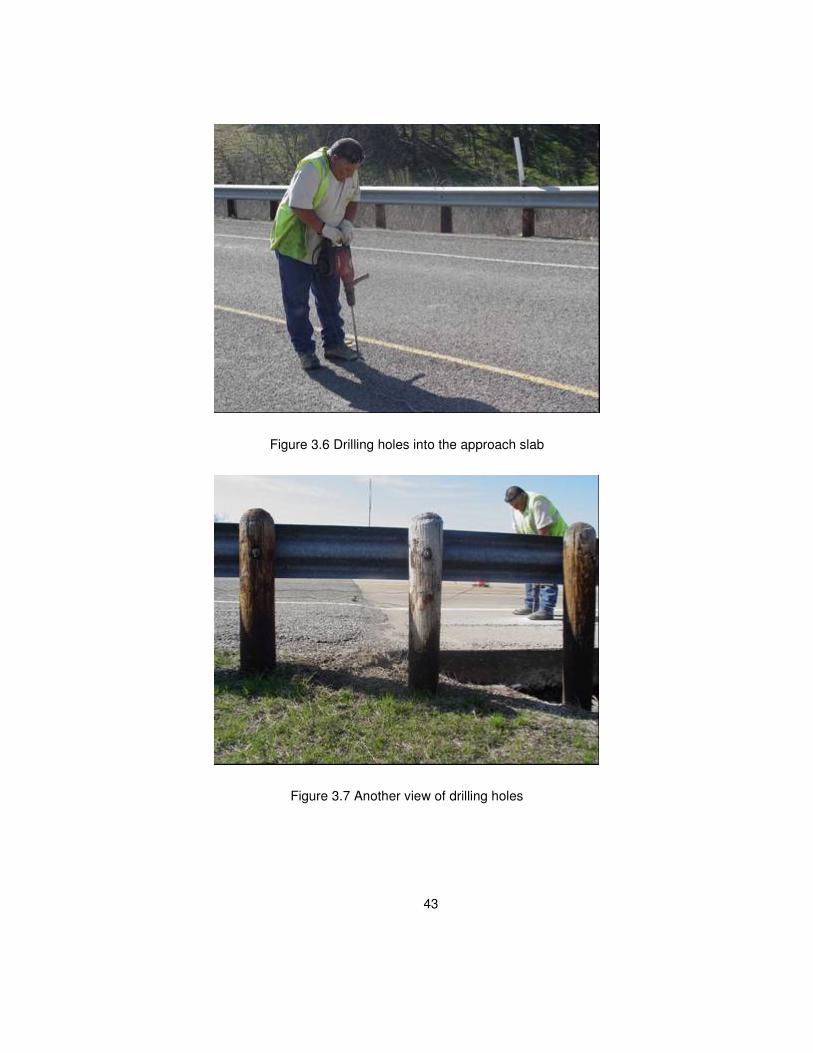
43
Figure 3.6 Drilling holes into the approach slab
Figure 3.7 Another view of drilling holes
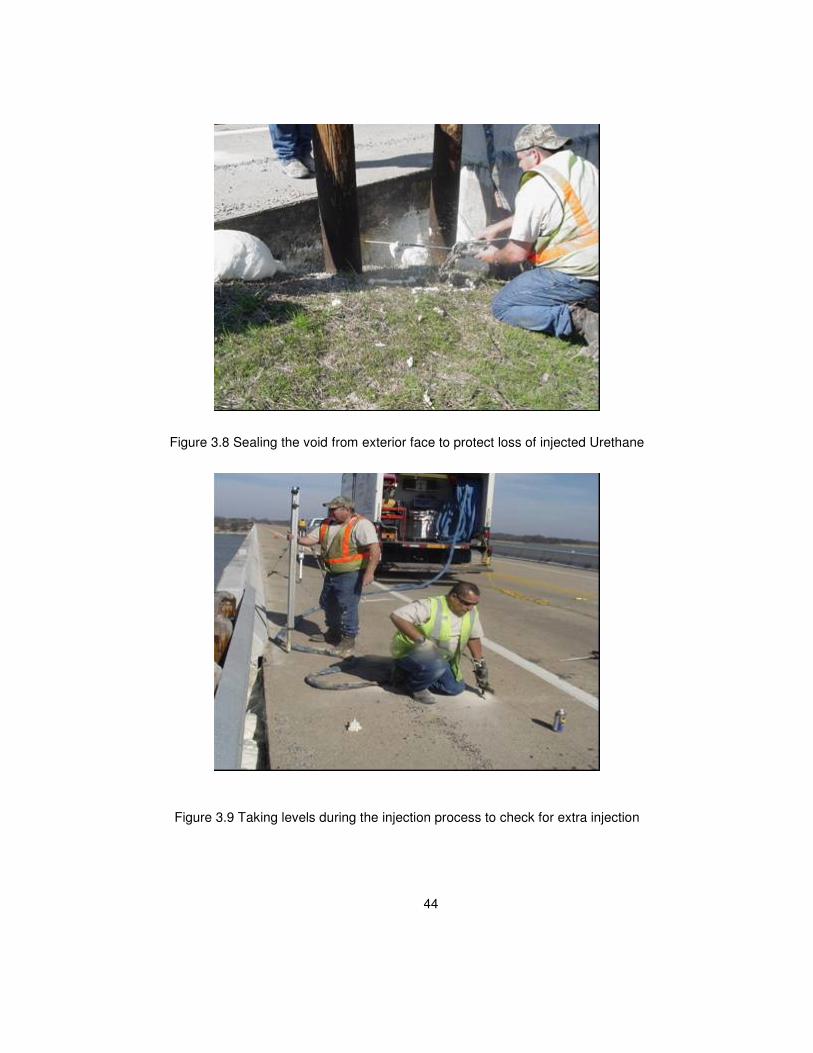
44
Figure 3.8 Sealing the void from exterior face to protect loss of injected Urethane
Figure 3.9 Taking levels during the injection process to check for extra injection
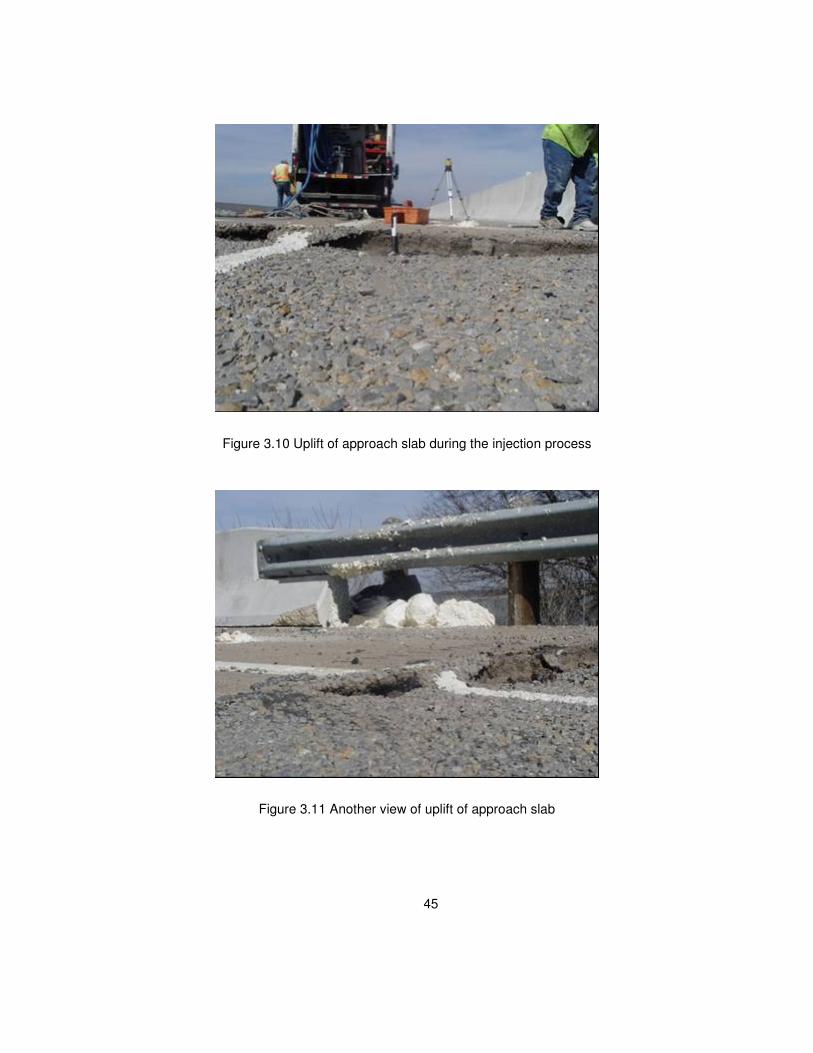
45
Figure 3.10 Uplift of approach slab during the injection process
Figure 3.11 Another view of uplift of approach slab
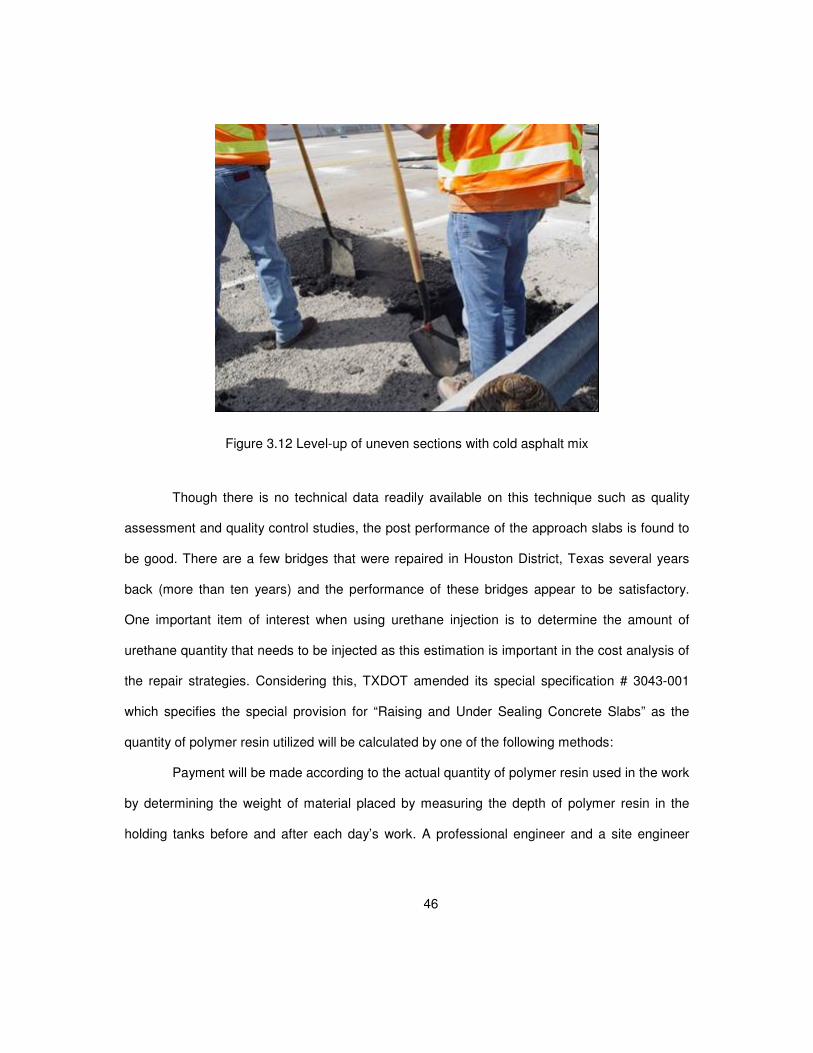
46
Figure 3.12 Level-up of uneven sections with cold asphalt mix
Though there is no technical data readily available on this technique such as quality
assessment and quality control studies, the post performance of the approach slabs is found to
be good. There are a few bridges that were repaired in Houston District, Texas several years
back (more than ten years) and the performance of these bridges appear to be satisfactory.
One important item of interest when using urethane injection is to determine the amount of
urethane quantity that needs to be injected as this estimation is important in the cost analysis of
the repair strategies. Considering this, TXDOT amended its special specification # 3043-001
which specifies the special provision for “Raising and Under Sealing Concrete Slabs” as the
quantity of polymer resin utilized will be calculated by one of the following methods:
Payment will be made according to the actual quantity of polymer resin used in the work
by determining the weight of material placed by measuring the depth of polymer resin in the
holding tanks before and after each day’s work. A professional engineer and a site engineer
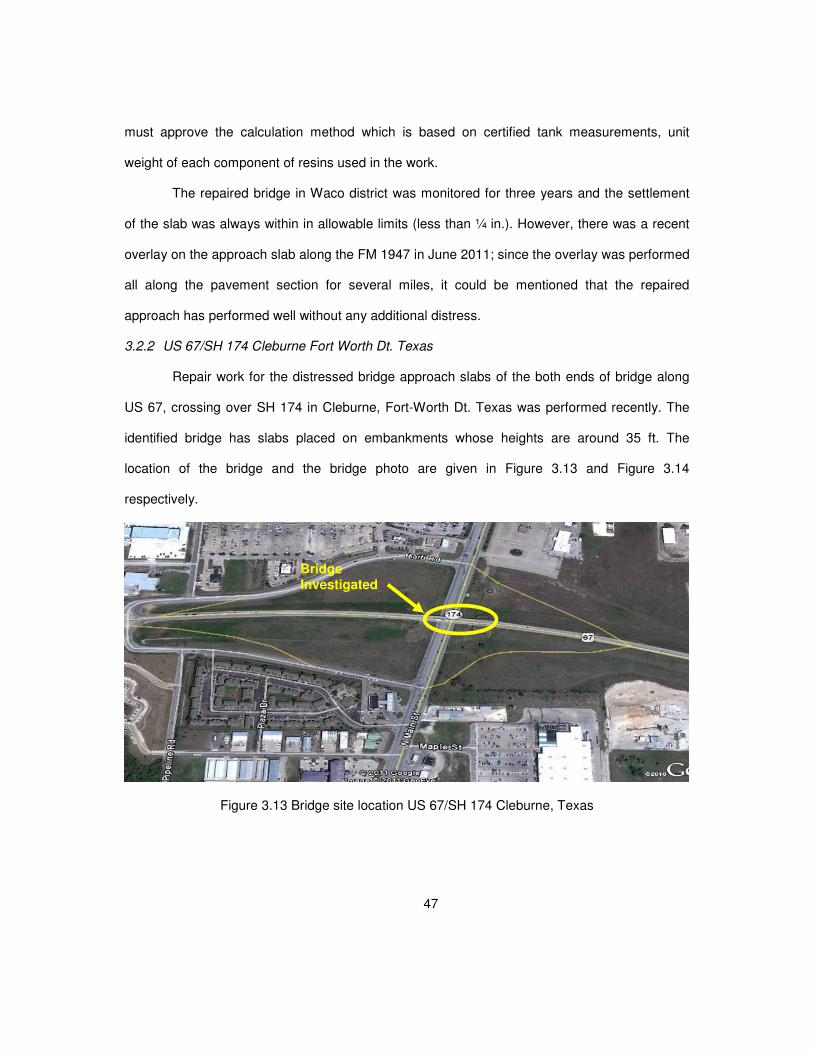
47
must approve the calculation method which is based on certified tank measurements, unit
weight of each component of resins used in the work.
The repaired bridge in Waco district was monitored for three years and the settlement
of the slab was always within in allowable limits (less than ¼ in.). However, there was a recent
overlay on the approach slab along the FM 1947 in June 2011; since the overlay was performed
all along the pavement section for several miles, it could be mentioned that the repaired
approach has performed well without any additional distress.
3.2.2 US 67/SH 174 Cleburne Fort Worth Dt. Texas
Repair work for the distressed bridge approach slabs of the both ends of bridge along
US 67, crossing over SH 174 in Cleburne, Fort-Worth Dt. Texas was performed recently. The
identified bridge has slabs placed on embankments whose heights are around 35 ft. The
location of the bridge and the bridge photo are given in Figure 3.13 and Figure 3.14
respectively.
Figure 3.13 Bridge site location US 67/SH 174 Cleburne, Texas
Bridge Investigated
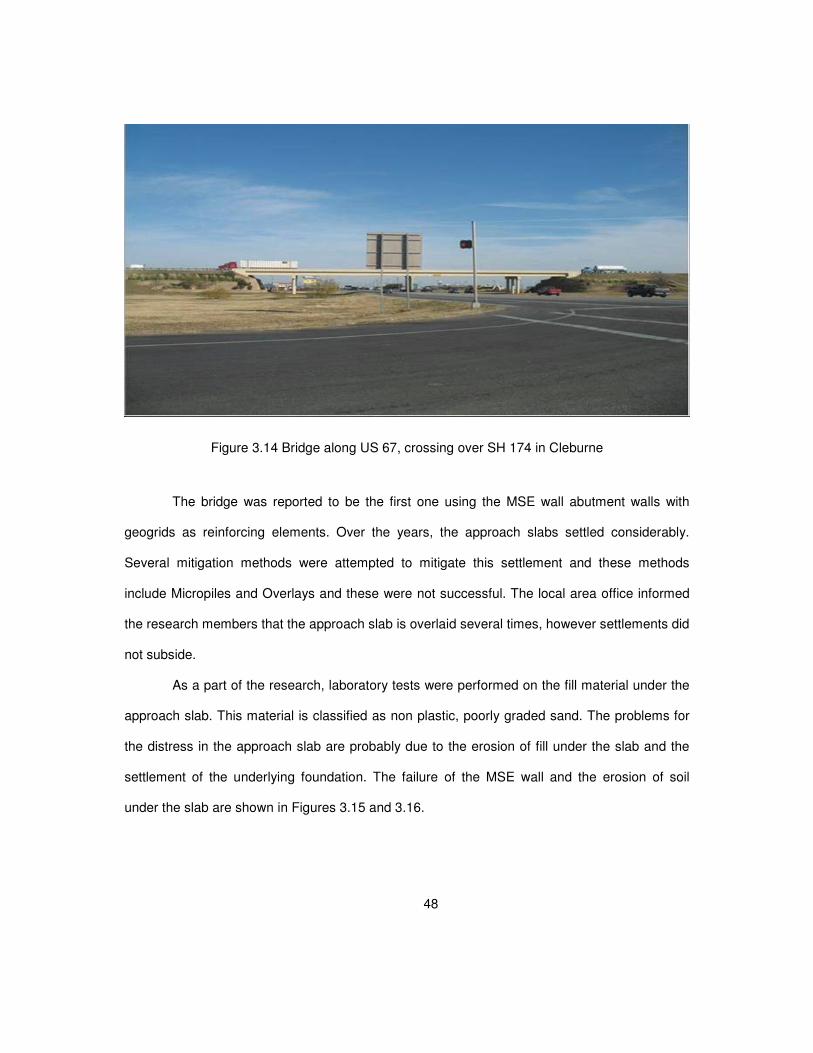
48
Figure 3.14 Bridge along US 67, crossing over SH 174 in Cleburne
The bridge was reported to be the first one using the MSE wall abutment walls with
geogrids as reinforcing elements. Over the years, the approach slabs settled considerably.
Several mitigation methods were attempted to mitigate this settlement and these methods
include Micropiles and Overlays and these were not successful. The local area office informed
the research members that the approach slab is overlaid several times, however settlements did
not subside.
As a part of the research, laboratory tests were performed on the fill material under the
approach slab. This material is classified as non plastic, poorly graded sand. The problems for
the distress in the approach slab are probably due to the erosion of fill under the slab and the
settlement of the underlying foundation. The failure of the MSE wall and the erosion of soil
under the slab are shown in Figures 3.15 and 3.16.
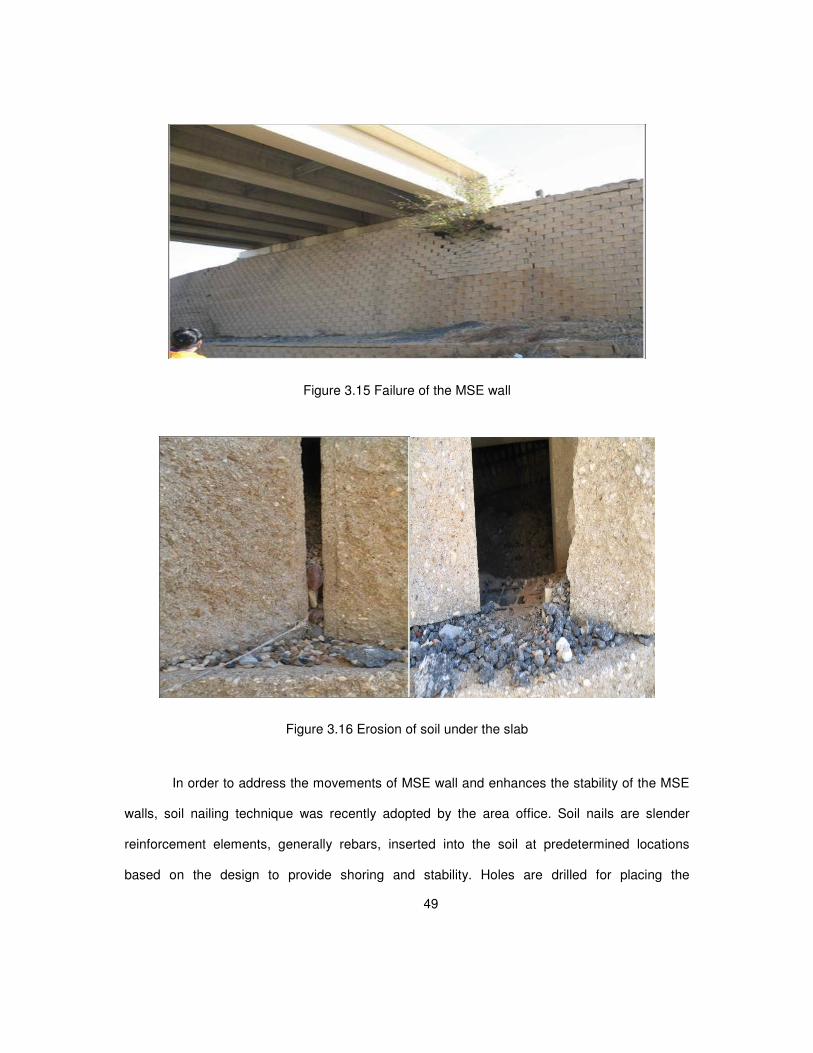
49
Figure 3.15 Failure of the MSE wall
Figure 3.16 Erosion of soil under the slab
In order to address the movements of MSE wall and enhances the stability of the MSE
walls, soil nailing technique was recently adopted by the area office. Soil nails are slender
reinforcement elements, generally rebars, inserted into the soil at predetermined locations
based on the design to provide shoring and stability. Holes are drilled for placing the
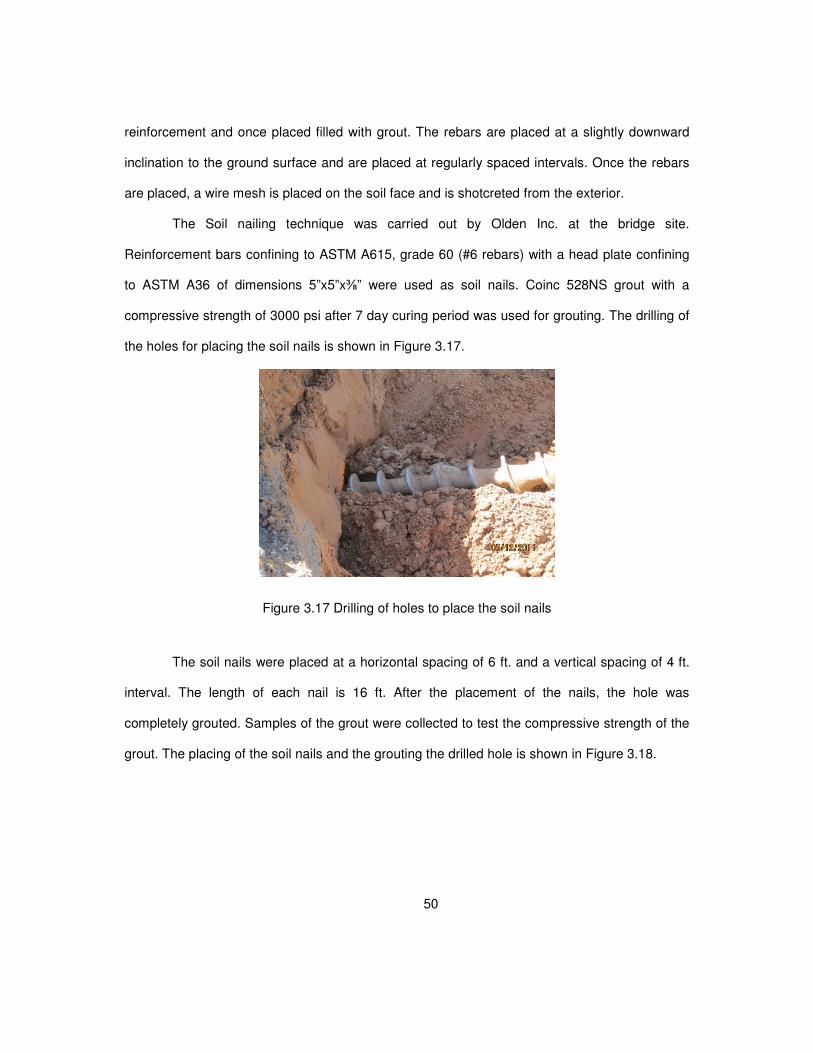
50
reinforcement and once placed filled with grout. The rebars are placed at a slightly downward
inclination to the ground surface and are placed at regularly spaced intervals. Once the rebars
are placed, a wire mesh is placed on the soil face and is shotcreted from the exterior.
The Soil nailing technique was carried out by Olden Inc. at the bridge site.
Reinforcement bars confining to ASTM A615, grade 60 (#6 rebars) with a head plate confining
to ASTM A36 of dimensions 5”x5”x⅜” were used as soil nails. Coinc 528NS grout with a
compressive strength of 3000 psi after 7 day curing period was used for grouting. The drilling of
the holes for placing the soil nails is shown in Figure 3.17.
Figure 3.17 Drilling of holes to place the soil nails
The soil nails were placed at a horizontal spacing of 6 ft. and a vertical spacing of 4 ft.
interval. The length of each nail is 16 ft. After the placement of the nails, the hole was
completely grouted. Samples of the grout were collected to test the compressive strength of the
grout. The placing of the soil nails and the grouting the drilled hole is shown in Figure 3.18.
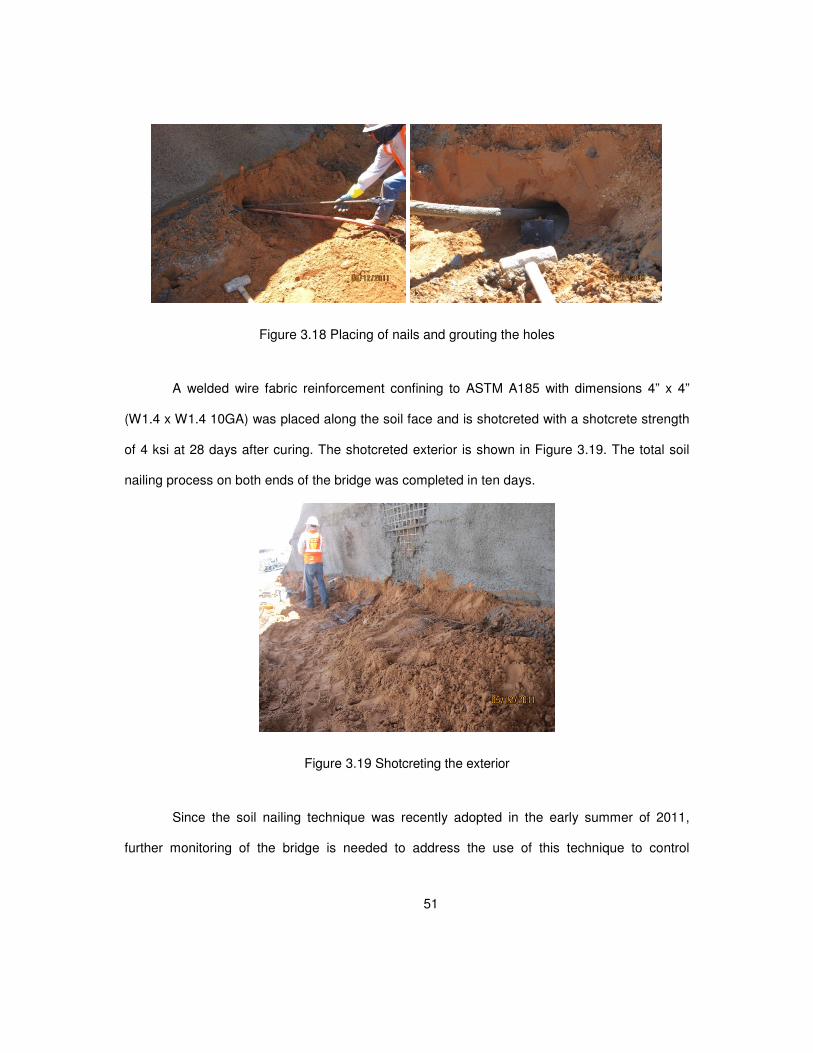
51
Figure 3.18 Placing of nails and grouting the holes
A welded wire fabric reinforcement confining to ASTM A185 with dimensions 4” x 4”
(W1.4 x W1.4 10GA) was placed along the soil face and is shotcreted with a shotcrete strength
of 4 ksi at 28 days after curing. The shotcreted exterior is shown in Figure 3.19. The total soil
nailing process on both ends of the bridge was completed in ten days.
Figure 3.19 Shotcreting the exterior
Since the soil nailing technique was recently adopted in the early summer of 2011,
further monitoring of the bridge is needed to address the use of this technique to control
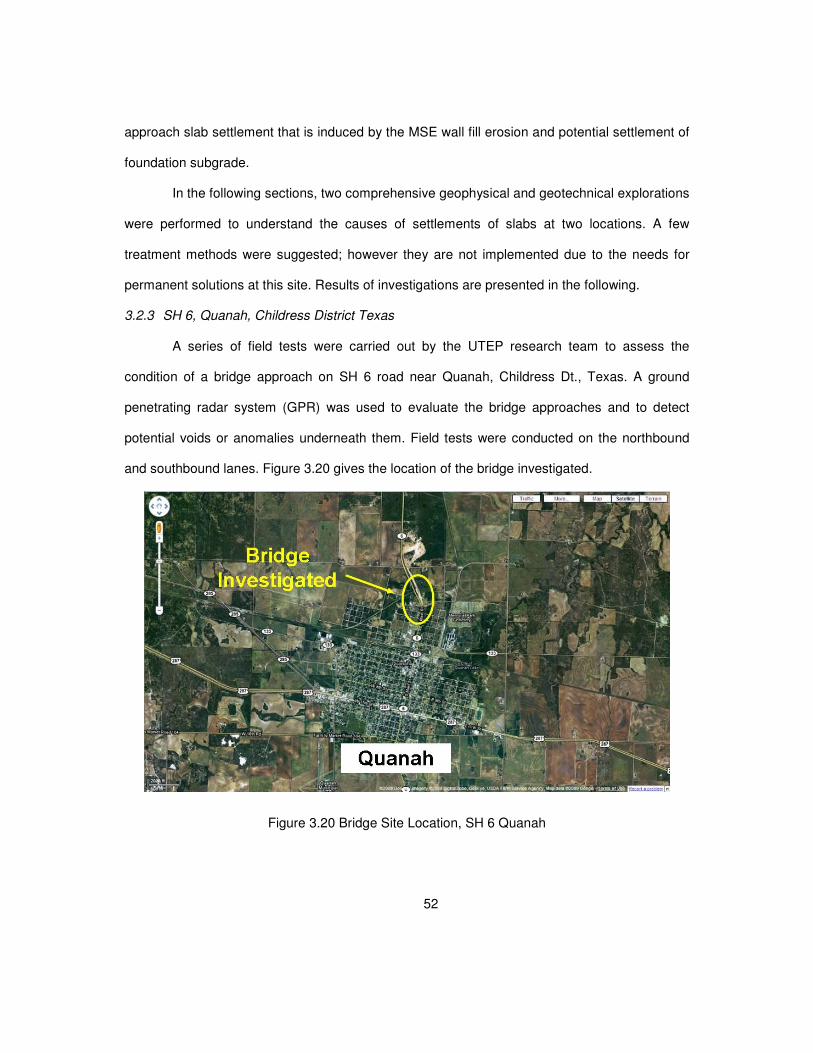
52
approach slab settlement that is induced by the MSE wall fill erosion and potential settlement of
foundation subgrade.
In the following sections, two comprehensive geophysical and geotechnical explorations
were performed to understand the causes of settlements of slabs at two locations. A few
treatment methods were suggested; however they are not implemented due to the needs for
permanent solutions at this site. Results of investigations are presented in the following.
3.2.3 SH 6, Quanah, Childress District Texas
A series of field tests were carried out by the UTEP research team to assess the
condition of a bridge approach on SH 6 road near Quanah, Childress Dt., Texas. A ground
penetrating radar system (GPR) was used to evaluate the bridge approaches and to detect
potential voids or anomalies underneath them. Field tests were conducted on the northbound
and southbound lanes. Figure 3.20 gives the location of the bridge investigated.
Figure 3.20 Bridge Site Location, SH 6 Quanah
53
Ground Penetrating Radar (GPR) is a geophysical nondestructive technique that uses
electromagnetic pulses to test, characterize, or detect subsurface materials based on changes
in electrical and magnetic properties of the subsurface layers. GPR works using short
electromagnetic pulses radiated by an antenna which transmits these pulses and receives
reflected returns from the pavement layers. The reflected pulses are received by the antenna
and recorded as a waveform. As the equipment travels along the pavement, it generates a
sequence of waveforms or linescans. These waveforms are digitized and interpreted by
computing the amplitude and arrival times from each main reflection. The reflections of these
waves at interfaces and objects within the material are analyzed to determine the location or
depth of these interfaces and buried objects, and to determine the properties of material.
Whenever applicable, GPR can be employed as a rapid nondestructive tool for evaluation of
geometrical and material properties of structural components.
The test setup used in this study is shown in Figure 3.21. The equipment used for the
GPR survey consists of a GSSI SIR-20 (SIRveyor) two-channel data acquisition unit controlled
by a laptop computer, a ground-coupled antenna and a survey wheel attached to the antenna.
For this study, three different antennas were used: a 1.6 GHz (GSSI Model 5100), a 400 MHz
(GSSI Model 5103) and a 200 MHz (GSSI Model 5106). The three antennas were used to
cover different penetration depths, identify precisely pavement interfaces and also detect
presence of utilities or anomalies at different depths. The maximum depth of penetration of
each antenna reaches to about 18 inches, 4 ft and 8 ft respectively, depending on the
conductivity of the materials underneath.
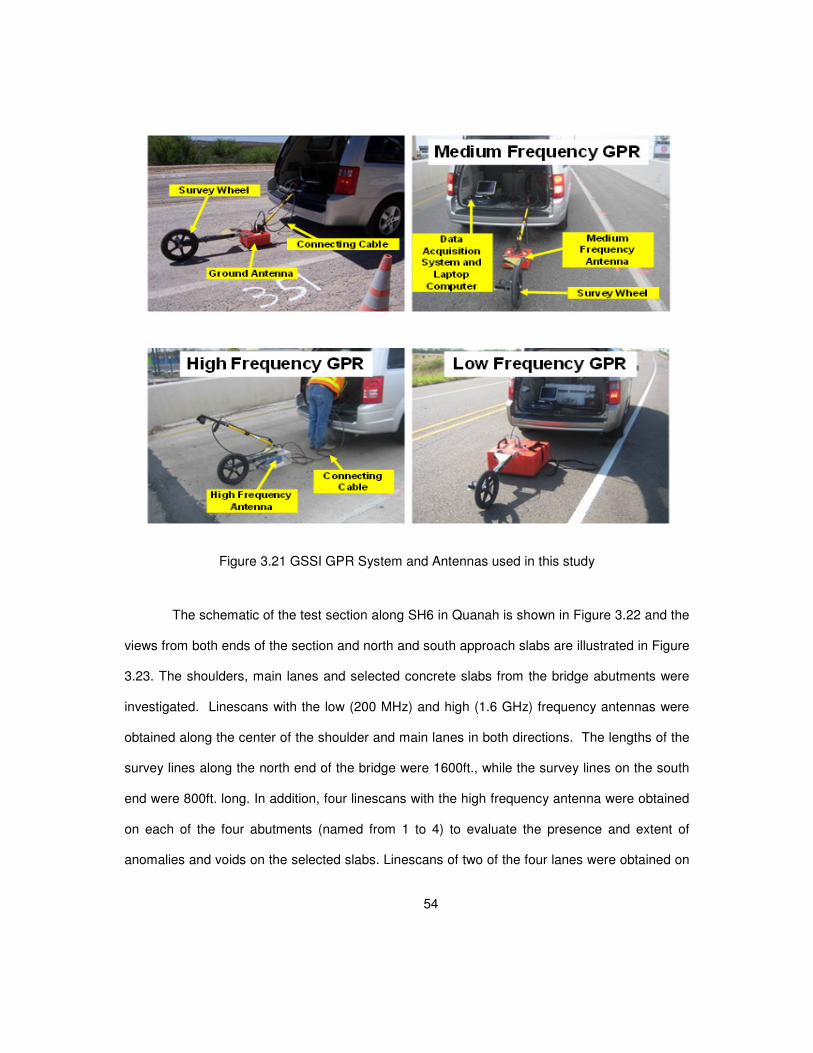
54
Figure 3.21 GSSI GPR System and Antennas used in this study
The schematic of the test section along SH6 in Quanah is shown in Figure 3.22 and the
views from both ends of the section and north and south approach slabs are illustrated in Figure
3.23. The shoulders, main lanes and selected concrete slabs from the bridge abutments were
investigated. Linescans with the low (200 MHz) and high (1.6 GHz) frequency antennas were
obtained along the center of the shoulder and main lanes in both directions. The lengths of the
survey lines along the north end of the bridge were 1600ft., while the survey lines on the south
end were 800ft. long. In addition, four linescans with the high frequency antenna were obtained
on each of the four abutments (named from 1 to 4) to evaluate the presence and extent of
anomalies and voids on the selected slabs. Linescans of two of the four lanes were obtained on
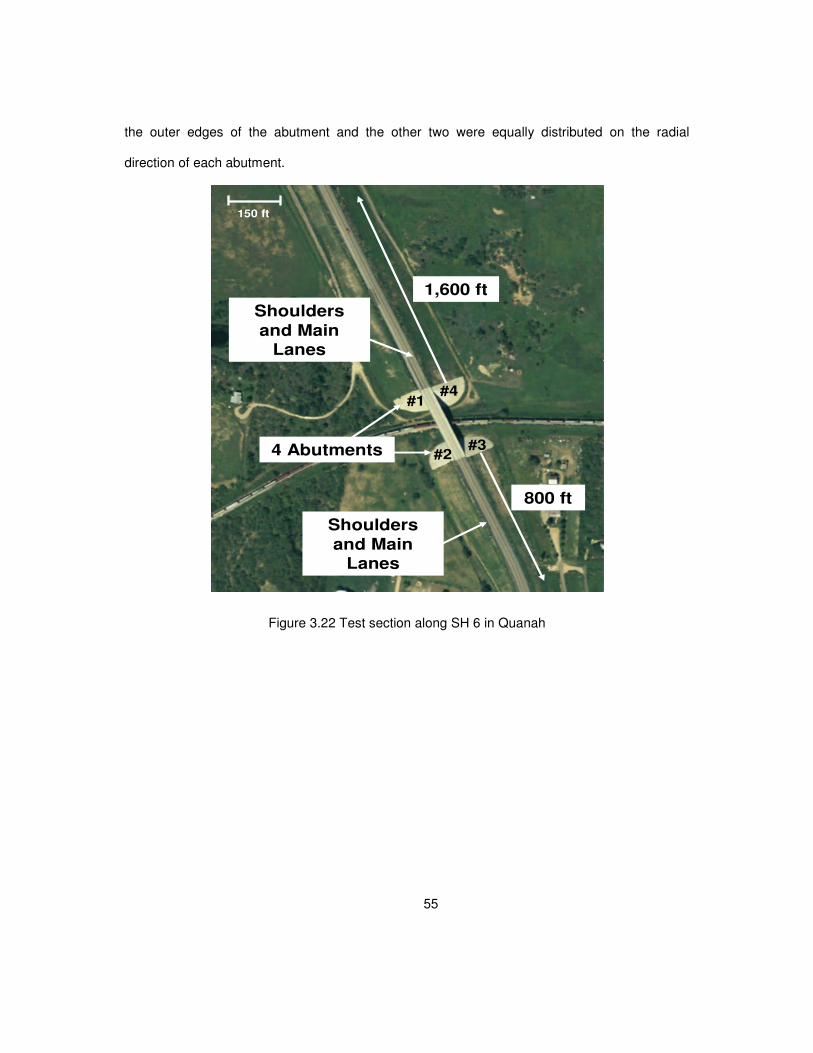
55
the outer edges of the abutment and the other two were equally distributed on the radial
direction of each abutment.
4 Abutments
Shoulders
and Main Lanes
1,600 ft
800 ft
150 ft
Shoulders
and Main Lanes
#1
#2#3
#4
Figure 3.22 Test section along SH 6 in Quanah
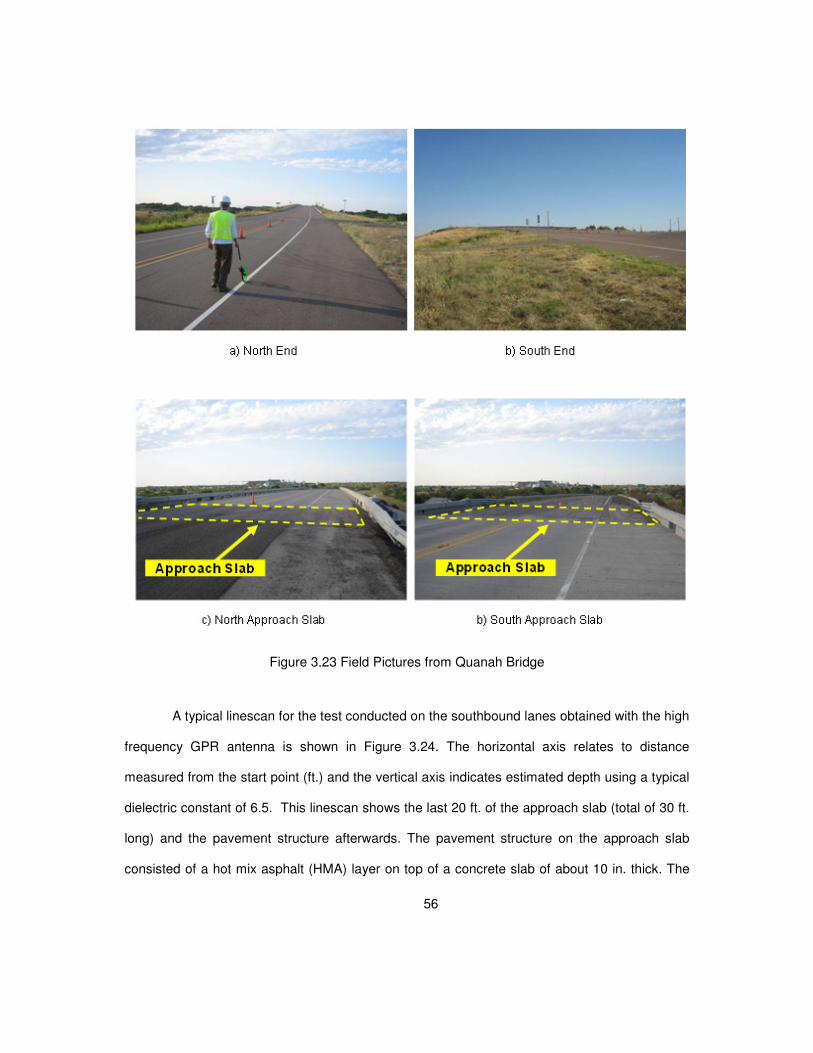
56
Figure 3.23 Field Pictures from Quanah Bridge
A typical linescan for the test conducted on the southbound lanes obtained with the high
frequency GPR antenna is shown in Figure 3.24. The horizontal axis relates to distance
measured from the start point (ft.) and the vertical axis indicates estimated depth using a typical
dielectric constant of 6.5. This linescan shows the last 20 ft. of the approach slab (total of 30 ft.
long) and the pavement structure afterwards. The pavement structure on the approach slab
consisted of a hot mix asphalt (HMA) layer on top of a concrete slab of about 10 in. thick. The
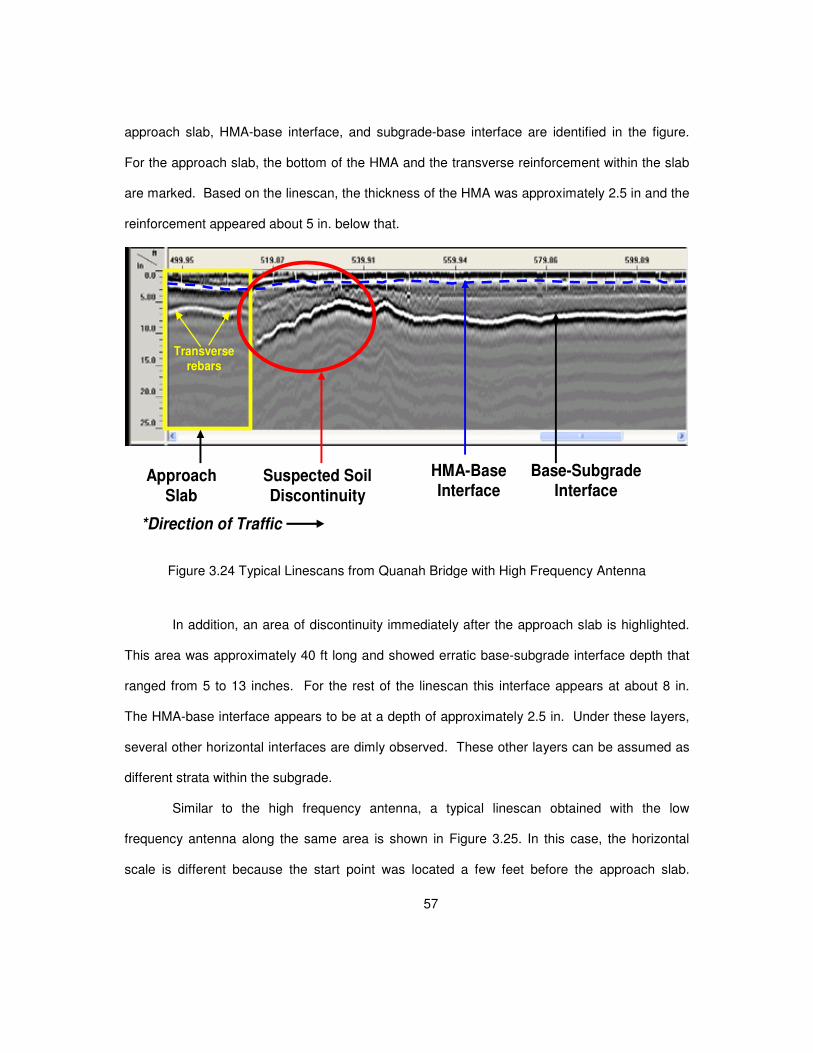
57
approach slab, HMA-base interface, and subgrade-base interface are identified in the figure.
For the approach slab, the bottom of the HMA and the transverse reinforcement within the slab
are marked. Based on the linescan, the thickness of the HMA was approximately 2.5 in and the
reinforcement appeared about 5 in. below that.
Approach
Slab
HMA-Base Interface
Base-Subgrade Interface
*Direction of Traffic
Suspected Soil
Discontinuity
Transverse rebars
Figure 3.24 Typical Linescans from Quanah Bridge with High Frequency Antenna
In addition, an area of discontinuity immediately after the approach slab is highlighted.
This area was approximately 40 ft long and showed erratic base-subgrade interface depth that
ranged from 5 to 13 inches. For the rest of the linescan this interface appears at about 8 in.
The HMA-base interface appears to be at a depth of approximately 2.5 in. Under these layers,
several other horizontal interfaces are dimly observed. These other layers can be assumed as
different strata within the subgrade.
Similar to the high frequency antenna, a typical linescan obtained with the low
frequency antenna along the same area is shown in Figure 3.25. In this case, the horizontal
scale is different because the start point was located a few feet before the approach slab.
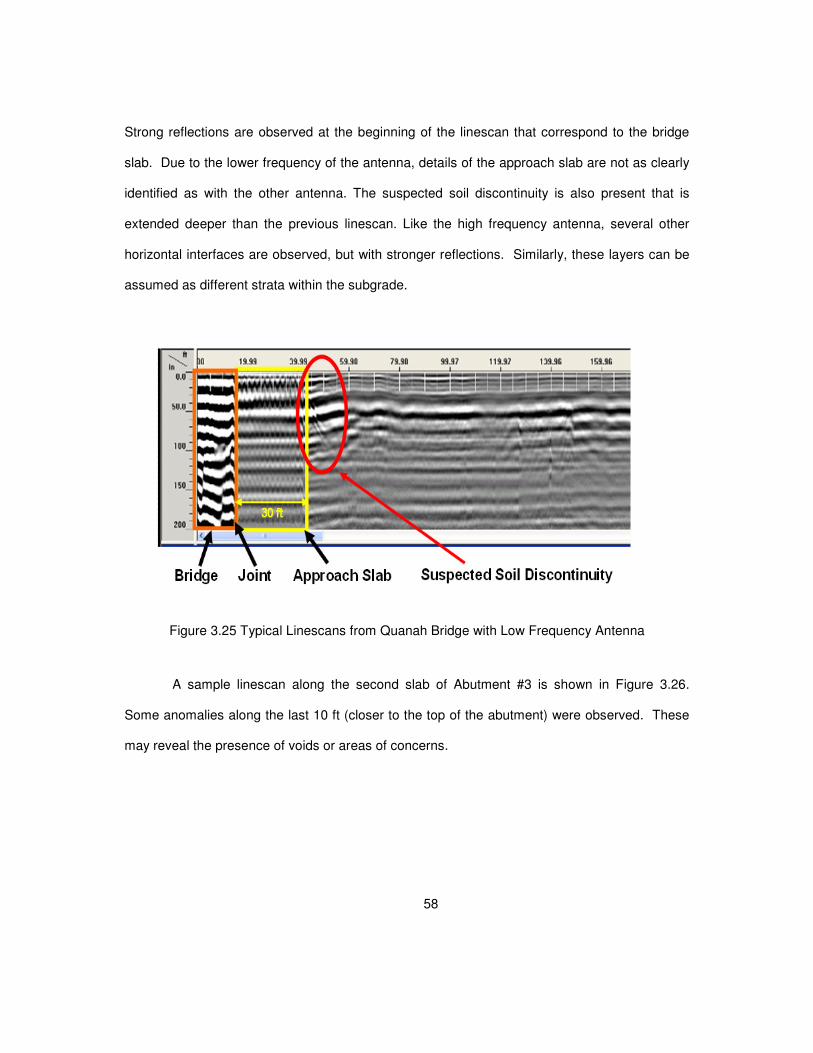
58
Strong reflections are observed at the beginning of the linescan that correspond to the bridge
slab. Due to the lower frequency of the antenna, details of the approach slab are not as clearly
identified as with the other antenna. The suspected soil discontinuity is also present that is
extended deeper than the previous linescan. Like the high frequency antenna, several other
horizontal interfaces are observed, but with stronger reflections. Similarly, these layers can be
assumed as different strata within the subgrade.
Figure 3.25 Typical Linescans from Quanah Bridge with Low Frequency Antenna
A sample linescan along the second slab of Abutment #3 is shown in Figure 3.26.
Some anomalies along the last 10 ft (closer to the top of the abutment) were observed. These
may reveal the presence of voids or areas of concerns.
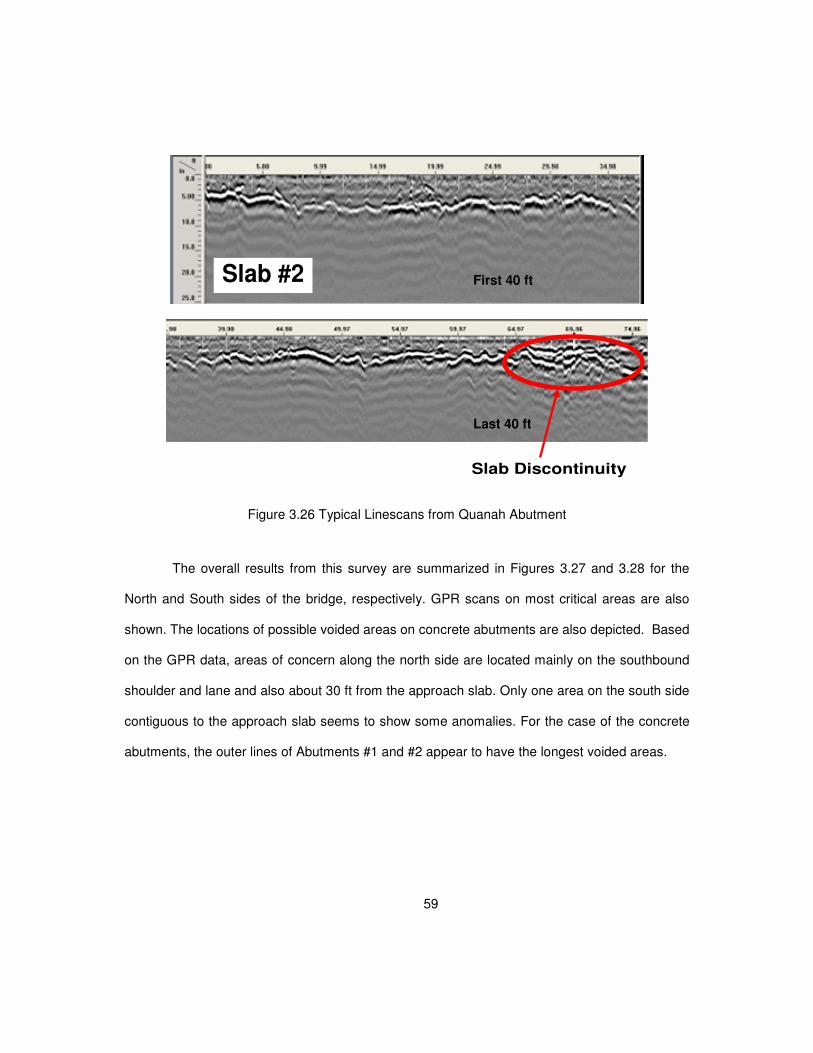
59
Slab #2
Slab Discontinuity
Figure 3.26 Typical Linescans from Quanah Abutment
The overall results from this survey are summarized in Figures 3.27 and 3.28 for the
North and South sides of the bridge, respectively. GPR scans on most critical areas are also
shown. The locations of possible voided areas on concrete abutments are also depicted. Based
on the GPR data, areas of concern along the north side are located mainly on the southbound
shoulder and lane and also about 30 ft from the approach slab. Only one area on the south side
contiguous to the approach slab seems to show some anomalies. For the case of the concrete
abutments, the outer lines of Abutments #1 and #2 appear to have the longest voided areas.
First 40 ft
Last 40 ft
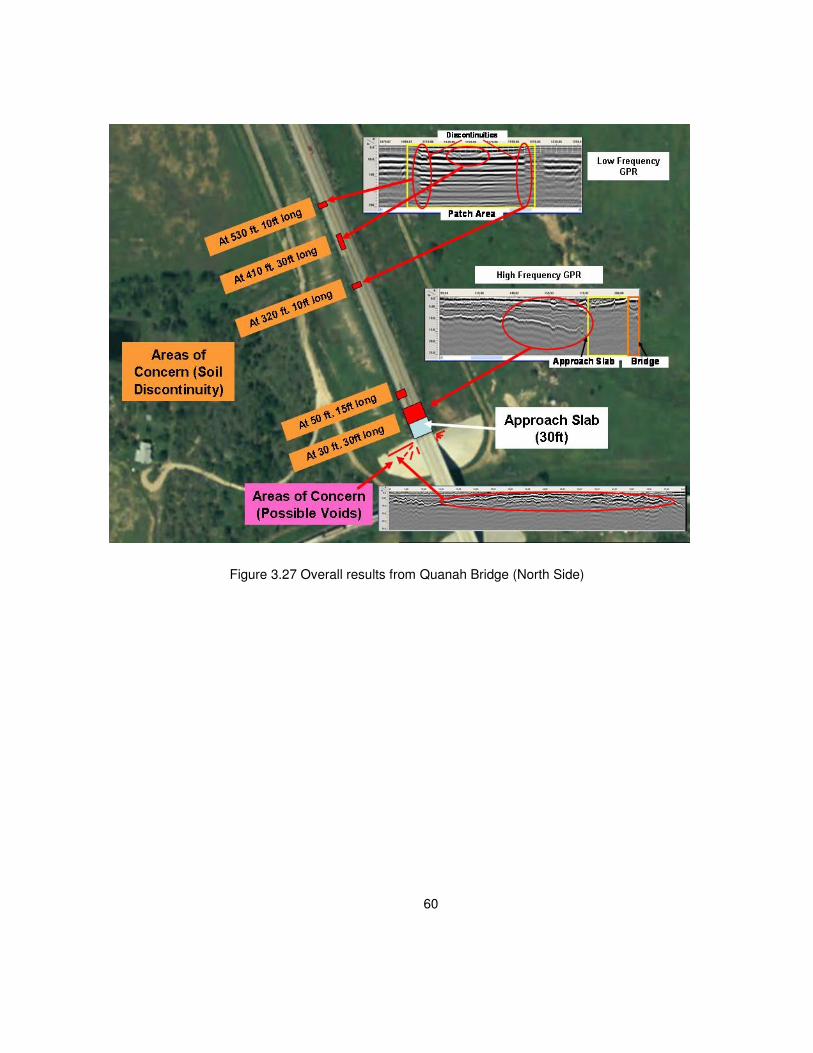
60
Figure 3.27 Overall results from Quanah Bridge (North Side)
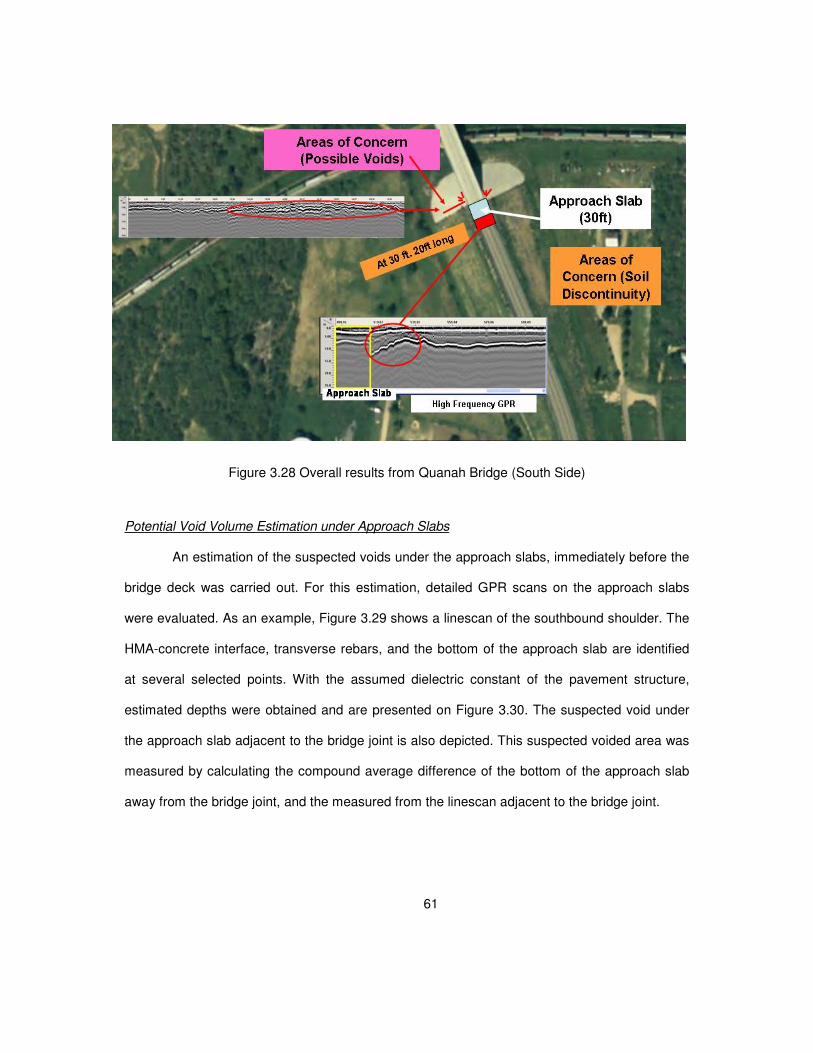
61
Figure 3.28 Overall results from Quanah Bridge (South Side)
Potential Void Volume Estimation under Approach Slabs
An estimation of the suspected voids under the approach slabs, immediately before the
bridge deck was carried out. For this estimation, detailed GPR scans on the approach slabs
were evaluated. As an example, Figure 3.29 shows a linescan of the southbound shoulder. The
HMA-concrete interface, transverse rebars, and the bottom of the approach slab are identified
at several selected points. With the assumed dielectric constant of the pavement structure,
estimated depths were obtained and are presented on Figure 3.30. The suspected void under
the approach slab adjacent to the bridge joint is also depicted. This suspected voided area was
measured by calculating the compound average difference of the bottom of the approach slab
away from the bridge joint, and the measured from the linescan adjacent to the bridge joint.
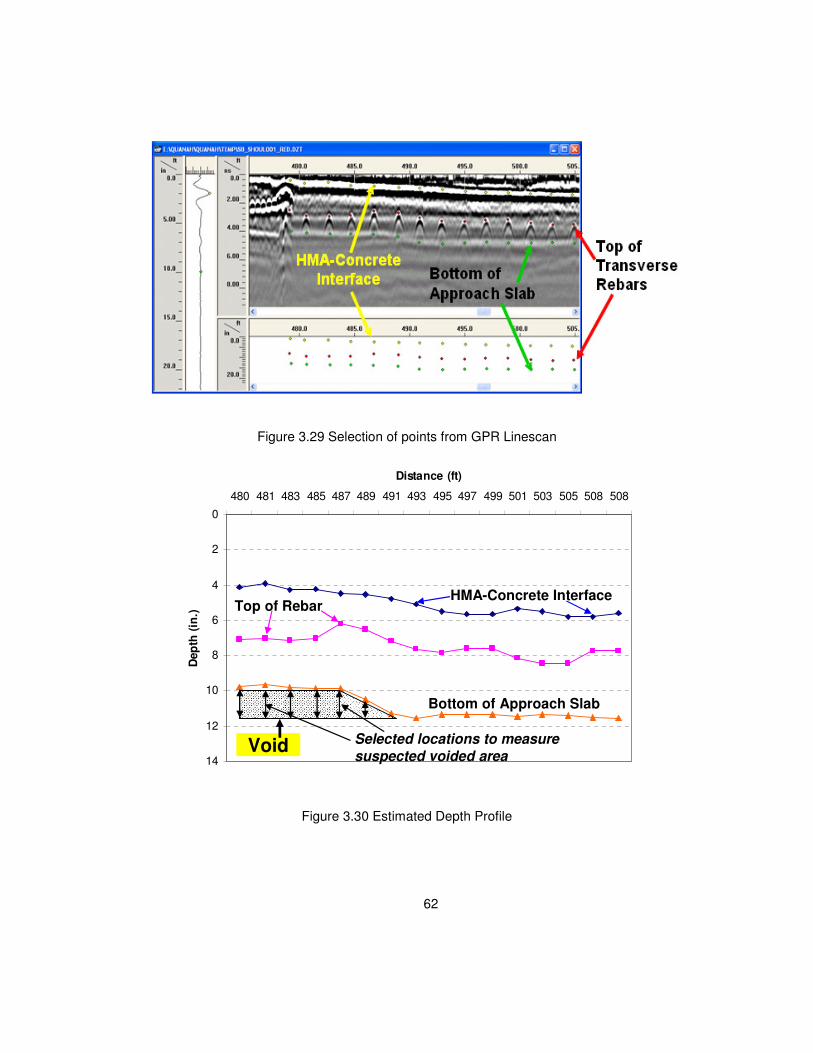
62
Figure 3.29 Selection of points from GPR Linescan
0
2
4
6
8
10
12
14
480 481 483 485 487 489 491 493 495 497 499 501 503 505 508 508
Distance (ft)
Dep
th (
in.)
Void
HMA-Concrete InterfaceTop of Rebar
Bottom of Approach Slab
Selected locations to measure
suspected voided area
Figure 3.30 Estimated Depth Profile
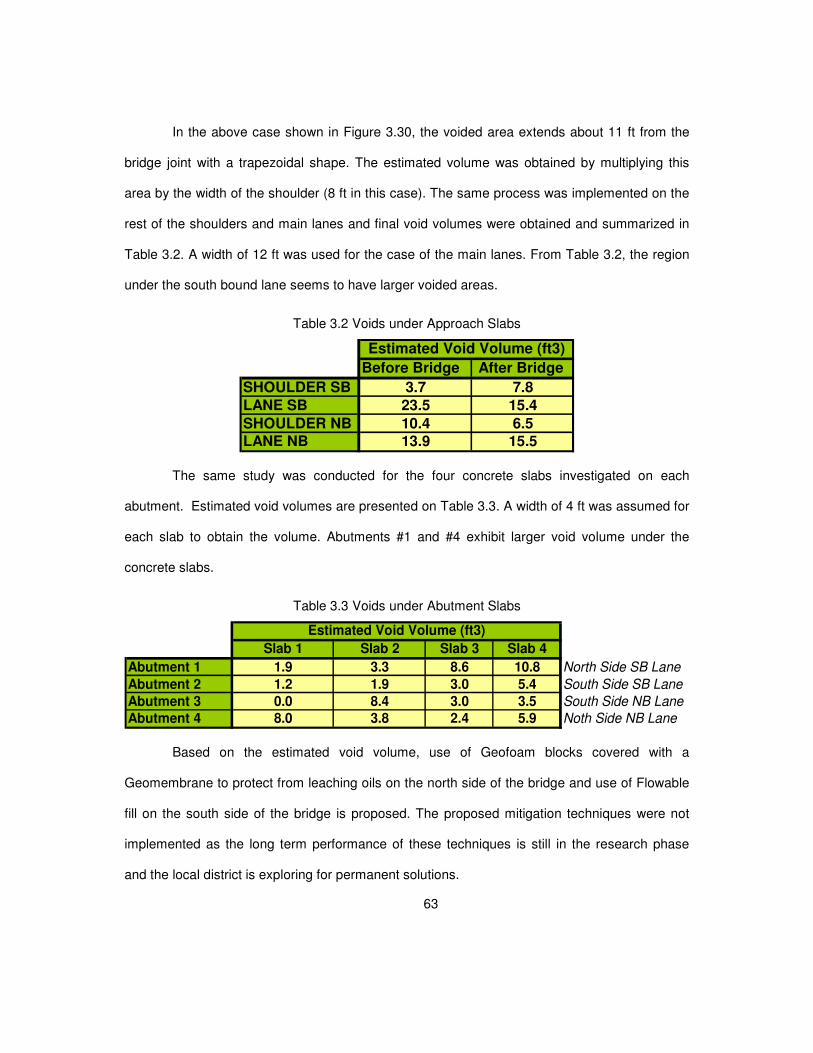
63
In the above case shown in Figure 3.30, the voided area extends about 11 ft from the
bridge joint with a trapezoidal shape. The estimated volume was obtained by multiplying this
area by the width of the shoulder (8 ft in this case). The same process was implemented on the
rest of the shoulders and main lanes and final void volumes were obtained and summarized in
Table 3.2. A width of 12 ft was used for the case of the main lanes. From Table 3.2, the region
under the south bound lane seems to have larger voided areas.
Table 3.2 Voids under Approach Slabs
Before Bridge After Bridge
SHOULDER SB 3.7 7.8
LANE SB 23.5 15.4
SHOULDER NB 10.4 6.5
LANE NB 13.9 15.5
Estimated Void Volume (ft3)
The same study was conducted for the four concrete slabs investigated on each
abutment. Estimated void volumes are presented on Table 3.3. A width of 4 ft was assumed for
each slab to obtain the volume. Abutments #1 and #4 exhibit larger void volume under the
concrete slabs.
Table 3.3 Voids under Abutment Slabs
Slab 1 Slab 2 Slab 3 Slab 4
Abutment 1 1.9 3.3 8.6 10.8 North Side SB Lane
Abutment 2 1.2 1.9 3.0 5.4 South Side SB Lane
Abutment 3 0.0 8.4 3.0 3.5 South Side NB Lane
Abutment 4 8.0 3.8 2.4 5.9 Noth Side NB Lane
Estimated Void Volume (ft3)
Based on the estimated void volume, use of Geofoam blocks covered with a
Geomembrane to protect from leaching oils on the north side of the bridge and use of Flowable
fill on the south side of the bridge is proposed. The proposed mitigation techniques were not
implemented as the long term performance of these techniques is still in the research phase
and the local district is exploring for permanent solutions.
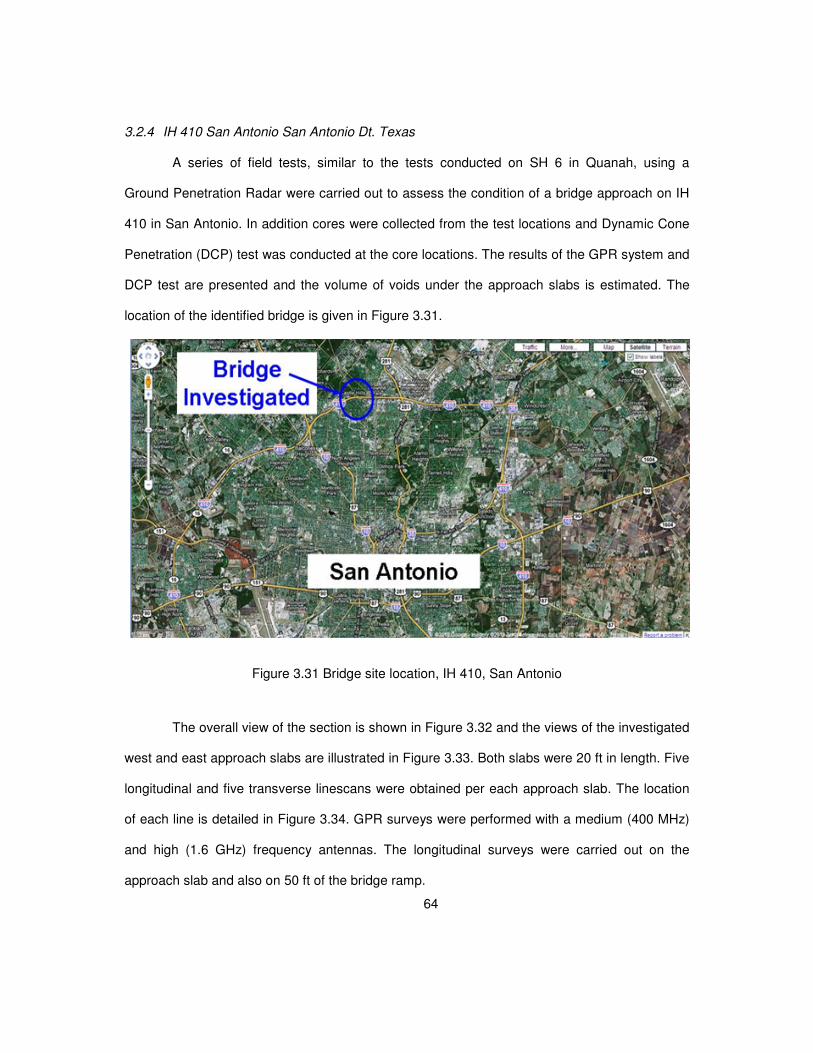
64
3.2.4 IH 410 San Antonio San Antonio Dt. Texas
A series of field tests, similar to the tests conducted on SH 6 in Quanah, using a
Ground Penetration Radar were carried out to assess the condition of a bridge approach on IH
410 in San Antonio. In addition cores were collected from the test locations and Dynamic Cone
Penetration (DCP) test was conducted at the core locations. The results of the GPR system and
DCP test are presented and the volume of voids under the approach slabs is estimated. The
location of the identified bridge is given in Figure 3.31.
Figure 3.31 Bridge site location, IH 410, San Antonio
The overall view of the section is shown in Figure 3.32 and the views of the investigated
west and east approach slabs are illustrated in Figure 3.33. Both slabs were 20 ft in length. Five
longitudinal and five transverse linescans were obtained per each approach slab. The location
of each line is detailed in Figure 3.34. GPR surveys were performed with a medium (400 MHz)
and high (1.6 GHz) frequency antennas. The longitudinal surveys were carried out on the
approach slab and also on 50 ft of the bridge ramp.
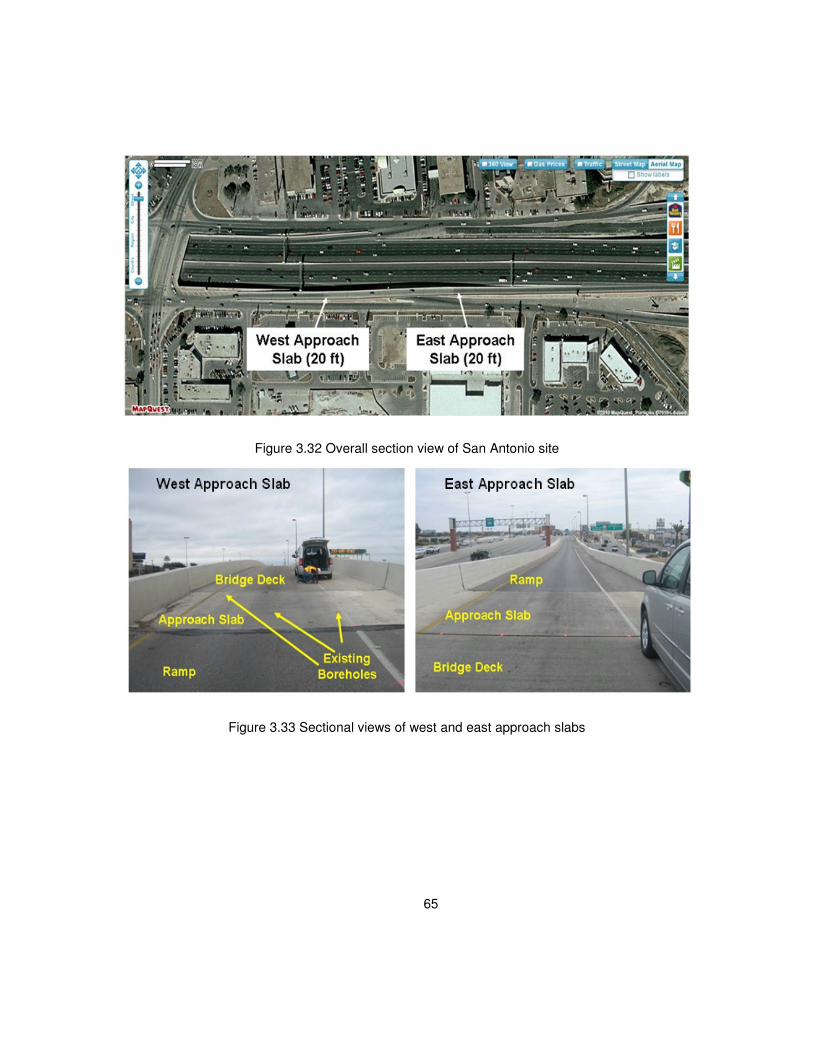
65
Figure 3.32 Overall section view of San Antonio site
Figure 3.33 Sectional views of west and east approach slabs
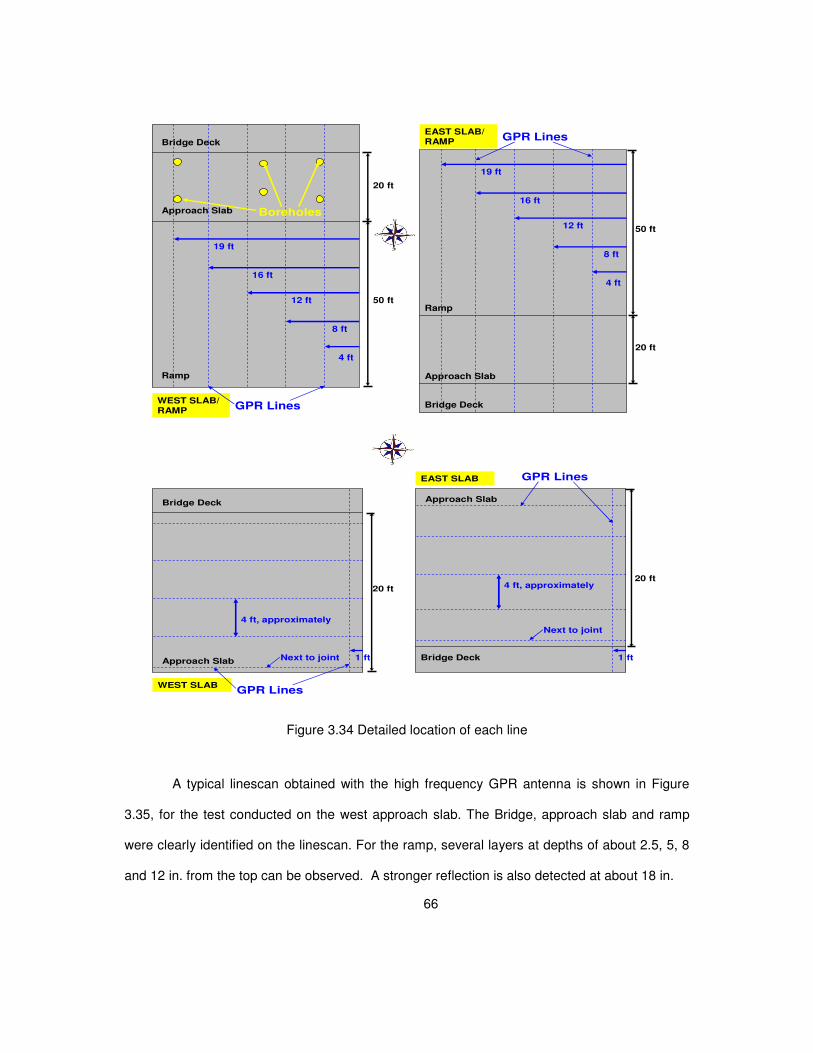
66
WEST SLAB/ RAMP
19 ft
Ramp
Approach Slab
Bridge Deck
20 ft
50 ft
16 ft
12 ft
8 ft
4 ft
GPR Lines
19 ft
Ramp
Approach Slab
Bridge Deck
20 ft
50 ft
16 ft
12 ft
8 ft
4 ft
GPR LinesEAST SLAB/ RAMP
Boreholes
Approach Slab
Bridge Deck
20 ft
1 ft
GPR LinesWEST SLAB
EAST SLAB
4 ft, approximately
Next to joint
Approach Slab
Bridge Deck
20 ft
1 ft
GPR Lines
4 ft, approximately
Next to joint
Figure 3.34 Detailed location of each line
A typical linescan obtained with the high frequency GPR antenna is shown in Figure
3.35, for the test conducted on the west approach slab. The Bridge, approach slab and ramp
were clearly identified on the linescan. For the ramp, several layers at depths of about 2.5, 5, 8
and 12 in. from the top can be observed. A stronger reflection is also detected at about 18 in.
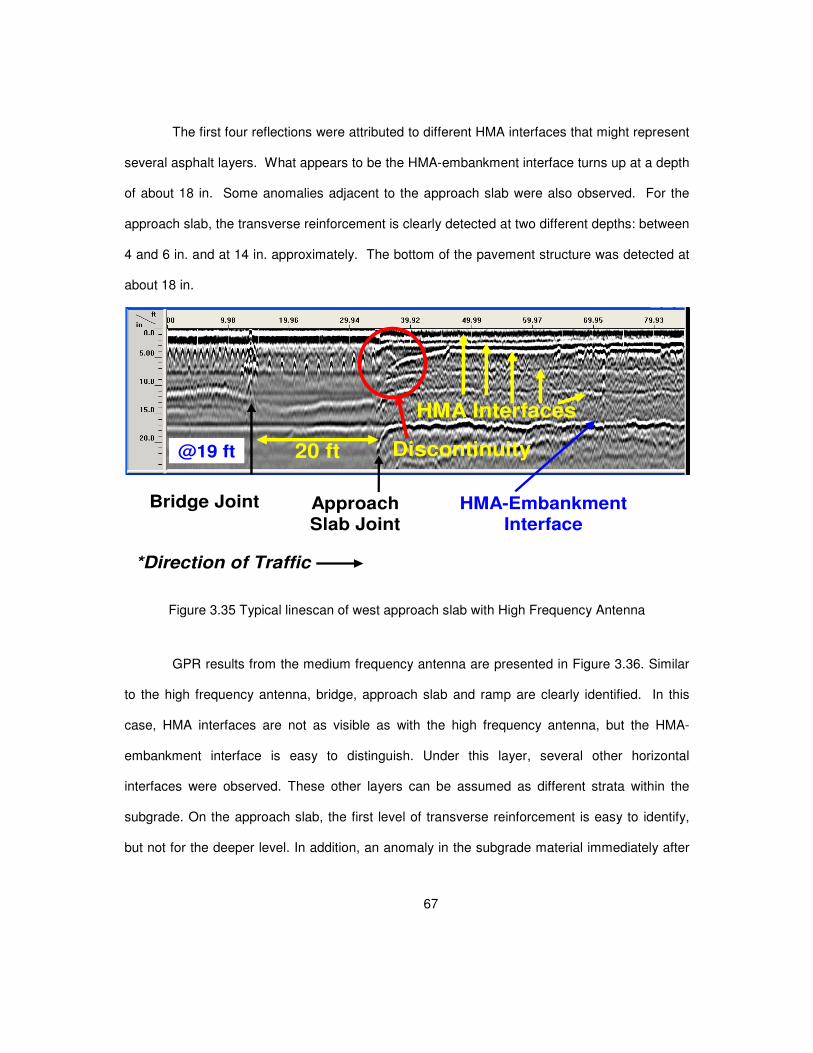
67
The first four reflections were attributed to different HMA interfaces that might represent
several asphalt layers. What appears to be the HMA-embankment interface turns up at a depth
of about 18 in. Some anomalies adjacent to the approach slab were also observed. For the
approach slab, the transverse reinforcement is clearly detected at two different depths: between
4 and 6 in. and at 14 in. approximately. The bottom of the pavement structure was detected at
about 18 in.
@19 ft Discontinuity
HMA Interfaces
Bridge Joint HMA-Embankment Interface
*Direction of Traffic
Approach Slab Joint
20 ft
Figure 3.35 Typical linescan of west approach slab with High Frequency Antenna
GPR results from the medium frequency antenna are presented in Figure 3.36. Similar
to the high frequency antenna, bridge, approach slab and ramp are clearly identified. In this
case, HMA interfaces are not as visible as with the high frequency antenna, but the HMA-
embankment interface is easy to distinguish. Under this layer, several other horizontal
interfaces were observed. These other layers can be assumed as different strata within the
subgrade. On the approach slab, the first level of transverse reinforcement is easy to identify,
but not for the deeper level. In addition, an anomaly in the subgrade material immediately after
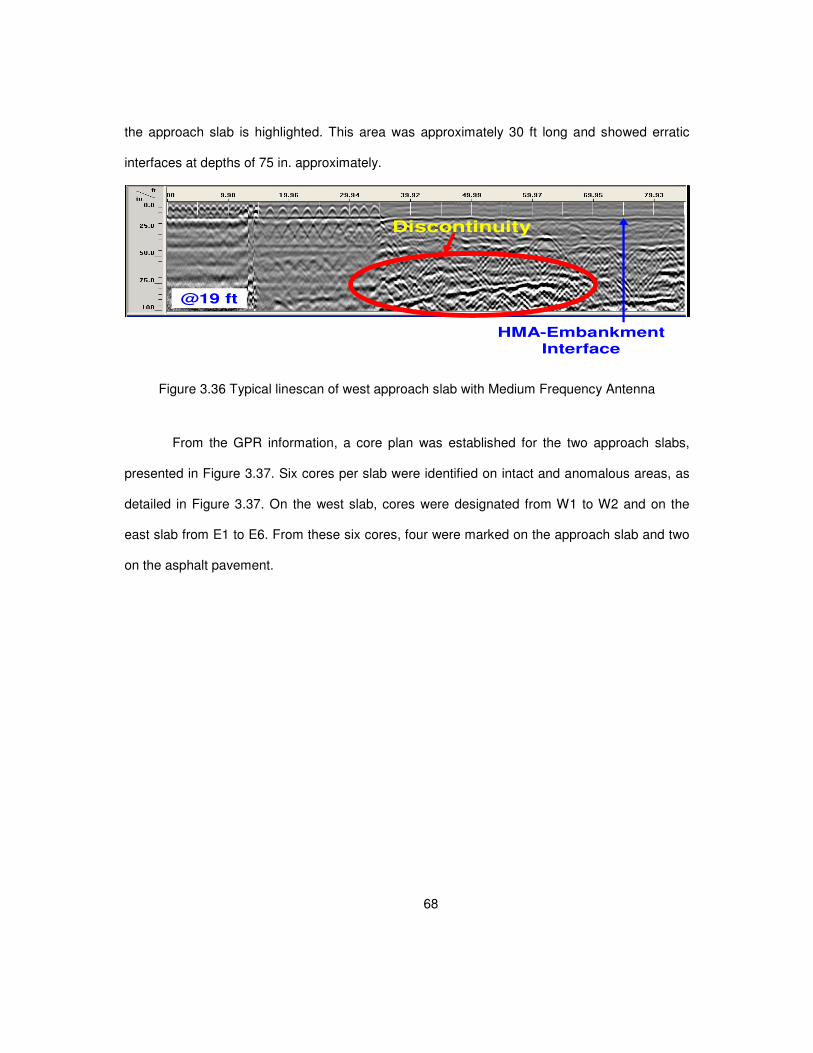
68
the approach slab is highlighted. This area was approximately 30 ft long and showed erratic
interfaces at depths of 75 in. approximately.
Discontinuity
@19 ft
HMA-Embankment Interface
Figure 3.36 Typical linescan of west approach slab with Medium Frequency Antenna
From the GPR information, a core plan was established for the two approach slabs,
presented in Figure 3.37. Six cores per slab were identified on intact and anomalous areas, as
detailed in Figure 3.37. On the west slab, cores were designated from W1 to W2 and on the
east slab from E1 to E6. From these six cores, four were marked on the approach slab and two
on the asphalt pavement.
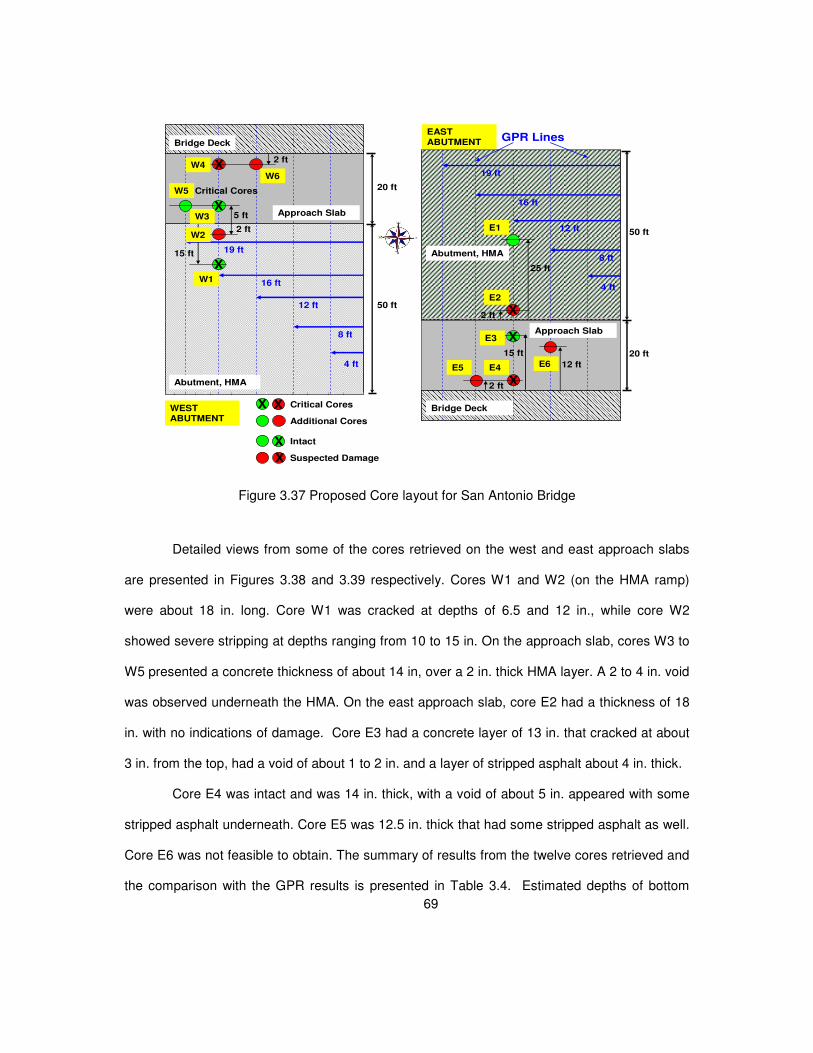
69
WEST ABUTMENT
19 ft
20 ft
50 ft
16 ft
12 ft
8 ft
4 ft
19 ft
20 ft
50 ft
16 ft
12 ft
8 ft
4 ft
GPR LinesEAST ABUTMENT
5 ft
2 ft
2 ft
15 ft
X
X
X
X X
Critical Cores
Additional Cores
Bridge Deck
Approach Slab
Abutment, HMA
Abutment, HMA
Bridge Deck
Approach Slab
X2 ft
X
15 ft
12 ft
X2 ft
25 ft
W1
W2
W3
W5
W4
W6
E1
E2
E3
E4E5 E6
Critical Cores
Suspected Damage
IntactX
X
Figure 3.37 Proposed Core layout for San Antonio Bridge
Detailed views from some of the cores retrieved on the west and east approach slabs
are presented in Figures 3.38 and 3.39 respectively. Cores W1 and W2 (on the HMA ramp)
were about 18 in. long. Core W1 was cracked at depths of 6.5 and 12 in., while core W2
showed severe stripping at depths ranging from 10 to 15 in. On the approach slab, cores W3 to
W5 presented a concrete thickness of about 14 in, over a 2 in. thick HMA layer. A 2 to 4 in. void
was observed underneath the HMA. On the east approach slab, core E2 had a thickness of 18
in. with no indications of damage. Core E3 had a concrete layer of 13 in. that cracked at about
3 in. from the top, had a void of about 1 to 2 in. and a layer of stripped asphalt about 4 in. thick.
Core E4 was intact and was 14 in. thick, with a void of about 5 in. appeared with some
stripped asphalt underneath. Core E5 was 12.5 in. thick that had some stripped asphalt as well.
Core E6 was not feasible to obtain. The summary of results from the twelve cores retrieved and
the comparison with the GPR results is presented in Table 3.4. Estimated depths of bottom
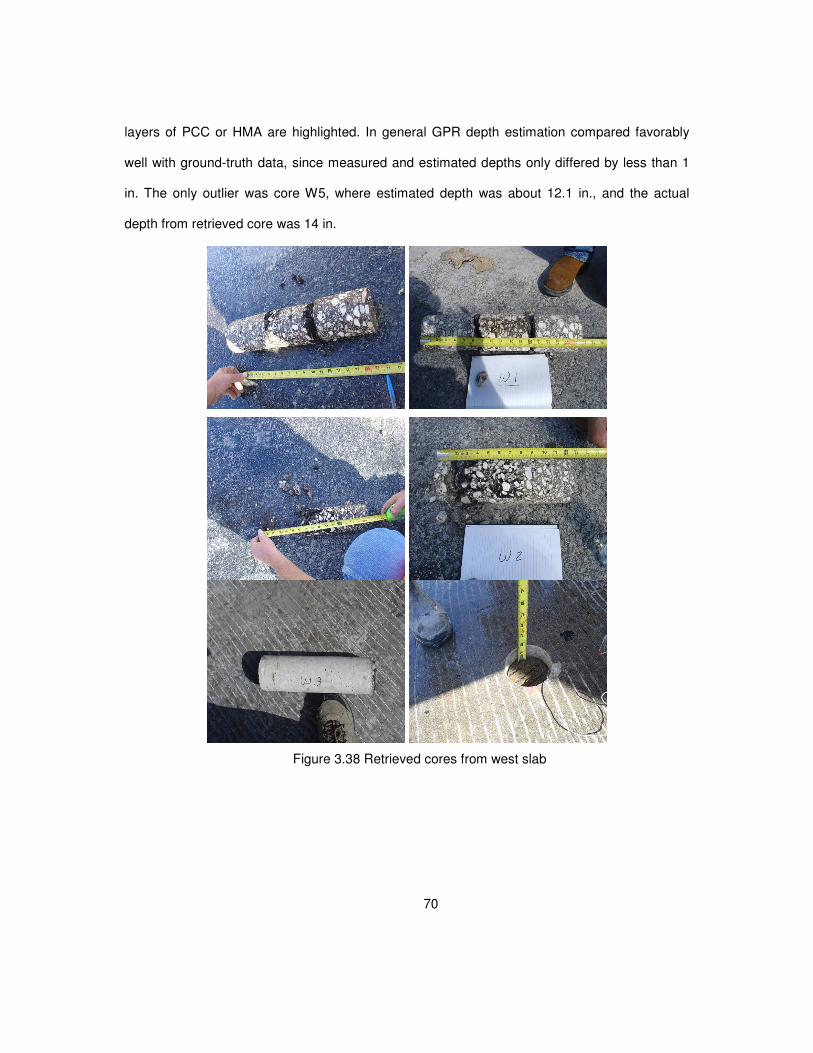
70
layers of PCC or HMA are highlighted. In general GPR depth estimation compared favorably
well with ground-truth data, since measured and estimated depths only differed by less than 1
in. The only outlier was core W5, where estimated depth was about 12.1 in., and the actual
depth from retrieved core was 14 in.
Figure 3.38 Retrieved cores from west slab
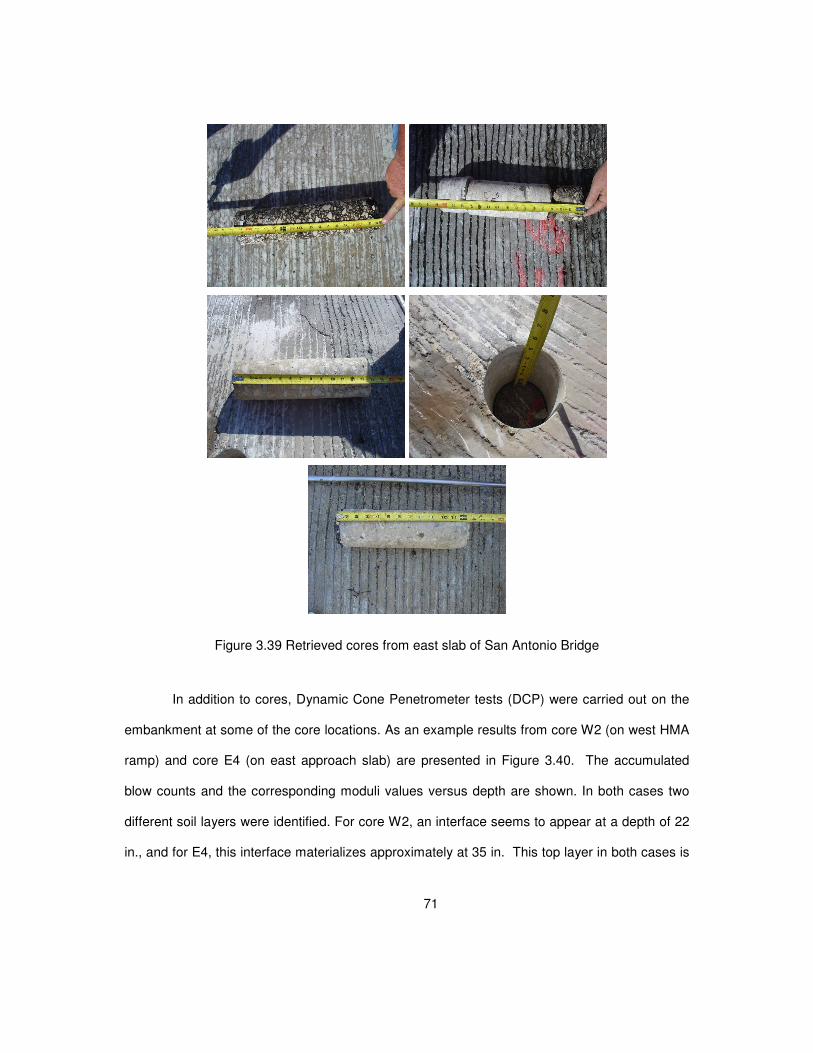
71
Figure 3.39 Retrieved cores from east slab of San Antonio Bridge
In addition to cores, Dynamic Cone Penetrometer tests (DCP) were carried out on the
embankment at some of the core locations. As an example results from core W2 (on west HMA
ramp) and core E4 (on east approach slab) are presented in Figure 3.40. The accumulated
blow counts and the corresponding moduli values versus depth are shown. In both cases two
different soil layers were identified. For core W2, an interface seems to appear at a depth of 22
in., and for E4, this interface materializes approximately at 35 in. This top layer in both cases is
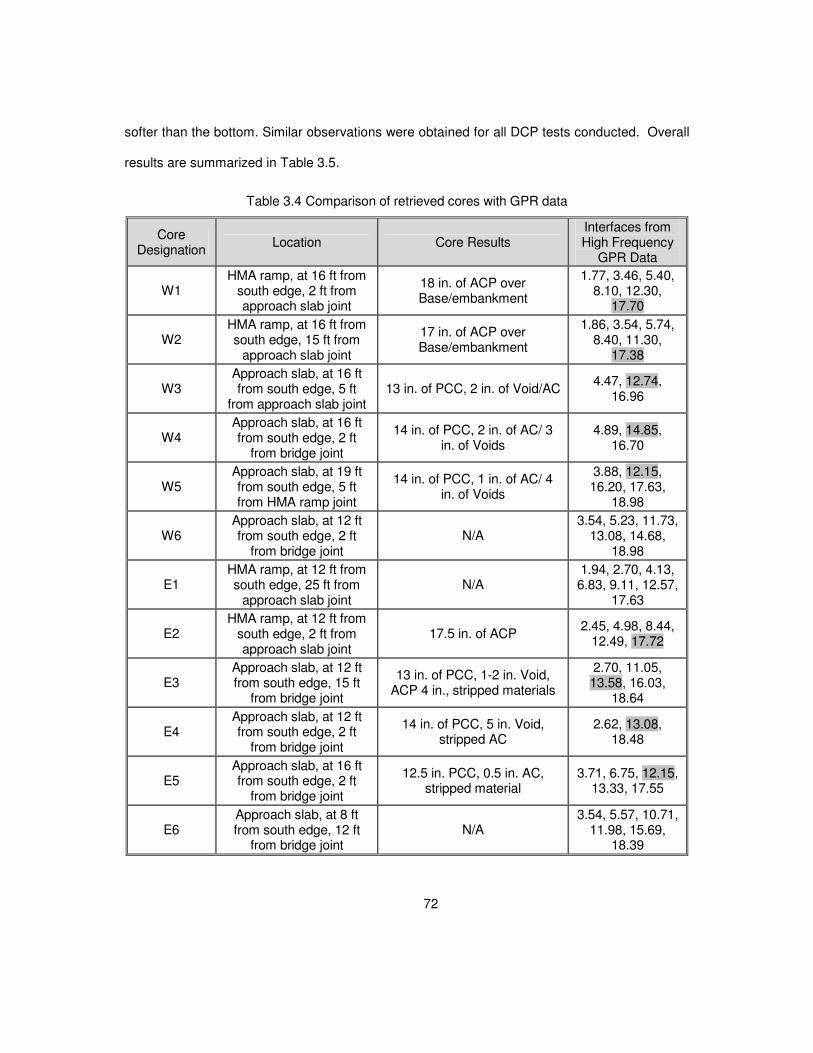
72
softer than the bottom. Similar observations were obtained for all DCP tests conducted. Overall
results are summarized in Table 3.5.
Table 3.4 Comparison of retrieved cores with GPR data
Core Designation
Location Core Results Interfaces from High Frequency
GPR Data
W1 HMA ramp, at 16 ft from
south edge, 2 ft from approach slab joint
18 in. of ACP over Base/embankment
1.77, 3.46, 5.40, 8.10, 12.30,
17.70
W2 HMA ramp, at 16 ft from south edge, 15 ft from
approach slab joint
17 in. of ACP over Base/embankment
1.86, 3.54, 5.74, 8.40, 11.30,
17.38
W3 Approach slab, at 16 ft from south edge, 5 ft
from approach slab joint 13 in. of PCC, 2 in. of Void/AC
4.47, 12.74, 16.96
W4 Approach slab, at 16 ft from south edge, 2 ft
from bridge joint
14 in. of PCC, 2 in. of AC/ 3 in. of Voids
4.89, 14.85, 16.70
W5 Approach slab, at 19 ft from south edge, 5 ft from HMA ramp joint
14 in. of PCC, 1 in. of AC/ 4 in. of Voids
3.88, 12.15, 16.20, 17.63,
18.98
W6 Approach slab, at 12 ft from south edge, 2 ft
from bridge joint N/A
3.54, 5.23, 11.73, 13.08, 14.68,
18.98
E1 HMA ramp, at 12 ft from south edge, 25 ft from
approach slab joint N/A
1.94, 2.70, 4.13, 6.83, 9.11, 12.57,
17.63
E2 HMA ramp, at 12 ft from
south edge, 2 ft from approach slab joint
17.5 in. of ACP 2.45, 4.98, 8.44,
12.49, 17.72
E3 Approach slab, at 12 ft from south edge, 15 ft
from bridge joint
13 in. of PCC, 1-2 in. Void, ACP 4 in., stripped materials
2.70, 11.05, 13.58, 16.03,
18.64
E4 Approach slab, at 12 ft from south edge, 2 ft
from bridge joint
14 in. of PCC, 5 in. Void, stripped AC
2.62, 13.08, 18.48
E5 Approach slab, at 16 ft from south edge, 2 ft
from bridge joint
12.5 in. PCC, 0.5 in. AC, stripped material
3.71, 6.75, 12.15, 13.33, 17.55
E6 Approach slab, at 8 ft from south edge, 12 ft
from bridge joint N/A
3.54, 5.57, 10.71, 11.98, 15.69,
18.39
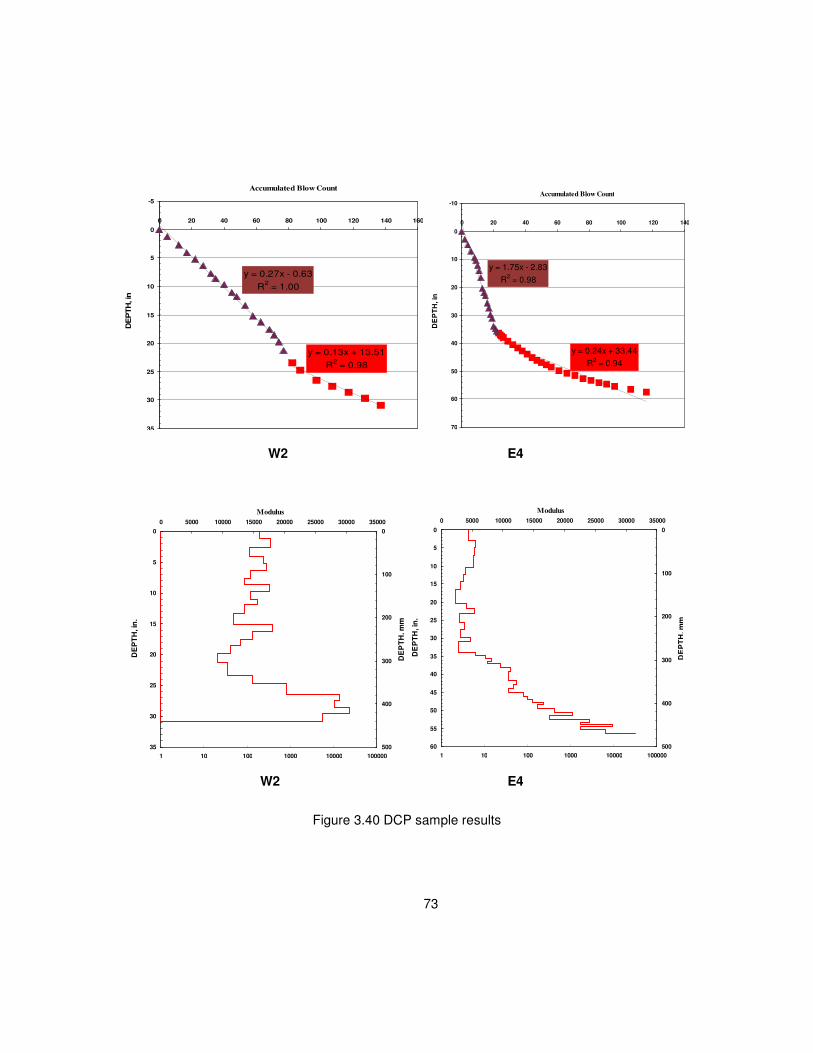
73
y = 0.13x + 13.51
R2 = 0.98
y = 0.27x - 0.63
R2 = 1.00
-5
0
5
10
15
20
25
30
35
0 20 40 60 80 100 120 140 160
Accumulated Blow Count
DE
PTH
, in
y = 0.24x + 33.44
R2 = 0.94
y = 1.75x - 2.83
R2 = 0.98
-10
0
10
20
30
40
50
60
70
0 20 40 60 80 100 120 140
Accumulated Blow Count
DE
PT
H, in
W2 E4
0
100
200
300
400
500
1 10 100 1000 10000 100000
DE
PT
H, m
m
0
5
10
15
20
25
30
35
0 5000 10000 15000 20000 25000 30000 35000
Modulus
DE
PT
H, in
.
0
100
200
300
400
500
1 10 100 1000 10000 100000
DE
PT
H, m
m
0
5
10
15
20
25
30
35
40
45
50
55
60
0 5000 10000 15000 20000 25000 30000 35000
Modulus
DE
PT
H, in
.
W2 E4
Figure 3.40 DCP sample results
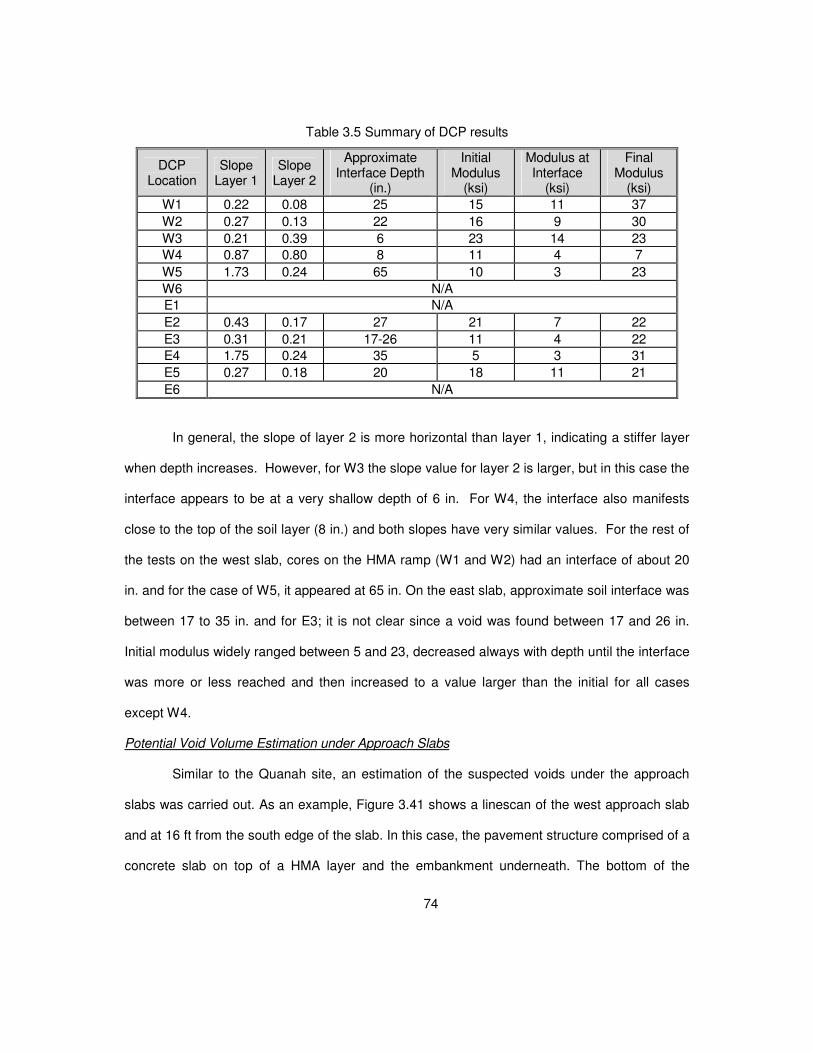
74
Table 3.5 Summary of DCP results
DCP Location
Slope Layer 1
Slope Layer 2
Approximate Interface Depth
(in.)
Initial Modulus
(ksi)
Modulus at Interface
(ksi)
Final Modulus
(ksi)
W1 0.22 0.08 25 15 11 37
W2 0.27 0.13 22 16 9 30
W3 0.21 0.39 6 23 14 23
W4 0.87 0.80 8 11 4 7
W5 1.73 0.24 65 10 3 23
W6 N/A
E1 N/A
E2 0.43 0.17 27 21 7 22
E3 0.31 0.21 17-26 11 4 22
E4 1.75 0.24 35 5 3 31
E5 0.27 0.18 20 18 11 21
E6 N/A
In general, the slope of layer 2 is more horizontal than layer 1, indicating a stiffer layer
when depth increases. However, for W3 the slope value for layer 2 is larger, but in this case the
interface appears to be at a very shallow depth of 6 in. For W4, the interface also manifests
close to the top of the soil layer (8 in.) and both slopes have very similar values. For the rest of
the tests on the west slab, cores on the HMA ramp (W1 and W2) had an interface of about 20
in. and for the case of W5, it appeared at 65 in. On the east slab, approximate soil interface was
between 17 to 35 in. and for E3; it is not clear since a void was found between 17 and 26 in.
Initial modulus widely ranged between 5 and 23, decreased always with depth until the interface
was more or less reached and then increased to a value larger than the initial for all cases
except W4.
Potential Void Volume Estimation under Approach Slabs
Similar to the Quanah site, an estimation of the suspected voids under the approach
slabs was carried out. As an example, Figure 3.41 shows a linescan of the west approach slab
and at 16 ft from the south edge of the slab. In this case, the pavement structure comprised of a
concrete slab on top of a HMA layer and the embankment underneath. The bottom of the
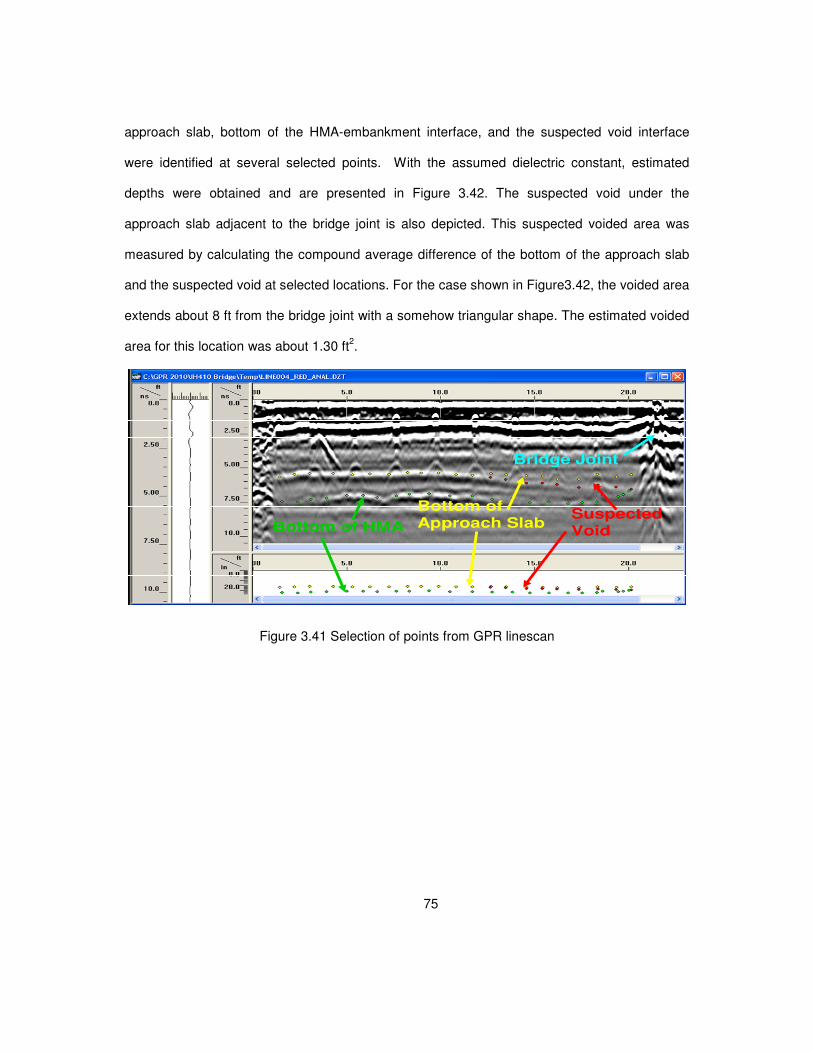
75
approach slab, bottom of the HMA-embankment interface, and the suspected void interface
were identified at several selected points. With the assumed dielectric constant, estimated
depths were obtained and are presented in Figure 3.42. The suspected void under the
approach slab adjacent to the bridge joint is also depicted. This suspected voided area was
measured by calculating the compound average difference of the bottom of the approach slab
and the suspected void at selected locations. For the case shown in Figure3.42, the voided area
extends about 8 ft from the bridge joint with a somehow triangular shape. The estimated voided
area for this location was about 1.30 ft2.
Bottom of HMA
Bottom of Approach Slab
Suspected Void
Bridge Joint
Figure 3.41 Selection of points from GPR linescan
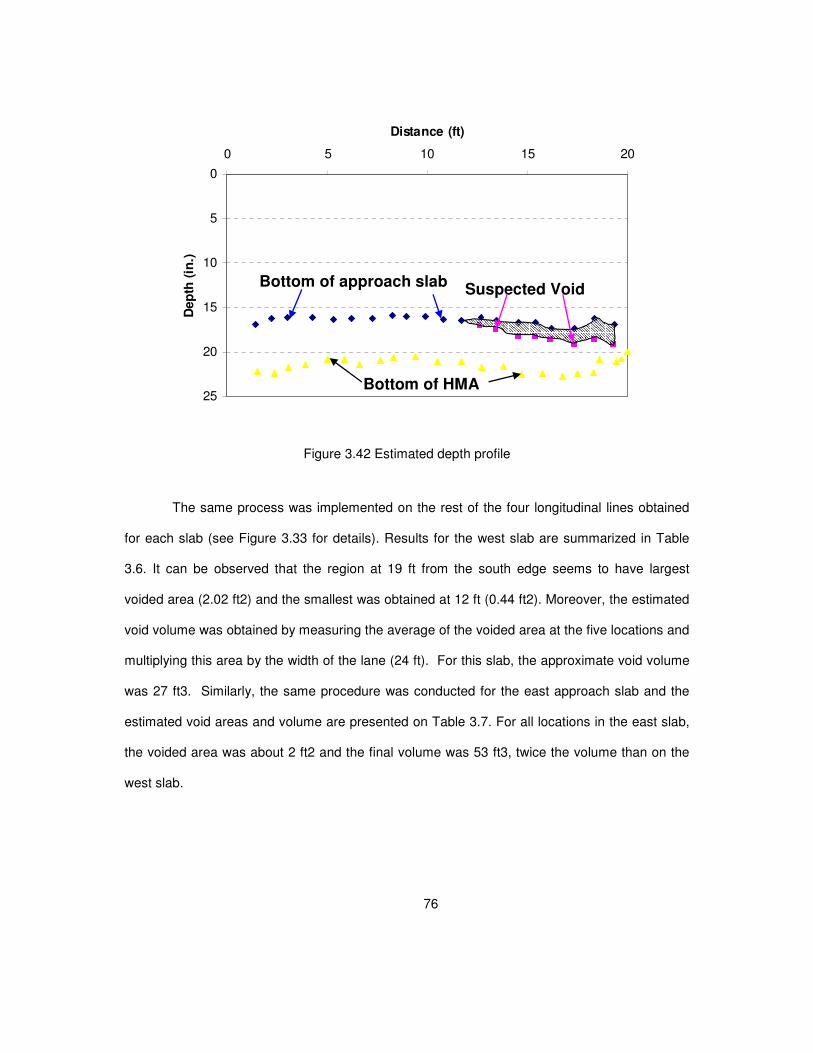
76
0
5
10
15
20
25
0 5 10 15 20
Distance (ft)
Dep
th (
in.)
Bottom of approach slabSuspected Void
Bottom of HMA
Figure 3.42 Estimated depth profile
The same process was implemented on the rest of the four longitudinal lines obtained
for each slab (see Figure 3.33 for details). Results for the west slab are summarized in Table
3.6. It can be observed that the region at 19 ft from the south edge seems to have largest
voided area (2.02 ft2) and the smallest was obtained at 12 ft (0.44 ft2). Moreover, the estimated
void volume was obtained by measuring the average of the voided area at the five locations and
multiplying this area by the width of the lane (24 ft). For this slab, the approximate void volume
was 27 ft3. Similarly, the same procedure was conducted for the east approach slab and the
estimated void areas and volume are presented on Table 3.7. For all locations in the east slab,
the voided area was about 2 ft2 and the final volume was 53 ft3, twice the volume than on the
west slab.
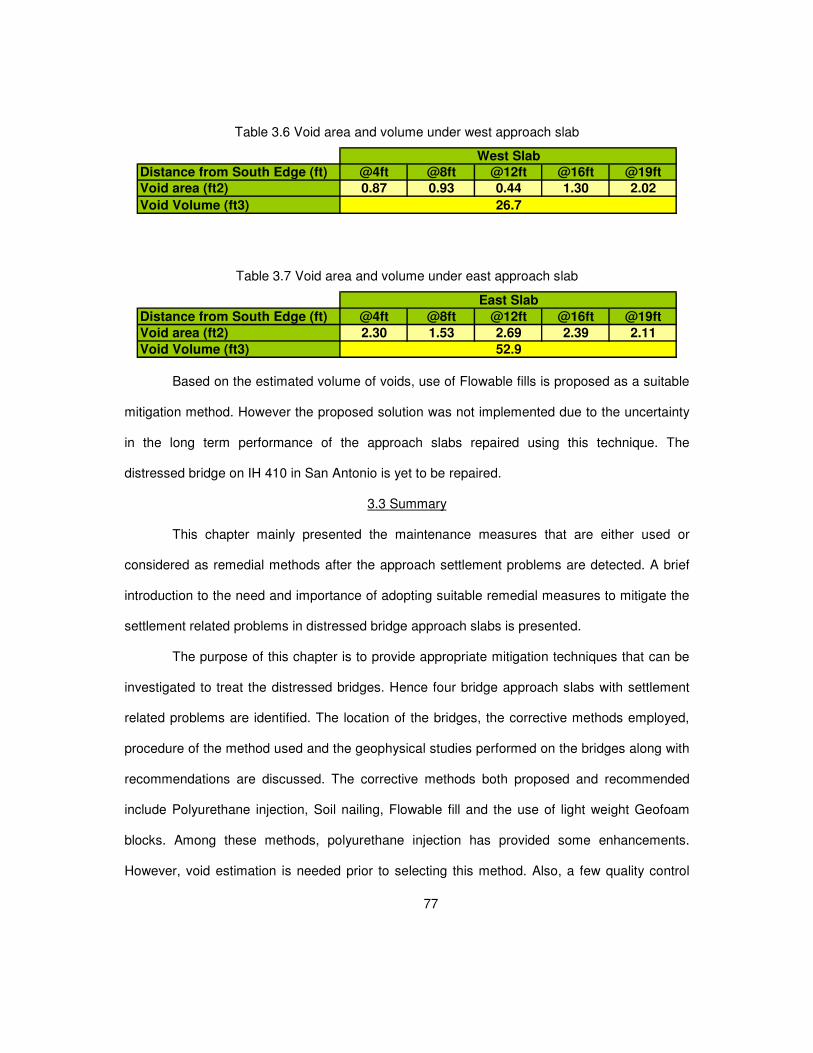
77
Table 3.6 Void area and volume under west approach slab
Distance from South Edge (ft) @4ft @8ft @12ft @16ft @19ft
Void area (ft2) 0.87 0.93 0.44 1.30 2.02
Void Volume (ft3)
West Slab
26.7
Table 3.7 Void area and volume under east approach slab
Distance from South Edge (ft) @4ft @8ft @12ft @16ft @19ft
Void area (ft2) 2.30 1.53 2.69 2.39 2.11
Void Volume (ft3) 52.9
East Slab
Based on the estimated volume of voids, use of Flowable fills is proposed as a suitable
mitigation method. However the proposed solution was not implemented due to the uncertainty
in the long term performance of the approach slabs repaired using this technique. The
distressed bridge on IH 410 in San Antonio is yet to be repaired.
3.3 Summary
This chapter mainly presented the maintenance measures that are either used or
considered as remedial methods after the approach settlement problems are detected. A brief
introduction to the need and importance of adopting suitable remedial measures to mitigate the
settlement related problems in distressed bridge approach slabs is presented.
The purpose of this chapter is to provide appropriate mitigation techniques that can be
investigated to treat the distressed bridges. Hence four bridge approach slabs with settlement
related problems are identified. The location of the bridges, the corrective methods employed,
procedure of the method used and the geophysical studies performed on the bridges along with
recommendations are discussed. The corrective methods both proposed and recommended
include Polyurethane injection, Soil nailing, Flowable fill and the use of light weight Geofoam
blocks. Among these methods, polyurethane injection has provided some enhancements.
However, void estimation is needed prior to selecting this method. Also, a few quality control

78
measures need to be established and implemented when using this method. In the case of soil
nailing, the method was mainly used to enhance the stability of the MSE wall setup, which in
turn can control erosion thereby enhancing the stability of the whole bridge including the
approach slabs at both ends.
Two other bridges in Childress and San Antonio districts were also studied for potential
implementation of light weight Geofoam blocks and use of Flowable fills. Both methods are
considered to have high potential to mitigate settlements. However, these methods are not
explored further and they need to be investigated in future studies.
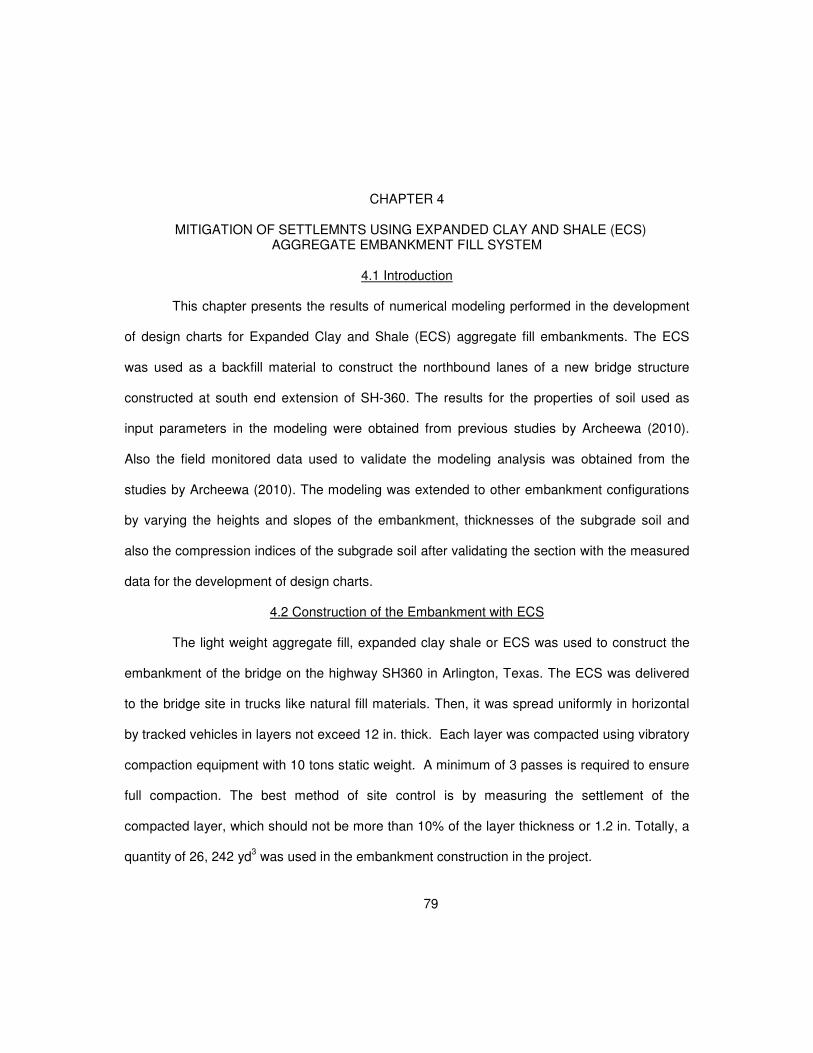
79
CHAPTER 4
4MITIGATION OF SETTLEMNTS USING EXPANDED CLAY AND SHALE (ECS) AGGREGATE EMBANKMENT FILL SYSTEM
4.1 Introduction
This chapter presents the results of numerical modeling performed in the development
of design charts for Expanded Clay and Shale (ECS) aggregate fill embankments. The ECS
was used as a backfill material to construct the northbound lanes of a new bridge structure
constructed at south end extension of SH-360. The results for the properties of soil used as
input parameters in the modeling were obtained from previous studies by Archeewa (2010).
Also the field monitored data used to validate the modeling analysis was obtained from the
studies by Archeewa (2010). The modeling was extended to other embankment configurations
by varying the heights and slopes of the embankment, thicknesses of the subgrade soil and
also the compression indices of the subgrade soil after validating the section with the measured
data for the development of design charts.
4.2 Construction of the Embankment with ECS
The light weight aggregate fill, expanded clay shale or ECS was used to construct the
embankment of the bridge on the highway SH360 in Arlington, Texas. The ECS was delivered
to the bridge site in trucks like natural fill materials. Then, it was spread uniformly in horizontal
by tracked vehicles in layers not exceed 12 in. thick. Each layer was compacted using vibratory
compaction equipment with 10 tons static weight. A minimum of 3 passes is required to ensure
full compaction. The best method of site control is by measuring the settlement of the
compacted layer, which should not be more than 10% of the layer thickness or 1.2 in. Totally, a
quantity of 26, 242 yd3 was used in the embankment construction in the project.
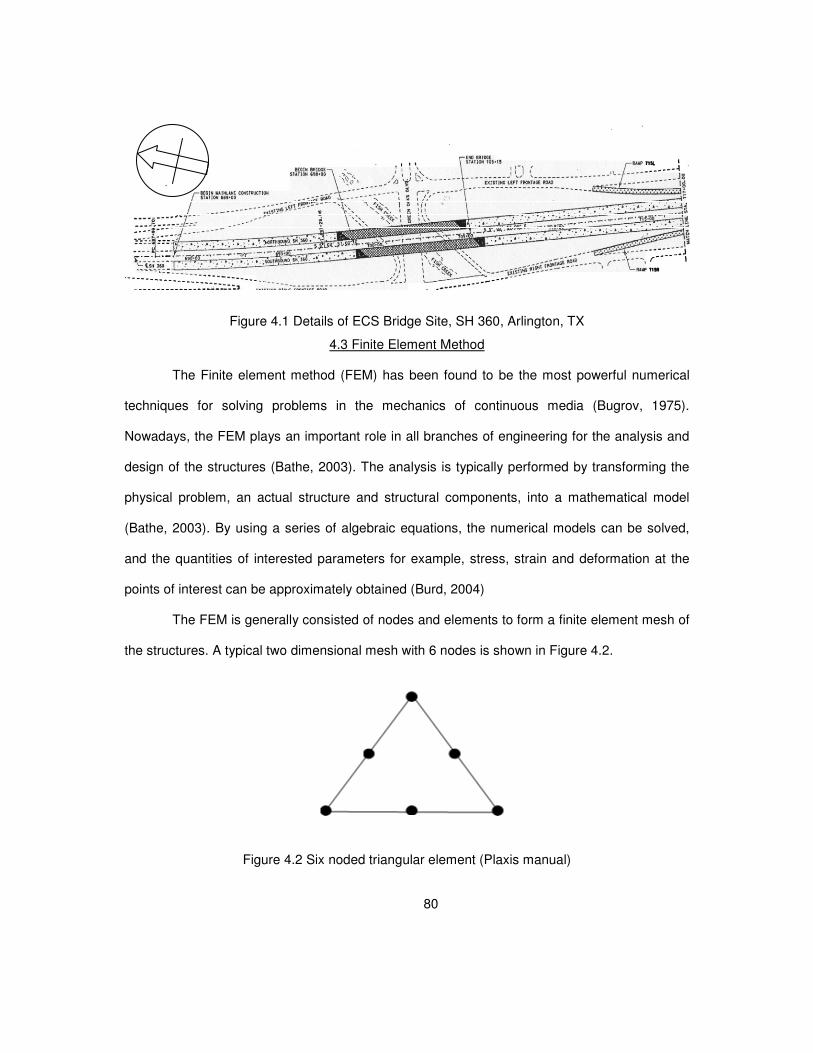
80
Figure 4.1 Details of ECS Bridge Site, SH 360, Arlington, TX
4.3 Finite Element Method
The Finite element method (FEM) has been found to be the most powerful numerical
techniques for solving problems in the mechanics of continuous media (Bugrov, 1975).
Nowadays, the FEM plays an important role in all branches of engineering for the analysis and
design of the structures (Bathe, 2003). The analysis is typically performed by transforming the
physical problem, an actual structure and structural components, into a mathematical model
(Bathe, 2003). By using a series of algebraic equations, the numerical models can be solved,
and the quantities of interested parameters for example, stress, strain and deformation at the
points of interest can be approximately obtained (Burd, 2004)
The FEM is generally consisted of nodes and elements to form a finite element mesh of
the structures. A typical two dimensional mesh with 6 nodes is shown in Figure 4.2.
Figure 4.2 Six noded triangular element (Plaxis manual)

81
The nodes are not only the points where more then one or two elements connect to the
others, but also the points where values of the primary variable of interested parameter are
calculated (Burd, 2004). In the FEM analysis, the values of the stain will be calculated and then
interpolated in for the entire structure. Later, a relationship between stress-strain of a material
behavior usually termed as a constitutive law is used to calculate the stress occurred in the
mesh. Last, the force acting on each node obtained from the previous step will be calculated
further to compute the nodal displacements by relating the nodal forces with the stiffness
equations.
For the one dimensional (1-D) consolidation, the phenomenon can be described by the
following differential equation:
2
2
z
pc
t
pv ∂∂
=∂∂
(4.1)
Where
w
OED
v
kEc
γ=
)21)(1(
)1(
vv
EvEOED −+
−=
yHZ −=
k is permeability of soil
E is the Young’s modulus
υ is the Poisson’s ratio
wγ is unit weight of water
EOED is the oedometer modulus
The analytical solution for the above Equation 4.1 in a relation to p/p0 as a function of
time and position is presented by Verruijt (1983) and this equation is presented in the following:
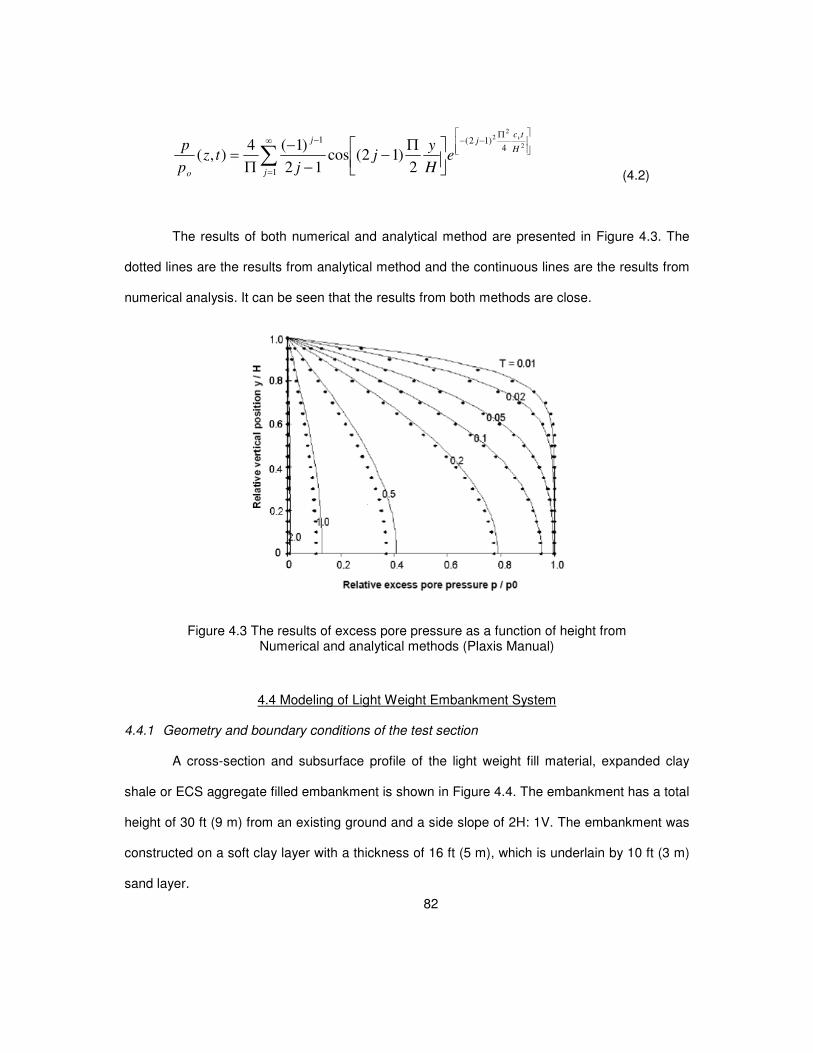
82
Π−−∞
=
−
Π−
−−
Π= ∑
2
22
4)12(
1
1
2)12(cos
12
)1(4),(
H
tcj
j
j
o
v
eH
yj
jtz
p
p
(4.2)
The results of both numerical and analytical method are presented in Figure 4.3. The
dotted lines are the results from analytical method and the continuous lines are the results from
numerical analysis. It can be seen that the results from both methods are close.
Figure 4.3 The results of excess pore pressure as a function of height from Numerical and analytical methods (Plaxis Manual)
4.4 Modeling of Light Weight Embankment System
4.4.1 Geometry and boundary conditions of the test section
A cross-section and subsurface profile of the light weight fill material, expanded clay
shale or ECS aggregate filled embankment is shown in Figure 4.4. The embankment has a total
height of 30 ft (9 m) from an existing ground and a side slope of 2H: 1V. The embankment was
constructed on a soft clay layer with a thickness of 16 ft (5 m), which is underlain by 10 ft (3 m)
sand layer.
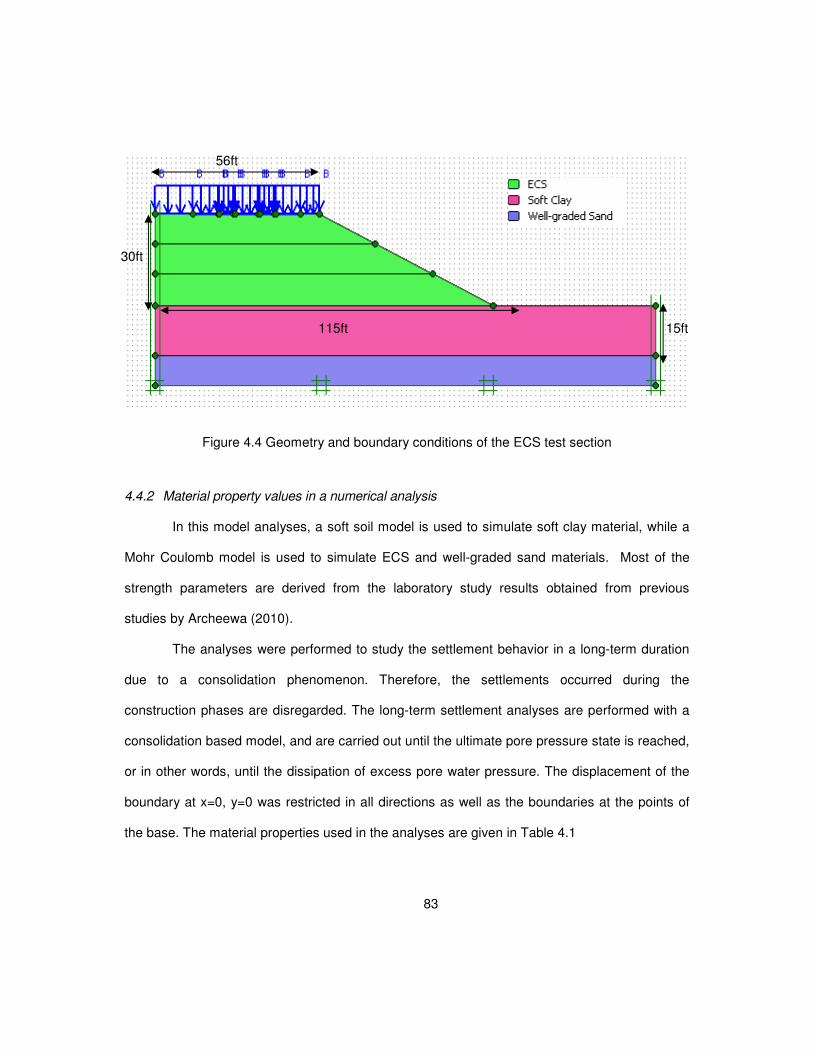
83
Figure 4.4 Geometry and boundary conditions of the ECS test section
4.4.2 Material property values in a numerical analysis
In this model analyses, a soft soil model is used to simulate soft clay material, while a
Mohr Coulomb model is used to simulate ECS and well-graded sand materials. Most of the
strength parameters are derived from the laboratory study results obtained from previous
studies by Archeewa (2010).
The analyses were performed to study the settlement behavior in a long-term duration
due to a consolidation phenomenon. Therefore, the settlements occurred during the
construction phases are disregarded. The long-term settlement analyses are performed with a
consolidation based model, and are carried out until the ultimate pore pressure state is reached,
or in other words, until the dissipation of excess pore water pressure. The displacement of the
boundary at x=0, y=0 was restricted in all directions as well as the boundaries at the points of
the base. The material properties used in the analyses are given in Table 4.1
15ft 115ft
30ft
56ft
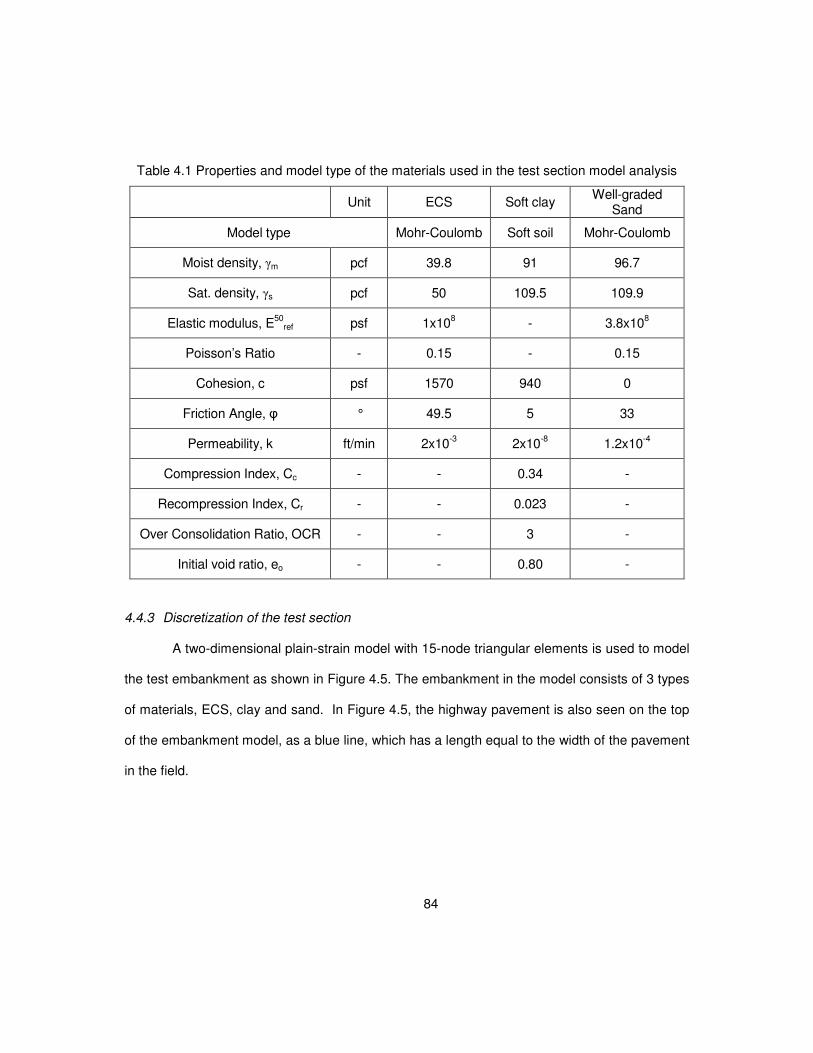
84
Table 4.1 Properties and model type of the materials used in the test section model analysis
Unit ECS Soft clay Well-graded
Sand
Model type Mohr-Coulomb Soft soil Mohr-Coulomb
Moist density, γm pcf 39.8 91 96.7
Sat. density, γs pcf 50 109.5 109.9
Elastic modulus, E50
ref psf 1x10⁸ - 3.8x10
8
Poisson’s Ratio - 0.15 - 0.15
Cohesion, c psf 1570 940 0
Friction Angle, φ ° 49.5 5 33
Permeability, k ft/min 2x10⁻³ 2x10
-8 1.2x10
-4
Compression Index, Cc - - 0.34 -
Recompression Index, Cr - - 0.023 -
Over Consolidation Ratio, OCR - - 3 -
Initial void ratio, eo - - 0.80 -
4.4.3 Discretization of the test section
A two-dimensional plain-strain model with 15-node triangular elements is used to model
the test embankment as shown in Figure 4.5. The embankment in the model consists of 3 types
of materials, ECS, clay and sand. In Figure 4.5, the highway pavement is also seen on the top
of the embankment model, as a blue line, which has a length equal to the width of the pavement
in the field.
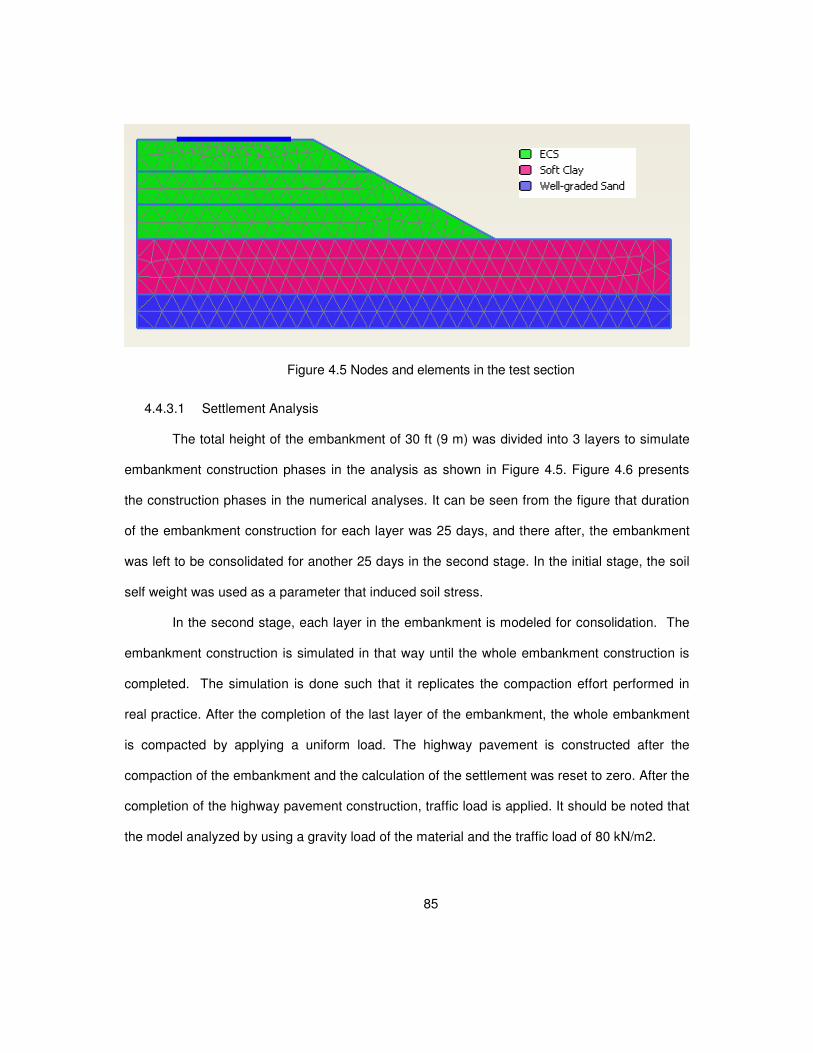
85
Figure 4.5 Nodes and elements in the test section
4.4.3.1 Settlement Analysis
The total height of the embankment of 30 ft (9 m) was divided into 3 layers to simulate
embankment construction phases in the analysis as shown in Figure 4.5. Figure 4.6 presents
the construction phases in the numerical analyses. It can be seen from the figure that duration
of the embankment construction for each layer was 25 days, and there after, the embankment
was left to be consolidated for another 25 days in the second stage. In the initial stage, the soil
self weight was used as a parameter that induced soil stress.
In the second stage, each layer in the embankment is modeled for consolidation. The
embankment construction is simulated in that way until the whole embankment construction is
completed. The simulation is done such that it replicates the compaction effort performed in
real practice. After the completion of the last layer of the embankment, the whole embankment
is compacted by applying a uniform load. The highway pavement is constructed after the
compaction of the embankment and the calculation of the settlement was reset to zero. After the
completion of the highway pavement construction, traffic load is applied. It should be noted that
the model analyzed by using a gravity load of the material and the traffic load of 80 kN/m2.
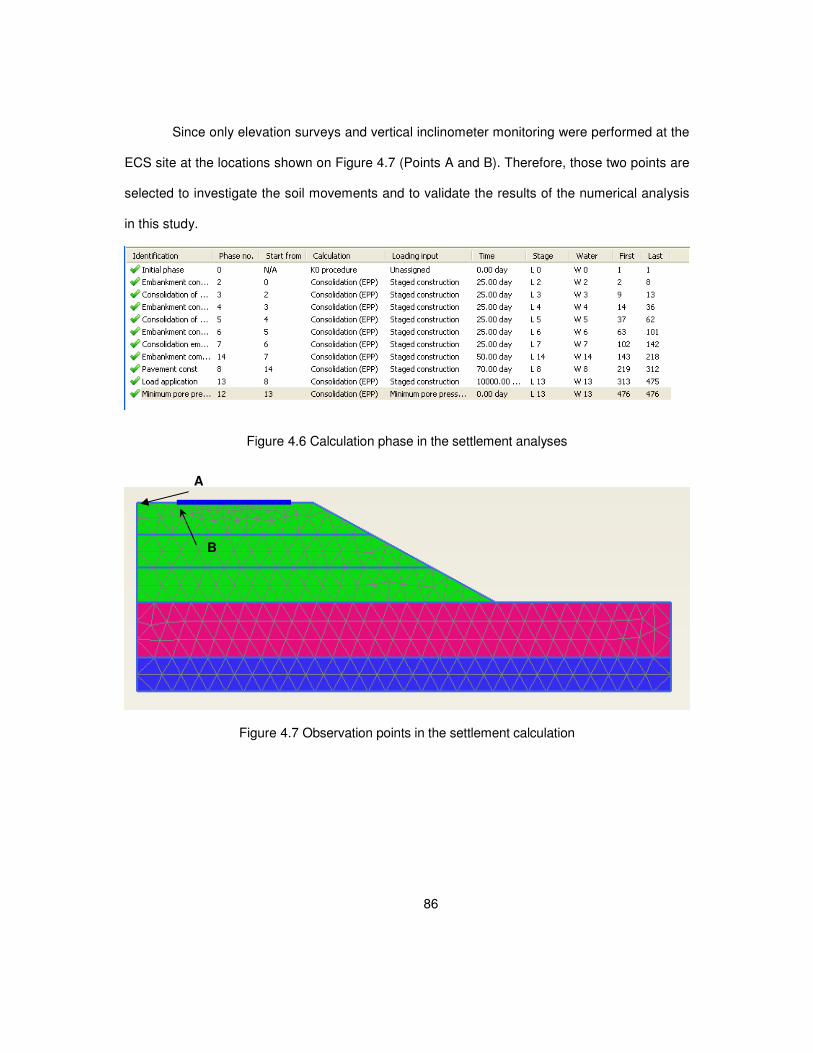
86
Since only elevation surveys and vertical inclinometer monitoring were performed at the
ECS site at the locations shown on Figure 4.7 (Points A and B). Therefore, those two points are
selected to investigate the soil movements and to validate the results of the numerical analysis
in this study.
Figure 4.6 Calculation phase in the settlement analyses
Figure 4.7 Observation points in the settlement calculation
A
B
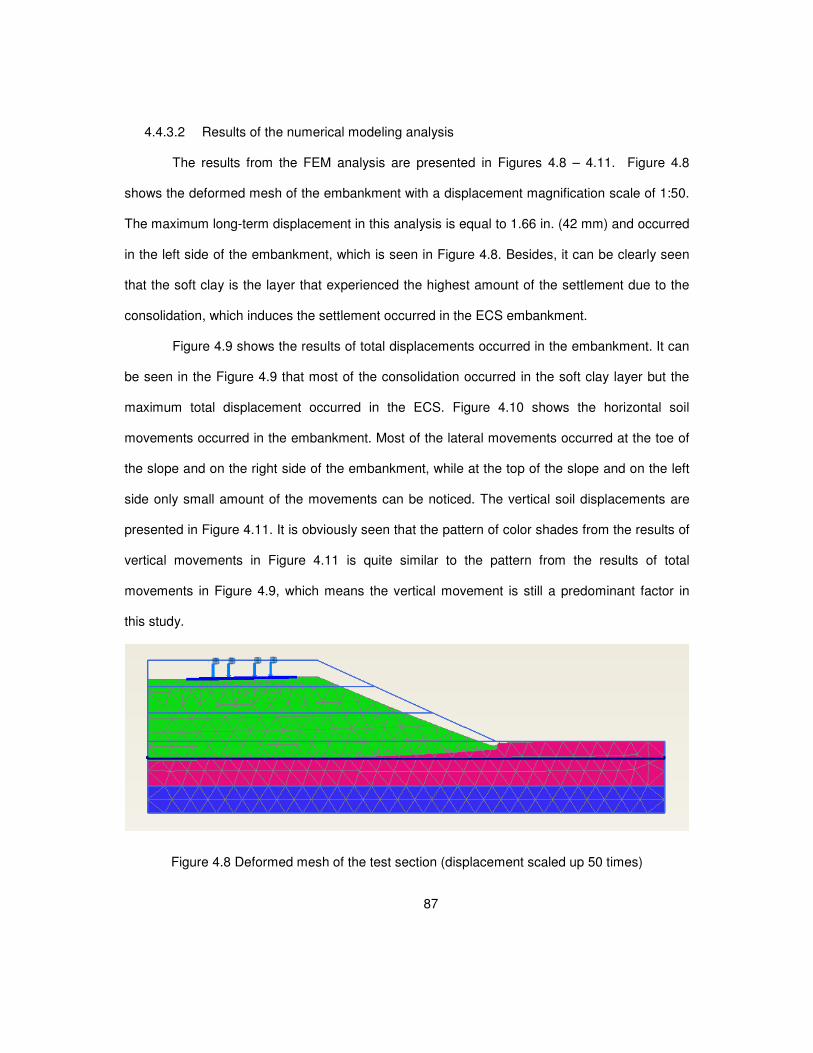
87
4.4.3.2 Results of the numerical modeling analysis
The results from the FEM analysis are presented in Figures 4.8 – 4.11. Figure 4.8
shows the deformed mesh of the embankment with a displacement magnification scale of 1:50.
The maximum long-term displacement in this analysis is equal to 1.66 in. (42 mm) and occurred
in the left side of the embankment, which is seen in Figure 4.8. Besides, it can be clearly seen
that the soft clay is the layer that experienced the highest amount of the settlement due to the
consolidation, which induces the settlement occurred in the ECS embankment.
Figure 4.9 shows the results of total displacements occurred in the embankment. It can
be seen in the Figure 4.9 that most of the consolidation occurred in the soft clay layer but the
maximum total displacement occurred in the ECS. Figure 4.10 shows the horizontal soil
movements occurred in the embankment. Most of the lateral movements occurred at the toe of
the slope and on the right side of the embankment, while at the top of the slope and on the left
side only small amount of the movements can be noticed. The vertical soil displacements are
presented in Figure 4.11. It is obviously seen that the pattern of color shades from the results of
vertical movements in Figure 4.11 is quite similar to the pattern from the results of total
movements in Figure 4.9, which means the vertical movement is still a predominant factor in
this study.
Figure 4.8 Deformed mesh of the test section (displacement scaled up 50 times)
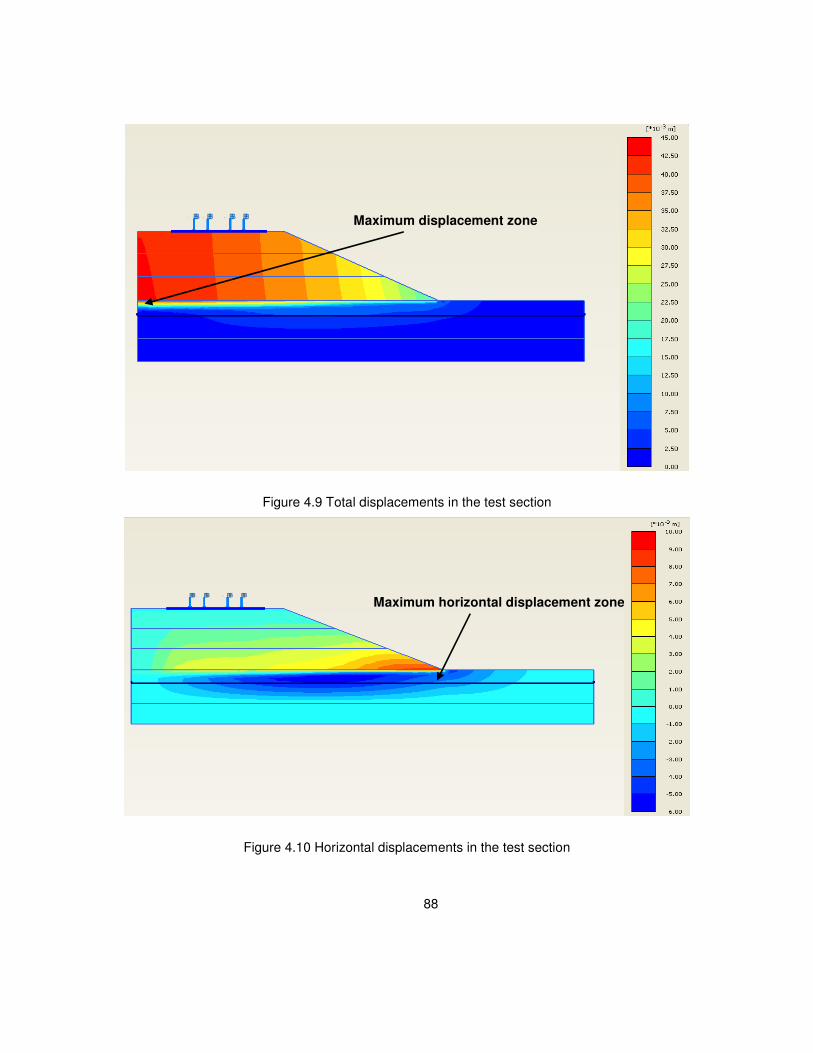
88
Figure 4.9 Total displacements in the test section
Figure 4.10 Horizontal displacements in the test section
Maximum displacement zone
Maximum horizontal displacement zone
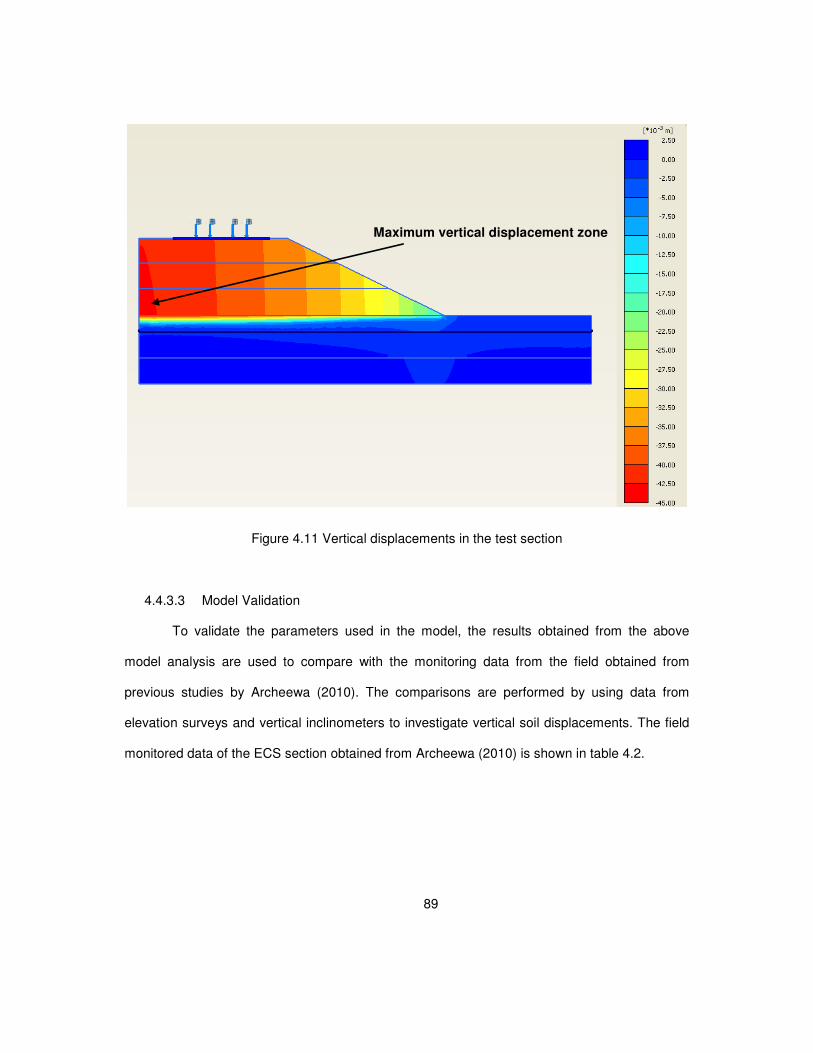
89
Figure 4.11 Vertical displacements in the test section
4.4.3.3 Model Validation
To validate the parameters used in the model, the results obtained from the above
model analysis are used to compare with the monitoring data from the field obtained from
previous studies by Archeewa (2010). The comparisons are performed by using data from
elevation surveys and vertical inclinometers to investigate vertical soil displacements. The field
monitored data of the ECS section obtained from Archeewa (2010) is shown in table 4.2.
Maximum vertical displacement zone
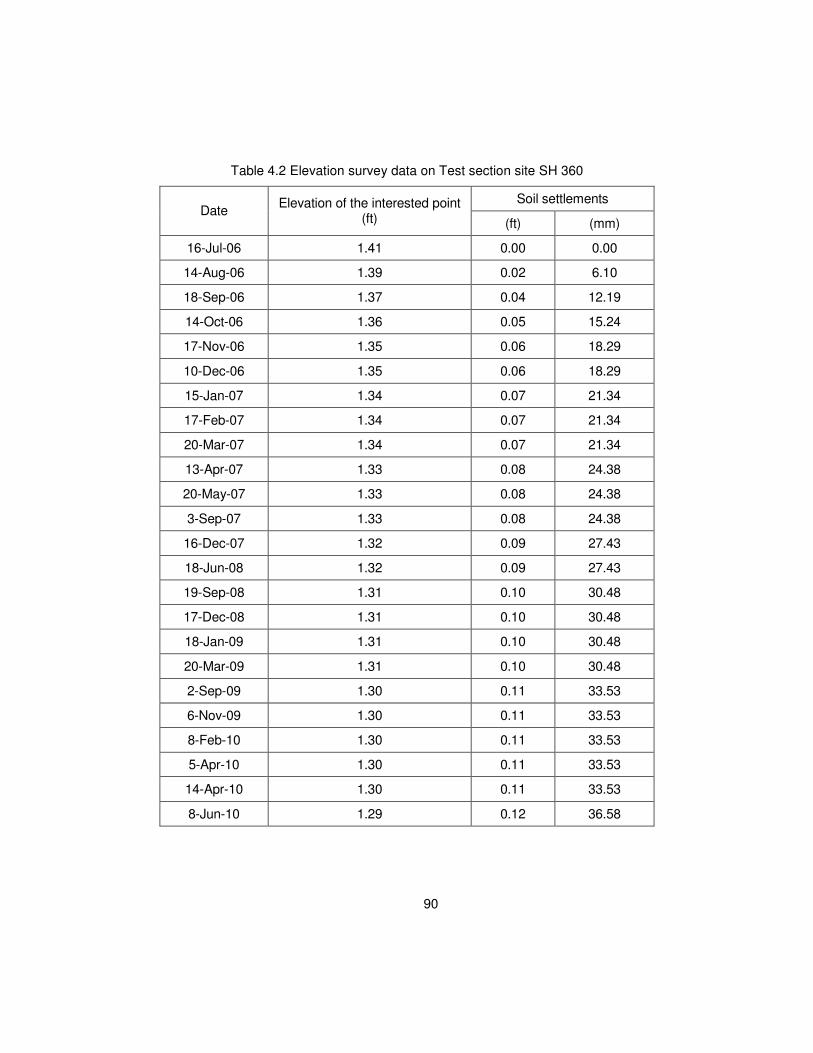
90
Table 4.2 Elevation survey data on Test section site SH 360
Soil settlements Date
Elevation of the interested point (ft) (ft) (mm)
16-Jul-06 1.41 0.00 0.00
14-Aug-06 1.39 0.02 6.10
18-Sep-06 1.37 0.04 12.19
14-Oct-06 1.36 0.05 15.24
17-Nov-06 1.35 0.06 18.29
10-Dec-06 1.35 0.06 18.29
15-Jan-07 1.34 0.07 21.34
17-Feb-07 1.34 0.07 21.34
20-Mar-07 1.34 0.07 21.34
13-Apr-07 1.33 0.08 24.38
20-May-07 1.33 0.08 24.38
3-Sep-07 1.33 0.08 24.38
16-Dec-07 1.32 0.09 27.43
18-Jun-08 1.32 0.09 27.43
19-Sep-08 1.31 0.10 30.48
17-Dec-08 1.31 0.10 30.48
18-Jan-09 1.31 0.10 30.48
20-Mar-09 1.31 0.10 30.48
2-Sep-09 1.30 0.11 33.53
6-Nov-09 1.30 0.11 33.53
8-Feb-10 1.30 0.11 33.53
5-Apr-10 1.30 0.11 33.53
14-Apr-10 1.30 0.11 33.53
8-Jun-10 1.29 0.12 36.58
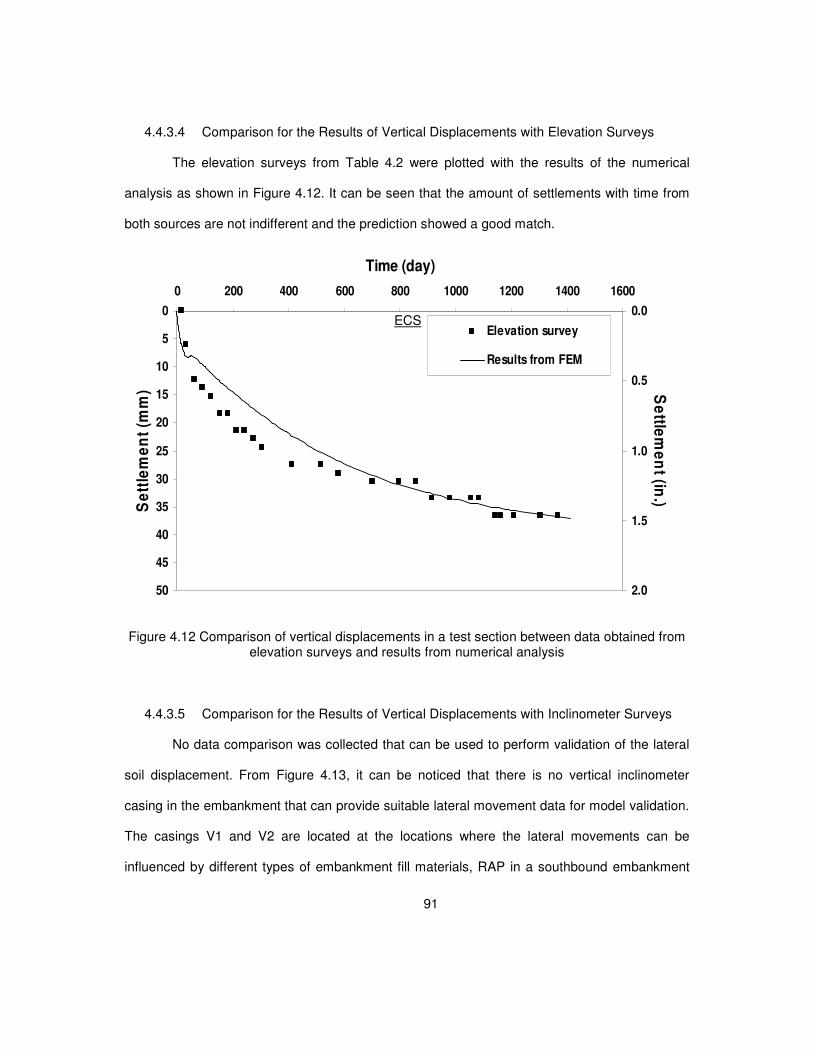
91
4.4.3.4 Comparison for the Results of Vertical Displacements with Elevation Surveys
The elevation surveys from Table 4.2 were plotted with the results of the numerical
analysis as shown in Figure 4.12. It can be seen that the amount of settlements with time from
both sources are not indifferent and the prediction showed a good match.
0
5
10
15
20
25
30
35
40
45
50
0 200 400 600 800 1000 1200 1400 1600
Time (day)
Se
ttle
me
nt
(mm
)
0.0
0.5
1.0
1.5
2.0
Se
ttlem
en
t (in.)
Elevation survey
Results from FEM
Figure 4.12 Comparison of vertical displacements in a test section between data obtained from elevation surveys and results from numerical analysis
4.4.3.5 Comparison for the Results of Vertical Displacements with Inclinometer Surveys
No data comparison was collected that can be used to perform validation of the lateral
soil displacement. From Figure 4.13, it can be noticed that there is no vertical inclinometer
casing in the embankment that can provide suitable lateral movement data for model validation.
The casings V1 and V2 are located at the locations where the lateral movements can be
influenced by different types of embankment fill materials, RAP in a southbound embankment
ECS
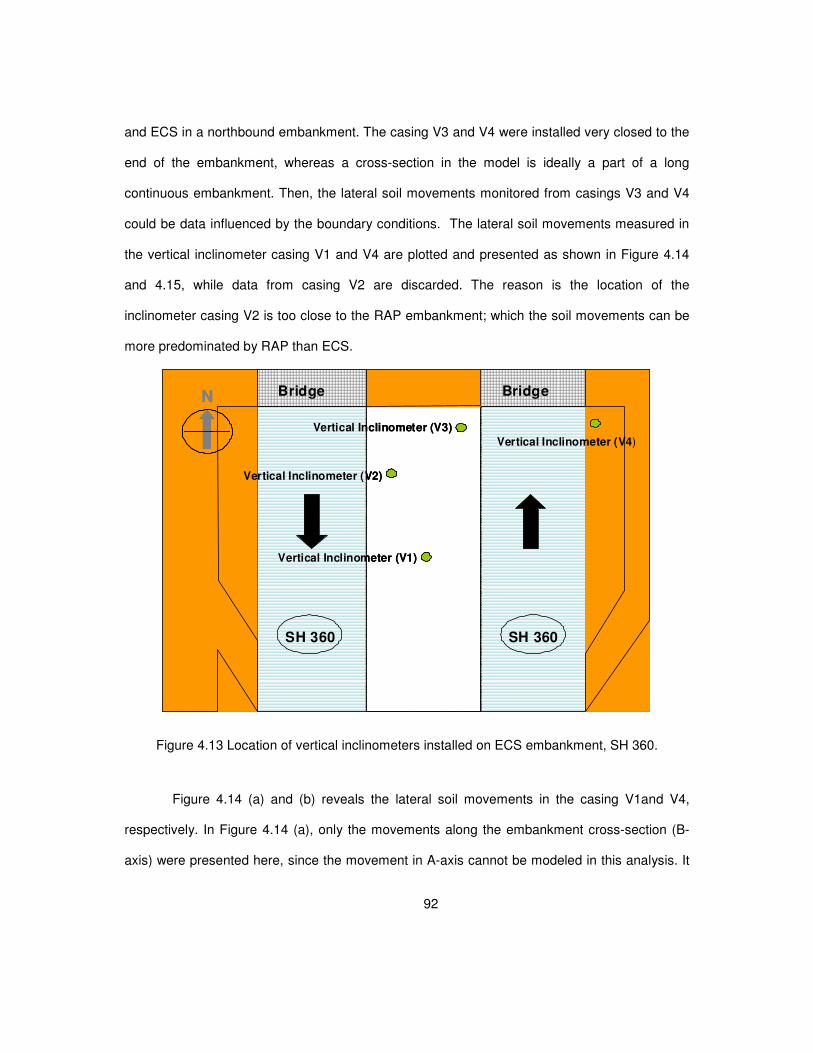
92
and ECS in a northbound embankment. The casing V3 and V4 were installed very closed to the
end of the embankment, whereas a cross-section in the model is ideally a part of a long
continuous embankment. Then, the lateral soil movements monitored from casings V3 and V4
could be data influenced by the boundary conditions. The lateral soil movements measured in
the vertical inclinometer casing V1 and V4 are plotted and presented as shown in Figure 4.14
and 4.15, while data from casing V2 are discarded. The reason is the location of the
inclinometer casing V2 is too close to the RAP embankment; which the soil movements can be
more predominated by RAP than ECS.
Vertical Inclinometer (V1)
Vertical Inclinometer (V3)
Vertical Inclinometer (V2)
Vertical Inclinometer (V4)
SH 360 SH 360
Bridge BridgeN
Vertical Inclinometer (V1)
Vertical Inclinometer (V3)
Vertical Inclinometer (V2)
Vertical Inclinometer (V4)
SH 360 SH 360
Bridge BridgeNN
Figure 4.13 Location of vertical inclinometers installed on ECS embankment, SH 360.
Figure 4.14 (a) and (b) reveals the lateral soil movements in the casing V1and V4,
respectively. In Figure 4.14 (a), only the movements along the embankment cross-section (B-
axis) were presented here, since the movement in A-axis cannot be modeled in this analysis. It
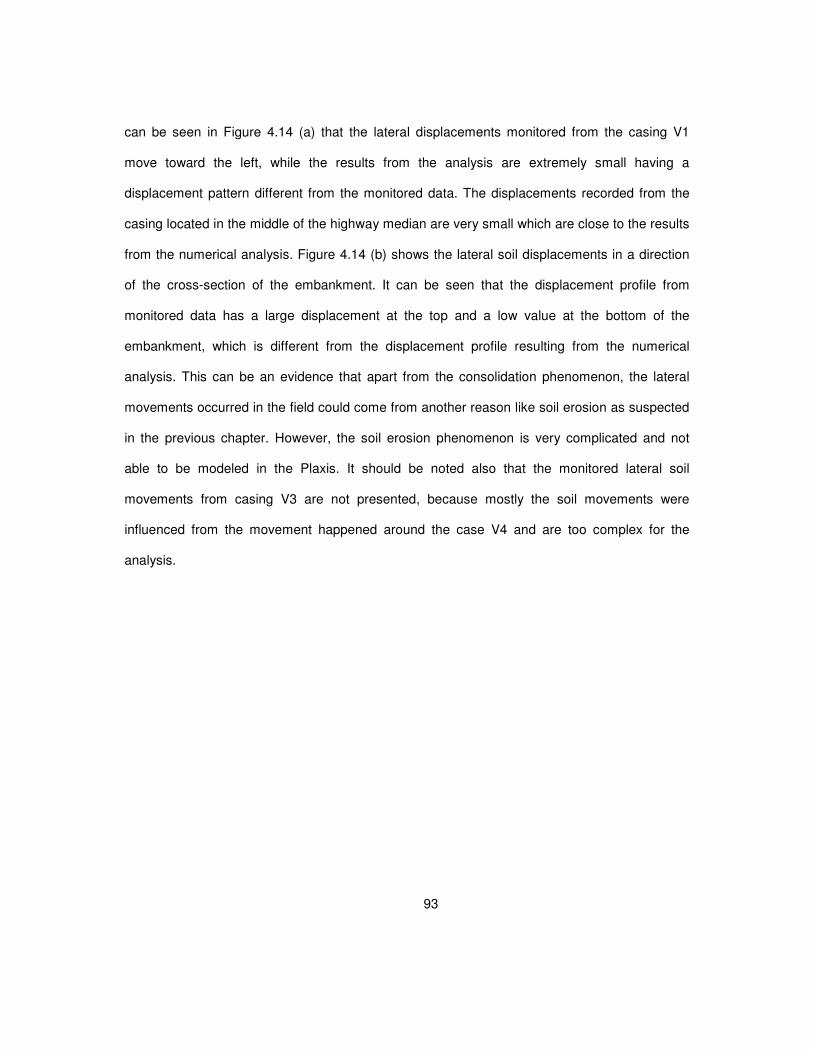
93
can be seen in Figure 4.14 (a) that the lateral displacements monitored from the casing V1
move toward the left, while the results from the analysis are extremely small having a
displacement pattern different from the monitored data. The displacements recorded from the
casing located in the middle of the highway median are very small which are close to the results
from the numerical analysis. Figure 4.14 (b) shows the lateral soil displacements in a direction
of the cross-section of the embankment. It can be seen that the displacement profile from
monitored data has a large displacement at the top and a low value at the bottom of the
embankment, which is different from the displacement profile resulting from the numerical
analysis. This can be an evidence that apart from the consolidation phenomenon, the lateral
movements occurred in the field could come from another reason like soil erosion as suspected
in the previous chapter. However, the soil erosion phenomenon is very complicated and not
able to be modeled in the Plaxis. It should be noted also that the monitored lateral soil
movements from casing V3 are not presented, because mostly the soil movements were
influenced from the movement happened around the case V4 and are too complex for the
analysis.
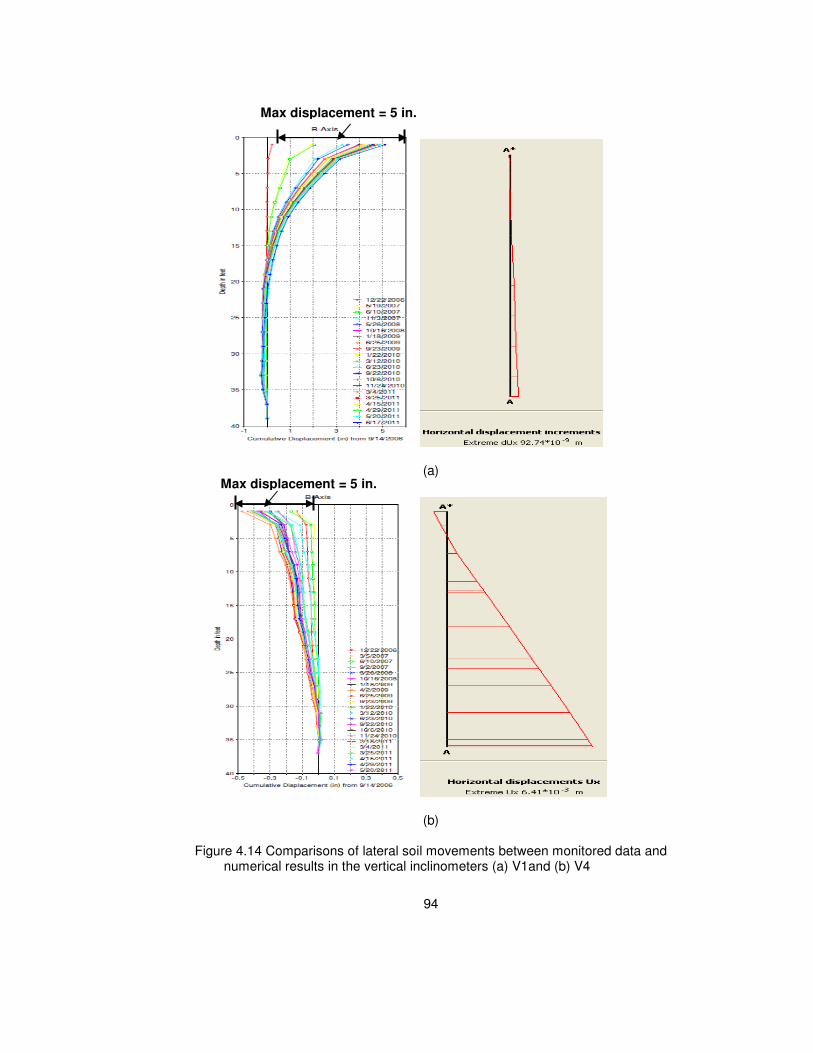
94
(a)
(b)
Figure 4.14 Comparisons of lateral soil movements between monitored data and numerical results in the vertical inclinometers (a) V1and (b) V4
Max displacement = 5 in.
Max displacement = 5 in.
95
4.4.4 Control Embankment Section
The control section is an embankment section constructed with local fill and this section
was located on the north side of the bridge. The settlement investigations using both elevation
surveys in the field and the numerical analysis are performed, which are used further to
compare with the values from the ECS embankment test section to evaluate how ECS material
can mitigate the settlement problem that can occur in the bridge embankment section. The
geometry, boundary conditions and discretization of the control section are the same as the
ones used in the ECS test section by replacing the embankment fill material of ECS with sandy
clay fill material as shown in Figure 4.15.
Figure 4.15 Nodes and elements in the control section
4.4.4.1 Settlement Analysis
The settlement numerical analyses on the control section at Point A are performed in
the same way as was done on the test section. The total embankment of 30 ft (9 m) high was
divided into 3 layers with the same duration of the construction phases, load multiplier factor,
A
30 ft
15ft
115ft
56ft
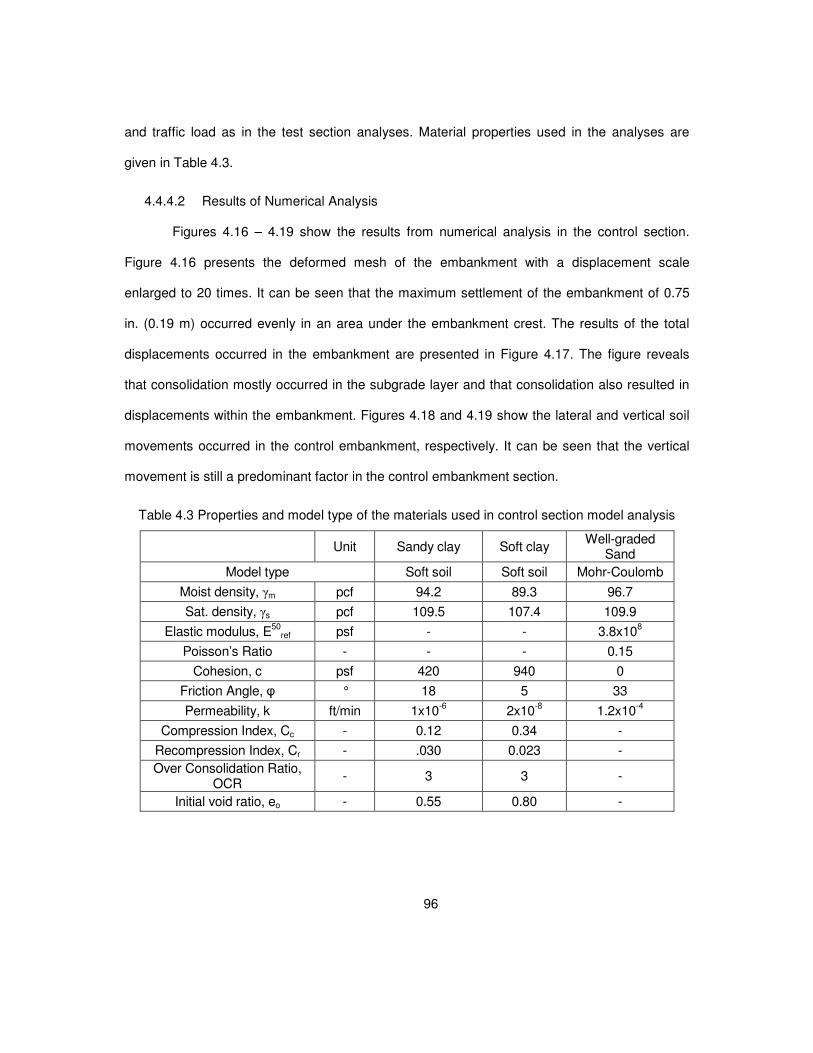
96
and traffic load as in the test section analyses. Material properties used in the analyses are
given in Table 4.3.
4.4.4.2 Results of Numerical Analysis
Figures 4.16 – 4.19 show the results from numerical analysis in the control section.
Figure 4.16 presents the deformed mesh of the embankment with a displacement scale
enlarged to 20 times. It can be seen that the maximum settlement of the embankment of 0.75
in. (0.19 m) occurred evenly in an area under the embankment crest. The results of the total
displacements occurred in the embankment are presented in Figure 4.17. The figure reveals
that consolidation mostly occurred in the subgrade layer and that consolidation also resulted in
displacements within the embankment. Figures 4.18 and 4.19 show the lateral and vertical soil
movements occurred in the control embankment, respectively. It can be seen that the vertical
movement is still a predominant factor in the control embankment section.
Table 4.3 Properties and model type of the materials used in control section model analysis
Unit Sandy clay Soft clay Well-graded
Sand
Model type Soft soil Soft soil Mohr-Coulomb
Moist density, γm pcf 94.2 89.3 96.7
Sat. density, γs pcf 109.5 107.4 109.9
Elastic modulus, E50
ref psf - - 3.8x10⁸
Poisson’s Ratio - - - 0.15
Cohesion, c psf 420 940 0
Friction Angle, φ ° 18 5 33
Permeability, k ft/min 1x10⁻⁶ 2x10
-8 1.2x10
-4
Compression Index, Cc - 0.12 0.34 -
Recompression Index, Cr - .030 0.023 -
Over Consolidation Ratio, OCR
- 3 3 -
Initial void ratio, eo - 0.55 0.80 -
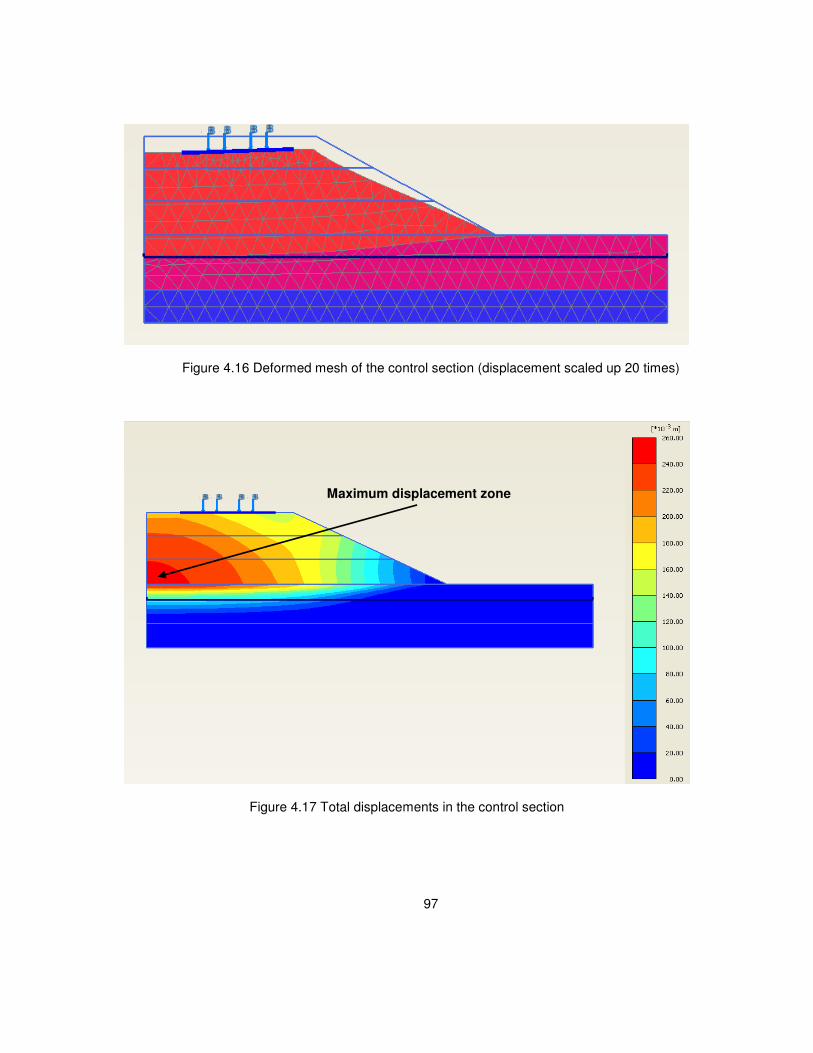
97
Figure 4.16 Deformed mesh of the control section (displacement scaled up 20 times)
Figure 4.17 Total displacements in the control section
Maximum displacement zone
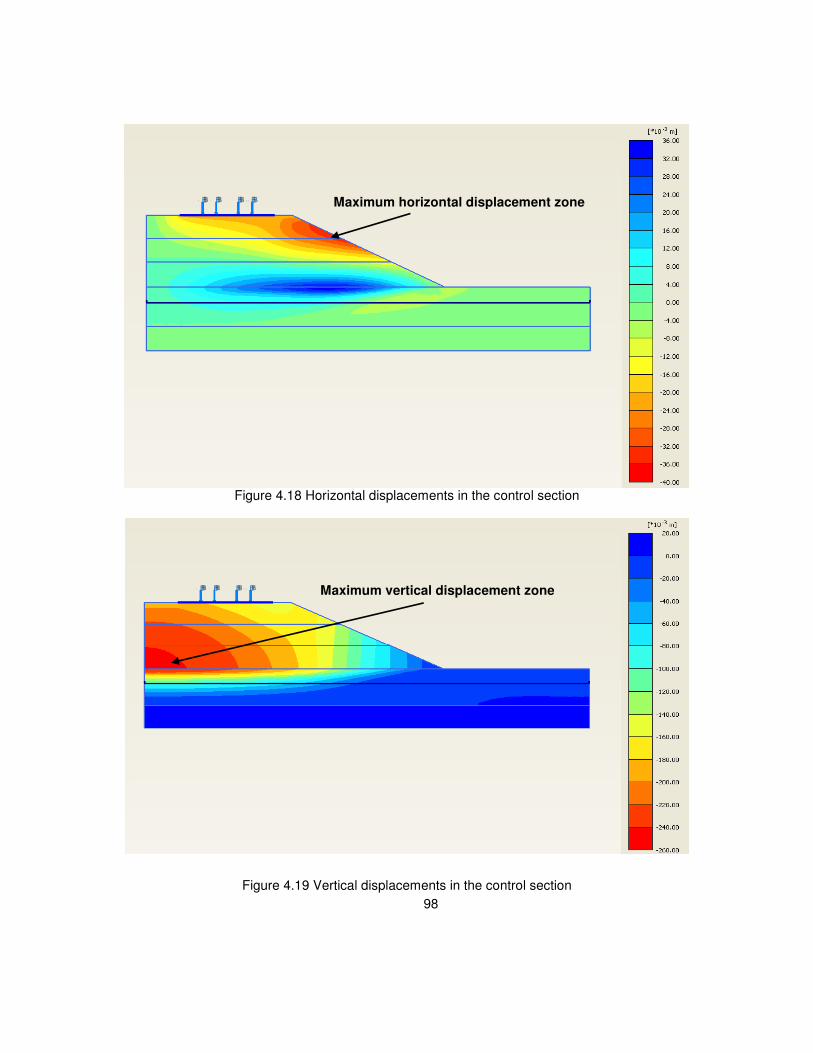
98
Figure 4.18 Horizontal displacements in the control section
Figure 4.19 Vertical displacements in the control section
Maximum vertical displacement zone
Maximum horizontal displacement zone

99
4.4.4.3 Model Validation
To validate the parameters used in the model, the results obtained from the above
model analysis are used to compare with the monitoring data from the field obtained from
previous studies by Archeewa (2010). The comparisons are performed by using data from
elevation surveys and vertical inclinometers to investigate vertical soil displacements. The field
monitored data of the control section obtained from Archeewa (2010) is shown in table 4.4.
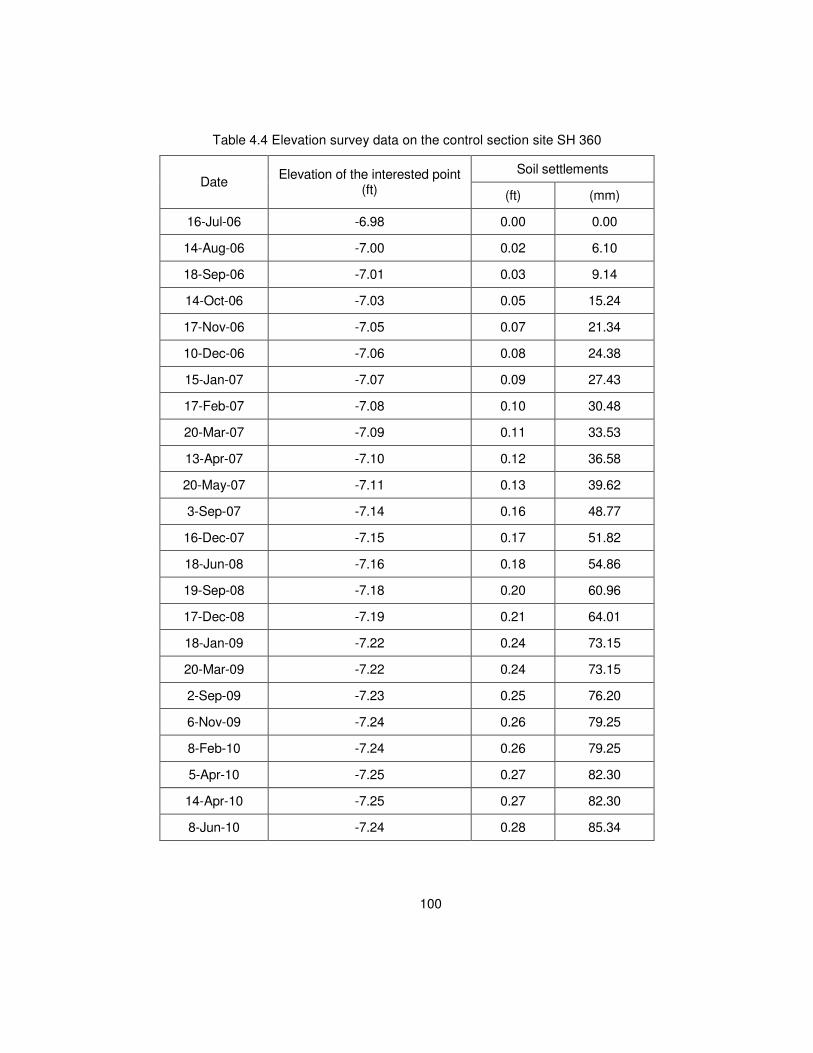
100
Table 4.4 Elevation survey data on the control section site SH 360
Soil settlements Date
Elevation of the interested point (ft) (ft) (mm)
16-Jul-06 -6.98 0.00 0.00
14-Aug-06 -7.00 0.02 6.10
18-Sep-06 -7.01 0.03 9.14
14-Oct-06 -7.03 0.05 15.24
17-Nov-06 -7.05 0.07 21.34
10-Dec-06 -7.06 0.08 24.38
15-Jan-07 -7.07 0.09 27.43
17-Feb-07 -7.08 0.10 30.48
20-Mar-07 -7.09 0.11 33.53
13-Apr-07 -7.10 0.12 36.58
20-May-07 -7.11 0.13 39.62
3-Sep-07 -7.14 0.16 48.77
16-Dec-07 -7.15 0.17 51.82
18-Jun-08 -7.16 0.18 54.86
19-Sep-08 -7.18 0.20 60.96
17-Dec-08 -7.19 0.21 64.01
18-Jan-09 -7.22 0.24 73.15
20-Mar-09 -7.22 0.24 73.15
2-Sep-09 -7.23 0.25 76.20
6-Nov-09 -7.24 0.26 79.25
8-Feb-10 -7.24 0.26 79.25
5-Apr-10 -7.25 0.27 82.30
14-Apr-10 -7.25 0.27 82.30
8-Jun-10 -7.24 0.28 85.34
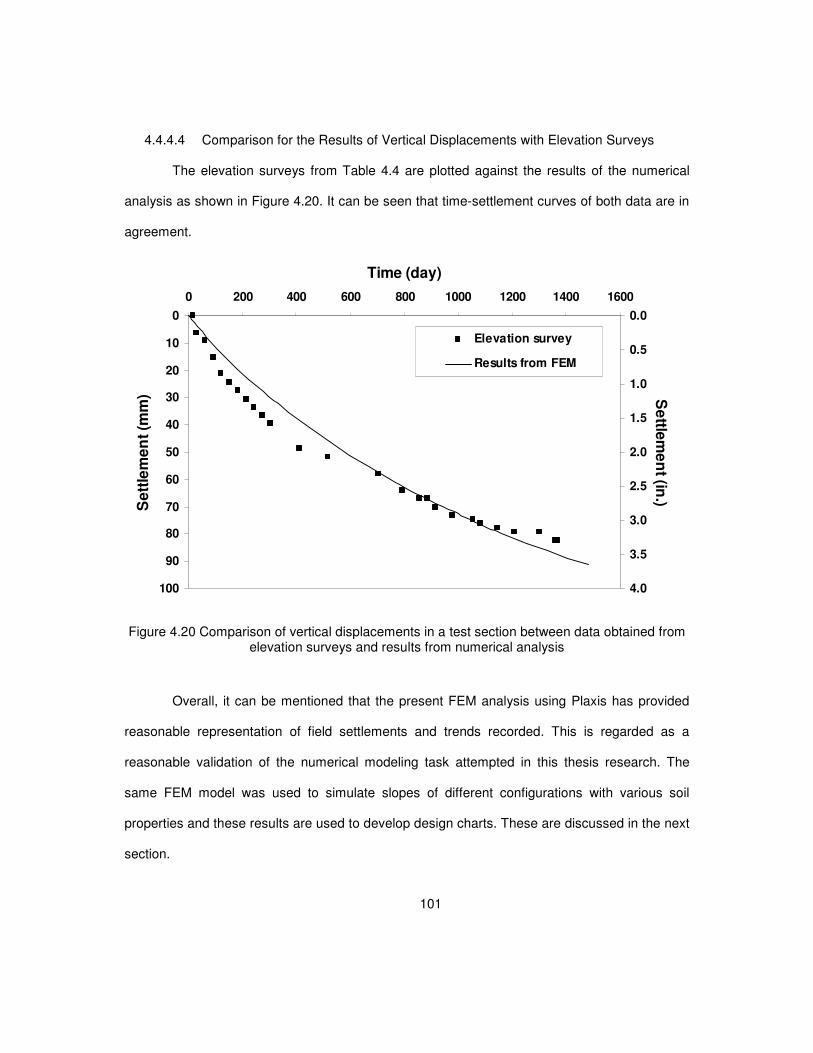
101
4.4.4.4 Comparison for the Results of Vertical Displacements with Elevation Surveys
The elevation surveys from Table 4.4 are plotted against the results of the numerical
analysis as shown in Figure 4.20. It can be seen that time-settlement curves of both data are in
agreement.
0
10
20
30
40
50
60
70
80
90
100
0 200 400 600 800 1000 1200 1400 1600
Time (day)
Se
ttle
me
nt
(mm
)
0.0
0.5
1.0
1.5
2.0
2.5
3.0
3.5
4.0
Se
ttlem
en
t (in.)
Elevation survey
Results from FEM
Figure 4.20 Comparison of vertical displacements in a test section between data obtained from elevation surveys and results from numerical analysis
Overall, it can be mentioned that the present FEM analysis using Plaxis has provided
reasonable representation of field settlements and trends recorded. This is regarded as a
reasonable validation of the numerical modeling task attempted in this thesis research. The
same FEM model was used to simulate slopes of different configurations with various soil
properties and these results are used to develop design charts. These are discussed in the next
section.
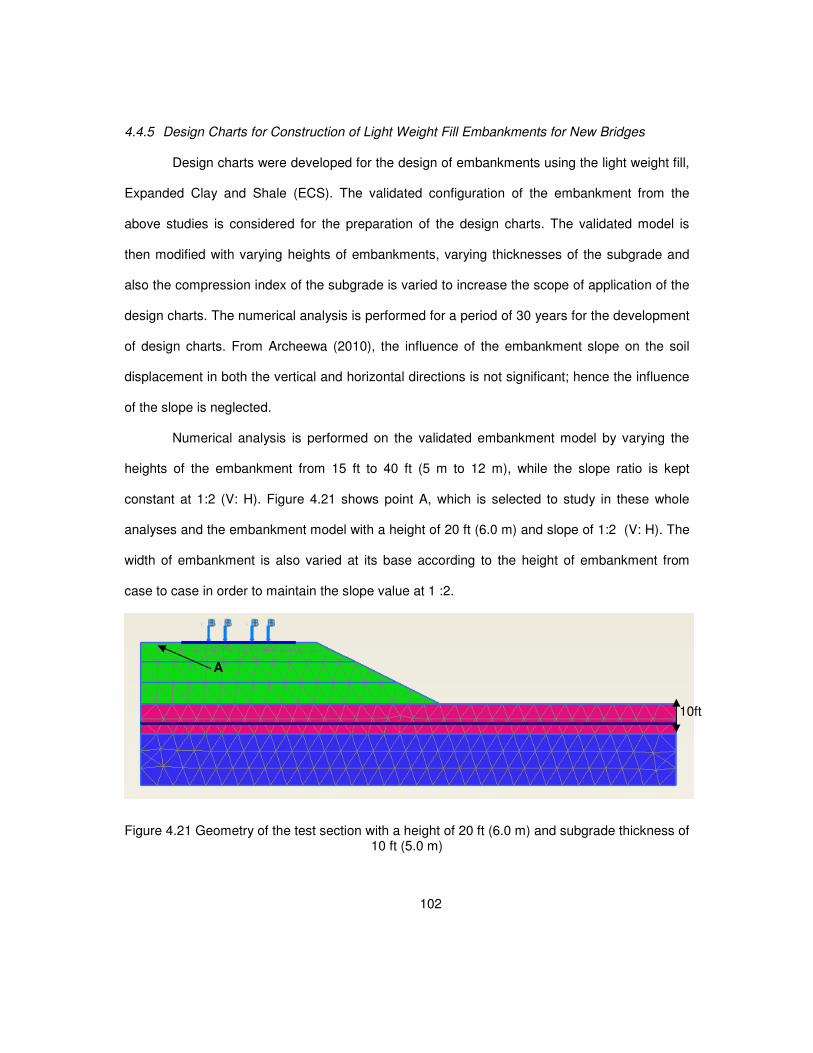
102
4.4.5 Design Charts for Construction of Light Weight Fill Embankments for New Bridges
Design charts were developed for the design of embankments using the light weight fill,
Expanded Clay and Shale (ECS). The validated configuration of the embankment from the
above studies is considered for the preparation of the design charts. The validated model is
then modified with varying heights of embankments, varying thicknesses of the subgrade and
also the compression index of the subgrade is varied to increase the scope of application of the
design charts. The numerical analysis is performed for a period of 30 years for the development
of design charts. From Archeewa (2010), the influence of the embankment slope on the soil
displacement in both the vertical and horizontal directions is not significant; hence the influence
of the slope is neglected.
Numerical analysis is performed on the validated embankment model by varying the
heights of the embankment from 15 ft to 40 ft (5 m to 12 m), while the slope ratio is kept
constant at 1:2 (V: H). Figure 4.21 shows point A, which is selected to study in these whole
analyses and the embankment model with a height of 20 ft (6.0 m) and slope of 1:2 (V: H). The
width of embankment is also varied at its base according to the height of embankment from
case to case in order to maintain the slope value at 1 :2.
Figure 4.21 Geometry of the test section with a height of 20 ft (6.0 m) and subgrade thickness of 10 ft (5.0 m)
A
10ft
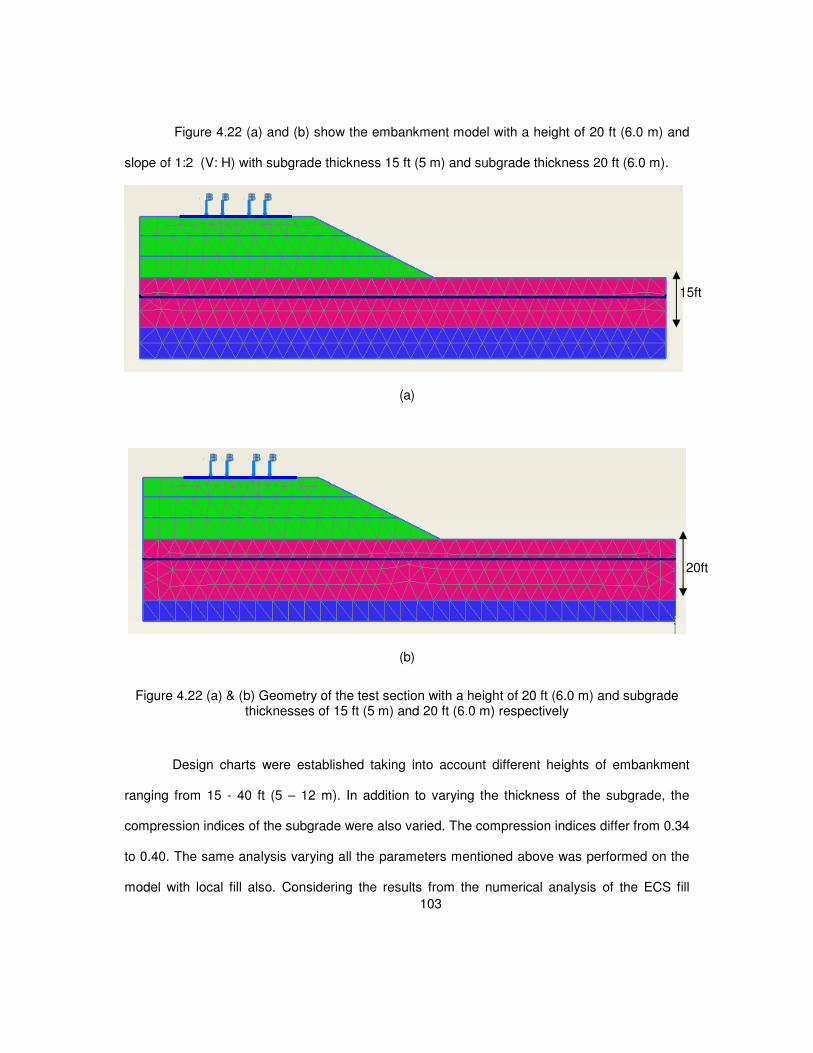
103
Figure 4.22 (a) and (b) show the embankment model with a height of 20 ft (6.0 m) and
slope of 1:2 (V: H) with subgrade thickness 15 ft (5 m) and subgrade thickness 20 ft (6.0 m).
(a)
(b)
Figure 4.22 (a) & (b) Geometry of the test section with a height of 20 ft (6.0 m) and subgrade thicknesses of 15 ft (5 m) and 20 ft (6.0 m) respectively
Design charts were established taking into account different heights of embankment
ranging from 15 - 40 ft (5 – 12 m). In addition to varying the thickness of the subgrade, the
compression indices of the subgrade were also varied. The compression indices differ from 0.34
to 0.40. The same analysis varying all the parameters mentioned above was performed on the
model with local fill also. Considering the results from the numerical analysis of the ECS fill
15ft
20ft
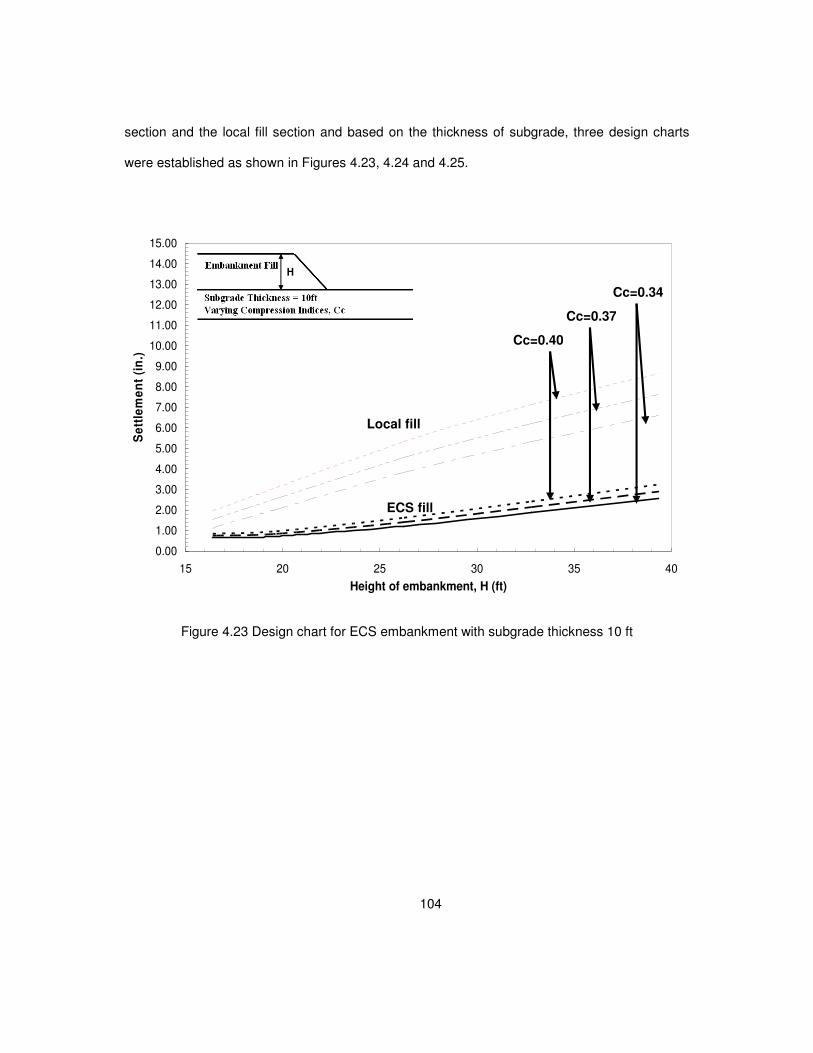
104
section and the local fill section and based on the thickness of subgrade, three design charts
were established as shown in Figures 4.23, 4.24 and 4.25.
H
0.00
1.00
2.00
3.00
4.00
5.00
6.00
7.00
8.00
9.00
10.00
11.00
12.00
13.00
14.00
15.00
15 20 25 30 35 40
Height of embankment, H (ft)
Se
ttle
me
nt
(in
.)
H
Figure 4.23 Design chart for ECS embankment with subgrade thickness 10 ft
Cc=0.40
Cc=0.37
Cc=0.34
Local fill
ECS fill
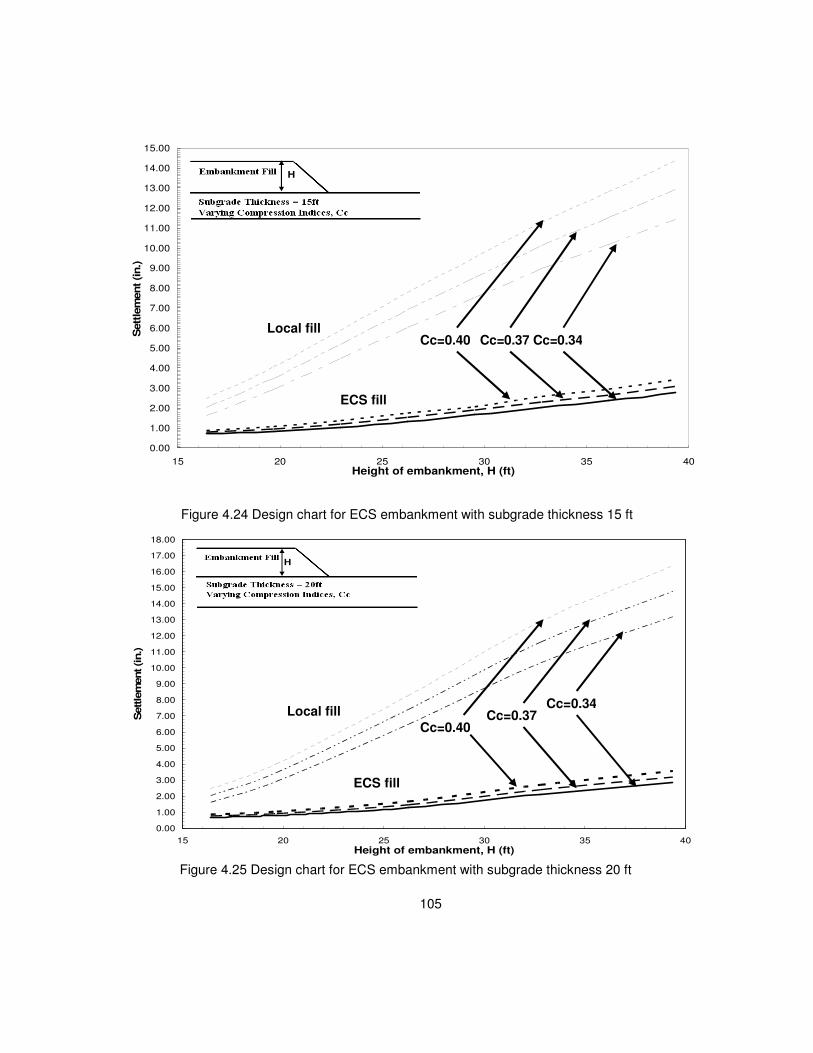
105
0.00
1.00
2.00
3.00
4.00
5.00
6.00
7.00
8.00
9.00
10.00
11.00
12.00
13.00
14.00
15.00
15 20 25 30 35 40Height of embankment, H (ft)
Sett
lem
ent (in.)
H
Figure 4.24 Design chart for ECS embankment with subgrade thickness 15 ft
0.00
1.00
2.00
3.00
4.00
5.00
6.00
7.00
8.00
9.00
10.00
11.00
12.00
13.00
14.00
15.00
16.00
17.00
18.00
15 20 25 30 35 40Height of embankment, H (ft)
Sett
lem
ent (in.)
H
Figure 4.25 Design chart for ECS embankment with subgrade thickness 20 ft
Local fill
ECS fill
Cc=0.34 Cc=0.40 Cc=0.37
Cc=0.40 Cc=0.37
Cc=0.34 Local fill
ECS fill
106
The ECS embankment design charts shown in Figures 4.23 to 4.25, can be interpreted
following the design step-by-step procedure;
1. Establish the height of the embankment.
2. Select the appropriate chart from Figure 4.23 to 4.25, based on the thickness of
the subgrade.
3. For the given compression index of the subgrade, compare the settlement from
the ECS fill embankment section to the local fill embankment section.
4. Select the fill with settlement most nearer to the allowable settlement
requirement
4.5 Summary
This chapter presents the details of the numerical analysis used in the establishment of
design charts to design embankments using the light weight fill, ECS. The data used as input
data for the numerical analysis in the FEM model and the site monitored data used to validate
the model is obtained from previous studies by Archeewa (2010). In this study, the analyses are
performed on a bridge site on SH360, in Arlington, having a control and a test section to
compare the effective reduction in settlement.
To perform the analysis, three tasks were attempted on modeling and validation,
modeling with various embankment configurations and establishing design charts for
construction of the embankment. For the model validation, the soil parameters from studies by
Archeewa (2010) and embankment geometry are used as the input parameters in the model. In
this task, after the numerical model had been completely executed, the results from the
numerical analyses are compared with the monitored data from the field obtained from
Archeewa (2010), to validate the model. The second task is performed to understand how the
amount of the settlement occurred in the treated embankment can be affected by various
embankment geometries and various subgrade characteristics. The validated numerical model

107
is used to perform the analysis for the different geometries and subgrade properties with varying
embankment heights, varying subgrade thicknesses and varying subgrade compression
indices. The last task is the establishment of design charts for the construction of light weight fill
embankments using ECS. The results obtained after performing the numerical analysis on both
the ECS section and local fill section are used to establish the charts.
From the studies, it can be concluded that using lightweight fill as a backfill material can
reduce the settlement occurred in the embankment. Since the gravity load the embankment
exerts on the subgrade is a main factor that governs the settlement in the ECS site, the
embankment constructed with the lightweight ECS has less amount of settlement than the one
constructed with a normal fill; and the higher embankment experiences more settlements than
the lower one. However, it should be noted that using the ECS as a backfill material is not a
concrete technique to reduce the settlement. Although within 30 years using lightweight fill can
reduce the settlement by 30%, this method does not impede the consolidation phenomenon.
Nevertheless, the settlement in the embankment, induced by the consolidation, will still exist
and remedial techniques are necessary performed in the long-term.

108
CHAPTER 5
5SUMMARY AND CONCLUSIONS
5.1 General
The differential settlements between bridge approach and bridge deck is termed as “the
Bump” and this is considered as one of the main problem that affects the performance of the
bridge structures. Many state highway agencies in the United States reported this as one of
their major maintenance problems as every year these agencies have been spending over $100
million on maintenance and repairs to the bridges and highways damaged by this bump
problem. In addition, this bump can cause inconvenience to traveling passengers. Recently,
there have been several methods utilized to mitigate this settlement problem such as using
driven piles, drilled shafts, Flowable fill, ECS, DSM columns, geosynthetics, and others. In this
research, the effectiveness of different mitigation techniques adapted to repair distressed bridge
approach slabs and the development of comprehensive design charts to design bridge
embankments using light weight embankment fill material using data from a previous research
by Archeewa (2010) were discussed.
The objective of this thesis research is to provide appropriate mitigation techniques that
can be employed to treat the distressed bridges. Hence four bridge approach slabs with
settlement related problems are identified. The location of the bridges, the corrective methods
employed, procedure of the method used and the geophysical studies performed on the bridges
along with recommendations are discussed. The corrective methods both proposed and
recommended include Polyurethane injection, Soil nailing, Flowable fill and the use of light
weight Geofoam blocks.
109
The second objective is the development of design charts for the construction of light
weight fill embankments using Expanded Clay and Shale (ECS) aggregate. The data from
laboratory studies and data collected in the field were obtained from a previous study by
Archeewa (2010). The data from laboratory studies was used as input parameters for the
numerical models and the data collected from the field instrumentation was used to validate the
model with the results from the FEM. Once validations are done, the models are used for further
modeling for hypothetical embankment sections. Both test and control sections are simulated in
the FEM model with the embankment geometry and the surcharge loading from traffic and
these results were used to develop design charts for the ECS fill embankments.
5.2 Summary and Conclusions
The major objective of the research is to address the effectiveness of each mitigation
method in reducing the settlement occurred in the embankment. The following conclusions are
obtained for each method considered in the research.
Efficiency of Mitigation Strategies in repairing distressed approach slabs
One of the bridge approach slabs in Waco district where polyurethane injection
technique was adopted, was monitored for three years and the settlement of the slab was
always within the allowable limits during this monitoring period (less than ¼ in.). However, there
was a recent overlay placed on the approach slab along the FM 1947 in June 2011; since the
overlay was performed all along the pavement section for several miles, it could be mentioned
that the repaired approach slab has performed well without any additional distress.
Some issues with the urethane injection are the need to determine the extent and
amount of voids developed underneath the approach slab. GPR techniques are proven to be
useful in establishing these void details. This research also recommends a few quality control
measures on the urethane material injected and a few field samples are needed to determine
the quality of this material used in the field.

110
In the case of soil nailing, the method was mainly used to enhance the stability of the
MSE wall setup, which in turn can control erosion thereby enhancing the stability of the whole
bridge including the approach slabs at both ends. Since the soil nailing technique was recently
adopted, further monitoring of the bridge is needed to address the use of this technique to
control the approach slab settlement that is induced by the MSE wall fill erosion and potential
settlement of foundation subgrade.
Two other bridges in Childress and San Antonio districts were also studied for potential
implementation of light weight Geofoam blocks and use of Flowable fills. Both methods are
considered to have high potential to mitigate settlements. However, these methods are not
explored and need to be investigated in future studies.
Efficiency of ECS in reducing settlements in the embankment
The results of vertical soil settlement analysis from the numerical modeling in the ECS
aggregate fill test section and the local high plastic soil fill control section are in accordance with
the elevation survey data obtained in both the sections. These signify that the models for both
sections are accurate enough to estimate soil settlements in the future.
It should be noted that although using the lightweight fill material, like ECS, to construct
an embankment can lessen the amount of the settlement to one-third compared with the values
predicted in the normal fill embankment in this study, this technique does not impede the
consolidation phenomenon occurred in the clay layer. Therefore, remedial works are still
necessary to be performed in this type of embankment throughout its long-term service.
The design charts developed can be used in the construction of light weight fill
embankments using Expanded Clay and Shale aggregate.

111
5.3 Limitations and Recommendations
Numerical modeling of soil erosion behavior is a complicate phenomenon and these
could not be simulated in the present analysis. Future research should focus on this and also
slope stability issues at the steeper slope configurations.
Field studies are needed to evaluate the performance of flowable fills and Geofoams for
mitigating the settlements underneath approach slabs.
112
REFERENCES
[1] Abendroth, R. E., Greimann, L.F. and LaViolette, M. D. (2007). “An Integral Abutment
Bridge With Precast Concrete Piles.” Final Rep., IHRB Project TR-438, CTRE Project No.
99-48, IOWA Department of Transportation, Center for Transportation Research and
Education Report, Ames, Iowa.
[2] Aboshi, H. and Suematsu, N. (1985), “Sand Compaction Pile Method: State-of-the-Art
Paper.” Proc. of 3rd
International Geotechnical seminar on Soil Improvement Methods,
Nanyang Technological University, Singapore.
[3] Abu al-Eis, K. and LaBarca, I. K. (2007). “Evaluation of the URETEK Method of Pavement
Lifting.” Rep. No. WI-02-07, Wisconsin Department of Transprotation, Division of
Transportation Systems Development, Madison, Wisconsin.
[4] Abu-Hejleh, N., Hanneman, D., White, D. J. and Ksouri, I. (2006). “Flowfill and MSE
Bridge Approaches: Performance, Cost and Recommendations for Improvements.” Report
No. CDOT-DTD-R-2006-2. Colorado Department of Transportation, Denver
[5] Abu-Hejleh, N., Wang, T. and Zornberg, J.G. (2000). “Performance of Geosynthetic-
Reinforced Walls Supporting Bridge and Approaching Roadway Structures.” ASCE
Geotechnical Special Publication No. 103, Advances in Transportation and
Geoenvironmental Systems Using Geosynthetics (2000) 218–243.
113
[6] Abu-Hejleh, N., Zornberg, J.G., Wang, T. and Watcharamonthein, J. (2003). “Design
Assessment of Founders-Meadows GRS Abutment Structure.” Proc., 82nd Annual TRB
Meeting.
[7] Albajar, L., Gascón, C., Hernando, A. and Pacheco, J. (2005). “Transiciones de Obra de
Paso-Terraplén. Aproximación al Estado del Arte y Experiencias Españolas.” Asociación
Técnica de Carreteras, Ministerio de Fomento.
[8] American Association of State Highway and Transportation Official AASHTO. (2004).
LRFD Bridge Design Specification, 3rd edition, with 2006 interim revisions, Washington
D.C.
[9] Amini, F. (2004). “Dynamic cone penetrometer in quality control of compaction, state-of-
the-art report.” Proc., Geotrans 2004 – Geotechnical Engineering for Transportation
Projects, Geotechnica; Special Publications No. 126, Yegian and Kavazanjan, eds., ASCE,
Los Angeles, Ca., 1023-1031.
[10] Ampadu, S. and Arthur, T. (2006). “The dynamic cone penetrometer in compaction
verification on a model road pavement.” Geotech Test. J., ASTM, 29(1), 70-79.
[11] Archeewa, E. (2010). “ Comprehensive studies on deep soil mixing and light weight
aggregates applications to mitigate approach slab” December 2010
114
[12] Arasteh, M. (2007). “Innovations in compaction control and testing.” Presented at 2007
Construction Conference. Bismarck, North Dakota.
[13] Ardani, A. (1987) “Bridge Approach Settlement.” Report No. CDOT-DTP-R-87-06,
Colorado Department of Highways, Denver, Co.
[14] Arockiasamy, M., Arockiasamy, Butrieng, N. and Sivakumar, M. (2004). “State-of-the-Art
of Integral Abutment Bridges: Design and Practice.” Journal of Bridge Engineering, ASCE,
September/October, 2004, 497-506.
[15] Arsoy, S., Barker, R. M. and Duncan, J. M. (1999). “The Behavior of Integral Abutment
Bridges.” Rep. No. VTRC 00-CR3, Virginia Transportation Research Council,
Charlottesville, VA.
[16] Arsoy, S., Duncan, J. M. and Barker, R.M. (2002). Performance of Piles Supporting
Integral Bridges. Transportation Research Record 1808, Washington, D.C.
[17] Atkinson, M.S. and Eldred, P. (1981). “Consolidation of soil using vertical drains”
Geotechnique, 31(1), 33-43.
[18] Bakeer, M., Shutt, M., Zhong, J., Das, S. and Morvant, M. (2005). Performance of Pile-
Supported Bridge Approach Slabs.” Journal of Bridge Engineering, ASCE.
[19] Barksdale, R.D., and Bachus, R.C. (1983) “Design and Construction of Stone Columns,
Vol. 1” Rep. No. FHWA/RD-83/026, Federal Highway Administration, Washington, D.C.
115
[20] Barron, R. A. (1948) “Consolidation of Fine-Grained Soils by Drain Wells”, Transactions of
ASCE No. 2346, pp. 718-754.
[21] Barron, R. F., Wright, J., Kramer, C., Andrew, W. H, Fung, H. and Liu, C. (2006), “Cement
Deep Soil Mixing Remediation of Sunset North Basin Dam” Dam Safety 2006, Association
of Dam Safety Officials.
[22] Bathe, K.-J. (2003). Finite Element Procedures, Prentice-Hall of India, New Delhi
[23] Baumann, V. and Bauer, G.E.A. (1974). “The Performance of Foundations on Various
Soils Stabilized by the Vibro-Compaction Method.” Canadian Geotechnical Journal, 509-
530.
[24] Bergado, D.T, and Patawaran, M.A.B. (2000). “Recent developments of ground
improvement with pvd on soft Bangkok clay.” Proc. Intl. seminar on Geotechnics in Kochi
2000, Kochi, Japan, October, 2000.
[25] Bergado, D.T., Anderson, T.R, Miura, N, and Balasubramaniam, A.S. (1996). “Soft
Ground Improvement in lowland and other environments.” ASCE, New York.
[26] Bergado, D.T., Miura, N., gh, N. And Panichayatum, B. (1988). “Improvement of Soft
Bangkok Clay using Vertical Band Drains Based on Full Scale Test.” Proc. of the
International Conference on Engineering Problems of Regional Soils, Beijing, China, 379-
384.
116
[27] Bergado, D.T., Singh, N., Sim, S.H., Panichayatum, B., Sampaco, C.L. and
Balasubramaniam, A.S. (1990) “Improvement of Soft Bangkok Clay Using Vertical Drains
Compacted with Granular Piles.” Geotextiles and Geomembranes, 9, 203-231.
[28] Bowders, J., Loehr, E., Luna, R. and Petry, T.M. (2002). “Determination and Prioritization
of MoDOT Geotechnical Related Problems with Emphasis on Effectiveness of Designs for
Bridge Approach Slabs and Pavement Edge Drains.” Project Rep. No. R199-029, Missouri
Department of Transportation, Jefferson.
[29] Bowles, J. E. (1988). Foundation Analysis and Design, McGraw-Hill, New York.
[30] Bozozuk, M. (1978) “Bridge Foundations Move.” Transportation Research Record 678:
Tolerable Movements of Bridge Foundations, Sand Drains, K-Test, Slopes, and Culverts,
Transportation Research Board, National Research Council, Washington, D.C. 17–21.
[31] Brewer, W.E. (1992). “The Design and Construction of Small Span Bridges and Culvert
Using Controlled Low Strength Material (CLSM).” FHWA/OH-93/014, Ohio Department of
Transportation, Columbus, 129.
[32] Brewer, W. B., Hayes, C. J., and Sawyer, S. (1994). “URETEK Construction Report,”
Construction Report, Report Number OK 94(03), Oklahoma Department of Transportation.
117
[33] Briaud, J. L., James, R. W., and Hoffman, S. B. (1997) NCHRP synthesis 234: Settlement
of Bridge Approaches (the bump at the end of the bridge), Transportation Research Board,
National Research Council, Washington, D.C. pp.75.
[34] Bridge Design Manual. Texas Department of Transportation, December 2001.
[35] Brown, D.A., Steve, D.D., Thompson, W.R., and Lazarte, C. A. (2007) “Design and
Construction of Continuous Flight Auger (CFA) Piles”, Geotechnical Engineering Circular
No. 8, Federal Highway Administration, Washington, D. C.
[36] Bruce, D. (2001). “An Introduction to the Deep Mixing Methods as Used in Geotechnical
Applications. Volume III. The Verification and Properties of Treated Ground.” Report No.
FHWA-RD-99-167, US Department of Transportation, Federal Highway Administration,
2001.
[37] Bugrov, A.K. (1975). “The finite element method in consolidation analyses of water-
saturated soils”, Power Technology and Engineering (Formerly Hydrotechnical
Construction), Vol. 9, No. 7, 661-668.
[38] Burde, H.J. (2004). “FE in Geotechnical Engineering”, Stichting Postcademish Onderwijs
Civile Techniek en Bouwtechniek, Noordwijkerhout, The Netherlands, January, 2004.
[39] Burdette, E.G., S.C. Howard, J.B. Tidwell, E.P. Wasserman, E.E. Ingram, J.H.
Deatherage, and D.W. Goodpasture. 2004. Lateral Load Tests on Prestressed Concrete
Piles Supporting Integral Abutments. PCI Journal, 49(5), 70–77.
118
[40] Burke, M.P. (1987). “Bridge Approach Pavements, Integral Bridges, and Cycle-Control
Joints.” Transportation Research Record 1113, TRB, National Research Council,
Washington D.C., 54-65.
[41] Burke, M.P. (1993). Integral bridges: attributes and limitations. Transportation Research
Record 1393 p. 1-8. Transportation Research Board, 75th Annual Meeting.
[42] Burke, G. (2001) “Current Methods of Sampling and Testing of Soil Cement and Their
Limitations.” Proceedings of International Workshop on Deep Mixing Technology, Vol. 2,
National Deep Mixing Program, Oakland, CA. 2001.
[43] Bush, D.I., Jenner, C.G., and Bassett, R.H., 1990. The design and construction of geocell
foundation mattress supporting embankments over soft ground. Geotextiles and
Geomembranes, 9: 83-98.
[44] Buss, W.E. (1989). “Iowa Flowable Mortar Saves Bridges and Culverts.” Transportation
Research Record 1234, TRB, National Research Council, Washington, DC, pp. 30-34.
[45] Byle, M. J. (1997). "Limited Mobility Displacement Grouting - When "Compaction Grout" is
Not Compaction Grout." Grouting: Compaction, Remediation, Testing, Proceedings of
GeoLogan GeoInstitute Conference, Geotechnical Special Publication No. 66, Logan, Utah,
ASCE, p. 32-43.
119
[46] Byle, M. J. (2000). "An Approach to the Design of LMD Grouting." Geotechnical Special
Publication 104, Advances in Grouting and Ground Modification, Proceedings of Sessions
of Geo-Denver 2000, Wallace Baker Memorial Symposium, ASCE, Denver, Colorado, 94-
110.
[47] Cai, C. S., Voyiadjis, G. Z. and Xiaomin, S. (2005). “Determination of Interaction between
Bridges Concrete Approach Slab and Embankment Settlement.” Department of Civil
Engineering, Louisiana State University, Baton Rouge, La.
[48] Chini, S. A., Wolde-Tinsae, A. M., and Aggour, M. S. (1992). “Drainage and Backfill
Provisions for Approaches to Bridges.” University of Maryland, College Park.
[49] Cooper, M.R. and Rose, A.N. (1999). “Stone column support for an embankment on deep
alluvial soils.” Proc of the Institution of Civil Engineers, Geotechnical Engineering,
137(1),15-25.
[50] Cotton, D. M., Kilian, A. P., and Allen, T. (1987). “Westbound Embankment Preload on
Rainier Avenue, Seattle, Washington.” Transportation Research Record No. 1119,
Transportation Research Board, Washington D.C., 61-75.
[51] Cowland. J.W., and Wong, S.C.K. (1993). “Performance of a road embankment on soft
clay supported on a geocell mattress foundation.” Geotextiles and Geomembranes, 12,
687-705.
120
[52] Das, S. C., Bakeer, R., Zhong, J., and Schutt, M. (1990). “Assessment of mitigation
embankment settlement with pile supported approach slabs.” Louisiana Transportation and
Research Center, Baton Rouge, La.
[53] DeMerchant, M., R. and Valsangkar, A., J. (2002). “Plate load tests on geogrid-reinforced
expanded shale lightweight aggregate.” Geotextiles and Geomembranes No. 20, 173–190
[54] DiMillio, A.F. (1982). “Performance of Highway Bridge Abutments Supported by Spread
Footings on Compacted Fill.” Final Rep. No. FHWA/RD-81/184, Federal Highway
Administration, Washington, D.C.
[55] Du, L. (2008). Personal communication, Texas Department of Transportation.
[56] Du, L., Arellano, M., K. J. Folliard, Nazarian, S. and Trejp D. (2006). “Rapid-Setting CLSM
for Bridge Approach Repair: A Case Study”. ACI Material Journal/ September-October
2006, pp. 312-318.
[57] Dumas, C., Munsukhani, S., Porbaha, A., Short, D.R., Cannon, R.R., McLain, W.K.,
Putcha, S., Macnub, A., Lwin, M.M., Pelnik III, T.W., Brown, D.A. and Christopher, R.B.
(2003). “Innovative Technology for Accelerated Construction of Bridge and Embankment
Foundations in Europe”, FHWA, Rep. No. PL-03-014.
[58] Dunn, K. H. Anderson, G.H. Rodes, T.H., and Zieher, J.J. (1983). “ Performance
Evaluation of Bridge Approaches.” Wisconsin Department of Transportation.
121
[59] Dupont, B. and Allen, D. (2002). “Movements and Settlements of Highway Bridge
Approches.” Rep. No. KTC-02-18/SPR-220-00-1F, Kentucky Transportation Center
Report, Lexington, KY.
[60] EBA Engineering, Inc. (1992). Final Report: Summary results obtained from the auger
cast piles investigation. Study DTFH 692-Q-00062. FHWA, U.S. Department of
Transportation.
[61] Edgar, T. V., Puckett, J. A., and D’Spain, R. B. (1989). “Effect of Geotextile on Lateral
Pressure and Deformation in Highway Embankments.” Geotextiles and Geomembranes,
8(4), 275-306.
[62] Elias, V., Christopher, B. R., and Berg, R.R. (2001). “Mechanically Stabilized Earth Walls
and Reinforced Soil Slopes Design and Construction Guidelines.” FHWA NHI-00- 043.
[63] Expanded Shale, Clay and Slate (ESCS) (2004). “Light weight aggregate for geotechnical
applications.” Information Sheet 6001 – www.escci.org.
[64] Federal Highway Administration (2000). “Priority, Market-Ready Technologies and
Innovations”, Rep. No. FHWA-HRT-04-053.
[65] Fox, N.S. and Cowell, M.J. (1998). Geopier Foundation and Soil Reinforcement Manual,
Geopier Foundation Company, Inc., Scottsadale, AZ.
122
[66] Gabr, M., Hopkins, K., Coonse, J, and Hearne, T. (2000). “DCP criteria for performance
evaluation of pavement layers.” J. Perf. Of Constr. Facil., ASCE, 14(4), 141-148.
[67] Gallivan, L. (2008). “An Intelligent Compaction Era has Arrived.” Rep. No. FHWA-HRT-08-
012, Focus, USDOT.
[68] Girton, D. D., Hawkinson, T.R. and Greimann, L.F. (1991). “Validation of design
recommendations for integral-abutment piles.” Journal of Structural Engineering, ASCE,
117(7), 2117-2134.
[69] Goughnour, R. R. and Bayuk, A.A. (1979). “A Field Study of Long-term Settlement of
Loads Supported by Stone Column in Soft Ground.” Proc of International Conference on
Soil Reinforcement: Reinforced Earth and Other Techniques, Vol. 1, Paris, 279-286.
[70] Greimann, L. F. and Wolde-Tinsae, A. M. (1988). “Design model for piles in jointless
bridges.” Journal of Structural Engineering, ASCE, 114(6),1354-1371.
[71] Greimann, L. F., Abendroth, R.E., Johnson, D.E. and Ebner, P.B. (1987). “Pile Design and
Tests for Integral Abutment Bridges.” Final Rep. Iowa DOT Project HR 273, ERI Project
1780, ISU-ERI-Ames-88060, Ames, Iowa.
[72] Greimann, L. F., Yang, P-S. and Wolde-Tinsae, A. M. (1983). “Skewed Bridges with
Integral Abutments.” Transportation Research Record 903: Bridges and Culverts,
Transportation Research Board, National Research Council, Washington, D.C., 64-72.
123
[73] Greimann, L. F., Yang, P-S. and Wolde-Tinsae, A. M. (1986). “Nonlinear analysis of
integral abutment bridges.” Journal of Structural Engineering, ASCE, 112(10), 2263-2280.
[74] Grover, R. A. (1978). “Movement of Bridge Abutments and Settlements of Approach
Pavements in Ohio.” Transportation Research Record 678, Washington, D.C.
[75] Ha, H.,Seo, J., and Briaud, J-L. (2002). “ Investigation of Settlement at Bridge Approach
Slab Expansion Joint: Survey and Site Investigations.” Rep. No. FHWA/TX-03/4147-1,
Texas Transportation Institute, Texas A&M University, College Station, TX.
[76] Hansbo, S. (1979) “Consolidation of Clay by Bandshaped Prefabricated Drains.” Ground
Engineering, 12(5), 16-25.
[77] Hansbo, S. (1997) “Aspects of Vertical Drain Design: Darcian or Non-Darcian Flow.”
Geotechnique, 47(5), 983-992.
[78] Hansbo, S. (1997) “Practical Aspects of Vertical Drain Design.” Proceedings of 14th
International Conference on Soil Mechanics and Foundation Engineering, Vol. 3, Hamburg.
[79] Hansbo, S. (2001) “Consolidation Equation Valid for both Darcian or Non-Darcian Flow”,
Geotechnique, 51(1), 51-54.
[80] Hartlen, J. (1985). “Pressure Berms, Soil Replacement and Lightweight Fills.” Soil
Improvement Methods, Proceedings of the Third International Geotechnical Seminar,
Nangyang Technological Institute, Singapore, 101-111.
124
[81] Hausmann, M. R. (1990). “Engineering Principles of Ground Modification”, McGraw-Hill
Publishing Company, New York.
[82] Holm, T., A., and Valsangkar, A., J. (1993). “Lightweight aggregate soil mechanics:
properties and applications.” Transportation Research Record, No. 1422 , 7-13.
[83] Holm, T. A., and Ooi, O. S. (2003). “Moisture dynamics in lightweight aggregate and
concrete.” 6th International Conference on the Durability of Concrete, Thessaloniki, Greece.
[84] Holtz, R.D. and Kovacs, W.D. (1981). “An Introduction to Geotechnical Engineering.”
Prentice Hall Hall Inc., Englewoods Cliffs, New Jersey, 733.
[85] Hopkins, T.C. (1969). “Settlement of Highway Bridge Approaches and Embankment
Foundations.” Rep. No. KYHPR-64-17; HPR-1(4), Kentucky Transportation Center,
Lexington, Kentucky.
[86] Hopkins, T. C. (1973). “Settlement of Highway Bridge Approaches and Embankment
Foundations.” Rep. No. KYHPR-64-17; HPR-1(8), Kentucky Transportation Center,
Lexington, Kentucky, 40.
[87] Hopkins, T.C. (1985). “Long-Term Movements of Highway Bridge Approach
Embankments and Pavements”. University of Kentucky, Transportation Research Program.
125
[88] Hopkins, T.C. and Deen, R.C. (1970). “The Bump at the End of the Bridge.” Highway
Research Record No. 302, Highway Research Board, National Research Council,
Washington, D.C., 72-75.
[89] Hoppe, E. J. and Gomez, J. P. (1996). “Field study of an integral backwall bridge.” Rep.
No. VTRC 97-R7, Virginia Transportation Research Council, Charlottesville, VA.
[90] Hoppe, E.J. (1999). “Guidelines for the Use, Design, and Construction of Bridge Approach
Slabs.” Rep. No. VTRC 00-R4, Virginia Transportation Research Council, Charlottesville,
VA.
[91] Horvath, J. (2000). “Integral Abutment Bridges: Problem and Innovative Solutions Using
EPS Geofoam and other Geosynthetics.” Research Report No. CE/GE-00-2, Manhattan
College, Bronx, New York.
[92] Horvath, J. S. (1991). “Using Geosynthetics to Reduce Surcharge-Induced Stresses on
Rigid Earth Retaining Structures.” Transportation Research Record 1330, 47-53.
[93] Horvath, J. S. (2005). “Integral-Abutment Bridges: Geotechnical Problems and Solutions
Using Geosynthetics and Ground Improvement.” IAJB 2005 - The 2005 FHWA Conference
on Integral Abutment and Jointless Bridges. 16-18 March, Baltimore, Maryland, USA.
[94] Hsi, J. and Martin, J. (2005). “Soft Ground Treatment and Performance, Yelgun to
Chinderah Freeway, New South Wales, Australia.” In Ground Improvement-Case Histories,
Elsevier Geo-Engineering Book Series, Volume 3, 563-599.
126
[95] Hsi, J. P. (2007). “Managing Difficult Ground-Case Studies.” Proceedings of First Sri
Lankan Geotechnical Society International Conference on soil and Rock Engineering,
Colombo.
[96] Hsi, J. P. (2008). “Bridge Approach Embankments Supported on Concrete Injected
Columns.” Proceedings of The Challenge of Sustainability in the Geoenvironment, ASCE,
Geocongress 08, New Orleans, Louisiana.
[97] HVJ Associates (2003). Report of Geotechnical Investigation Reconstruction and
Widening of US-90A at SH-6, Segment 3, Houston, Texas.
[98] Indraratna, B., Balasubramaniam, A. S. and Ratnayake, P. (1994). “Performance of
Embankment Stabilized with Vertical drains on Soft Clay.” Journal of Geotechnical
Engineering, ASCE, 120(2), 257-273.
[99] James, R.W., Zhang, H. and Zollinger, D.G. (1991). “Observations of severe abutment
backwall damage.” Transportation Research Record 1319, Transportation Research Board,
55-61.
[100] Jamiolkowski, M., Lancellota, R. and Wolski, W. (1983). “Precompression and speeding
up consolidation.” Proceedings, Eight European Conference on Soil Mechanics and
Foundation Engineering, Vol 3, Helsinki.
127
[101] Japan Railway (JR) Technical Research Institute (1998). “Manual on Design and
Construction of Geosynthetic-Reinforced Soil Retaining Wall.”
[102] Jayawickrama, P., Nash, P., Leaverton, M. and Mishra, D. (2005). “Water Intrusion in
Base/Subgrade Materials at Bridge Ends.” TxDOT Report, FHWA/TX-06/0-5096-1,
Texas Tech University, Lubbock, Texas.
[103] Jenner, C.G., Basset, R.H., and Bush, D.I. (1988). “The use of slip line fields to assess the
improvement in bearing capacity of soft ground given by cellular foundation mattress
installed at the base of an embankment.” In Proceedings of the International Geotechnical
Symposium on Theory and Practice of Earth Reinforcement, Balkema, Rotterdam, 209-214.
[104] Kamel, M.R., Benak, J.V., Tadros, M.K. and Jamshidi, M. (1996). “Prestressed Concrete
Piles in Jointless Bridges.” PCI Journal, 41(2), 56–67.
[105] Kramer, S. L. and Sajer, P. (1991) “Bridge Approach Slab Effectiveness.” Final Report,
Washington State Department of Transportation, Olympia, Washington.
[106] Krishnaswamy, N.R., Rajagopal, K., and Madhavi Latha, G. (2000). “Model studies on
geocell supported embankments constructed over soft clay foundation.” Geotechnical
Testing Journal, ASTM, 23: 45-54.
[107] Kristiansen. H. and Davies, M. (2004). “Ground improvement using rapid impact
compaction.” Proceedings of 13th World Conference on Earthquake Engineering,
Vancouver, B.C, pp 1-10.
128
[108] Kunin, J. and Alampalli, S. (2000). “Integral Abutment Bridges: Current Practice in United
States and Canada.” ASCE Journal of Performance of Constructed Facilities, 14(3), 104-
111.
[109] Laguros, J. G., Zaman, M. M., and Mahmood, I. U. (1990). “Evaluation of Causes of
Excessive Settlements of Pavements Behind Bridge Abutments and their Remedies; Phase
II. (Executive Summary).” Rep. No. FHWA/OK 89 (07), Oklahoma Department of
Transportation.
[110] Lawton, E.C., and Fox, N.S. (1994). “Settlement of Structures Supported on Marginal or
Inadequate Soils Stiffened with Short Aggregate Piers.” ASCE GSP No. 40, Vertical and
Horizontal Deformations of Foundations and Embankments, ASCE, Vol. 2, 962-974.
[111] Lawton, E. C., Fox, N. S. and Handy, R. L. (1994). “ Control of Settlement and Uplift of
Structures Using Short Aggregate Piers.” Proceedings, IN-SITU Deep Soil Improvements.
[112] Lawton, E., and Merry, S. (2000). “Performance of Geopier Supported Foundations During
Simulated Seismic Tests on Northbound Interstate 15 Bridge Over South Temple, Salk
Lake City, Utah.” Final Reprt No. UUCVEEN 00-03. University of Utah.
[113] Lawver, A., French, C., and Shield, C. K. (2000). “Field Performance of an Integral
Abutment Bridge.” Transportation Research Record: Journal of the Transportation
Research Board, 1740, 108-111.

129
[114] Lenke, L. R. (2006). “Settlement Issues-Bridge Approach Slabs.” Rep. No. NM04MNT-02,
New Mexico Department of Transportation.
[115] Lien, B. H. and Fox, N. S. (2001) “Case Histories of Geopier® Soil Reinforcement for
Transportation Applications.” Proc. of Asian Institute of Technology Conference, Bangkok,
Thailand.
[116] Lin, Q.L., Wong, I.H. (1999). “Use of Deep Cement Mixing to Reduce Settlements at
Bridge Approaches.” Journal of Geotechnical and Geoenvironmental Engineering, ASCE,
Vol. 125(4),309.
[117] Liu, H.L., Ng, C.W.W., and Fei, K. (2007). “Performance of a Geogrid-Reinforced and Pile-
Supported Highway Embankment over Soft Clay: Case Study.” Journal of Geotechnical and
Geoenvironmental Engineering, ASCE, 133(12),1483-1493.
[118] Long, J.H., Olson, S.M. and Stark, T.D. (1998). “Differential Movement at
Embankment/Bridge Structure Interface in Illinois.” Transportation Research Record No.
1633, Transportation Research Board, Washington, D.C., 53-60.
[119] Lukas, R.G. (1986) “Dynamic Compaction for Highway Construction, Vol. 1, Design and
construction Guidelines.” Rep. No. FHWA/RD-86/133 , Federal Highway Administration,
National Technical Information Service, Washington, D.C.
[120] Lukas, R.G. (1995) “Dynamic Compaction, Geotechnical Engineering Circular No. 1” Rep.
No. FHWA-SA-95-037, Federal Highway Administration,Washington, D.C.
130
[121] Luna R., Jonathan L. R., and Andrew, J. W. (2004). “Evaluation of Bridge Approach Slabs,
Performance and Design.” Rep. No. RDT 04-010, Department of Civil, Architectural and
Environmental Engineering, University of Missouri, Rolla.
[122] Maddison, J. D., Jones, D. B., Bell, A. L., and Jenner, C. G. (1996). “Design and
performance of an embankment supported using low strength geogrids and vibro concrete
columns.” Geosynthetics: Applications, design and construction, De Groot, Den Hoedt, and
Termaat, eds., Balkema, Rotterdam, The Netherlands, 325–332.
[123] Magnan, J. (1994). “Methods to reduce the settlement of embankments on soft clay: A
review.” Proc., Vertical-Horizontal Deformations of Foundations and Embankments, ASCE,
New York, 77–91.
[124] Mahmood, I. U. (1990). “Evaluation of causes of bridge approach settlement and
development of settlement prediction models.” PhD Thesis, University of Oklahoma,
Norman, Okla.
[125] McKenna, J.M., Eyre, W.A., and Wolstenholme, D. R. (1975). “Performance of an
Embankment Supported by Stone Columns in Soft Ground.” Geotechnique, 25(1), 51-59.
[126] McVay, M., Armaghani, B. and Casper, R. (1994). “Design and construction of auger-cast
piles in Florida.” Transportation Research Record, 1447, 10-18.
131
[127] Mekkawy, M., White, D.J., Souleiman, M.T. and Sritharan, S. (2005). “Simple Design
Alternatives to Improve Drainage and Reduce Erosion at Bridge Abutments.” Proceedings
of the 2005 Mid-Continent Transportation Research Symposium, Ames, Iowa.
[128] Michell, J. K., and Huber, T.R (1985) “Performance of a Stone Column Foundation.”
Journal of Geotechnical Engineering, ASCE, 111(2), 205-223.
[129] Miller, E. A., and Roykroft, G. A., (2004). “Compaction Grouting Test Program for
Liquefaction Control.” Journal of Geotechnical and Geoenvironmental Engineering, ASCE,
355-361.
[130] Mimura, C.S., Kimura, S.A. (1995). “A light-weight solution.” Proceedings Geosynthetics
'95, Nashville, Tennessee, Vol. 1, 39-51.
[131] Minks, A.G., Wissmann, K.J., Caskey, J.M., and Pando, M.A. (2001). “Distribution of
Stresses and Settlements below Floor Slabs Supported by Rammed Aggregate Piers.”
Proceedings of 54th Canadian Geotechnical Conference, Calgary, Alberta, Canada, 16-19.
[132] Monley, GJ., and Wu, J. T. (1993). Tensile Reinforced Effects on Bridge Approach
Settlement. Journal of Geotechnical Engineering, 119(4), 749-763.
[133] Moore, W. (2006). “Intelligent compaction: Outsmarting Soil and Asphalt.”
www.constructionequipment.com/article/CA6321917.html.

132
[134] Munoz, A. and Mattox, M. (1977) “Vibroreplacement and Reinforced Earth Unite to
Strengthen a Weak Foundation.” Civil Engineering, ASCE, 58-62.
[135] Narsavage, P. (2007). “Downdrag in Foundation Design.” Ohio Department of
Transportation.
www.odotnet.net/geotechnical/Web_Links/Docs/2007_Consult_Workshop/Downdrag.ppt.
[136] Nassif, H. (2002). “Finite Element Modeling of Bridge Approach and Transition Slabs.”
Rep. No. FHWA-NJ-2002-007, Department of Civil and Environmental Engineering, Center
for Advanced Infrastructure & Transportation (CAIT), Rutgers, New Jersey.
[137] Neely, W. J. (1991). “Bearing capacity of auger-cast piles in sand”. Journal of
Geotechnical Engineering, 117(2), 331-345.
[138] Nicholson D.P. and Jardine R.J. (1982). “Performance of vertical drains at Queenborough
bypass.” Vertical Drains, the Institution of Civil Engineers: London, 67-90.
[139] O’Neill, M. W. (1994). “Review of augered pile practice outside the United States”.
Transportation Research Record, 1447, 3-9.
[140] ODOT. (2005). “Bridge Foundation Design Practices and Procedures.” Bridge Engineering
Section, Oregon Department of Transportation, 20.
133
[141] Opland, W. H., and Barnhart, V. T. (1995). “Evaluation of The URETEK Method for
Pavement Undersealing.” Research Rep. No. R-1340, Michigan Department of
Transportation in Cooperation with the U.S. Department of Transportation.
[142] PCI. (2001). “The State of the Art of Precast/Prestressed Integral Bridges.”
Precast/Prestressed Concrete Institute, Chicago, Illinois.
[143] Pierce, C. E., Baus, R. L., Harries, K. A. and Yang, W. (2001) “Investigation into
Improvement of Bridge Approaches in South Carolina”, Summary Report, Rep. No. FHWA-
SC-01-02, South Carolina Department of Transportation.
[144] Porbaha, A. (1998). “State of the Art in Deep Mixing Technology, Part I: Basic Concepts
and Overview of Technology.” Ground Improvement, 2(2), 81-92.
[145] Porbaha, A. (2000). “State of the Art in Deep Mixing Technology: Design Considerations.”
Ground Improvement, 4(3), 111-125.
[146] Porbaha, A. and Roblee, C. (2001). “Challenges for Implementation of Deep Mixing in the
USA.” Proceedings of International Workshop on Deep Mixing Technology, National Deep
Mixing Program, Oakland, CA., 2 volumes.
[147] Rahman, F., Hossain, M. and Romanoschi, S. (2007). “Intelligent Compaction Control of
Highway Embankments Soil.” 86th Annual Meeting of the Transportation Research Board,
Washington, D.C., 2007.
134
[148] Rathmayer, H. (1996). “Deep Mixing Methods for Soft Subsoil Improvement in the Nordic
Countries.” Proceedings of IS-Tokyo ’96, The 2nd International Conference on Ground
Improvement Geosystems, 14-17 May 1996, Tokyo, 869-878.
[149] RECON (2007). DSM Work Plan Report for Project: STP 2007 (165) MM IH 30 Tarrant
County, Houston Texas
[150] Report on Texas Bridges (2006). Prepared by the Bridge Division of the Texas
Department of Transportation, Austin, Texas.
[151] Rixner, J.J., Kraemer, S.R., and Smith, A.D. (1986). “Prefabricated Vertical Drains, Vol. 1.”
Rep. No. FHWA-RD-86/168, Federal Highway Administration,Washington, D.C.
[152] Rowe, R.K., Gnanendran, C.T., Landva, A.O. and Valsangkar, A.J. (1995). “Construction
and performance of a full-scale geotextile reinforced test embankment.” Canadian
Geotechnical Journal, 32(3), 512–534.
[153] Saride, S, Sirigiripet, S.K, Puppala, A. J, Williammee, R. (2008). “Performance of
Expanded Clay Shale (ECS) as an Embankment Backfill.” In the Proceedings of
International Conference on ‘The Challenges of Sustainability in the Geoenvironment’,
American Society of Civil Engineers, Geocongress- 2008. March 9-12, New Orleans,
Louisiana, USA.
[154] Schaefer, V.R, Koch, J.C. (1992). “Void Development under Bridge Approaches,” Rep.
No. SD90-03, South Dakota Department of Transportation.
135
[155] Seo, J. (2003). “The Bump at the End of the Bridge: An Investigation.” Dissertation
submitted in partial fulfillment of the requirements for the degree of the Doctor of
Philosophy, Texas, A&M University, College Station, Texas.
[156] Seo, J., Ha, H. S., and Briaud, J.L. (2002). “Investigation of Settlement at Bridge
Approach Slab Expansion Joint: Numerical Simulation and Model Tests.” Rep. No.
FHWA/TX-03/4147-2, Texas Transportation Institute, Texas A&M University, College
Station, Texas.
[157] Serridge, C.J. and Synac, O. (2007). “Ground Improvement Solutions for Motorway
Widening Schemes and New Highway Embankment Construction Over Soft Ground.”
Ground Improvement Journal, 11(4), 219-228.
[158] Shen, S.-L., Hong, Z.-S., and Xu, Y.-S. (2007). “Reducing Differential Settlements of
Approach Embankments.” Proc. of Institute of Civil Engineers, Geotechnical Engineering,
Issue GE4, 215-226.
[159] Siemeier, J.A., Young, D. and Beberg, D. (2000). “ Comparison of the dynamic cone
penetrometer with other tests during subgrade and granular base characterization in
Minnesota.” Nondestructive Testing of Pavements and Backcalculation of Moduli: Third
Volume, ASTM STP 1375, Tayabji and Lukanen, eds., ASTM, West Conshohocken, Pa.,
175-188.
136
[160] Sluz, A., Sussmann, T. R., and Samavedam, G. (2003). “Railroad Embankment
Stabilization Demonstration for High-Speed Rail Corridors.” Grouting and Ground
Treatment (GSP No. 120). 3rd
International Specialty Conference on Grouting and Ground
Treatment. February 10–12, New Orleans, Louisiana, USA.
[161] Smadi, O. (2001). “The strength of flowable mortar.” http://www.ctre.iastate.edu/PUBS/tech_news/2001/julaug/flowable_mortar.pdf
[162] Snethen, D. R. and Benson, J. M. (1998). “Construction of CLSM Approach Embankment
to Minimize the Bump at the End of the Bridge.” The Design and Application of Controlled
Low-Strength Materials (Flowable Fill), ASTM STP 1331.
[163] Soltesz, S. (2002). “Injected Polyurethane Slab Jacking.” Final Report, Rep. No. FHWA-
OR-RD-02-19, Oregon Department of Transportation Research Group.
[164] Stark, T. D., Olson, S. M., and Long, J. H. (1995). “Differential Movement at the
Embankment/Structure Interface Mitigation and Rehabilitation.” Rep. No. IABH1, FY 93,
Illinois Department of Transportation, Springfield, Illinois.
[165] Stewart, C. F. (1985). “Highway Structure Approaches.” California Department of
Transportation, Sacramento, CA.
[166] Stoll, R.D. and Holm, T.A. (1985). “Expanded shale lightweight fill: geotechnical
properties.” Journal of Geotechnical Engineering, ASCE 111 (GT8), 1023–1027.
137
[167] Strauss, J., Dahnke, D. and Nonamaker, F.(2004) “ Compaction Grouting to Mitigate
Settlement Beneath Approach Fills, California State Route 73 at Laguna Canyon Road”,
Geotechnical Engineering for Transportation Project, ASCE,1876-1883.
[168] Tadros, M.K., and Benak, J.V. (1989). “Bridge Abutment and Approach Slab Settlement
(Phase I Final Report), University of Nebraska, Lincoln.
[169] Terzaghi, K. (1943) “Theoretical Soil Mechanics.” John Wiley and Sons, New York.
[170] Timmerman, D.H. (1976). “An Evaluation of Bridge Approach Design and Construction
Techniques.” Final Report, Rep. No. OHIODOT-03-77, Ohio Department of Transportation.
[171] Transportation Research Board. (2008). “Intelligent Soil Compaction Systems.” Rep. No.
NCHRP 21-09. Washington, D.C.
[172] Unified Facilities Criteria (UFC). (2004). “Pavement Design For Roads, Streets, Walk, and
Open Storage Area.” Rep. No. UFC 3-250-01FA, US Army Corps of Engineers.
[173] Vipulanandan, C., Kim, M.G., and O’Neill, M.W. (2004). “Axial Performance of Continuous
Flight Auger Piles for Bearing”, Project Report No. 7-3940-2, Texas Department of
Transportation, Austin, Texas.
[174] Wahls, H. E. (1990). NCHRP Synthesis of Highway Practice No. 159: Design and
Construction of Bridge Approaches. Transportation Research Board, National Research
Council, Washington, D.C.

138
[175] Walkinshaw, J. L. (1978). “Survey of Bridge Movements in the Western United States.”
Transportation Research Record 678: Tolerable Movements of Bridge Foundations, Sand
Drains, K-Test, Slopes, and Culverts, Transportation Research Board, National Research
Council, Washington, D.C., 6–12.
[176] White, D. J. and Suleiman, M.T. (2004). “Design of Short Aggregate Piers to Support
Highway Embankments.” 83rd
Annual Meeting Transportation Research Board, Washington,
D.C.
[177] White, D., Mohamed, M., Sritharan, S. and Suleiman, M. (2007). “Underlying” Causes for
Settlement of Bridge Approach Pavement Systems.” Journal of Performance of
Constructed Facilities, ASCE, 273-282.
[178] White, D., Sritharan, S., Suleiman, M., Mohamed M. and Sudhar, C. (2005).
“Identification of the Best Practices for Design, Construction, and Repair of Bridge
Approaches.” CTRE. Project 02-118, Iowa State University. Ames, Iowa.
[179] White, D.J., Wissman, K., Barnes, A.G. and Gaul, A.J. (2002). “Embankment Support: A
Comparison of Stone Column and Rammed Aggregate Pier Soil Reinforcement.” Proc. 81st
Annual TRB Meeting, Washington, D. C.
[180] Williammee, R. (2008) Personal communication, Fort Worth District Materials Engineer,
Texas Department of Transportation.
139
[181] Wissmann, K. J. and Fox, N.S. (2000). “Design and analysis of Short Aggregate Piers to
reinforce soils.” Preceedings, Geotechnical Colloquium, Technical University Darmstadt,
Fermany, March 25, 2000.
[182] Wolde-Tinsae, A.M, Aggour, S.M. and Chini, S.A. (1987). “Structural and Soil Provisions
for Approaches to Bridges.” Interim Report AW087-321-046, Maryland Department of
Transportation.
[183] Won, M. S. and Kim, Y. S. (2007). “Internal Deformation Behavior of Geosynthetic-
reinforced Soil Walls.” Geotextiles and Geomembranes, 25(1), 10-22.
[184] Wong, H. K. W, and Small, J. C. (1994). “Effect of Orientation of Bridge Slabs on
Pavement Deformation.” Journal of Transportation Engineering, 120(4), 590-602.
[185] Wu, J.T.H., Lee, K.Z.Z., Helwany, B. S. and Ketchart, K. (2006). “Design and Construction
Guidelines for Geosynthetic-Reinforced Soil Bridge Abutments with a Flexible Facing.”
Proc. NCHRP Report 556. Transportation Research Board, Washington DC.
[186] Wu, J.T.H., Lee, K.Z.Z. and Ketchart, K. (2003). “A Review of Case Histories on GRS
Bridge-Supporting Structures with Flexible Facing.” Proc. 82nd
Annual TRB Meeting.
[187] Zelada, G. A., and Stephenson, R. W. (2000). “An Evaluation of Auger Cast-in-Place Pile
Design Methodologies for Compression Loading.” Proc. of Int. Conf. on New Technological
and Design Developments in Deep Foundations, Geo-Denver 2000, ASCE, August 5-8,
2000, Denver.
140
BIOGRAPHICAL INFORMATION
Raja Veerendra Yenigalla was born on 17 June 1988 in Vijayawada, Andhra Pradesh
India. He completed his schooling and intermediate from Veeremachaneni Paddayya
Siddhartha Public School and Nalanda Junior College in 2003 and 2005 respectively and joined
Velagapudi Ramakrishna Siddhartha Engineering College to pursue his bachelor’s degree. He
received his bachelor’s degree in Civil engineering from Acharya Nagarjuna University in 2009.
He joined the University of Texas at Arlington in 2010 to pursue his Masters in Civil Engineering
with a major concentration in Geotechnical Engineering.