Embed Size (px)
Citation preview

Seediscussions,stats,andauthorprofilesforthispublicationat:http://www.researchgate.net/publication/274266084
AnoverviewofrecentphysicsresultsfromNSTX
ARTICLEinNUCLEARFUSION·OCTOBER2015
ImpactFactor:3.24·DOI:10.1088/0029-5515/55/10/104002
DOWNLOADS
11
VIEWS
48
143AUTHORS,INCLUDING:
D.A.Humphreys
GeneralAtomics
333PUBLICATIONS2,222CITATIONS
SEEPROFILE
GerritJKramer
PrincetonUniversity
262PUBLICATIONS2,346CITATIONS
SEEPROFILE
TobinMunsat
UniversityofColoradoatBoulder
226PUBLICATIONS908CITATIONS
SEEPROFILE
JamesRandallWilson
PrincetonUniversity
504PUBLICATIONS2,323CITATIONS
SEEPROFILE
Availablefrom:GaryTaylor
Retrievedon:17June2015

This content has been downloaded from IOPscience. Please scroll down to see the full text.
Download details:
IP Address: 198.125.231.62
This content was downloaded on 18/05/2015 at 17:01
Please note that terms and conditions apply.
An overview of recent physics results from NSTX
View the table of contents for this issue, or go to the journal homepage for more
2015 Nucl. Fusion 55 104002
(http://iopscience.iop.org/0029-5515/55/10/104002)
Home Search Collections Journals About Contact us My IOPscience

| International Atomic Energy Agency Nuclear Fusion
Nucl. Fusion 55 (2015) 104002 (18pp) doi:10.1088/0029-5515/55/10/104002
An overview of recent physics results fromNSTXS.M. Kaye1, T. Abrams1, J.-W. Ahn2, J.P. Allain3, R. Andre1, D. Andruczyk3,R. Barchfeld4, D. Battaglia1, A. Bhattacharjee1, F. Bedoya3, R.E. Bell1, E. Belova1,J. Berkery5, L. Berry2, N. Bertelli1, P. Beiersdorfer6, J. Bialek5, R. Bilato7,J. Boedo8, P. Bonoli9, A. Boozer5, A. Bortolon10, M.D. Boyer1, D. Boyle1,D. Brennan11, J. Breslau1, J. Brooks12, R. Buttery13, A. Capece1, J. Canik2,C.S. Chang1, N. Crocker14, D. Darrow1, W. Davis1, L. Delgado-Aparicio1, A. Diallo1,D. D’Ippolito15, C. Domier4, F. Ebrahimi11, S. Ethier1, T. Evans13, N. Ferraro13,J. Ferron13, M. Finkenthal16, R. Fonck17, E. Fredrickson1, G.Y. Fu1, D. Gates1,S. Gerhardt1, A. Glasser18, N. Gorelenkov1, M. Gorelenkova1, I. Goumiri11, T. Gray2,D. Green2, W. Guttenfelder1, R. Harvey19, A. Hassanein12, W. Heidbrink20,Y. Hirooka21, E.B. Hooper6, J. Hosea1, D. Humphreys13, E.F. Jaeger22, T. Jarboe18,S. Jardin1, M.A. Jaworski1, R. Kaita1, C. Kessel1, K. Kim1, B. Koel11, E. Kolemen1,G. Kramer1, S. Ku1, S. Kubota14, R.J. LaHaye13, L. Lao13, B.P. LeBlanc1,F. Levinton23, D. Liu20, J. Lore11, M. Lucia3, N. Luhmann Jr14, R. Maingi1,R. Majeski1, D. Mansfield1, R. Maqueda23, G. McKee17, S. Medley1, E. Meier6,J. Menard1, D. Mueller1, T. Munsat24, C. Muscatello4, J. Myra15, B. Nelson18,J. Nichols1, M. Ono1, T. Osborne13, J.-K. Park1, W. Peebles14, R. Perkins1,C. Phillips1, M. Podesta1, F. Poli1, R. Raman18, Y. Ren1, J. Roszell11, C. Rowley11,D. Russell15, D. Ruzic3, P. Ryan2, S.A. Sabbagh5, E. Schuster25, F. Scotti6,Y. Sechrest24, K. Shaing17, T. Sizyuk12, V. Sizyuk3, C. Skinner1, D. Smith17,P. Snyder13, W. Solomon1, C. Sovenic17, V. Soukhanovskii6, E. Startsev1,D. Stotler1, B. Stratton1, D. Stutman16, C. Taylor12, G. Taylor1, K. Tritz16,M. Walker13, W. Wang1, Z. Wang1, R. White1, J.R. Wilson1, B. Wirth10, J. Wright9,X. Yuan1, H. Yuh23, L. Zakharov1 and S.J. Zweben1
1 Princeton Plasma Physics Laboratory, Princeton University, Princeton, NJ 08543, USA2 Oak Ridge National Laboratory, Oak Ridge, TN 37831, USA3 University of Illinois at Urbana-Champaign, Urbana, IL, USA4 University of California at Davis, Davis, CA, USA5 Columbia University, New York, NY, USA6 Lawrence Livermore National Laboratory, Livermore, CA, USA7 IPP, Garching, Germany8 University of California at San Diego, San Diego, CA, USA9 Massachusetts Institute of Technology, Cambridge, MA, USA10 University of Tennessee, Knoxville, TN, USA11 Princeton University, Princeton, NJ, USA12 Purdue University, W. Lafayette, IN, USA13 General Atomics, San Diego, CA, USA14 University of California at Los Angeles, Los Angeles, CA, USA15 Lodestar Research Corporation, Boulder, CO, USA16 Johns Hopkins University, Baltimore, MD, USA17 University of Wisconsin, Madison, WI, USA18 University of Washington, Seattle, WA, USA19 CompX, Del Mar, CA, USA20 University of California at Irvine, Irvine, CA, USA21 National Institute for Fusion Science, Oroshi, Toki, Gifu, Japan22 XCEL, Oak Ridge, TN, USA23 Nova Photonics, Princeton, NJ, USA24 University of Colorado, Boulder, CO, USA25 Lehigh University, Bethlehem, PA, USA
E-mail: [email protected]
0029-5515/15/104002+18$33.00 1 Not subject to copyright in the USA/Contribution of the Department of Energy Printed in the UK

Nucl. Fusion 55 (2015) 104002 S.M. Kaye et al
Received 13 November 2014, revised 18 December 2014Accepted for publication 7 January 2015Published 27 March 2015
AbstractThe National Spherical Torus Experiment (NSTX) is currently being upgraded to operate at twice the toroidal field and plasmacurrent (up to 1 T and 2 MA), with a second, more tangentially aimed neutral beam (NB) for current and rotation control,allowing for pulse lengths up to 5 s. Recent NSTX physics analyses have addressed topics that will allow NSTX-Upgrade toachieve the research goals critical to a Fusion Nuclear Science Facility. These include producing stable, 100% non-inductiveoperation in high-performance plasmas, assessing plasma–material interface (PMI) solutions to handle the high heat loadsexpected in the next-step devices and exploring the unique spherical torus (ST) parameter regimes to advance predictivecapability. Non-inductive operation and current profile control in NSTX-U will be facilitated by co-axial helicity injection(CHI) as well as radio frequency (RF) and NB heating. CHI studies using NIMROD indicate that the reconnection processis consistent with the 2D Sweet–Parker theory. Full-wave AORSA simulations show that RF power losses in the scrape-offlayer (SOL) increase significantly for both NSTX and NSTX-U when the launched waves propagate in the SOL. ToroidalAlfven eigenmode avalanches and higher frequency Alfven eigenmodes can affect NB-driven current through energy loss andredistribution of fast ions. The inclusion of rotation and kinetic resonances, which depend on collisionality, is necessary forpredicting experimental stability thresholds of fast growing ideal wall and resistive wall modes. Neutral beams and neoclassicaltoroidal viscosity generated from applied 3D fields can be used as actuators to produce rotation profiles optimized for globalstability. DEGAS-2 has been used to study the dependence of gas penetration on SOL temperatures and densities for the MGIsystem being implemented on the Upgrade for disruption mitigation. PMI studies have focused on the effect of ELMs and 3Dfields on plasma detachment and heat flux handling. Simulations indicate that snowflake and impurity seeded radiative divertorsare candidates for heat flux mitigation in NSTX-U. Studies of lithium evaporation on graphite surfaces indicate that lithiumincreases oxygen surface concentrations on graphite, and deuterium–oxygen affinity, which increases deuterium pumping andreduces recycling. In situ and test-stand experiments of lithiated graphite and molybdenum indicate temperature-enhancedsputtering, although that test-stand studies also show the potential for heat flux reduction through lithium vapour shielding.Non-linear gyro kinetic simulations have indicated that ion transport can be enhanced by a shear-flow instability, and thatnon-local effects are necessary to explain the observed rapid changes in plasma turbulence. Predictive simulations have shownagreement between a microtearing-based reduced transport model and the measured electron temperatures in a microtearingunstable regime. Two Alfven eigenmode-driven fast ion transport models have been developed and successfully benchmarkedagainst NSTX data. Upgrade construction is moving on schedule with initial physics research operation of NSTX-U plannedfor mid-2015.
Keywords: NSTX, spherical torus, overview
(Some figures may appear in colour only in the online journal)
1. Introduction
Recent analysis of data from the National Spherical TorusExperiment (NSTX) has focused on topics critical to thedevelopment of the research plan and achievement of physicsgoals for the NSTX-Upgrade. NSTX (R/a = 0.85/0.65 m,κ = 1.8–2.4, δ = 0.3–0.8, Ip up to 1.5 MA, BT up to0.55 T) concluded operation in October 2010 in order tobegin Upgrade construction activities. NSTX-U [1] has threeprimary research goals:
1. To advance the spherical torus (ST) concept for a fusionnuclear science facility (FNSF) [2]. Achieving this goalrequires demonstrating 100% non-inductive sustainmentat a performance level that extrapolates to �1 MW m−2
neutron wall loading in FNSF, as well as developing non-inductive start-up and ramp-up techniques for an FNSFwith a small, or no, solenoid. The latter is a particularlyunique requirement for an ST-based FNSF [3].
2. To develop solutions for the plasma–material interface(PMI). High-flux expansion snowflake or X-divertor,coupled with radiative detachment, will be employedfor mitigating high heat fluxes (qpeak,div � 40 MW m−2,
Pheat/S � 0.5 MW m−2, up to five times greater thanin NSTX), and high-Z and liquid lithium plasma-facingcomponents (PFC) will be assessed as PMI solutions.
3. To explore unique ST parameter regimes to advancepredictive capability for ITER and beyond. In orderto address this goal, NSTX-U will access reducedcollisionality (up to a factor of ten lower than that inNSTX) and high-β (βn � 6) with an ability to vary the q-and rotation profiles for enhanced stability, confinementand non-inductive current drive. Models for thermal andfast ion transport will be developed and/or tested.
The increased capabilities of NSTX-U (R/a =0.95/0.55 m, κ � 2.8) will facilitate the research necessary toachieve these goals. The major capabilities include a factor of∼two increase in both plasma current Ip and toroidal magneticfield BT to 2 MA and 1 T respectively, and an additional off-axis neutral beam that will double the available nominal inputbeam power to 12 MW. The first two enhancements will allowfor high-β operation at almost an order-of-magnitude lowercollisionality [4], and the second neutral beam, coupled withup to 6 MW of high harmonic fast wave (HHFW) heating andcurrent drive, will provide means to vary the q- and rotation
2

Nucl. Fusion 55 (2015) 104002 S.M. Kaye et al
profile, and it will provide significant non-inductive currentdrive directly or indirectly. This will enable NSTX-U tosustain stable, high-performance discharges in near steady-state conditions for pulse lengths up to 5 s, which is a durationof many current diffusion times. Advanced control algorithms,using the above capabilities as well as applied n = 1to 3 non-axisymmetric magnetic perturbations (MPs) froma midplane, and eventually, possibly an off-midplane, coilsystem will be utilized for stable operation. A cryo-pump isbeing considered for density control. A disruption prediction,avoidance and mitigation (PAM) system will be deployed usinga large number of measurements and models for prediction andavoidance [5–7] and a massive gas injection (MGI) systemat different poloidal locations to optimize gas penetrationfor reducing potential wall damage due to disruptive forces.Lithium evaporation and boronization will be used as theprimary wall conditioning techniques, and off-line researchcentred on liquid lithium on metal substrates will support aplanned phasing in of high-Z PFCs.
The capabilities of NSTX-U complement those of thecompanion ST, MAST-U [8], which plans to commenceoperation shortly after the start of NSTX-U. The elementsof recent research on NSTX-U, both experimental analysisand theory that address the topics mentioned above, will bereported in this paper.
2. Advance the ST concept for a Fusion NuclearScience Facility
This section will focus on two main issues, the non-inductivecurrent drive research that will allow for achievement ofthe 100% non-inductive goal in the three phases of thedischarge (start-up, ramp-up and sustainment), and the abilityto maintain magnetohydrodynamic (MHD) stable plasmas forlong duration.
2.1. Non-inductive start-up and ramp-up
NSTX-U is striving for fully non-inductive operation toestablish the physics basis of an ST-FNSF with small or nosolenoid, and the starting point is plasma initiation and currentramp-up. An envisioned strategy for non-inductive operationin NSTX-U is shown in figure 1. NSTX-U will initiate theplasma using co-axial helicity injection (CHI), as has beendone in NSTX [9]. Plasma guns [10] will be tested on NSTX-Ufor start-up once development on smaller devices is complete.Once the plasma is initiated, electron cyclotron heating (ECH)is being considered for heating the plasma from an initialtemperature of 10 s of eV to up to several hundred eV, alongwith HHFW to heat the plasma further to the 1–3 keV level (redphase). At this point, HHFW and/or neutral beam injection(NBI) current drive would be used to ramp the plasma currentup to full current (blue phase), at which time neutral beamcurrent drive and bootstrap current would be utilized to sustainthe full current non-inductively (black phase).
CHI has been successfully used for plasma formation inNSTX with currents up to 200 kA and especially with couplingto inductive ramp-up [9]. Axisymmetric Tokamak SimulationCode (TSC) [11] simulations, reported previously [12],have been validated successfully against NSTX discharges,
Figure 1. Strategy for fully non-inductive operation in NSTX-U.
and these simulations are the basis for start-up scenariodevelopment on NSTX-U, where CHI is projected to be ableto provide up to 400 kA of start-up current. An example of theTSC-produced flux evolution in an NSTX plasma is shown infigure 2. For this case, a 5 ms voltage pulse is applied acrossthe injection electrodes, providing sufficient current to allowthe discharge to fill the vessel. The voltage is rapidly reducedto zero at t = 5 ms (first panel in figure 2). The closed fluxsurfaces form in this axisymmetric simulation as a result ofgeneration of a strong toroidal loop voltage that drives thetoroidal current.
The underlying physics of CHI start-up have been studiedwith resistive MHD simulations using the NIMROD code [13]in 2D in order to improve the flux surface closure andcurrent drive using this technique [14, 15]. In one set ofsimulations, time-varying boundary conditions and poloidalfield coil currents emulating experimental conditions wereused, and closed flux surfaces were produced [14]. A moresimplified model, with constant poloidal field currents andtime varying injector currents, was used to study the minimumconditions for flux closure [15]. In these simulations, theinjector voltage is adjusted so that the J × B force overcomesthe field line tension and open field lines fill the vessel. Fluxclosure occurs under the right conditions approximately 0.5 msafter the injector voltage is turned off, as in the experiment.
These simulations indicate that the magnetic diffusivitystrongly controls flux closure, with no flux closure at highdiffusivity corresponding to temperatures lower (Te � 1 eV)than those measured in the experiment. As the diffusivitydecreases with Te increasing towards the experimental values(10–25 eV), flux closure occurs with increasing volume ofclosed flux. Field line tracing was used to confirm theformation of the X-point and flux closure, as is shown infigure 3 for two temperatures, Te = 14 and 24 eV. Additionalscans indicate other dependences controlling flux closure. Ifthe injection voltage is slowly reduced to zero or the injectorflux footprints are too far apart, closure is inhibited. Thefirst is due to smaller generated toroidal loop voltage, and thesecond due to the longer time scales required for the oppositelydirected flux to come together and form an X-point.
3

Nucl. Fusion 55 (2015) 104002 S.M. Kaye et al
Figure 2. Time evolution of flux surface closure with CHI in an NSTX plasma.
Figure 3. Poincare plots soon after flux closure for twoexperimentally relevant electron temperatures (a) 14 eV and(b) 24 eV [15]. (Copyright 2013, American Institute of Physics.)
The simulations have shown that during X-pointformation, the current density is localized to an elongatedcurrent sheet (figure 4) whose width scales as η1/2, where η isthe magnetic diffusivity. This, along with the computed stronginflow and outflow characteristics, suggests that the X-pointformation may be a Sweet–Parker-type reconnection.
Once the plasma is initiated, the core electron temperaturehas to be increased in order for HHFW or NBI to couple to theNSTX-U plasma for continued ramp-up of the plasma current.
Figure 4. Toroidal current in the reconnection region. [14, 15].(Copyright 2013, American Institute of Physics.)
In order to do this, and as part of a possible future upgrade tothe NSTX-U facility, a 28 GHz O-mode ECH system that iscapable of injecting �1 MW for pulse lengths of up to severalseconds can be utilized. TSC simulations predict that thecentral electron temperature can increase from 10 to 100 eVin 20 ms when 0.6 MW of ECH power is coupled to a CHIplasma. This increase in temperature will reduce significantlythe plasma current decay rate of CHI plasmas and allow forcoupling to medium and high harmonic fast wave heatingand NBI.
The level of heating and current drive that HHFW canprovide is critically dependent on how much power is lostalong open field lines in the SOL. Recent experimental resultshave shown that up to 60% of the coupled power can belost when edge densities are high enough that fast waves canpropagate close to the launcher [16]. Thus, it is important tounderstand the physics of RF deposition and especially thisedge loss mechanism in order to optimize discharge scenariosthat lead to RF loss minimization. Understanding the physicscan aid in the projection to ICRF efficiency and depositionin ITER.
4

Nucl. Fusion 55 (2015) 104002 S.M. Kaye et al
Figure 5. Wave electric field from AORSA for low density,nSOL = 1 × 10¹⁸ m−3, (left) and high density,nSOL = 2 × 10¹⁸ m−3, (right) at the front of the antenna. (Adaptedfrom [18] courtesy of IAEA.)
Full-wave simulations using the AORSA code [17] havebeen performed to demonstrate the direct correlation betweenthe location of the fast wave cutoff relative to the antennaand the last closed flux surface (LCFS), the large amplitudeof the RF fields in the SOL, and the power loss there [18].Figure 5 shows the wave electric field obtained from AORSAfor an NSTX discharge in which, for the computation, twodensity values in front of the antenna were used. The whiteand black curves in the figure indicate the FW cutoff and LCFS,respectively. It is clearly seen in the figure that the wave electricfield in the SOL is small at a low density, when the FW cutoffis in front of the antenna, but becomes quite large at a highdensity when the FW cutoff opens up. At a low density, whenthe cutoff is in front of the antenna, the waves are evanescent,but they can propagate in the scrape-off layer (SOL) when thecutoff opens at a high density.
In order to understand how the variation of the electricfield amplitude is associated with the wave SOL powerlosses, an artificial collisional damping has been incorporatedinto AORSA. The actual damping mechanism is presentlyunknown. The fraction of RF power lost to the SOL as afunction of density in front of the antenna, nant, for two differenttoroidal wave numbers is shown in figure 6. In the figure,the vertical lines reflect the density at which the FW cutoffopens up for the respective wavenumbers. The figure showsthe rapid increase of lost power as the wave transitions fromthe evanescent (low nant) to the propagating (high nant) regime,where the wave electric field amplitude is calculated to be lowand high, respectively. The value of the collisional dampingterm has been chosen so that the level of RF power loss to theSOL is consistent with levels inferred from experiment for theconditions studied [18].
These calculations have been extended to NSTX-U, andthe results indicate the same transition behaviour as a functionof nant as was found for NSTX. An important difference,however, is that the transition to high losses is predicted tooccur at higher densities (2×) in NSTX-U, indicating a widerSOL density range in which the experiment can run with lowerSOL power losses. This is because nSOL,cutoff ∝ k2
‖BT/ω.Future studies will also work on identifying the actual physicalmechanism(s) behind the RF power losses.
0 0.5 1 1.5 2 2.5 30
5
10
15
20
25
nant
[1018 m−3]
SO
L po
wer
loss
es [%
]
Figure 6. Fraction of power lost to the SOL as a function of densityin front of the antenna for nφ = −21 (solid red) and nφ = −12(dashed blue) as calculated by AORSA. The vertical lines indicatethe cutoff density for the two respective nφ . (Reproduced from [18]courtesy of IAEA.)
Figure 7. I–V characteristic for probes P4 (R = 70.59 cm, underspiral) and P2 (R = 64.67 m, away from spiral).
Field-aligned RF losses in the SOL have been shownto produce bright hot spirals in the NSTX lower outerdivertor [19]. An analysis of the I–V characteristics of aradial array of swept Langmuir probes [20] in the lower divertorindicates that RF rectification may be an important contributorto the heat flux to the probe under the spiral [21]. The RF fieldsproduce a negative shift in the floating potential of −24 V forthe probe under the spiral (P4 at R = 70.59 m) relative tothat away from the tile (P2 at R = 64.67 m), as is seen infigure 7. Both probe characteristics, however, have similar Isat
and Te values, indicating that the sheath heat flux transmissionfactor, γ = qheat/jsatTe, doubles for the rectified (−24 V offset)case. The importance of this is that the tile heating may be aresult of a process (rectification) close to the tiles, rather thana process that takes place along the field line. The latter couldpotentially result in a difference in temperature between theP2 and P4 probes, which is not seen (figure 7). Furthermore,the source of the floating potential offset may be related to thelarge wave electric fields seen in figure 5, as this rectification
5

Nucl. Fusion 55 (2015) 104002 S.M. Kaye et al
Figure 8. Existence space for various types of Alfven activity inNSTX.
appears to be stronger when the spirals are stronger, which isat a higher nant [21]. Rectification as a source for tile heating,which may be an issue for ITER, will be studied further onNSTX-U with a more comprehensive set of Langmuir probes,both in location and diagnostic capability.
2.2. Non-inductive sustainment: energetic particle physicsand neutral beam current drive
Neutral beam current drive will be used during boththe discharge ramp-up and sustainment phases to aid theachievement of 100% non-inductive operation. NSTX-U willhave two neutral beam injectors, each with three sources,aiming at R = 0.5, 0.6, 0.7 m and 1.1, 1.2, 1.3 m for a nominalplasma major radius of 0.95 m. The beams will provide thecapability not only to drive current, but also to tailor the currentprofiles for stable operation [4]. It is, however, importantto understand the physics processes that can affect the fastion distribution in order to develop scenarios to achieve theNSTX-U research goals and to address the performance offuture fusion plasma experiments such as ITER. Figure 8is an existence plot of the types of Alfven activity seen inNSTX as a function of vfast/vAlfven and Wfast/Wtotal. Generally,NSTX discharges evolve from the lower right of the figureto the upper left as the density increases. Toroidal Alfveneigenmode (TAE) avalanches and other energetic particlemodes (EPMs) are observed at higher Wfast/Wtotal (low andmedium density), while EPMs and quiescent plasmas are seenat lower Wfast/Wtotal (higher densities). TAE avalanches areseen when Wfast/Wtotal � 0.3. The figure also shows thatthe NSTX-U operational space (grey shaded region) in theseparameters overlaps that envisioned for both ITER and an ST-FNSF. The TAE avalanches and EPMs can result in up to a 35%drop in the neutron rate, which has been determined to comeprimarily from energy loss and spatial redistribution of thefast ions [22]. This conclusion is based on the determinationof the linear eigenmode structure whose mode amplitudes areconstrained by measured displacements, and particle tracking
Figure 9. (Top) Spectrogram of envelope of high-frequency CAEfluctuation amplitude, overlaid with kink mode frequencies.(Bottom) Relative phase between the n = 1 kink andhigh-frequency CAE envelope [23]. (Copyright 2013, AmericanInstitute of Physics.)
in the presence of these modes. Further, the analysis ofindividual TAE avalanches indicates that the energy lost fromthe fast ions is comparable to the estimated wave energy lostdue to TAE damping on the thermal plasma.
Recent analysis and theory have also revealed complexrelationships between different instabilities. Figure 9 showsan example of high-frequency (1.4–2 MHz) compressionalAlfven eigenmode (CAE) whose burst frequency is regulatedby kink modes in the 2–30 kHz frequency range [23]. The CAEburst frequency clearly locks on the n = 1 and 2 kink modefrequencies (top panel), with a phase shift of ∼ 90◦ (bottompanel). This repetitive bursting of modes, and coupling to kinkswith this phase shift, may indicate a predator–prey relation,where the fast ion beta takes the role of the prey, increasinglinearly in the absence of mode-induced losses, and the CAEmode amplitude plays the role of the predator, causing fast ionloss. Simulations with a predator–prey model find that that justa few per cent modulation of the CAE damping rate is sufficientto cause the phase locking as is seen in the experiment [23].
In ST plasmas with weakly reversed magnetic shear andqmin slightly above 1, stability calculations [24] indicate that anon-resonant kink (NRK) can be unstable. NSTX dischargeshave exhibited the co-existence of the NRK with higherfrequency, beam-driven fishbone modes (EPMs), and linearand non-linear simulations using the global kinetic/MHDhybrid M3D-K code [25] were carried out to study the energeticparticle interaction with the NRK [26]. Figure 10 shows themap of mode stability as a function of qmin and βhot/βtotal ata fixed input power. At lower qmin, the energetic ions arestrongly stabilizing for the NRK (higher βhot/βtotal). At lowfast ion population and low qmin (lower left of the figure),the mode structure (inset) reflects that of a pure MHD modewith zero mode frequency and up–down symmetric structureat zero toroidal angle. At higher fast particle populationand higher qmin, the mode transitions to a fishbone-like EPMwith a frequency comparable to the precession drift frequency.The mode structure (inset) has a twisted character. Both the
6
Nucl. Fusion 55 (2015) 104002 S.M. Kaye et al
Figure 10. Mode stability for the NRK and fishbone modes inNSTX. Insets show the linear eigenmode structure [26]. (Copyright2013, American Institute of Physics.)
Figure 11. Contour plots of the parallel magnetic field perturbationfor CAE (left) and perturbed electric field contours for KAW (right).
NRK and the fishbone modes significantly affect the fast iondistribution, reducing the fast ion density in the central regionof the plasma. The results from these linear and non-linearM3D-K calculations will be used to identify the regimes forstable operation in NSTX-U.
The excitation of high-frequency global and compres-sional Alfven modes has been studied for an NSTX H-modedischarge using the hybrid-MHD non-linear HYM code [27].Co-rotating CAE modes were calculated to be unstable for arange of toroidal mode numbers, consistent with experimentalobservations [28]. Results from HYM indicated that unsta-ble CAE modes can strongly couple to kinetic Alfven waves(KAWs) on the high-field side of the torus, as is seen by the per-turbed parallel magnetic field structure due to the CAE and bythe perturbed parallel electric field for the KAW modes shownin figure 11. The resonance with the KAW is located at the edgeof the CAE potential well, just inside the outer edge of the beamion density profile. The importance of this result is that thiscoupling provides an energy channelling mechanism for beamenergy to excite core CAE modes with a resulting transport
Figure 12. ∂Ffast/∂v⊥ at the parallel resonant velocity as computedby TRANSP and SPIRAL with (red) and without (black) appliedMPs.
of energy flux away from the magnetic axis to the KAW reso-nance location; i.e. energy flows from the core CAE modes tothe mid-radius KAW. Using the HYM-calculated linear modestructure, and by estimating the MP level from the reflectome-ter displacement measurements [29], up to 0.4 MW of powercan be channelled out of the core, and this channelling couldhave a direct effect on the temperature profiles, with changesof calculated to be up to several hundred eV. This is one possi-ble explanation for the lack of significant heating of the centralTe observed with increasing beam power and associated withCAE/GAE activity [30].
Alfven eigenmodes (AEs) and fast ion populations canalso be impacted significantly by the application of external3D fields. Magnetic measurements of energetic ion-drivenhigh-frequency bursting CAE/GAE modes have shown thatapplying a δB/B ∼ 0.1 to 1% n = 3 MP at the plasmaedge can lead to a reduction in mode amplitude, an increase inbursting frequency, and a smaller frequency chirp [31]. Thechange in mode characteristics is accompanied by a drop inneutron rate. This is due to a loss of fast ions due directly tothe change in magnetic equilibrium by the application of the3D field. The effect of this MP on the fast ion distributionwas calculated using the SPIRAL [32] code to track theenergetic particle distribution in the presence of 3D fields and aresistive plasma response calculated by the M3D-C1 code [33].Figure 12 shows the difference in ∂Ffast/∂v⊥ at the parallelresonant velocity with (red) and without (black) applied MPs,as calculated from the TRANSP [34] and SPIRAL codes.These simulations indicate a 10–20% reduction in ∂Ffast/∂v⊥,the main driving term for these high-frequency modes. Thereduced drive is consistent with the experimentally observedreduction in mode amplitude when the 3D fields are applied.
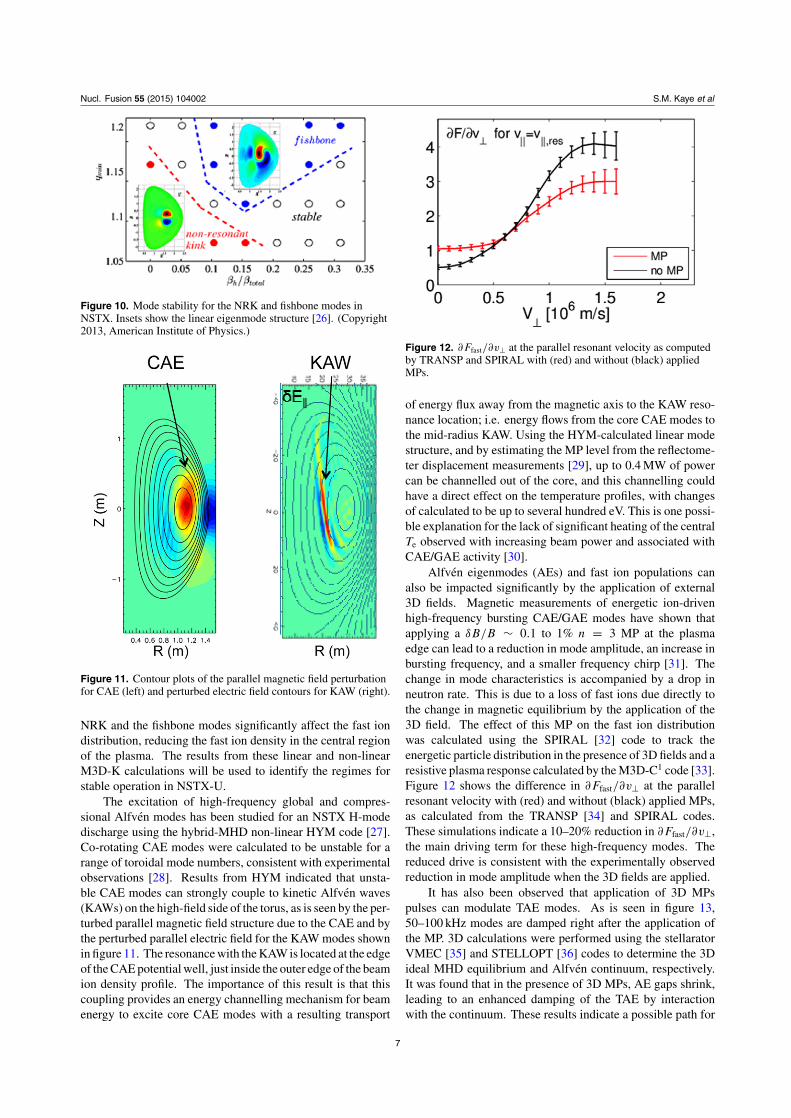
It has also been observed that application of 3D MPspulses can modulate TAE modes. As is seen in figure 13,50–100 kHz modes are damped right after the application ofthe MP. 3D calculations were performed using the stellaratorVMEC [35] and STELLOPT [36] codes to determine the 3Dideal MHD equilibrium and Alfven continuum, respectively.It was found that in the presence of 3D MPs, AE gaps shrink,leading to an enhanced damping of the TAE by interactionwith the continuum. These results indicate a possible path for
7
Nucl. Fusion 55 (2015) 104002 S.M. Kaye et al
Figure 13. TAEs modulated by pulsed edge MPs.
optimizing the MPs to produce a 3D perturbed equilibriumstable against AEs.
Time-dependent simulations with the free boundaryequilibrium solver ISOLVER in TRANSP have begun inorder to develop fully non-inductive 1 T NSTX-U dischargescenarios using current drive from all the systems discussedup to now. The simulation was run with the loop voltageconstrained to be zero. TORAY [37, 38] simulations indicatethat 1 MW of EC heating can rapidly heat plasmas generatedby CHI. Te increases from 10–20 eV, typical of CHI plasmas,to about 1 keV in 30 ms. Up to 4 MW of HHFW is thenused in conjunction with EC to further heat the plasma andto drive current to facilitate NBI with minimal fast ion losses,as calculated by TORIC [39]. The combined EC/HHFWcan delay the decrease of the CHI generated current andsustain a non-inductive current of 350 kA. With 10 MW of NBIdistributed over the two beamlines, the simulation shows thatthe current can be ramped up non-inductively to 900 kA in 2.5 s.With the density between 60% and 90% of the Greenwald limitand H98y,2 � 1.0 to 1.2, the total current is sustained with acontribution from the bootstrap between 40% and 60% for thissimulation (figure 14). The simulation has not relaxed to a fullsteady state, and this results in a finite electric field inside theplasma which gives rise to the small, negative ohmic current.
2.3. Non-inductive sustainment: stable operations
The next step towards fully non-inductive operation is theability to maintain MHD stability during the course of thecurrent ramp-up and flattop phases. This will depend onthe ability to control current, rotation and pressure profilesduring these discharge phases, and simultaneously to providesufficient non-inductive current drive. This subsection willfocus on stability control methods. Recent work towardsunderstanding the physics that will enable development ofcontrol algorithms will be discussed.
Figure 14. Fully non-inductive current scenario for a 1 T NSTX-Udischarge as computed by TRANSP with the ISOLVER freeboundary equilibrium solver.
Figure 15. n = 1 RFA amplitude as a function of average plasmarotation frequency [7]. (Copyright 2014, American Institute ofPhysics.)
One requirement for stable operation is the ability tocontrol the resistive wall mode (RWM) [40, 41]. Recent workon RWMs, including calculations with the MISK code [42, 43],has given a complex picture in which stability is controlled notonly by collisional dissipation, but also by kinetic resonancesand the plasma rotation profile [7, 44]. In particular, whenthe plasma rotation is resonant with one of the kinetic effects(e.g. precession drift or bounce motion), the RWM stability, asinferred from the resonant field amplification (RFA) measuredby n = 1 MHD spectroscopy, shows a clear dependence oncollisionality and βn/li . Rotation is also critical, however, andthis is shown in figure 15 where the RFA amplitude is plottedas a function of the average plasma E × B rotation frequencyfor an NSTX H-mode discharge [6, 7]. There is clearly anoptimal value rotation profile for stable operation (minimumRFA amplitude), and at the corresponding value of 〈ωE〉 theplasma is on-resonance with the precession drift.
In order to control the plasma rotation, a coupled 1Dtoroidal rotation model and controller is being developed inorder to capture and sustain a favourable plasma rotationprofile. In this algorithm, the neoclassical toroidal viscosity(NTV) [45] and NB torque are used as actuators for thecontroller design. The rotation is governed by the simplifiedtoroidal momentum equation, which balances the time rateof the change of rotation (assuming fixed density) with inputtorque and with a diffusive transport loss governed by an
8

Nucl. Fusion 55 (2015) 104002 S.M. Kaye et al
Figure 16. NTV and NBI actuators (top panels) and evolution ofplasma rotation using rotation control algorithm. The two set pointsrepresent two different radii, r/a = 0.13 (set point #1) andr/a = 0.55 (set point #2).
effective momentum diffusivity. The NTV torque is given bya relation that is proportional to the product of the plasmarotation frequency and the square of the applied MP fromthe midplane coils. The NB torque is calculated in theNUBEAM [46] code in TRANSP. The two expressions arenon-linear in the plasma rotation frequency, and they are solvedand advanced in TRANSP. An example of the first use of thistechnique is shown in figure 16, which shows the NB andNTV torque (top panels) and plasma rotation evolution at tworotation set points (r/a = 0.13 and 0.55, respectively) fromthe rotation feedback control algorithm. In this example, theNTV was produced by n = 3 fields from the midplane MPcoils. Using the combined NB and NTV torques, the rotationreaches its target in approximately 20 ms, much shorter thanthe momentum confinement time of ∼150 ms [47], validatingthe use of this control algorithm in real time.
Understanding the underlying physics of NTV will allowfor more confident use in predictions to future devices. Earlyexperimental work showed quantitative agreement between themeasured decrease in the toroidal angular momentum profileand the calculation of non-resonant drag torque based on NTVtheory when the effect of toroidally trapped particles wasincluded [48]. Several recent efforts have extended this work.
In one approach [49], the POCA (Particle Orbit Codefor Anisotropic Pressure) code was developed to followguiding centre orbits of particles for precisely calculating δf ,the perturbed distribution function, in a non-axisymmetricideal MHD equilibrium determined by IPEC [50]. POCAsimulations show the importance of collisionality and particleresonances with the toroidal rotation, similar to that foundfor RWMs. A comparison of NTV torque density calculatedby POCA with the measured dL/dt from changes in themomentum profile is shown in figure 17 for an n = 3experiment. As can be seen, the NTV torque densitymagnitudes agree roughly in the n = 0.6 to 0.8 region,although the location of the NTV peak is shifted inward inthe POCA calculation, and POCA underestimates the NTVinside of n = 0.5.
Another approach to determining the NTV computesthe δB fully in 3D, and it uses the Shaing formulation ofthe NTV torque TNTV valid for all collisionality regimes and thesuperbanana-plateau regime for both ions and electrons, as
Figure 17. Experimental NTV torque density (black) and thatcalculated from POCA (red).
Figure 18. Experimental NTV torque (green) and that calculatedfrom NTVTOK scaled by a factor of 0.6.
implemented in the NTVTOK code [51]. The calculationincludes the effect of the flux surface displacement. Resultsfrom the code for an applied n = 3 configuration in NSTX areshown in figure 18. The calculated TNTV exhibits large radialvariations that are not observed experimentally. The calculatedradial displacements are smaller than either the ion banana orgyroradii, suggesting finite orbit effects will spatially averageTNTV. The NTV torque density calculated from theory thatis shown in figure 18 is, therefore, averaged over the bananawidth. The calculated NTV torque density is scaled by a factorof 0.6, and it closely matches the experimental dL/dt in theouter region of the plasma where the NTV is the strongest. Inthis outer region, the flux surface-averaged δB calculated byNTVTOK compares favourably with that computed by M3D-C1, which includes a resistive plasma response model.
Rotation control is one component of a more comprehen-sive framework for stable operation. This capability is consti-tuted in a disruption PAM framework under development forNSTX-U. The system consists of measurements of equilib-rium, stability and divertor heat flux characteristics that serveas predictors. The measurements feed into control algorithms,
9

Nucl. Fusion 55 (2015) 104002 S.M. Kaye et al
which are coupled to actuators that will steer the dischargetowards stable operation. The measurements also feed into adisruption warning system, which uses a combination of indi-vidual sensor signals in an algorithm that yields an aggregatedisruption warning level [5]. The algorithm can be tuned todetect impending disruptions with a 98% accuracy, which is alevel required for ITER operation. If a clear disruption warn-ing is issued, the system steers towards mitigation, rather thancontrol.
The primary mitigation technique under development isthe MGI system utilizing an improved electromagnetic valvesimilar to the design for the ITER system [52]. The MGIwill use three such valves at different poloidal locations, oneof them being the private flux region (PFR), to determinethe location for maximum gas penetration. In parallel withexperimental preparation, numerical efforts have been initiatedwith the DEGAS-2 Monte-Carlo code [53] to model theamount of gas the valves must inject to be consistent with thethermal and current quench time scales on ITER. Preliminaryresults indicate the penetration fraction of gas through theNSTX-U SOL to be in the range from 0.2 to 0.6 for D2 and 0.8to 0.9 for He across a range of SOL widths from 0.2 to 5 cm,electron temperatures from 1 to 100 eV, and electron densitiesfrom 1018 to 2 × 10²⁰ m−3. Greater penetration occurs forcolder plasmas. For injection into the PFR, the penetrationfractions increase to be in the range from 0.4 to 0.9 for D2.
3. Develop solutions for the PMI
The second overarching research goal for NSTX-U is todevelop solutions for the PMI. This topic covers bothedge/divertor studies, including the characteristics and physicsof the edge and sources of heat flux, as well as direct PMIstudies that focus on material surface physics and chemistry.
3.1. Edge and divertor: structure and controlling processes
The application of pre-discharge lithium in NSTX has beenshown to have beneficial effects for plasma confinement,pedestal structure and ELM suppression [54–57]. Recentanalysis on this topic has focused on a dataset covering awide, contiguous, range of pre-discharge lithium depositionamounts that can address discharge performance and pedestalevolution during and after ELM suppression [58]. The densitypedestal shifted and widened continuously with increasing Lideposition even after ELMs were suppressed. No change wasseen in the temperature pedestal location or width. At thepedestal top, it was primarily the electron temperature thatchanged continuously, along with the toroidal rotation and iontemperature. Efforts are underway to determine what controlsthe pedestal characteristics and why they continue to evolveeven after ELMs are suppressed.
Previous studies addressing processes controlling thesepedestal characteristics [56, 58] have expanded to studyingthe change in the microinstability properties of the plasmaedge due to application of lithium through linear gyrokineticcalculations using the GS2 code [59]. For a dischargewithout the application of lithium, the calculations showedthat microtearing modes were dominant at the top of thepedestal, which was located at n = 0.95 (figure 19). With
Figure 19. Linear growth rates (top) and real frequencies (bottom)of microturbulent modes in an unlithiated discharge (black) and alithiated one (red). The black and red vertical lines indicate thelocation of the top of the density pedestal for the unlithiated andlithiated cases, respectively. (Reproduced from [59] courtesy ofIAEA.)
lithium, the gradient region widened, the pedestal top movedin to n = 0.80, and the density gradient at n = 0.95increased. The finite gradient at this location in the lithiatedplasmas stabilizes the microtearing mode, and modes withcharacteristics like those of the trapped electron mode (TEM)and kinetic ballooning mode (KBM) became dominant, butwith lower growth rates. Electron temperature gradient (ETG)modes were found to be unstable just inside the separatrix bothwith and without lithium, but with higher growth rates and alower temperature threshold with Li, suggesting that ETG mayplay a role in limiting the electron temperature gradient in thisregion. At mid-pedestal, a hybrid TEM/KBM mode was foundto be dominant with and without lithium. This hybrid modewas also identified in linear GENE [60] simulations during thelast 20% of an ELM cycle near the pedestal top, similar to thatfound within the pedestal using GS2 [61].
Pulsed deuterium gas puffs were used to study possiblemodifications to the plasma edge profiles and edge turbulenceand transport. A gas influx rate of 6.6 × 10²¹ deuteriumatoms/s caused little or no change in the line-averaged plasmadensity or total stored energy, or in the edge density or electrontemperature up to the time of the peak of the gas puff [62].In addition, the radial profile of the Dα light emission andedge turbulence within this gas puff did not vary significantlyover its rise and fall, implying that these puffs did not perturbsignificantly the local edge plasma or turbulence. DEGAS2modelling of the puff indicated very low levels of radiation,consistent with the lack of change of Te.
Numerical studies have been carried out to study theinteraction of edge and SOL sheared flows with coherent
10

Nucl. Fusion 55 (2015) 104002 S.M. Kaye et al
Figure 20. Poloidal Reynolds acceleration (ay) for seeded blobsimulations (red) compared with experimental results from gas puffimaging (grey). The black dashed lines represent experimental rmsdeviations. (Reproduced from [64] courtesy of IAEA.)
turbulent structures, i.e. field-aligned blob filaments, whichare a ubiquitous feature in the NSTX plasma edge, especiallyin the L-mode [63]. Results from seeded blob and quasi-steady-state turbulence simulations using the SOLT [64]code were compared with experimental data to evaluate theexchange of momentum between the blobs and flows. Thesimulations are based on a 2D curvature-interchange model,and they take into account physical mechanisms related tosheath currents and radial inhomogeneity for generation ofReynolds stress. The simulations reproduce many quantitativeand qualitative features of the data, as measured by thegas puff imaging diagnostic, including size, scale-length anddirection of approximately perpendicular flows, the inferredReynolds acceleration (figure 20), the poloidal reversal of blobtracks and blob trapping and/or ejection. These results haveimplications for SOL interactions of blobs with PFCs. Theradial penetration of blobs is influenced by flow shear, and thusjudiciously driven sheared flows in the SOL could increase theSOL width if blobs influence this property.
3.2. Edge and divertor: heat flux and heat flux mitigation
An understanding of the processes controlling the heat fluxprofiles, and how they can be changed, is needed for projectionof acceptable operating scenarios in future devices such asFNSF and ITER. Experiments on NSTX found that both highamounts of lithium wall conditioning and increasing plasmacurrent can cause a strong contraction of the SOL heat fluxwidth at the midplane [65]. The latter dependence is seen alsoat a high aspect ratio [66]. One potential method to modify theheat flux width is through controlled ELMs. Studies on JETand ASDEX-U indicated a broadening of λq with increasingELM size, which could increase the size of tolerable ELMs infuture devices [67, 68]. Results from NSTX, however, showthat under certain circumstances the heat flux footprint duringlarge ELMs could contract by up to 50%, exacerbating theheat flux challenge. Analysis of this data indicates that theheat flux profile broadening or narrowing is directly correlatedwith the number of filamentary striations measured in the ELMheat flux profile; profile narrowing is observed when very fewor no striations are observed in the heat flux [69]. Figure 21shows a measure of the change in the heat flux footprint wettedarea by ELMs, relative to the value before the ELM, as a
Figure 21. Change in divertor heat flux wetted area as a function ofthe number of ELM striations. (Reproduced from [69] courtesy ofIAEA.)
function of the number of ELM striations. The number ofstriations is inferred from 2D heat flux profiles that are fromIR-based 2D surface temperature measurements coupled to a3D heat conduction solver. The figure indicates the wetted areadecreases and a peaking of the heat flux profile below ∼fourstriations. The wetted area increases almost linearly with thenumber of striations above this value.
The striations in the heat flux profile represent ELMfilaments and, therefore, are believed to be related to thetoroidal mode number of the ELMs before expulsion ofthe filaments. The typical range of toroidal mode numbersassociated with ELM in NSTX is between one and five [57].The implications of this result for ITER and FNSF need tobe assessed by determining the edge stability and most likelytoroidal mode number across a range of expected temperatureand density profiles. In particular, scenarios that move theprojected operating points up to higher n stability limits needto be identified in order to reduce the risk of peaking of theheat flux profiles during the ELMs.
The multi-fluid UEDGE [70, 71] has been used to assesssnowflake [72] and impurity-seeded radiative divertors asheat flux mitigation candidates in NSTX-U. The simulationswere carried out for NSTX-U plasmas with Ip = 2 MA,BT = 1 T and 9 MW of power flow into the SOL. NSTXH-mode-level transport coefficients were assumed; χe,i wastaken to be 2 m2 s−1 at the core–edge interface (n = 0.9),increasing to 4 m2 s−1 at the separatrix and remaining constantat that value in the SOL. The perpendicular particle transportincreases from D = 0.1 m2 s−1 at the core–edge interface,increasing to 0.5 m2 s−1 at the separatrix and SOL. The resultsof the simulation are shown in figure 22. Both standard andsnowflake divertor configurations are found to be achievableusing NSTX-U divertor coils, and the top panel shows thepower to the divertor in both configurations (snowflake divertorin red, standard divertor in black) as a function of density atthe core–edge interface, assuming 3% carbon in the plasma.The sudden change in power to the divertor at ∼ 4 × 10¹⁹ m−3
in the standard divertor configuration corresponds to where
11

Nucl. Fusion 55 (2015) 104002 S.M. Kaye et al
Figure 22. (Top panel) Total heat flux to the divertor in thesnowflake (red) and standard (black) divertor configurations as afunction of density at the core–edge interface (n = 0.9). (Middlepanel) Heat flux profiles at 3.5 × 10¹⁹ m−3 as a function of ROSP,where ROSP is the outer strike point radius. (Bottom panel) Heat fluxto the divertor target as a function of % argon impurity seeding for3.5 × 1019 m−3.
the divertor detaches [73]. In the snowflake configuration,however, radiative, or detached operational densities extenddown to ∼2×10¹⁹ m−3, corresponding to ne/nGW ∼ 0.4. Thetotal heat fluxes are reduced by ∼70% at moderate densities(∼ 3.5 × 10¹⁹ m−3), where the peak heat flux is reduced by50% (middle panel). The bottom panel shows the peak heatflux as a function of % argon for the snowflake and standarddivertors. It is clear that less impurity seeding is needed in thesnowflake to attain lower heat fluxes.
3.3. Plasma–materials interaction
As lithium wall conditioning will be the preferred techniquein NSTX-U, with eventual plans to test liquid lithiummodules [74], studies have been conducted both in NSTX andin the laboratory to understand lithium–substrate interactionsand the effect on both the deposited Li as well as on thesubstrates. Experiments in NSTX simultaneously addressedlithium sputtering from graphite tiles as well as from bothheated and unheated liquid lithium divertor (LLD) modules,which had a molybdenum substrate [75]. Accumulation ofcarbon impurities was routinely observed in the core of ELM-free lithium-conditioned discharges in NSTX [76], but despite
0 200 400 600T (°C)
0.00
0.05
0.10
0.15
0.20
Lit
hiu
m S
pu
tt. Y
ield
(at
om
s/io
n)
graphiteunheated molybdenumheated molybdenum
#139598NSTX divertor
Figure 23. Lithium sputtering yield with unheated graphite andLLDs and heated LLDs.
even large Li deposition, Li concentrations in the plasma corewere less than 1% of that of carbon [77]. This differencewas partially explained by the difference in their core radialtransport [76].
The temperature dependence of lithium sputtering due toimpinging deuterium ions was studied both in situ and ona divertor test stand. The in situ measurements, shown infigure 23, were carried out only in a limited range of LLDtemperatures, from 100 to 300 ◦C (the melting point of lithiumis 180 ◦C). Li sputtering yields in atoms/incident D+ for thegraphite and unheated molybdenum surfaces (100–150 ◦C)were similar. With heating of the LLDs, and at temperaturesabove the Li melting temperature (250 to 300 ◦C), howevertemperature-enhanced sputtering of the surface lithium wasobserved.
In order to expand the range of substrate temperaturesbeing studied, and to mimic expected NSTX-U divertorconditions, test stand studies of lithium on these metalsubstrates were carried out on the MAGNUM-PSI lineardevice at DIFFER [78]. This supports the plan to installa row of TZM molybdenum tiles in the lower outboarddivertor after the first run year of NSTX-U [79]. MAGNUM-PSI is a magnetized linear device designed for simulatingdivertor conditions expected in ITER-class devices, and itcan also provide similar densities and temperatures as thosefound in NSTX. For NSTX-related experiments, a lithiumevaporator was installed on MAGNUM-PSI, lithium wasdeposited onto a molybdenum substrate material, and thenhigh-power D+ discharges were created. Surface temperaturesreached 1300 ◦C in these experiments. Results up to 700 ◦Cwill be shown. While high incident D+ fluxes onto thetarget resulted in Li sputtering yields that increased with Litemperature up to 400 ◦C but then levelled off, the yieldswere lower than those predicted by low incident D+ theoryby two orders of magnitude due to lithium deuteride (LiD)formation (figure 24). Also observed in these experiments wasthe formation of an intense cloud of lithium emission directly infront of the target, which persisted for 3–4 s. This long-lastingintense vapour cloud resulted in a reduction of current to the
12

Nucl. Fusion 55 (2015) 104002 S.M. Kaye et al
Figure 24. Lithium sputtering yields in the Magnum-PSI test standas a function of lithium temperature for lithium-coated molybdenumsubstrates in a D+ plasma. The blue curve and red region aremodelling results.
target, and this offers the possibility for continuous divertorheat flux mitigation. Studies in NSTX-U will be performed todetermine the maximum Li PFC temperature compatible withgood confinement and reduced divertor heat flux.
Recent surface science experiments conducted at thePrinceton Plasma Physics Laboratory have used x-rayphotoelectron spectroscopy and temperature programmeddesorption to understand the mechanisms for D retention in Licoatings on Mo substrates. The study shows that D is retainedas LiD in metallic Li films. However, when oxygen is presentin the film, either by diffusion from the subsurface at a hightemperature or as a contaminant during the deposition process,Li oxides are formed that retain D as LiOD. Experimentsindicate that LiD is more thermally stable than LiOD, whichdecomposes to liberate D2 gas and D2O at temperatures 100 Klower than the LiD decomposition temperature. This resultis consistent with the saturation of the Li emission yieldwith increasing temperature in the high D+ flux scenario onMAGNUM-PSI. Furthermore, it highlights the importance ofmaintaining a metallic Li layer as the increased power loadingexpected in NSTX-U will reach elevated PFC temperaturesduring the course of a high-power discharge.
3.4. Integrated performance (core/pedestal/divertor)
Another means to modify the plasma edge and offerthe potential for an operational regime of sustained highperformance is the enhanced pedestal H- (EP H-) mode regime[56, 80]. EP H regimes were accessed in lithiated NSTXplasmas by a transition from an H-mode, often, but not always,triggered by an ELM. Confinement enhancements (H98y,2) inthe EP H-mode can be up to 50% over and above the alreadyenhanced confinement in lithiated H-mode discharges. TheEP H-mode is characterized by a region in the plasma edgewith very sharp gradients in the ion temperature, typically afactor of three larger than those in the H-phase. There is alsoa localized region of large rotation shear in the vicinity of the
0.00.20.40.60.81.01.2
I P, P
inj/1
0 [M
A, M
W]
134991 141133
(a)
0.01.5
3.0
4.56.0
Dα [
Arb
.]
(b)
0100
200
300400
WT
OT [
kJ] (c)
0.02.5
5.0
7.510.0
den
sity
[10
13 c
m-3]
(d)
-10.0-7.5
-5.0
-2.50.0
I PF
-3U [
kA] (e)
-20-10
0
1020
od
d-n
MH
D [
G]
(f)
0.0 0.2 0.4 0.6 0.8 1.0 1.2 1.4time [s]
0.00.5
1.0
1.52.0
H98
(y,2
)
(g)
Figure 25. Time evolution of two long pulse EP H-modes.(Reproduced from [80] courtesy of IAEA.)
steep ion temperature gradient (ITG). No changes in low-kedge turbulence going from H to EP H, as measured by BES,were observed.
An example of the time evolution of two long-lived EPH-modes is shown in figure 25. Confinement enhancementfactors (H98y,2) of up to 1.7 were achieved in the shorter liveddischarge, and up to 1.25 in the longer lived one, which alsoexhibited a period of near steady state for ∼0.4 s. The quasi-stationary behaviour of the EP H-mode that was achievedsuggests its potential for utilization as a high-performanceregime on NSTX-U. However, it will be important to establisha reliable mechanism to trigger and control the transition tothis regime. A strong velocity shear of the plasma edge isassociated with the EPH-mode, and this may provide a clue asto the underlying physics causing the transition. Studies usingtriggered ELMs and specialized 3D edge MPs will be a focusof EP H-mode research on NSTX-U.
4. Explore unique ST parameter regimes to advancepredictive capability for ITER and beyond
NSTX/NSTX-U operation at high ρi/a (low BT), low ν∗e , high
beta (βn � 4) and low aspect ratio provides a unique parameterregime giving high leverage for validating existing theory aswell as for developing ST-specific frameworks. This will,in turn, lead to higher confidence predictions for devices atall aspect ratio, including ITER. This section will focus on
13

Nucl. Fusion 55 (2015) 104002 S.M. Kaye et al
φφ∼
Figure 26. Non-linear GTS result showing electric potentialperturbation for combined ITG/Kelvin–Helmholtz modes in anL-mode plasma. The abscissa major radius and the ordinate isvertical height (in m).
aspects of transport and stability that have provided the basisfor detailed comparisons to theory and theory development.
4.1. Thermal transport
The unique features of ST operation mentioned above resultsin a fusion plasma regime distinct from that of conventionalaspect ratio tokamaks. In particular, because of the strongtoroidal rotation, large ρi/a and strong toroidicity and shaping,it is crucial, while highly challenging, to use global gyrokineticsimulations to address turbulence and transport physics. Non-linear global gyrokinetic simulations of an NSTX L-modeplasma using the GTS [81] code have shown, for the firsttime, that a drift wave Kelvin–Helmholtz mode can bedestabilized by strong toroidal rotation shear. This shearflow mode is characterized by finite k‖ and broader kθ thanthe ITG mode, which is also found to be present in the L-mode. Figure 26 shows the perturbed electric potential forthe combined ITG and Kelvin–Helmholtz modes, which co-exist. The strong E × B shear can, at the same time, reducethe low-k fluctuations and associated transport linearly bychanging the unstable mode family members and structure,and non-linearly by modifying the fluctuation amplitudeand spectrum. However, even at the reduced level, theremaining low-k fluctuations, while contributing weakly tothe observed highly anomalous electron thermal transport,can produce a significant ion thermal transport relevant to theexperimental level in the outer core region. Figure 27 showsthe comparison of the experimentally inferred ion (left) andelectron (right) thermal diffusivities as computed in TRANSP,along with the turbulence-driven values predicted by GTS andthe neoclassical value determined in GTC-NEO [82]. For theions, the inferred and predicted profiles are within a factor oftwo in the outer core.
Representative H-mode discharges were studied in detailas a basis for a time-evolving prediction of the electron
02
4
6
8
10
12
χe,exp
χe,GTS
0.2 0.4 0.60.2 0.4 0.60
1
2
3
4
5
χi,nc
χ i,exp
χi,GTS
x=[Φ/Φa]1/2 x=[Φ/Φa]1/2
m2 /
s
m2 /
s
Ions Electrons
Figure 27. Comparison of experimental and GTS predicted thermaldiffusivity for ions (left panel) and electrons (right panel). Theexperimental values of χe and χi were computed in TRANSP ininterpretive mode, and the ion neoclassical value was computedusing GTC-NEO. The abscissa is x = [�/�a]1/2, where �/�a isthe toroidal flux normalized to the value at the boundary.
temperature profile using an appropriate reduced transportmodel. For a high collisionality discharge, the time evolutionof characteristic plasma variables such as βe, ν∗
e , the MHDα parameter and the gradient scale lengths of Te, Ti and ne
were examined as a prelude to performing linear gyrokineticcalculations using GYRO [83] to determine the fastest growingmicroinstability at various times and locations throughout thedischarge. The inferences from the parameter evolutions andthe linear stability calculations were consistent. Early in thedischarge, when βe and ν∗
e were relatively low, ballooningparity modes were dominant. As time progressed and bothβe and ν∗
e increased, microtearing became the dominant low-kθ mode, especially in the outer half of the plasma. There areinstances in time and radius where other modes, at higher kθ ,may be important for driving electron transport, in additionto the microtearing. Given these results, the Rebut–Lallia–Watkins (RLW) electron thermal diffusivity model, which isbased on microtearing-induced transport [84, 85], was used topredict the time-evolving electron temperature across most ofthe profile. The results indicate that RLW does a good job ofpredicting Te for times and locations where microtearing wasdetermined to be important, but not as well when microtearingwas predicted to be stable or subdominant [86].
Shown in figure 28 is a comparison of the linear growthrates (top panels) and predicted and measured Te profiles(bottom panels) at representative times for two discharges atlow and high collisionalities, respectively. In the top row,ρ = r/a, and the ρ values correspond to x values (bottom row)that are approximately 10% lower (e.g. ρ = 0.7 correspondsto x = 0.6). For the low ν∗
e ∼ 0.06 (left panels), the dominantmicroinstabilities have ballooning parity, and are identifiedas a hybrid TEM/KBM. For this discharge, the RLW modeldoes a poor job of predicting the Te profile. However, for thehigher ν∗
e ∼ 0.21 discharge (right panel), where microtearingis calculated to be dominant, RLW does an excellent job inmatching the Te profile in the region from x = 0.2 to 0.8.Here, x = √
�/�a , where �/�a is the local toroidal fluxnormalized to the boundary value. Inside of 0.2, an ad hoc χe
was used as a proxy for transport induced by GAE/CAE modesin the very core, and x = 0.8 was chosen as the boundary.Identifying the reduced model that is able to predict electrontemperatures in this unique ST parameter regime can lead tohigher confidence extrapolations to future STs, such as FNSFand NSTX-U, where microtearing may be unstable.
14

Nucl. Fusion 55 (2015) 104002 S.M. Kaye et al
0.4 0.5 0.6 0.70
0.2
0.4
0.6 (
c s/a)
low collisionality
ballooning(hybrid KBM)
E B
0.4 0.5 0.6 0.70
0.1
0.2
0.3
0.4
0.5
(c s/a
)
high collisionality
microtearing
E B
High H-Mode1209670.51 s
Measured
Predicted
0.0 0.2 0.4 0.6 0.8 1.0
x=( / a)1/2
0.4
0.0
Te
(keV
)
Ad-hoc e
20-30 m2/s(GAE proxy)
e (RLW)
0.8
Measured
Predicted (RLW)
0.0 0.2 0.4 0.6 0.8 1.0
x=( / a)1/2
1.0
0.5
0.0
Te
(keV
)
Low H-Mode1290410.45 s
Figure 28. Linear growth rates (top) and measured versus predicted Te using the RLW model (bottom) for a low (left) and high (right)collisionality H-mode discharge. In the top row, ρ = r/a, and the values correspond to x-values that are approximately 10% lower [86].(Copyright 2014, American Institute of Physics.)
Highly non-linear electron thermal transport was observedin a set of RF-heated L-mode plasmas. It was observed thatelectron-scale turbulence spectral power, as measured by ahigh-k collective microwave scattering system at r/a ∼ 0.6,was reduced significantly following the cessation of RFheating. The results clearly showed a time delay of about1–2 ms between the RF cessation and the drop of about a factorof seven in measured electron-scale turbulence, indicating acausal relation between the two. In addition, the drop inturbulence spectral power happened on a 0.5–1 ms time scale,which is too fast for the standard local transport paradigm toprovide a satisfying explanation. This is because that, while thedrop in turbulence was on a fast time scale, there was virtuallyno change in the local equilibrium quantities that would beexpected to drive the turbulence (e.g. a/LTe , a/LTi , a/Lne )on this time scale; the changes in these quantities occurredon confinement time scales (e.g. tens of milliseconds). Thepower balance analysis has shown about a factor of twodecrease in the electron thermal transport after the suddendrop in turbulence. Linear stability analysis has shown thatboth ion- and electron-scale microinstabilities are unstablein the high-k measurement region, and that, linearly, theprofiles are well above marginal stability. Two explanationsare being explored for this non-linear response through non-linear global gyrokinetic simulations. The first is one of high
profile stiffness, so that even nearly negligible changes indriving gradients can lead to large changes in turbulence andtransport. The second is on of flux-driven transport, whichwould inherently be a non-local phenomenon. A decrease inlocal heat flux, due to changes in some other region of theplasma, leads to a decrease in the turbulence responsible for thetransport. Recent non-linear gyrokinetic simulations supportthe non-local transport hypothesis.
First detailed measurements of changes of high-kturbulence across the L–H transition have also been madewith the microwave scattering system. While low-frequencyactivity was seen to be relatively benign after the L–Htransition, the Dα signal exhibited dithering for approximately12 ms after the transition. It was after this period of ditheringthat the edge transport barrier at r/a > 0.9, typical of the H-mode, was established. The high-k scattering system measuredturbulence at r/a = 0.7 to 0.8, and it showed a factor of sevensuppression of the turbulence amplitude after the transition,for k⊥ < 9 to 10, down to ∼2. The dithering of the Dα afterthe L–H transition was associated with dithering of the high-k turbulence, but with no set phase relation between the two.BES measurements of low-k turbulence at the same locationexhibited similar temporal intermittency as in the high-kmeasurement. Linear stability calculations indicated a drop inETG growth rates after the L–H transition, consistent with the
15

Nucl. Fusion 55 (2015) 104002 S.M. Kaye et al
Figure 29. Calculated fast ion transport probability distributionfunction for TAE avalanches.
drop in the measured high-k turbulence amplitude, althoughthe observed intermittence requires a non-linear process.
4.2. Momentum and impurity transport
Linear gyrokinetic analysis has been used to study the sourceof anomalous momentum and impurity transport in NSTX. InNSTX H-mode plasmas, perturbation experiments indicatedthe existence of a significant inward momentum pinch [47, 87].Gyrokinetic calculations for L-mode plasmas indicate that theinward momentum pinch is small and weakly dependent onmany parameters, except for aspect ratio, where the pinchbecomes much larger (inward) as R/a increases to over two.In H-mode plasmas, where either microtearing or KBMsdominate, simulations indicated only a small outward pinch,which is insensitive to parameter variations.
For impurity transport, the linear gyrokinetic calculationsindicate an inward carbon pinch when KBMs dominate,which is inconsistent with experimental observations [88].Consequently, local linear theory does not appear to explaineither the momentum or impurity transport in NSTX. Workis underway to investigate non-linear and non-local effects.Preliminary global, non-linear GTS calculations indicate thatthe low-k fluctuations in L-modes, which was discussed earlier,can produce significant toroidal momentum flux, including alarge anti-gradient residual stress due mainly to zonal flowshear induced k‖ spectrum asymmetry.
4.3. Fast ion transport
There has also been much progress in developing the predictivecapability to model the effects of some of the AE scenariosdiscussed in section 2.2 on the fast ion distribution. Thisdevelopment of reduced fast ion transport models is criticalto being able to develop precise discharge scenarios that allowfor achieving optimal heating and current drive. There are twomethods that are presently under development.
The first method uses a probability distribution functionthat produces changes in a particle’s phase space coordinates(energy and canonical toroidal momentum) through ‘kicks’due to a resonant interaction with a given set ofinstabilities [89]. In this reduced model, the transport
Figure 30. Calculated (red) and measured (black) neutron rateversus time (bottom panel). The calculated neutron rate is derivedfrom the kick model using the mode amplitudes shown in the toppanel.
probability function, p(�E, �Pζ/Pζ , E, µ) is computedfrom analytic theory as well as particle-following codes suchas ORBIT or SPIRAL (figure 29). The size of the phasespace kicks are taken to scale linearly with mode amplitude,which can be computed from an observable quantity such asthe neutron rate and the ideal mode structure as computedby NOVA [90]. This model can thus provide the detailedevolution of FNB (E, Pζ , µ) and hence accurate estimatesfor NB-driven current. The model has been implementedin the standalone NUBEAM code, and initial benchmarksindicate good agreement between the normalized calculatedand measured neutron rates in an NSTX discharge withbursting TAE activity (figure 30). This model is presentlybeing implemented in the full TRANSP code.
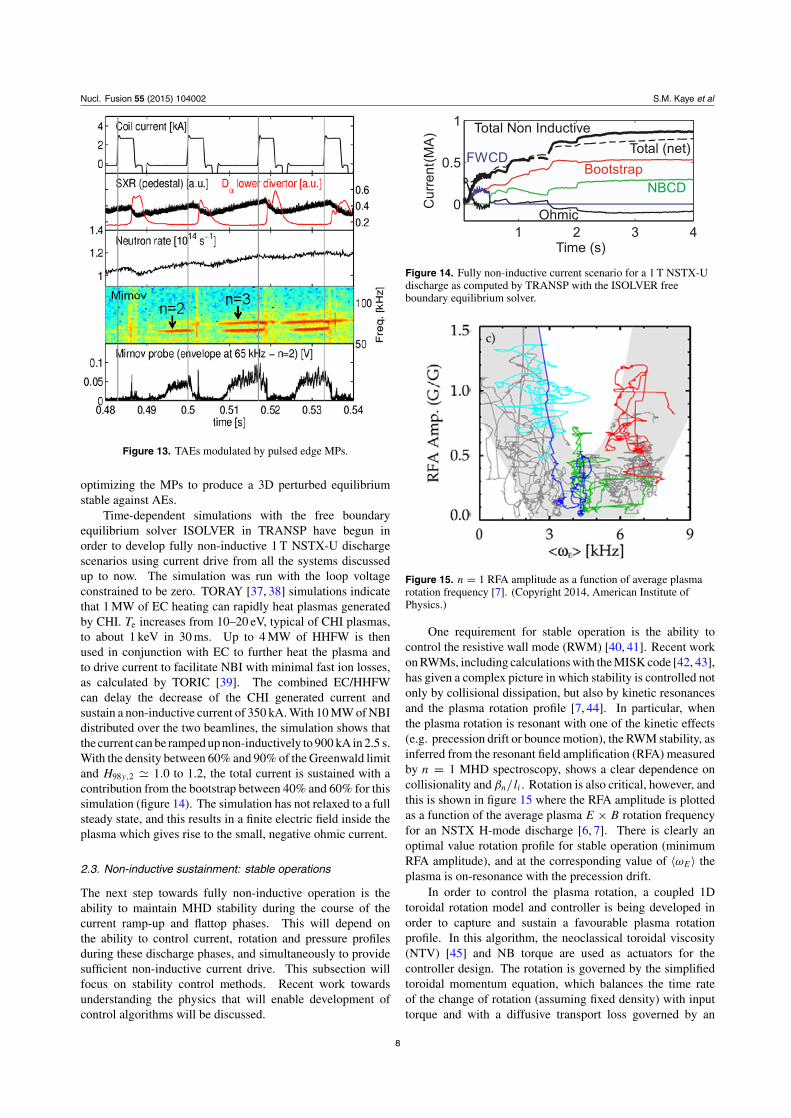
In parallel, a 1.5D quasi-linear (QL), critical gradientmodel (CGM) is being developed. This model is based oncomputing the critical fast ion profile gradient in the presenceof unstable AEs [91]. The model uses analytic growth anddamping rates for TAEs to compute a critical fast ion betaprofile under the assumption that the quasi-linear diffusionfrom overlapping resonances is applicable. The applicabilityof the CGM requires a large number of such modes with no orminor bursting/chirping at saturation. Similar conditions canbe envisioned for ITER-like burning plasmas in a variety ofplasma scenarios. In practice, the fast ion profile is computedin TRANSP, and if the calculated profile is larger than thecomputed critical value, the profile is relaxed through the 1.5D-QL model to the critical value. Comparing the relaxed profileto the initial one enables evaluation of fast ion losses and otherquantities. The CGM was validated against DIII-D data, andgood agreement was reported [92]. Initial benchmarking withNSTX data, comparing the experimental neutron reduction(1 − Smeasured
Sclassical), where Sclassical is computed in TRANSP, to that
predicted by the CGM for the observed modes, also showsgood agreement (figure 31).
16
Nucl. Fusion 55 (2015) 104002 S.M. Kaye et al
Figure 31. Experimental neutron reduction and that predicted by thecritical gradient model for an NSTX plasma.
4.4. Stability
Modes driven unstable above the pressure-driven, no wall kinklimit can constrain fusion performance. One much studiedmode, the RWM, has relatively slow growth rates (γ τwall ∼ 1),and, as previously discussed, can be stabilized by kineticeffects and passive and active feedback control. In plasmaswith stable RWM, an ideal wall mode (IWM) can be drivenunstable near the ideal wall limit. The IWM has much higherfrequencies and growth rates than the RWM. Recent MARS-Klinear calculations have shown that, similar to the RWM, bothrotation and kinetic effects can modify IWM stability limits.At low-β (βn < 3.5), the kinetic effects are minimal, withthe kinetic stability limit similar to the fluid limit, and bothare consistent with the experimental βn for n = 1 mode onsetwhen the experimental rotation is used. For βn ∼ 5, the kineticlimit is consistent with the experimental limit, while the fluidlimit leads to an underprediction of the β for mode onset. Asimilar conclusion holds for the highest β (βn ∼ 6 to 6.5).
5. Conclusions
NSTX results in the three overarching areas discussed in thispaper have set the stage for achieving the research goals ofthe NSTX-Upgrade device. These goals, once again, includeproducing stable, 100% non-inductive operation in high-performance plasmas, assessing plasma–material interfacesolutions to handle the high heat loads expected in the next-step devices and exploring the unique ST parameter regimes toadvance predictive capability. NSTX-Upgrade, with twice theplasma current and toroidal field of NSTX, with pulse lengthsup to 5 s, and with a second more tangentially aimed neutralbeam, will provide the capability for addressing these goalsand thus for developing the physics basis for an ST-basedFusion Nuclear Science Facility. Physics research operationsin NSTX-U will commence in mid-2015.
Acknowledgments
This work has been supported by the US Department of Energycontract DE-AC02-09CH11466.
References
[1] Menard J.E. et al 2012 Nucl. Fusion 52 083015[2] Abdou M.A. et al 1996 Fusion Technol. 29 1
[3] Menard J.E. et al 2011 Nucl. Fusion 51 103014[4] Gerhardt S.P. et al 2012 Nucl. Fusion 52 083020[5] Gerhardt S.P. et al 2013 Nucl. Fusion 53 043020[6] Sabbagh S.A. et al 2013 Nucl. Fusion 53 104007[7] Berkery J.W. et al 2014 Phys. Plasmas 21 056112[8] Morris A.W. et al 2014 IEEE Trans. Plasma Sci. 42 402[9] Raman R. et al 2011 Phys. Plasmas 18 092504
[10] Redd A.J. et al 2009 J. Fusion Energy 28 203[11] Jardin S.C., Pomphrey N. and Delucia J. 1986 J. Comput.
Phys. 66 481[12] Raman R. et al 2013 Nucl. Fusion 53 073017[13] Sovenic C.R. et al 2004 J. Comput. Phys. 195 355[14] Hooper E.B. et al 2013 Phys. Plasmas 20 092510[15] Ebrahimi F. et al 2013 Phys. Plasmas 20 090702[16] Taylor G. et al 2010 Phys. Plasmas 17 056114[17] Jaeger E.F. et al 2001 Phys. Plasmas 8 1573[18] Bertelli N. et al 2014 Nucl. Fusion 54 083004[19] Perkins R.J. et al 2013 Nucl. Fusion 53 083025[20] Kallman J. et al 2010 Rev. Sci. Instrum. 81 10E117[21] Perkins R.J. et al 2014 The contribution of RF rectification to
field-aligned losses of HHFW power to the divertor inNSTX Nucl. Fusion submitted
[22] Fredrickson E.D. et al 2013 Nucl. Fusion 53 013006[23] Fredrickson E.D. et al 2013 Phys. Plasmas 20 042112[24] Wang F. et al 2013 Phys. Plasmas 20 072506[25] Park W. et al 1999 Phys. Plasmas 6 1796[26] Wang F. et al 2013 Phys. Plasmas 20 102506[27] Belova E.V., Gorelenkov N.N. and Cheng C.Z. 2003 Phys.
Plasmas 10 3240[28] Fredrickson E.D. et al 2001 Phys. Rev. Lett. 87 145001[29] Crocker N.A. et al 2013 Nucl. Fusion 53 043017[30] Stutman D. et al 2009 Phys. Rev. Lett. 102 115002[31] Bortolon A. et al 2013 Phys. Rev. Lett. 110 265008[32] Kramer G.J. et al 2013 Plasma Phys. Control. Fusion
55 025053[33] Ferraro N.M. and Jardin S.C. 2009 J. Comput. Phys.
228 7742[34] Hawryluk R.J. 1980 An empirical approach to tokamak
transport Physics of Plasmas Close to ThermonuclearConditions: Proc. Course (Varenna, Italy, 1979)vol 1, p 19
[35] Hirshman S.P. and Whitson J.C. 1983 Phys. Fluids 26 3553[36] Spong D.A. et al 2001 Nucl. Fusion 41 711[37] Kritz A.H. et al 1982 Ray tracing study of electron-cyclotron
heating in toroidal geometry Proc. 3rd JointVarenna–Grenoble Int. Symp. on Heating in ToroidalPlasmas(Grenoble, France, 1982) vol 2, p 707www.iaea.org/inis/collection/NCLCollectionStore/ Public/14/770/14770102.pdf
[38] Lin-Liu Y.R., Chan V.S. and Prater R. 2003 Phys. Plasmas10 4064
[39] Brambilla M. 1999 Plasma Phys. Control. Fusion 41 1[40] Kaye S.M. et al 1988 Nucl. Fusion 28 1963[41] Bondeson A. and Ward D. 1994 Phys. Rev. Lett. 72 2709[42] Hu B. and Betti R. 2004 Phys. Rev. Lett. 93 105002[43] Berkery J.W. et al 2014 Phys. Plasmas 21 052505[44] Berkery J.W. et al 2010 Phys. Plasmas 17 082504[45] Shaing K.C. and Callen J.D. 1983 Phys. Fluids 26 3315[46] Pankin A. et al 2004 Comput. Phys. Commun. 159 157[47] Solomon W. et al 2009 Phys. Rev. Lett. 101 065004[48] Zhu W. et al 2006 Phys. Rev. Lett. 96 225002[49] Kim K. et al 2014 Nucl. Fusion 54 073014[50] Park J.-K., Boozer A.H. and Glasser A.H. 2011 Phys. Plasmas
14 052110[51] Sun Y. et al 2011 Nucl. Fusion 51 053015[52] Raman R. et al 2014 Rev. Sci. Instrum. 85 11E801[53] Stotler D.P. and Karney C.F.F. 1994 Contrib. Plasma Phys.
34 392[54] Mansfield D. et al 2009 J. Nucl. Mater. 390–391 764[55] Maingi R. et al 2009 Phys. Rev. Lett. 103 075001[56] Maingi R. et al 2010 Phys. Rev. Lett. 105 135004[57] Boyle D.P. et al 2011 Plasma Phys. Control. Fusion 53 105011
17

Nucl. Fusion 55 (2015) 104002 S.M. Kaye et al
[58] Boyle D.P. et al 2013 J. Nucl. Mater. 438 S979[59] Canik J.M. et al 2013 Nucl. Fusion 53 113016[60] Jenko F. et al 2000 Phys. Plasmas 7 1904[61] Diallo A. et al 2013 Nucl. Fusion 53 093026[62] Zweben S.W. et al 2014 Plasma Phys. Control. Fusion
56 095010[63] Zweben S.W. et al 2004 Nucl. Fusion 44 134[64] Myra J.R., Davis W.M. and D’Ippolito D.A. 2013 Nucl.
Fusion 53 073013[65] Gray T.K. et al 2014 Nucl. Fusion 54 043013[66] Eich T. et al 2013 J. Nucl. Mater. 438 S72[67] Eich T. et al 2011 J. Nucl. Mater. 415 S856[68] Devaux S. et al 2011 J. Nucl. Mater. 415 S865[69] Ahn J.-W. et al 2014 Nucl. Fusion 54 122004[70] Rognlien T.D. et al 1992 J. Nucl. Mater. 196 347[71] Rognlien T.D. and Rensink M.E. 2002 Fusion Eng. Des.
60 497[72] Ryutov D.D. 2007 Phys. Plasmas 14 064502[73] Meier E.T. et al 2014 Modeling divertor concepts for
spherical tokamaks NSTX-U and ST-FNSF Nucl. Fusionsubmitted
[74] Jaworski M.A. et al 2013 Plasma Phys. Control. Fusion55 124040
[75] Kugel H.W. et al 2010 Fusion Eng. Des. 85 865[76] Scotti F. et al 2014 J. Nucl. Mater. 439 1[77] Podesta M.A. et al 2012 Nucl. Fusion 52 037001
[78] DeTEMMERMAN C.G. et al 2012 J. Vac. Sci. Technol. A30 041306
[79] Kaita R. et al 2014 Addressing the challenges ofplasma–surface interactions in NSTX-U IEEE Trans.Plasma Sci. submitted
[80] Gerhardt S.P. et al 2014 Nucl. Fusion 54 083021[81] Wang W. et al 2010 Phys. Plasmas 17 072511[82] Wang W. et al 2004 Comput. Phys. Commun. 164 178[83] Candy J. and Waltz R. 2003 J. Comput. Phys. 186 545[84] Rebut P.H. and Brusati M. 1986 Plasma Phys. Control. Fusion
28 113[85] Rebut P.H., Lallia P.P. and Watkins M.L. 1988 The critical
temperature gradient model of plasma transport:applications for JET and future tokamaks Proc. 12th IAEAConf. on Plasma Physics and Controlled Nuclear FusionResearch (Nice, France, 1988) Paper D-4-1 www.iaea.org/inis/collection/NCLCollectionStore/ Public/21/008/21008733.pdf#page=209
[86] Kaye S.M. et al 2014 Phys. Plasmas 21 082510[87] Kaye S.M. et al 2009 Nucl. Fusion 49 045010[88] Scotti F. et al 2013 Nucl. Fusion 53 083001[89] Podesta M., Gorelenkova M. and White R. 2014 Plasma Phys.
Control. Fusion 56 055003[90] Cheng C.Z. and Chance M. 1987 J. Comput. Phys. 71 124[91] Ghantous K. et al 2012 Phys. Plasmas 19 092511[92] Heidbrink W.W. et al 2013 Nucl. Fusion 53 093006
18