Embed Size (px)
Citation preview
.'
United State.Department ofAgriculture
StatisticalReportingServtce
StatisticalR.searchDivision
Washington, D.C.
November 1985
.An Overview of the1985 Corn, Cotton,Soybean, and WheatObjective YieldSurveys.
_ Ralph V. Matthews
ABSTRACT
AN OVERVIEW OF THE 1985 CORN, COTTON, SOYBEAN, ANDWHEAT OBJECTIVE YIELD SURVEYS. By Ralph V. Matthews;Statistical Research Division; Statistical Reporting Service; U.S.Department of Agriculture; Washington, D.C. 20250; November 1985.
The Statistical Reporting Service (SRS), U.S. Department ofAgriculture (USDA), conducts sample surveys to forecast crop yieldsduring the growing season and to estima te yields after harvest. In theobjective yield (OY) surveys, enumerators count and measure plants intwo randomly loea ted plots in randomly selected farmer's fields in themajor producing states. Enumerator training is conducted so thatprocedures are followed uniformly in all states. Counts andmeasurements are chosen to be simple, objective, and repeatable. Plotloea tion methods, plot sizes, and observed variables are presented forcorn, cotton, soybean, and wheat. Yield forecasts are produced withcurrent-year data as the inputs to regression models constructed withdata from previous years. Net yield estimates equal the material handharvested from the plots at maturity minus the material gleaned fromadditional plots after the farmer's harvest. The gleaning is done toestima te harvesting loss•.
********************************************************* ** This paper was prepared for limited distribution to the research ** community outside the U.S. Department of Agriculture. The views ** expressed herein are not necessarily those of SRS or USDA. ** *********************************************************
ACKNOWLEDGMENTS Bob Battaglia, Doug Bond, Ron Fecso, Mike House, and Fred Warrenmade helpful suggestions. Bessie C. Johnson typed the drafts and finalversion of the paper.
Washington, D.C.
- 1 -
November 1985
CONTENTS
SUMMAR Y
INTRODUCTION
OBJECTIVE YIELD SURVEYSData Collection ProceduresForecasting and Estimating Procedures
CornCottonSoybeanWheat
CONCLUSION
REFERENCES
APPENDIX 1Maturi ty stage descriptions for the 1985corn, soybean, and wheat OY surveys.
APPENDIX 2Sample unit condition codes for the 1985corn OY survey.
APPENDIX 3Data collection phase, site, and portionof the sample units observed for the variablesin the 1985 corn, cotton, soybean, andwhea t OY surveys.
APPENDIX 4Forecasting variables of the 1985 wheat OY survey.
- ii -
Page
iii
1
1166778
8
9
10
15
20
25
SUMMARY This report contains concise descriptions of the 1985 corn, cotton,soybean, and wheat objective yield (OY) surveys. The paper describesthe data collection procedures including:
(1) The number of sample fields per state;
(2) Sample unit location procedures;
(3) Sample unit size and shape descriptions.
Three appendixes contain maturity stage descriptions, sample unitcondition descriptions, and the timing and site details of the forecastingand estimating variables.
The report describes briefly the forecasting and estimating proceduresfor each crop. This publication serves as an introduction to the OYsurveys and includes references to the Agency manuals which describethe procedures in detail.
-iii-

INTRODUCTION
OBJECTIVE YIELDSURVEYS
Data CollectionProcedures
AN OVERVIEW OF THE 1985 CORN, COTTON, SOYBEAN, ANDWHEAT OBJECTIVE YIELD SURVEYS
By Ralph V. Matthe wsll
The Statistical Reporting Service (SRS) collects sample survey data andpublishes official U.S. Department of Agriculture (USDA) statistics oncrops, livestock, prices, and farm labor. Producers receive thesestatistics directly or through the farm media. Farm organizations,trade associations, agribusinesses, and commodity brokers are otherdata users. Crop statistics include planting intentions, acres harvested,production, and stock~ "Scope and Methods of the StatisticalReporting Service" [3] -' describes the Agency's organization andprocedures.
Forty-four field offices serve the 50 states and produce stateestimates. Information is gathered through mail surveys, telephone andpersonal interviews, and field observations [2]. Crop productionstatistics rely on all three modes of data collection. Questionnaires aremailed to farmers to obtain expected yield and crop conditions in theirlocality. Personal interviews are conducted during the JuneEnumerative Survey (JES) [7] and the December Enumerative Survey(DES) [4]. These are surveys in which the sampling units are areas ofland selected from an area frame. After crop acreages are known fromthe JES (or the DES for winter wheat), a sample of fields is selected formaking field observations for the objective yield (OY) surveys.
SRS collects data on crop acreage and yield in the OY surveys. Thesurveys began in 1961 for cotton and corn; crops added since then werewinter, spring, and durum wheat, 1962; soybean, 1967; potato, 1971;rice, sorghum, and sunflower, 1984 [3]. The yield information is
1/ The author is a survey statistician with the Statistical ReportingService, U.S. Department of Agriculture.1./ Numbers in brackets refer to literature cited at the end of thisreport.
- 1 -
"objective," because enumerators count and measure the growing cropsto collect the data. Acreages are not determined by field measurementbut by personal interviews of farmers while examining aerialphotographs and thus are not totally "objective." Farmers also reportyields in the sample fields during postharvest interviews to provide anaddi tional yield indica tor.
In the OY surveys, trained enumerators randomly locate two small plotsin randomly selected farmer's fields in major producing states.Observations of crop development are made at monthly intervals duringthe growing season to forecast yield. The observed variables used toforecast yield change as the plants progress through the reproductivegrowth stage and then mature. The plots are harvested by hand atmaturi ty to estimate gross yield. After the farmer harvests the field,new plots are located to measure harvest loss, and net yield isestima ted.
In the 1985 winter wheat survey, the field work to collect data on cropdevelopment began on April 22. A national forecast was issued on May10 which reflected the conditions of the crop as of May 1. For corn,cotton, and soybean, the field work began on July 22 for an August 12forecast reflecting conditions as of August 1.
The number of sample fields for each crop is shown by state in table 1.The total sample is distributed among the states to achieve a desiredlevel of precision in each state. Although the number of sample fieldsis large, the total plot area of any crop is very small. For exam pIe,1,920 sampIe soybean fields with two sampIe units per field plantedwith 30-inch rows equal a total plot area of 1.54 acres.
Manuals of survey procedures [5,6] and data collection forms areproduced at the Washington, D.C. headquarters to help insureconsistency in all the states. A field office statistician coordinates anOY crop survey in each state. These statisticians attend a nationaltraining school to obtain training in survey procedures or to learn of anychanges in the program. Each statistician then transmits theinforma tion to the field supervisors and enumerators in a state trainingschool, so tha t procedures are as consistent as possible in all states.The state training schools cover all aspects of data collection includingactual field practice. Generally, the enumerators have agriculturalbackgrounds and live in the areas they serve.
- 2-
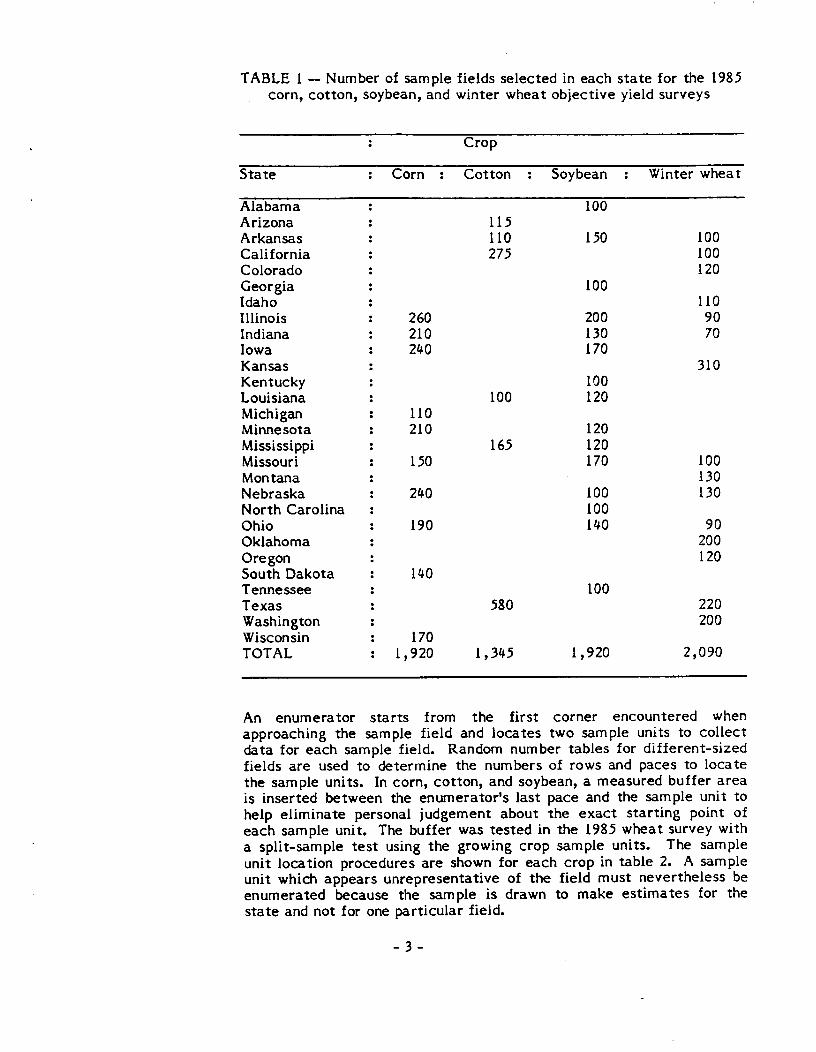
TABLE 1 - Number of sample fields selected in each state for the 1985corn, cotton, soybean, and winter wheat objective yield surveys
Crop
State Corn Cotton Soybean Winter wheat
Alabama 100Arizona 115Arkansas 110 150 100California 275 100Colorado 120Georgia 100Idaho 110Illinois 260 200 90Indiana 210 130 70Iowa 240 170Kansas 310Kentucky 100Louisiana 100 120Michigan 110Minnesota 210 120Mississippi 165 120Missouri 150 170 100Montana 130Nebraska 240 100 130North Carolina 100Ohio 190 140 90Oklahoma 200Oregon 120South Dakota 140Tennessee 100Texas 580 220Washington 200Wisconsin 170TOTAL 1,920 1,345 1,920 2,090
An enumerator starts from the first corner encountered whenapproaching the sampIe field and locates two sam pIe units to collectdata for each sample field. Random number tables for different-sizedfields are used to determine the numbers of rows and paces to locatethe sample units. In corn, cotton, and soybean, a measured buffer areais inserted between the enumerator's last pace and the sample unit tohelp eliminate personal judgement about the exact starting point ofeach sample unit. The buffer was tested in the 1985 wheat survey witha split-sample test using the growing crop sample units. The sampleunit location procedures are shown for each crop in table 2. A sampleunit which appears unrepresentative of the field must nevertheless beenumerated because the sample is drawn to make estimates for thestate and not for one particular field.
- 3 -
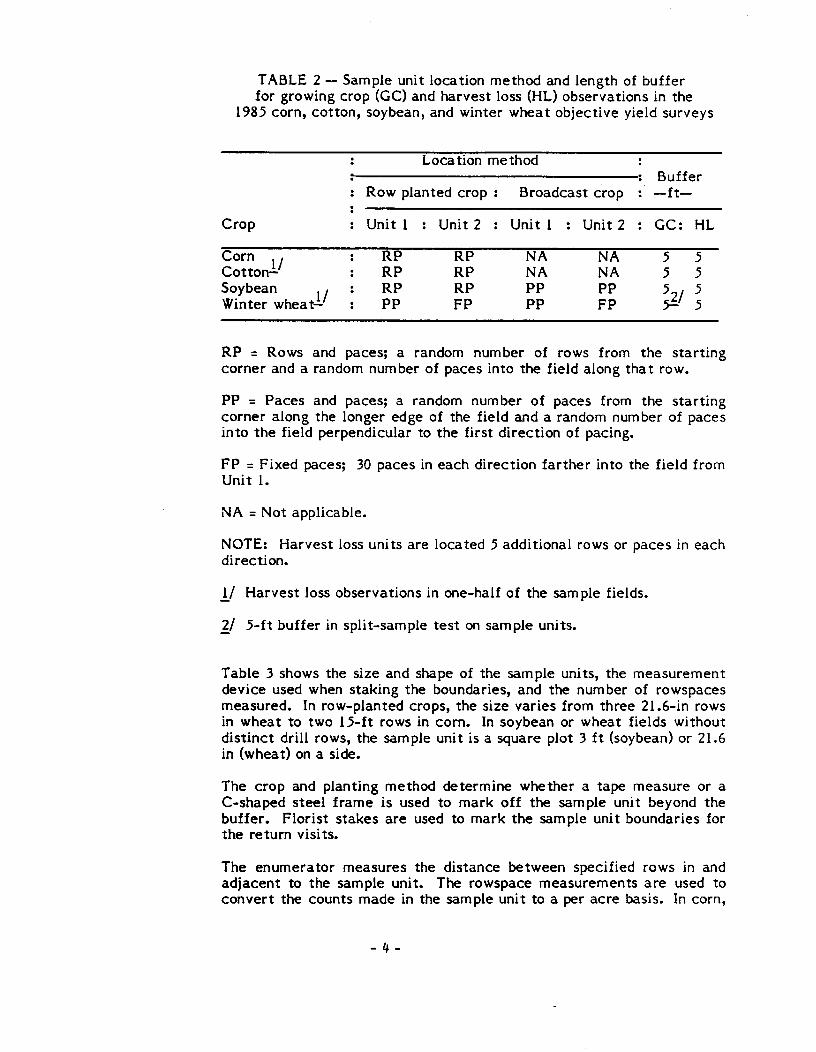
TABLE 2 - Sample unit location method and length of bufferfor growing crop (GC) and harvest loss (HL) observations in the
1985 corn, cotton, soybean, and winter wheat objective yield surveys
RP = Rows and paces; a random number of rows from the startingcorner and a random number of paces into the field along that row.
PP = Paces and paces; a random number of paces from the startingcorner along the longer edge of the field and a random number of pacesinto the field perpendicular to the first direction of pacing.
FP = Fixed paces; 30 paces in each direction farther into the field fromUnit 1.
NA = Not applicable.
NOTE: Harvest loss units are located 5 additional rows or paces in eachdirection.
!/ Harvest loss observations in one-half of the sample fields.
y 5-ft buffer in split-sample test on sample units.
Table 3 shows the size and shape of the sample units, the measurementdevice used when staking the boundaries, and the number of rowspacesmeasured. In row-planted crops, the size varies from three 21.6-in rowsin wheat to two 15-ft rows in corn. In soybean or wheat fields withoutdistinct drill rows, the sample unit is a square plot 3 ft (soybean) or 21.6in (wheat) on a side.
The crop and planting method determine whether a tape measure or aC-shaped steel frame is used to mark off the sam pIe unit beyond thebuffer. Florist stakes are used to mark the sample unit boundaries forthe return visits.
The enumerator measures the distance between specified rows in andadjacent to the sample unit. The rowspace measurements are used toconvert the counts made in the sample unit to a per acre basis. In corn,
- 4-

cotton, and soybean, one and four row spaces are measured. The 4-rowto I-row ratio is an edit check on the accuracy of the 4-rowmeasurement. The 1985 wheat survey was a transition year for rowspace measurement. Five row spaces were measured prior to 1985.Four and five row spaces were measured in 1985, and it is expected thatfour row spaces will be measured in 1986. Measuring one and four rowspaces in 1986 would allow the edit check used currently in the othercrops.
TABLE 3 - Size of growing crop (GC) and harvest loss (HL) sam pIeunits, device used to locate sample unit boundaries, and number of
rowspaces measured for per-acre conversions in the 1985 corn, cotton,soybean, and winter wheat objective yield surveys.
1/ Harvest loss observations in one-half of the sample fields.
1/ 3 ft X 0.5 ft area also observed.
An enumerator determines the maturity stage of corn, soybean, andwheat; the stage indicates which data to collect during each visit to thesample field. The maturity stage of cotton is not determined in the
- 5-
Forecasting andEstimating Procedures
Corn
field but by a computer edit of the data. Appendix 1 contains thematurity stage descriptions for corn, soybeans, and wheat from theenumerator's manuals [5,6] •
Variables called condition codes are collected to quantify the physicalconditions causing sample units to differ within a sample field. Theyare used for edit checks in the state office. The condition codevariables for corn are in appendix 2; similar variables exist for soybeanand whea t.
Three distinct phases of determining the yield are 1) forecasting theyield before the hand harvest at maturity; 2) estimating the yield afterthe hand harvest; 3) estimating the harvest loss after the farmer'sharvest [1]. In addition to counts or weights taken in the field, plantmaterial may be collected and mailed to a designated state office forfurther counting, threshing, or weighing under laboratory conditions.For estimating harvest loss, no counts are made in the field, and all theplant material collected is mailed to a state office.
Observations are made either within the boundaries of the sample unitor on pre-defined plants outside the sample unit. For most data items,both sample units in a sample field are enumerated, but in some casesonly one sample unit is surveyed. All or part of one or more of the rowsin the sample unit is counted or clipped. Appendix 3 contains the datacollection site for each variable. Forecasts and estimates are madewith the variables in appendix 3. Early-season measurements and finalharvest data from previous years are used to construct regressionmodels to forecast yield per acre.
In corn, the number of ears, grain weight per ear, and harvest loss arethe three components used to forecast or estimate net yield. To makea state forecast, five years of previous data are used to constructregression models. Two models are used to forecast number of earsthrough the milk stage. In one model, the number of stalks is theindependent variable. In the other model, the number of stalks, thenumber of stalks with ears or silked ear shoots, and the number of earsand silked ear shoots are the independent variables. From the doughstage through maturity, the actual number of ears with kernelformation is counted, and regression models are not used.
Prior to any kernel development, the average grain weight per ear fromfive previous years in the state is used in forecasting. Between thetime kernels develop and the hand harvest occurs, regression models areconstructed using five years of previous data; current ear lengthmeasurements are used to forecast grain weight per ear. After thehand harvest at maturity, the average grain weight per ear for eachsample field is known from the laboratory data, and an estimate ismade.
- 6-
Cotton
Soybean
When net yield forecasts are made prior to harvest, the harvest loss isestimated by using the 5-year state average. After the farmer'sharvest, harvest loss is estima ted by gleaning the sam pIe field plots.
The three components of cotton yield are number of large bolls (burrs,open bolls, partially open bolls, and large unopen bolls), average bollweight, and harvest loss. Maturity stages are not determined by anenumerator, but maturity categories are assigned in a computer edit ofthe data using the presence of fruiting structures and the ratio betweenthe number of large bolls and the number of plants.
Five years of previous data are used to construct two models for eachmaturity category and state. One model is a survival model, and theother is a regression model. The survival model is based on survival tomaturity of tagged fruiting structures in a 3-ft section of row adjacentto one sample unit in each field. The regression model uses the fruitingstructure counts from both sample units and the 3-ft sections of rowadjacent to each one.
A yield forecast uses the 5-year average boll weight until 20 percent ofthe forecasted number of large bolls are weighed. Between the timetha t 20 and 85 percent are weighed, a regression equation is used topredict average boll weight. After 85 percent are weighed, the actualaverage boll weight enters the forecasts.
The 5-year average harvest loss is used as the yield forecast componentuntil the farmer harvest. The harvest loss estimate from the subsam pIeof fields is then used as an adjustment in estimating net yield.
Number of plants, number of pods with beans per plant, weight of beansper pod with beans, and harvest loss are the four components used toforecast or estimate soybean net yield. The variables used forforecasting and estimating number of plants and number of pods withbeans per plant depend on the maturity stage and whether the soybeanvariety is determinate or indeterminate.
Maturity stages 1 and 2 (in appendix 1) are divided into eight maturitycategories for forecasting. The eight maturity categories are definedby the presence or absence of pods with beans and by two differentratios. If no pods with beans are present, the ratio is between thenumber of blooms, dry flowers, and pods and the number of main stemnodes. When pods with beans are present, the ratio is between thenumber of pods with beans and the number of blooms, dry flowers, andpods. Five years of previous data are used to construct regressionmodels to forecast number of plants and number of pods with beans perplant.
The forecasting components for weight of beans per pod with beans andfor harvest loss are the 5-year state averages for each variable. Foryield estimates, the current-year weight of beans per pod with beansreplaces the 5-year average when the lab data are available. The 5-year average for harvest loss is replaced by current data after thesample fields are checked for harvest loss.
- 7-
Wheat
CONCL USION
Wheat has three components in its forecasts or estimates: number ofheads, weight of grain per head, and harvest loss. The regressionmodels for predicting number of heads use only the number of stalksprior to head development. If present, heads are counted both beforeand during the hand harvest.
The weight of grain per head is represented by the 5-year state averageprior to kernel development. After kernel development begins, theindependent variables for two different regression models change in thefollowing order as development progresses: fertile spikelets per head,grains per head, and unthreshed weight per head. Appendix table 5contains the forecasting variables for each maturity stage. After thehand harvest, an estimate is made using actual threshed grain weightper head.
The harvest loss component is predicted by the 5-year average until thefarmer harvest and by the current estimate after the data is collectedfrom the subsam pIe of sam pIe fields.
This overview of the 1985 corn, cotton, soybean, and wheat OY surveysshowed how the data are collected in the field and which variables areused to forecast and estimate yields. Readers who want moreinformation on a specific crop should consult the Agency manuals listedin the reference section.
- 8 -
REFERENCES 1. Huddleston, Harold F. Sampiing Techniques for Measuring andForecasting Crop Yields. U.S. Dept. of Agriculture, Economics,Statistics, and Cooperatives Service, ESCS No. 09. Aug. 1978.
2. Statistical Reporting Service. Preparing Crop and LivestockEstimates. U.S. Dept. of Agriculture, Statistical ReportingService. Revised Sept. 1981.
3. Statistical Reporting Service. Scope and Methods of the StatisticalReporting Service. U.S. Dept. of Agriculture, StatisticalReporting Service, Misc. Publ. No. 1308. Revised Sept. 1983.
4. Statistical Reporting Service. Interviewer's Manual, 1984December Enumerative and Multiple Frame Surveys. U.S. Dept.of Agriculture, Statistical Reporting Service. Dec. 1984.
5. Statistical Reporting Service.Objective Yield Survey. U.S.Reporting Service. Feb. 1985.
Enumerator's Manual, 1985 WheatDept. of Agriculture, Statistical
6. Sta tistical Reporting Service. Enumerator's Manual, 1985 Corn,Cotton, and Soybean Objective Yield Survey. U.S. Dept. ofAgriculture, Statistical Reporting Service. May 1985.
7. Statistical Reporting Service. Interviewer's Manual, 1985 JuneEnumerative and Multiple Frame Surveys. U.S. Dept. ofAgriculture, Statistical Reporting Service. June 1985.
- 9-
APPENDIX 1 Maturity stage descriptions for the 1985 corn, soybean, and wheatobjective yield surveys.
-10-
Code 2 - Pre-blister
Code 3 - Blister
Code 4 - Milk
Code 5 - Dough
Code 6 - Dent
Code 7- Mature
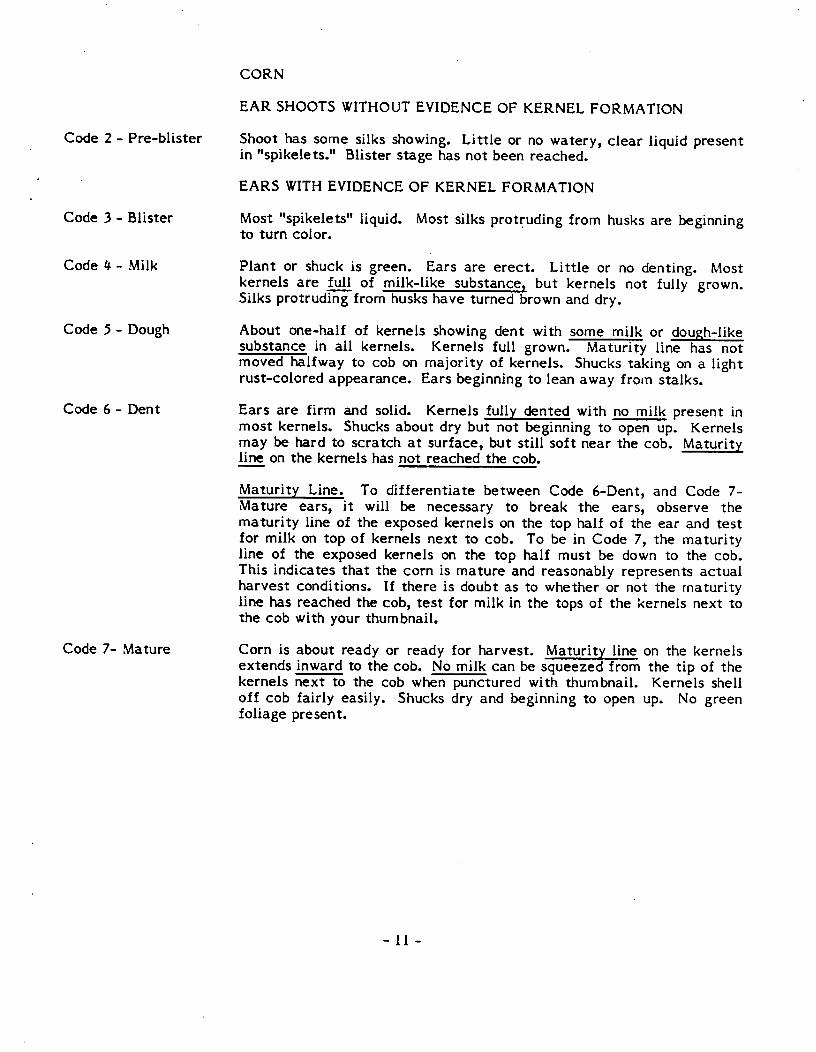
CORN
EAR SHOOTS WITHOUT EVIDENCE OF KERNEL FORMATION
Shoot has some silks showing. Little or no watery, clear liquid presentin "spikelets." Blister stage has not been reached.
EARS WITH EVIDENCE OF KERNEL FORMATION
Most "spikelets" liquid. Most silks prot~uding from husks are beginningto turn color.
Plant or shuck is green. Ears are erect. Little or no denting. Mostkernels are full of milk-like substance, but kernels not fully grown.Silks protruding from husks ha ve turned brown and dry.
About one-half of kernels showing dent with some milk or dough-likesubstance in all kernels. Kernels full grown. Maturity line has notmoved halfway to cob on majority of kernels. Shucks taking on a lightrust-colored appearance. Ears beginning to lean away from stalks.
Ears are firm and solid. Kernels fully dented with no milk present inmost kernels. Shucks about dry but not beginning to open up. Kernelsmay be hard to scratch at surface, but still soft near the cob. Maturityline on the kernels has not reached the cob.
Maturity Line. To differentiate between Code 6-Dent, and Code 7-Mature ears, it will be necessary to break the ears, observe thematurity line of the exposed kernels on the top half of the ear and testfor milk on top of kernels next to cob. To be in Code 7, the ma turi tyline of the exposed kernels on the top half must be down to the cob.This indicates that the corn is mature and reasonably represents actualharvest condi tions. If there is doubt as to whe ther or not the rna turi tyline has reached the cob, test for milk in the tops of the kernels next tothe cob with your thumbnail.
Corn is about ready or ready for harvest. Maturity line on the kernelsextends inward to the cob. No milk can be squeezed from the tip of thekernels next to the cob when punctured with thumbnail. Kernels shelloff cob fairly easily. Shucks dry and beginning to open up. No greenfoliage present.
- 11 -
Code 1 - Pods StillForming or Earlier
Code 2 - Pods Set,Leaves Still Green
Code 3 - Pods Filled,Lea ves Turning Yellow
Code 4 - Pods TurningColor, Lea ves Shedding
Code 5 - Pods Brown,AImost Mature
Code 6 - Mature
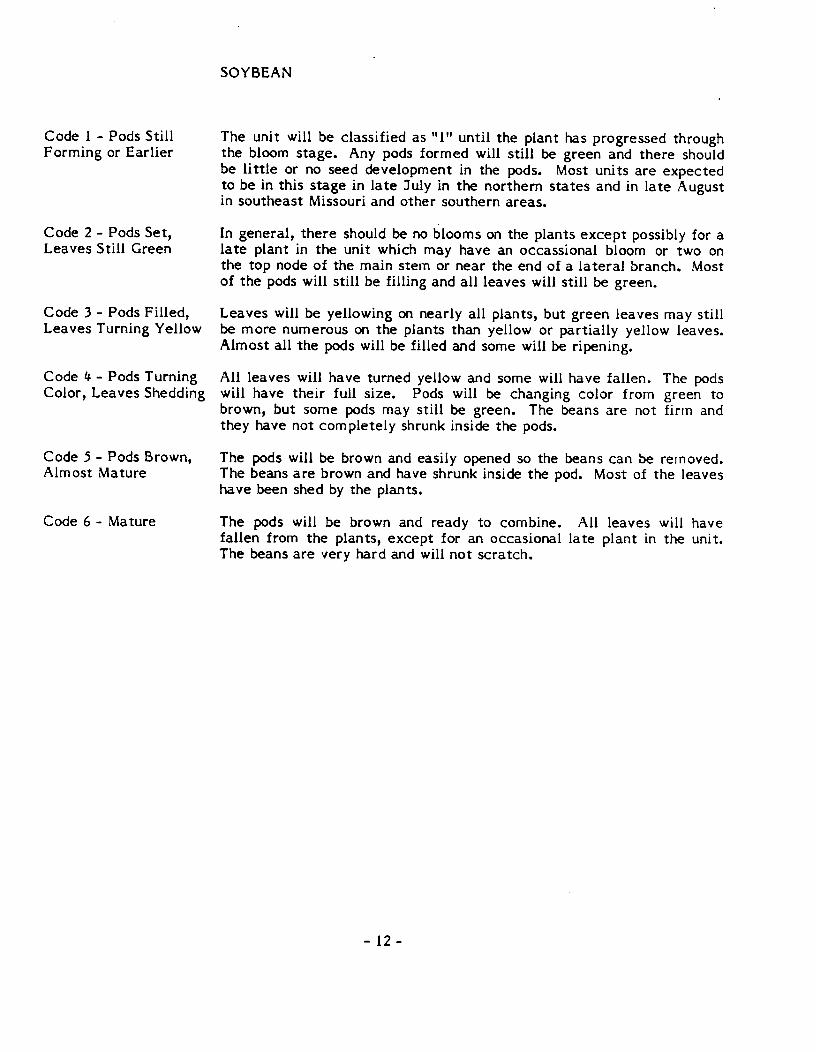
SOYBEAN
The unit will be classified as "1" until the plant has progressed throughthe bloom stage. Any pods formed will still be green and there shouldbe little or no seed development in the pods. Most units are expectedto be in this stage in late July in the northern states and in late Augustin southeast Missouri and other southern areas.
In general, there should be no blooms on the plants except possibly for alate plant in the unit which may have an occassional bloom or two onthe top node of the main stem or near the end of a lateral branch. Mostof the pods will still be filling and all leaves will still be green.
Leaves will be yellowing on nearly all plants, but green leaves may stillbe more numerous on the plants than yellow or partially yellow leaves.Almost all the pods will be filled and some will be ripening.
All leaves will have turned yellow and some will have fallen. The podswill have their full size. Pods will be changing color from green tobrown, but some pods may still be green. The beans are not firm andthey have not completely shrunk inside the pods.
The pods will be brown and easily opened so the beans can be removed.The beans are brown and have shrunk inside the pod. Most of the leaveshave been shed by the plants.
The pods will be brown and ready to combine. All leaves will havefallen from the plants, except for an occasional late plant in the unit.The beans are very hard and will not scratch.
- 12 -
Code 1 - Pre-F lag
Code 2 - Flag orEarly Boot
Code 3 - Late Boot orFlower (Head Emerged)Includes Watery Kernels
Code 4 - Milk
Code 5 - Soft Dough
Code 6 - Hard Dough
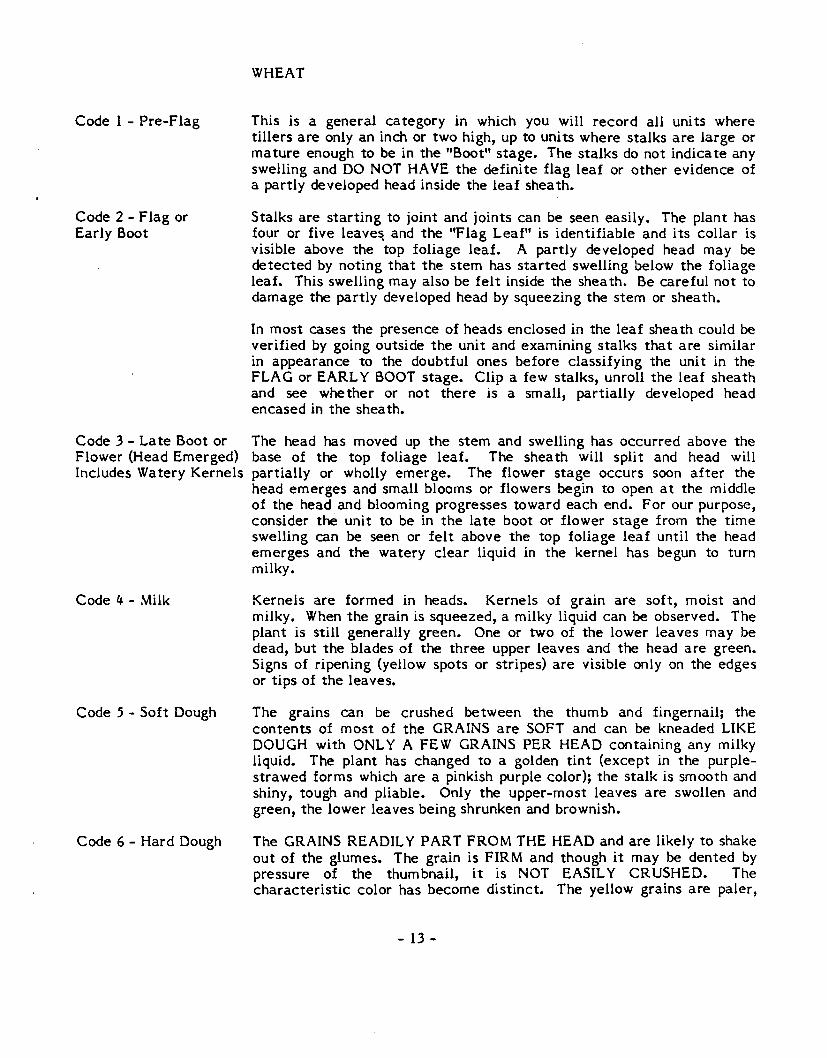
WHEAT
This is a general category in which you will record all units wheretillers are only an inch or two high, up to units where stalks are large ormature enough to be in the "Boot" stage. The stalks do not indica te anyswelling and DO NOT HAVE the definite flag leaf or other evidence ofa partly developed head inside the leaf sheath.
Stalks are starting to joint and joints can be seen easily. The plant hasfour or five leave~ and the "Flag Leaf" is identifiable and its collar isvisible above the top foliage leaf. A partly developed head may bedetected by noting that the stem has started swelling below the foliageleaf. This swelling may also be felt inside the sheath. Be careful not todamage the partly developed head by squeezing the stem or sheath.
In most cases the presence of heads enclosed in the leaf shea th could beverified by going outside the unit and examining stalks that are similarin appearance to the doubtful ones before classifying the unit in theFLAG or EARLY BOOT stage. Clip a few stalks, unroll the leaf sheathand see whether or not there is a small, partially developed headencased in the sheath.
The head has moved up the stem and swelling has occurred above thebase of the top foliage leaf. The sheath will split and head willpartially or wholly emerge. The flower stage occurs soon after thehead emerges and small blooms or flowers begin to open at the middleof the head and blooming progresses toward each end. For our purpose,consider the unit to be in the late boot or flower stage from the timeswelling can be seen or felt above the top foliage leaf until the heademerges and the watery clear liquid in the kernel has begun to turnmilky.
Kernels are formed in heads. Kernels of grain are soft, moist andmilky. When the grain is squeezed, a milky liquid can be observed. Theplant is still generally green. One or two of the lower leaves may bedead, but the blades of the three upper leaves and the head are green.Signs of ripening (yellow spots or stripes) are visible only on the edgesor tips of the leaves.
The grains can be crushed between the thum b and fingernail; thecontents of most of the GRAINS are SOFT and can be kneaded LIKEDOUGH with ONLY A FE W GRAINS PER HEAD containing any milkyliquid. The plant has changed to a golden tint (except in the purple-strawed forms which are a pinkish purple color); the stalk is smooth andshiny, tough and pliable. Only the upper-most leaves are swollen andgreen, the lower leaves being shrunken and brownish.
The GRAINS READILY PART FROM THE HEAD and are likely to shakeout of the glumes. The grain is FIRM and though it may be dented bypressure of the thumbnail, it is NOT EASILY CRUSHED. Thecharacteristic color has become distinct. The yellow grains are paler,
- 13 -
Code 7 - Ripe
the red grains somewhat darker and flinty or mealy in character. Theleaves are dry and shrunken. Wheat in this category may be swathed insome areas.
Straw is dull and brittle at this stage; the GRAIN is HARD and BREAKSIN FRAGMENTS when crushed. Harvest may be expected at this time.
- 14 -
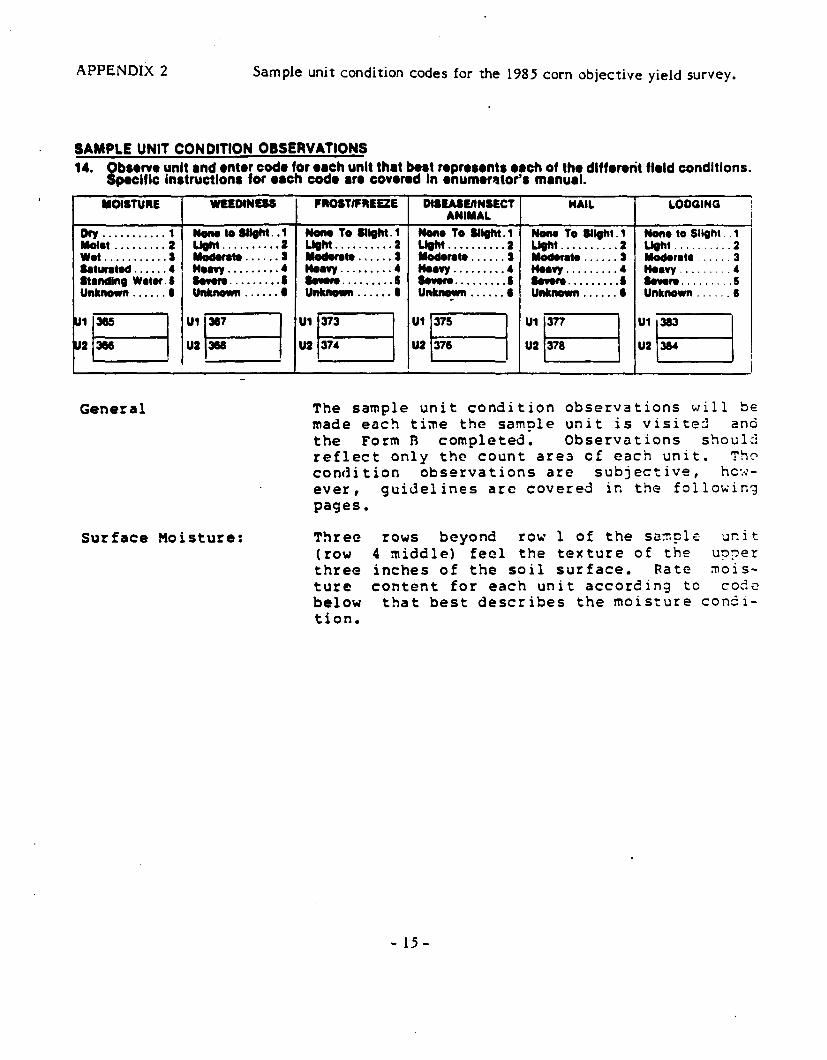
APPENDIX 2 Sample unit condition codes for the 1985 corn objective yield survey.
SAMPLE UNIT CONDITION OBSERVATIONS14. Obs.rv. unit and .nt.r cod. for .ach unit that best r.pr.s.nts .ach of the dlffarent fl.ld conditions.
Specific Instructions for aach cod. ar. cov.red In enumer'1tor's manual.
MOISTURE WEEDINESS ,ROSTIFREEZE DIlEASEIINSECT HAIL LODGING iANIMAL I
Dry ........... 1 NoM 10Slight .• 1 •••••• To 111ght. 1 •••••• To 1I1tht. 1 NoM To IIlthl. 1 None 10 SlIlht .. 1"".1 ......... Z LIght .......... ! LIght .....•.... ! LIght .......... ! Ught .......... z Llght .......... 2•• t .. ·......... 3 ...., •••...... I 1IocIorI ••...... 1 1IodonI ••...... I •••••••••...... 3 •••• ,.t •...... 3"tinted ......• H• .., .........• •••• vy ....•....• He.., ......... 4 He.vy ......... 4 H•• vy .........••I •• ndlnl W.ter. 5 ~ .......•.• •••••• •• • •• •• •• • •...~ .........• •••••••.. ....... 1 •••• 1'1I......... 5Unknown ......• U,*nown ......• Unlmowft ......• UMnown ....•.• Unknown ......• Unknown ...... 1
"B V'R ~aV'a V'a V'B~z _ UZ 3U UZ 37•• UZ 376 UZ 378 U2 ~I, I
General The sample unit condition observations will bemade euch time the sample unit is visitej anathe Form R completed. Observutions shouljreflect only th~ count area of each unit. Th0condition observations are subjective, hc~-ever, guidelines arc covered in the follo~ingpages.
Surface Moisture: Three(rowthreeturebelowtion.
rows beyond ro~ 1 of the sa~pl€ ur.it4 :nidd1e) feel the tex ture 0 f th~ un?erinches of the soil surface. Rate mois-content for each unit accorcin9 to code
that best describes the moisture con=i-
- 15-

CODE CONDITION-1 Dry
2 Mo i s t
3 \-Ie t
4 Saturated
DESCRIPTIONSoil contains little mOlS-ture, can be broken wit~so~e difficulty betweenthu~b and forefin~er, breaksinto po~der or individualgrains.Soil contain some moisture,crushes easily under gentlepressure between thumb ar.~forefinger anc can be ~ushedtogether into a lump.Soil contains consioer~blemoisture, reudily dc:for~e':by moderate pressure and canbe pushed into a lu~p, willfor~ a wire between thu~~and forefinger, tends tostretch rather than pullfree fro~ other particles.Soil has water drippinss,forms mud, does not forT alum? when pressed, will notform a wire when rolled be-tween thumb and forefingGr.
5
6
Standingt-l ute rUnknown
- 16 -
Water stunding on surface ofsoil.Not Observed.
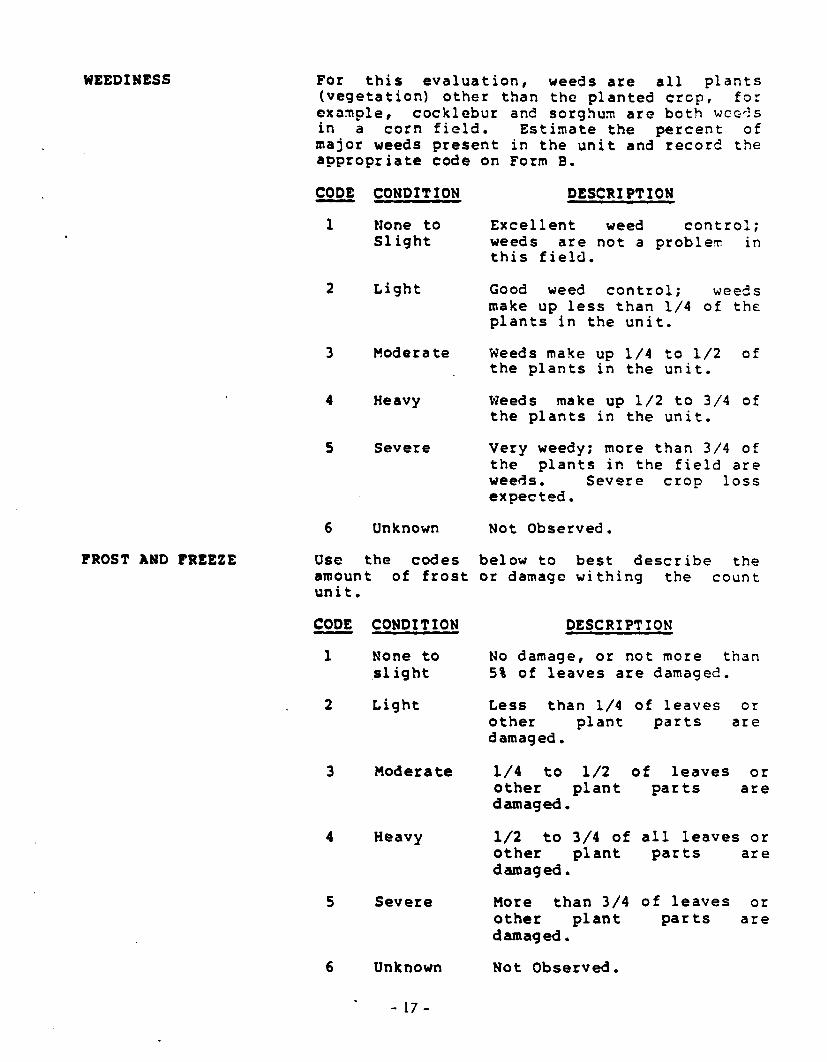
WEEDINESS For this evaluation, weeds are all plants(vegetation) other than the planted crop, forexa~ple, cocklebur ana sorghu~ are both wc~~sin a corn field. Estimate the percent ofmajor weeds present in the unit and recore theappropriate code on Form B.CODE CONDITION- -----
1 ttone toSlight
2 Light
DESCRIPTIONExcellent weed control;weeds are not a proble~ inthis field.Good weed control; weecsmake up less than 1/4 of theplants in the unit.
3
4
5
6
Moderate
Heavy
Severe
Unknown
Weeds make up 1/4 to 1/2 ofthe plants in the unit.Weeds make up 1/2 to 3/4 ofthe plants in the unit.Very weedy; more than 3/4 ofthe plants in the field areweeds. Severe crop lossexpected.Not Observed.
PROST AND FREEZE Use the codes below to best describe theamount of frost or damage withing the countunit.CODE CONDITION- -----
1 None to,51 ight
DESCRIPTIONNo damage, or not more than5\ of leaves are damagea.
2 Light Less than 1/4 of leaves orother plant parts aredamaged.
1/4 to 1/2other plantdamaged.1/2 to 3/4 of all leaves orother plant parts aredamaged.
3
4
Moderate
Heavy
of leavespa r t s
orare
5
6
Severe
Unknown
- 17 -
More than 3/4 of leaves orother plant parts aredamaged.Not Observed.
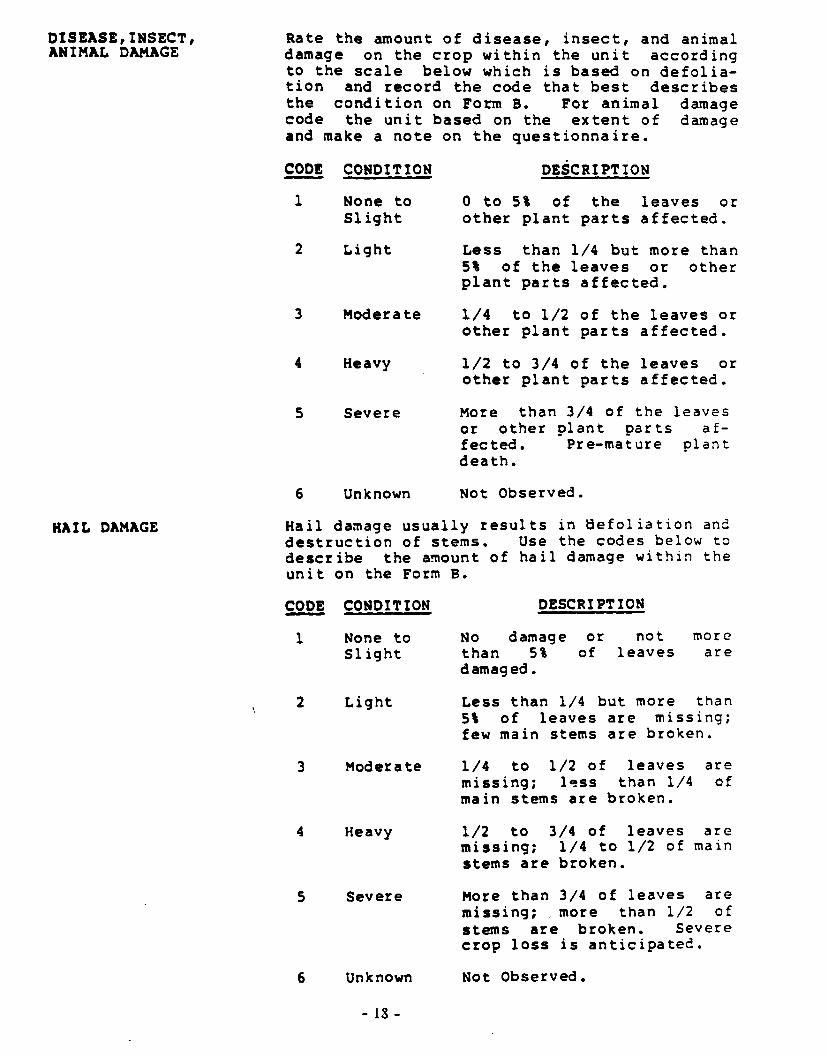
DISEASE, INSECT,ANIMAL DAMAGE Rate the amount of disease, insect, and animal
damage on the crop within the unit accordingto the scale below which is based on defolia-tion and record the code that best describesthe condition on Form B. For animal damagecode the unit based on the extent of damageand make a note on the questionnaire.CODE CONDITION- -----
1 None toSlight
2 Light
3 Moderate
4 Heavy
5 Severe
6 Unknown
DESCRIPTIONo to 5\ of the leaves orother plant parts affected.Less than 1/4 but more than5\ of the leaves or otherplant parts affected.1/4 to 1/2 of the leaves orother plant parts affected.1/2 to 3/4 of the leaves orother plant parts affected.More than 3/4 of the leavesor other plant parts af-fected. Pre-mature plantdeath.Not Observed.
HAIL DAMAGE Hail damage usually results in tlefoliation ancdestruction of stems. Use the codes below todescribe the amount of hail damage within theunit on the Form B.CODE CONDITION DESCRIPTION-1 None to No damage or not more
Slight than 5\ of leaves aredamaged.
2 Light Less than 1/4 but more than5\ of leaves are missing;few main stems are broken.
3 Modera te 1/4 to 1/2 of leaves aremissing; l4!!sS than 1/4 ofmain stems are broken.
4 Heavy 1/2 to 3/4 of leaves aremissing; 1/4 to 1/2 of mainstems are broken.
5 Severe More than 3/4 of leaves aremissing; .more than 1/2 ofstems are broken. Severecrop loss is anticipated.
6 Unknown Not Observed.
- 18 -
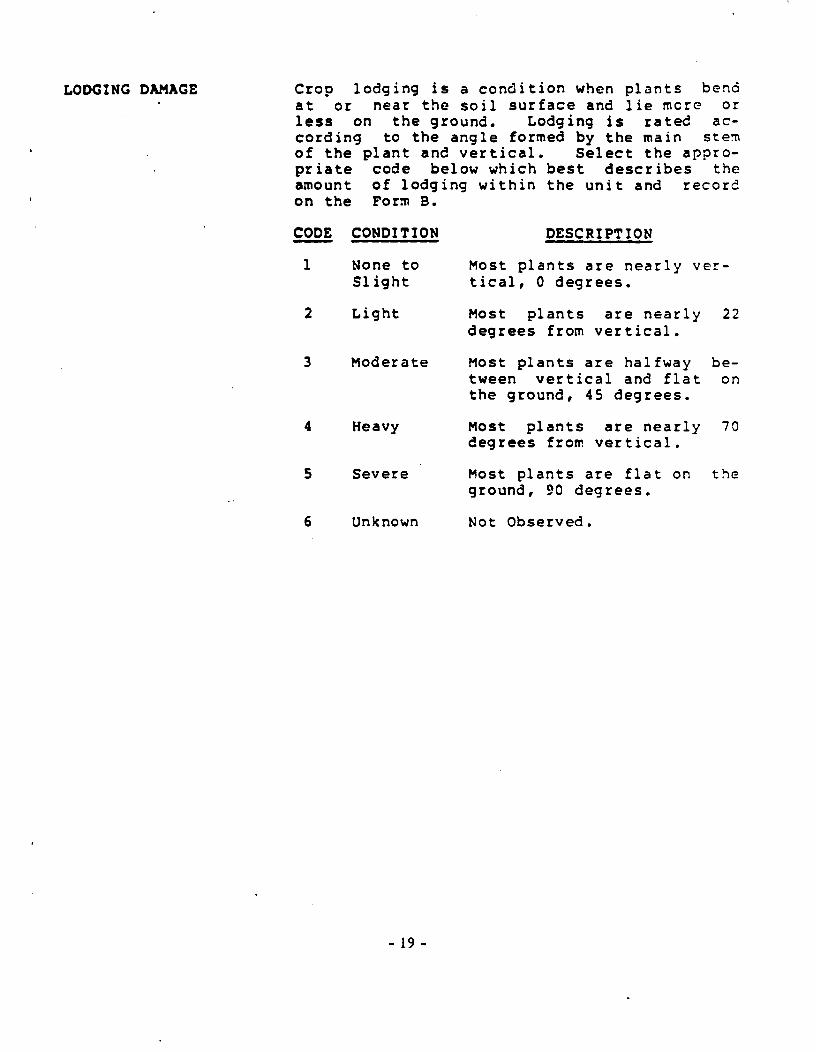
LODGING DAMAGE Crop lodging is a condition when plants bendat or near the soil surface and lie mere orless on the ground. Lodging is ratec ac-cording to the angle formed by the main ste~of the plant and vertical. Select the appro-priate code below which best describes theamount of lodging within the unit and recorcon the Form B.CODE CONDITION-
1 None toSlight
DESCRIPTIONMost plants are nearly ver-tical, 0 degrees.
2
3
4
5
6
Light
Moderate
Heavy
Severe
Unknown
- 19 -
Most plants are nearly 22degrees from vertical.Most plants are halfway be-tween vertical and flat onthe ground, 45 degrees.Most plants are nearly 70degrees from vertical.Most plants are flat on theground, 90 degrees.Not Observed.
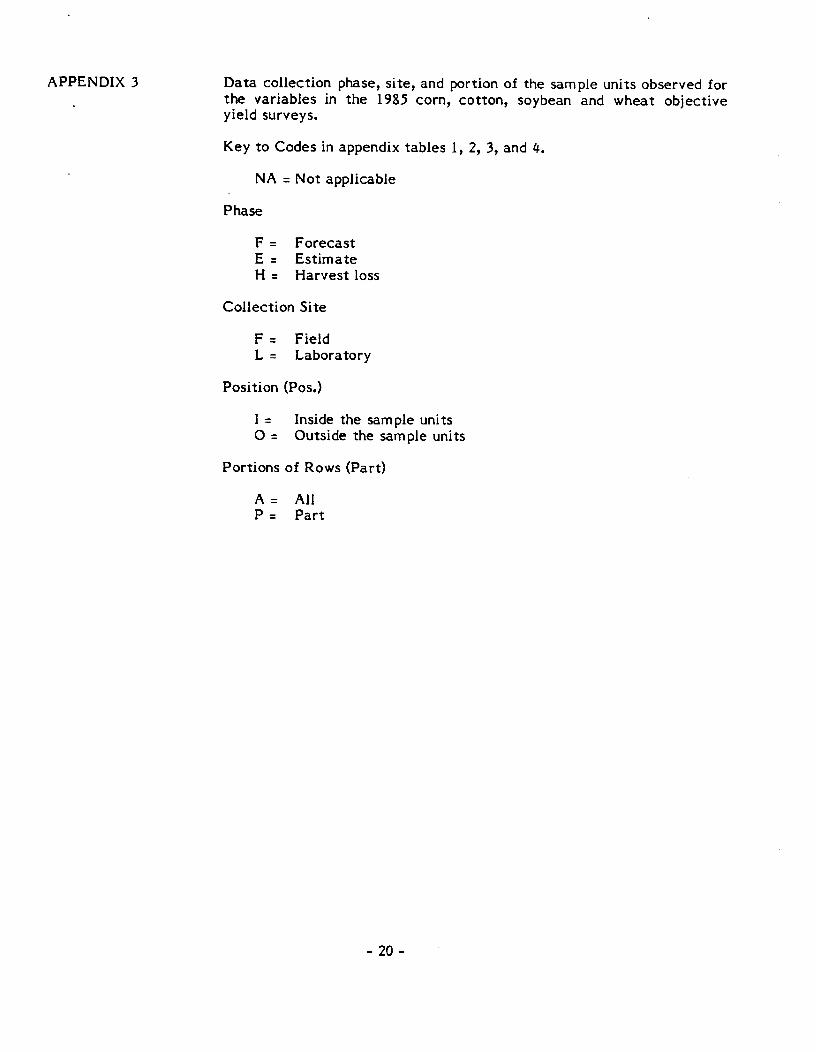
APPENDIX 3 Data collection phase, site, and portion of the sample units observed forthe variables in the 1985 corn, cotton, soybean and wheat objectiveyield surveys.
Key to Codes in appendix tables 1, 2, 3, and 4.
NA = Not applicable
Phase
F = ForecastE = EstimateH = Harvest loss
Collection Site
F = FieldL = Laboratory
Position (Pos.)
I = Inside the sampIe unitso = Outside the sampIe units
Portions of Rows (Part)
A = AllP = Part
- 20-
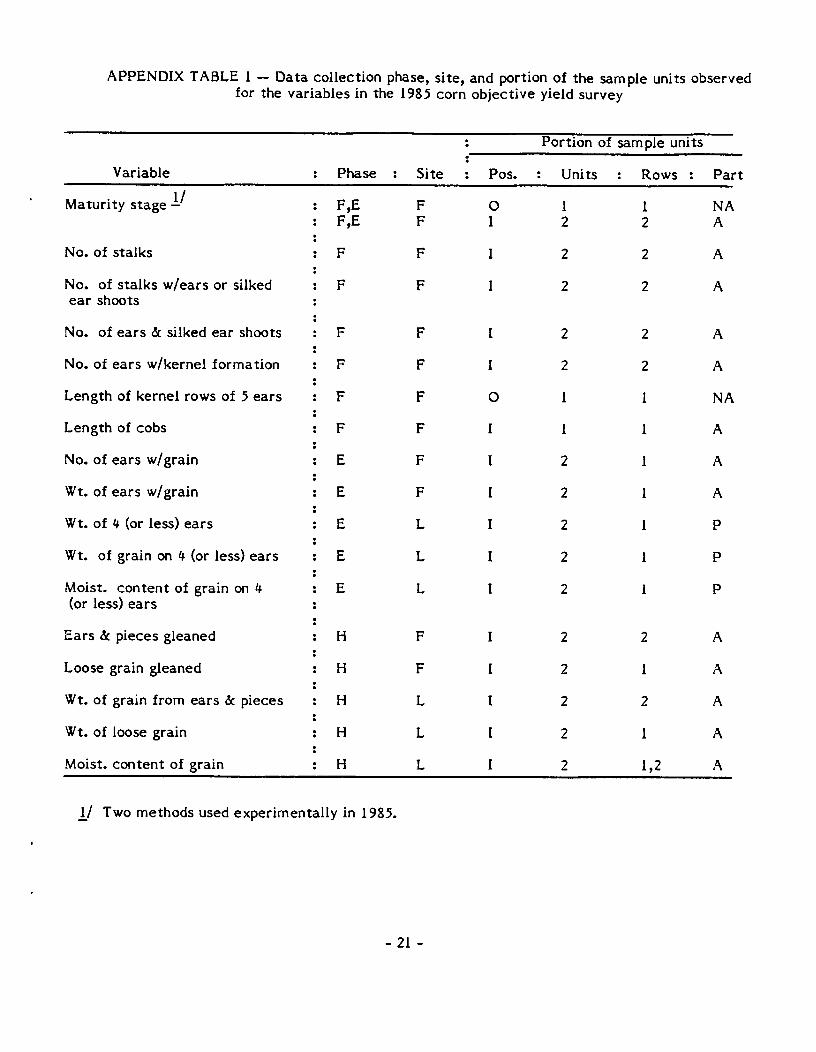
APPENDIX TABLE 1 - Data collection phase, site, and portion of the sam pIe units observedfor the variables in the 1985 corn objective yield survey
Portion of sam pIe uni ts
Variable Phase Site Pos. Uni ts Rows Part
Maturi ty stage 1/ F,E F 0 1 1 NAF,E F I 2 2 A
No. of stalks F F I 2 2 A
No. of stalks w/ears or silked F F I 2 2 Aear shoots
No. of ears &: silked ear shoots F F I 2 2 A
No. of ears w/kernel formation F F I 2 2 A
Length of kernel rows of 5 ears F F 0 1 1 NA
Length of cobs F F I 1 1 A
No. of ears w/grain E F I 2 1 A
Wt. of ears w/grain E F I 2 1 A
Wt. of 4 (or less) ears E L I 2 1 P
Wt. of grain on 4 (or less) ears E L I 2 1 P
Moist. content of grain on 4 E L I 2 1 P(or less) ears
Ears &: pieces gleaned H F 2 2 A
Loose grain gleaned H F I 2 1 A
Wt. of grain from ears &: pieces H L I 2 2 A
Wt. of loose grain H L I 2 1 A
Moist. content of grain H L I 2 1,2 A
1/ Two methods used experimentally in 1985.
- 21 -

APPENDIX TABLE 2 - Data collection phase, site, and portion of the sample unitsobserved for the variables in the 1985 cotton objective yield survey
Portion of sam pIe uni ts
Variable Phase Site POSe Uni ts Rows PartNo. of plants F F I 2 2 A
No. of burrs F,E F I 2 2 A
1st 10 (or less) open bolls F,E F 2 2 P
Wt. of seed cotton from 1st F F I 2 2 P10 (or less) open bolls
No. of remaining open bolls F,E F 2 2 P
Wt. of seed cotton from remainig F F 2 2 Popen bolls
No. of partially open bolls F,E F 2 2 Awlcotton visible
No. of large unopen bolls F,E F 2 2 A(at least I-in diameter)
No. of plants F F 0 2 1 NA
No. of burrs, open bolls, F,E F 0 2 1 NAde partially open bolls
No. of large unopen bolls F,E F 0 2 1 NA
No. of small bolls de blooms F F 0 2 1 NA
No. of squares F F 0 2 I NA
'Nt. of oven-dried seed cotton from: F,E L 2 2 P1st 10 (or less) open bolls
Large unopen bolls de partially H F III 2 2 Aopen bolls gleaned
Seed cotton on plants gleaned H F 2 2 A
Seed cotton on soil gleaned H F 2 2 A
Wt. of oven-dried seed cotton H L 2 2 Aon plan ts
Wt. of oven-dried seed cotton H L 2 2 Aon soil
11 In growing crop or harvest loss sample unit.
- 22 -
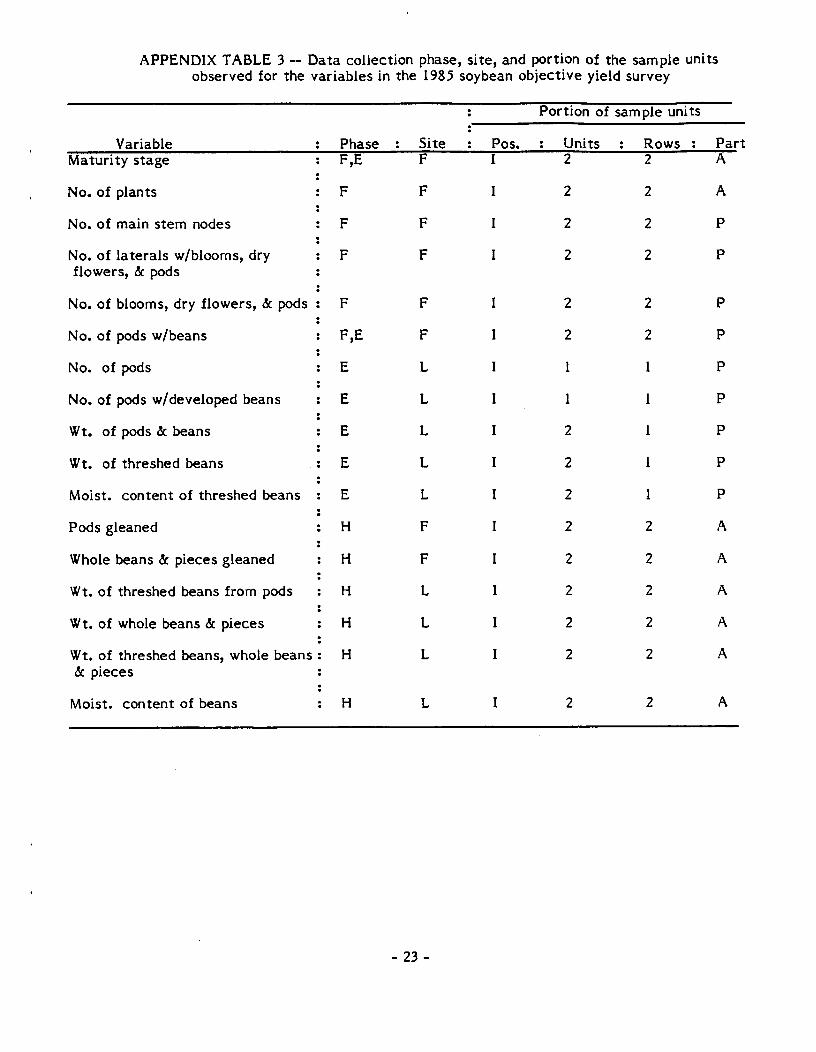
APPENDIX TABLE 3 - Data collection phase, site, and portion of the sam pIe unitsobserved for the variables in the 1985 soybean objective yield survey
Portion of sam pIe uni ts
Variable Phase Site Pos. Units Rows PartMaturity stage F,E F I 2 2 A
No. of plants F F I 2 2 A
No. of main stem nodes F F I 2 2 P
No. of laterals w/blooms, dry F F 2 2 Pflowers, & pods
No. of blooms, dry flowers, & pods F F I 2 2 P
No. of pods w/beans F,E F I 2 2 P
No. of pods E L I 1 1 P
No. of pods w/developed beans E L 1 1 P
Wt. of pods & beans E L I 2 1 P
Wt. of threshed beans E L I 2 1 P
Moist. content of threshed beans E L I 2 1 P
Pods gleaned H F I 2 2 A
Whole beans & pieces gleaned H F I 2 2 A
Wt. of threshed beans from pods H L I 2 2 A
Wt. of whole beans & pieces H L 2 2 A
Wt. of threshed beans, whole beans: H L I 2 2 A& pieces
Moist. content of beans H L I 2 2 A
- 23 -
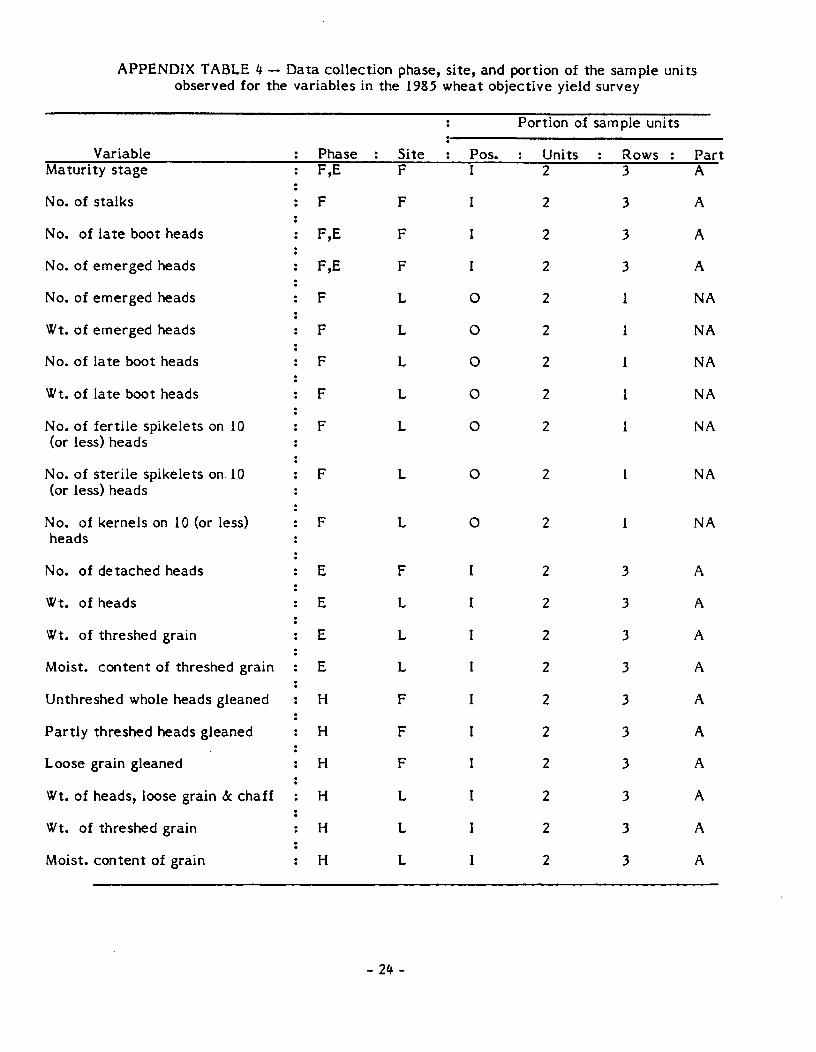
APPENDIX TABLE 4 -- Data collection phase, site, and portion of the sample unitsobserved for the variables in the 1985 wheat objective yield survey
Portion of sam pIe uni ts
Variable Phase Site POSe Units Rows PartMaturity stage F,E F I 2 3 A
No. of stalks F F I 2 3 A
No. of late boot heads F,E F 2 3 A
No. of emerged heads F,E F 2 3 A
No. of emerged heads F L 0 2 1 NA
Wt. of emerged heads F L 0 2 1 NA
No. of late boot heads F L 0 2 1 NA
Wt. of late boot heads F L 0 2 1 NA
No. of fertile spikelets on 10 F L 0 2 1 NA(or less) heads
No. of sterile spikelets on 10 F L 0 2 NA(or less) heads
No. of kernels on 10 (or less) F L 0 2 1 NAheads
No. of detached heads E F 2 3 A
Wt. of heads E L I 2 3 A
Wt. of threshed grain E L 2 3 A
Moist. content of threshed grain E L 2 3 A
Unthreshed whole heads gleaned H F I 2 3 A
Partly threshed heads gleaned H F I 2 3 A
Loose grain gleaned H F 2 3 A
Wt. of heads, loose grain &: chaff H L I 2 3 A
Wt. of threshed grain H L 2 3 A
Moist. content of grain H L I 2 3 A
- 24 -
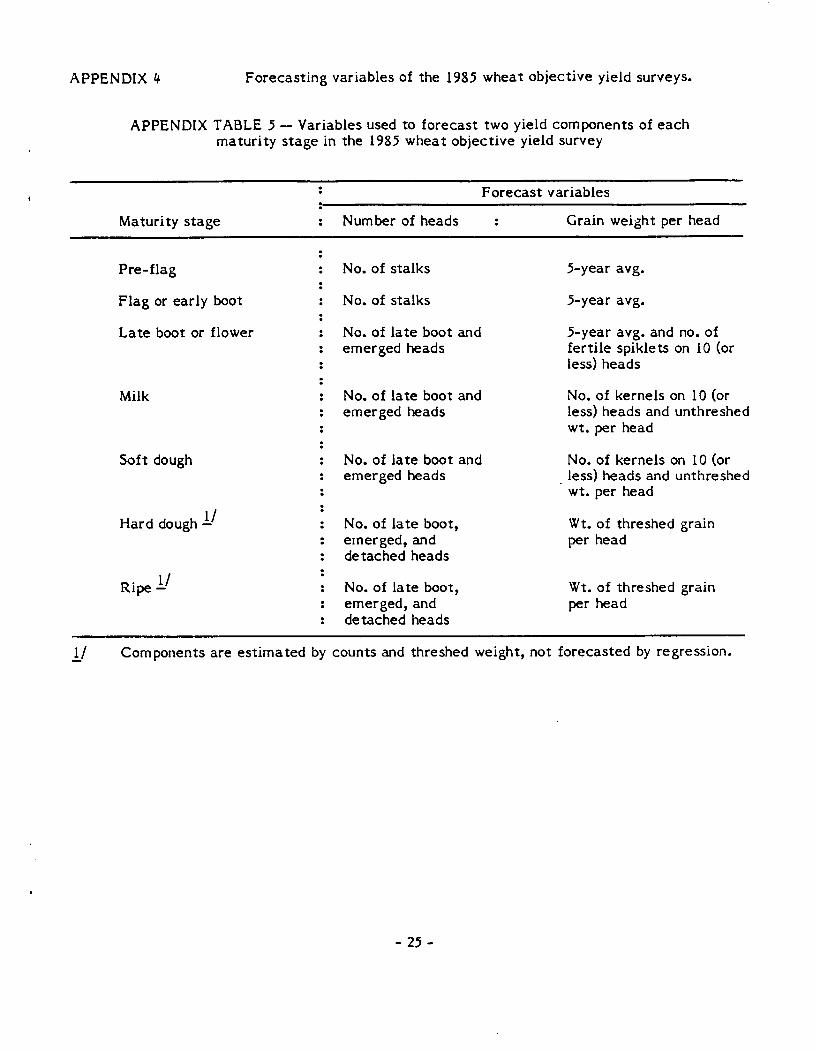
APPENDIX 4 Forecasting variables of the 1985 wheat objective yield surveys.
APPENDIX TABLE 5 - Variables used to forecast two yield components of eachmaturity stage in the 1985 wheat objective yield survey
Forecast variables
Maturity stage
Pre-flag
Flag or early boot
Late boot or flower
Milk
Soft dough
Hard dough !I
Ripe !I
Number of heads
No. of stalks
No. of stalks
No. of late boot andemerged heads
No. of late boot andemerged heads
No. of late boot andemerged heads
No. of late boot,emerged, anddetached heads
No. of late boot,emerged, anddetached heads
Grain weight per head
5-year avg.
5-year avg.
5-year avg. and no. offertile spiklets on 10 (orless) heads
No. of kernels on 10 (orless) heads and unthreshedwt. per head
No. of kernels on 10 (orless) heads and unthreshedwt. per head
Wt. of threshed grainper head
Wt. of threshed grainper head
!I Components are estimated by counts and threshed weight, not forecasted by regression.
- 25 -