Embed Size (px)
Citation preview
1
An overview of the current economic situation of women in India1
The economic status of women is inextricably related to the treatment that they are accorded to in the labour market which is unequal vis-a-vis men. With unequal access, control and ownership of productive resources like land, credit, technology, education, skills; inequitable work burdens; inequitable distribution of consumption resources within the household are major factors differentiating women from men. Increase in employment and access to economic and other productive assets are the building blocks of women’s economic empowerment.
Women in the labour force – A Quick take from the NSSi Labour force participation rate
Women represent 48.4ii percent of the population.
Female labour force participation rate is, however, less than half of that of men. The latest employment and unemployment survey of the National Sample Survey Organization (66th Round), 2009-10 reveals that
23 percent of women are in the labour forceiii as compared to 55.6 percent of meniv.
Female labour force participation rate (LFPR) declined to o 26.5 percent in 2009-10 from 33.3 percent in 2004-05 in the rural areas o 14.6 percent in 2009-10 from 17.8 percent in 2004-05 in the urban areas
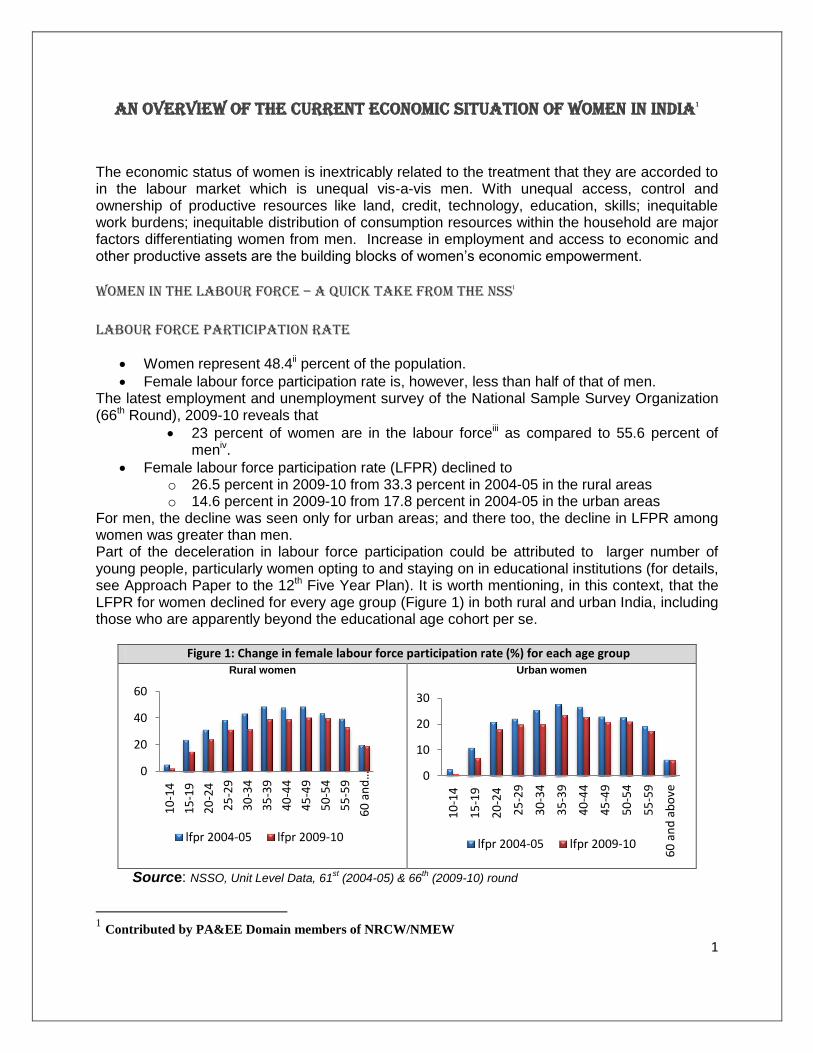
For men, the decline was seen only for urban areas; and there too, the decline in LFPR among women was greater than men. Part of the deceleration in labour force participation could be attributed to larger number of young people, particularly women opting to and staying on in educational institutions (for details, see Approach Paper to the 12th Five Year Plan). It is worth mentioning, in this context, that the LFPR for women declined for every age group (Figure 1) in both rural and urban India, including those who are apparently beyond the educational age cohort per se.
Figure 1: Change in female labour force participation rate (%) for each age group Rural women Urban women
Source: NSSO, Unit Level Data, 61st (2004-05) & 66
th (2009-10) round
1 Contributed by PA&EE Domain members of NRCW/NMEW
0
20
40
60
10
-14
15
-19
20
-24
25
-29
30
-34
35
-39
40
-44
45
-49
50
-54
55
-59
60
an
d…
lfpr 2004-05 lfpr 2009-10
0
10
20
30
10
-14
15
-19
20
-24
25
-29
30
-34
35
-39
40
-44
45
-49
50
-54
55
-59
60
an
d a
bo
ve
lfpr 2004-05 lfpr 2009-10

2
The decline in LFPR among women is the highest in the age cohort 30-34 years followed by 35-39 years. The age bracket 15-19 years comes next, followed by women in the age-group of 40-44 years (Figure 2). This is true for both rural and urban India. For men, decline in LFPR is more prominent in the educational age group. For men above 35, LFPR has increased over the period, highest being for men between 50 and 59 years of age.
Figure 2: Decline in labour force participation rate among women vis-a-vis men during 2004-05 to 2009-
10 for each age group (%)
Women Men
Source: NSSO, Unit Level Data, 61st (2004-05) & 66
th (2009-10) round
Unemployment rate
Unemployment rate had been consistently high for women since 1972-73 in both rural and urban areas; this was seen particularly when the unemployment rate was measured on the basis of current daily status rather than that measured in terms of usual statusv, , thereby indicating a higher degree of intermittent unemployment among women. In India, given that 30 percent of the population lives below poverty line in 2009-10 (following Tendulkar methodologyvi), the poor cannot afford to stay unemployed for a longer period and would take recourse to any engagement as survival strategy.. In India where large-scale seasonal unemployment exists, the current daily status measure gives a better picture of the unemployment situation than the one relating to usual status. Unemployment rate for women measures in these terms is more than men (Figure 3) both in rural and in urban India. Even with a decline over the five year period, the incidence of unemployment among women is substantially high. Also unemployment ratevii by current daily status among the young women (15-24 yrs.) is as high as 14.7 percent in rural areas and 20.5 percent in urban areas, which explains partly the declining labour force participation rate.
-15
-10
-5
0
10
-14
15
-19
20
-24
25
-29
30
-34
35
-39
40
-44
45
-49
50
-54
55
-59
60
an
d…
rural urban
-14
-9
-4
1
10
-14
15
-19
20
-24
25
-29
30
-34
35
-39
40
-44
45
-49
50
-54
55
-59
60
an
d…
rural urban

3
Figure 3: Unemployment rate (current daily status) of women as compared to men for both rural and urban areas, 2004-05, and 2009-10 (%)
Source: NSSO, Unit Level Data, 61st (2004-05) & 66
th (2009-10) round
Women workers – A snapshot
Work participation rate
Gender based differences in work force participation rate is a persistent feature of the Indian labour market. The National Sample Survey estimates that women’s work participation rateviii is 26 percent as compared to 54 percent among men in rural India. The difference becomes wider in urban areas (Table 1). Over the five year period - 2004-05 to 2009-10, the WPR for women declined from 29% in 2004-05 to 23 % in 2009-10. Gender differential increased in both rural and urban areas; more so in urban India.
Table 1: Work participation rate by gender, rural-urban divide(%)
Year Rural Urban All
male female male female male female
2009-10 54.7 26.1 54.3 13.8 54.6 22.8
2004-05 54.6 32.7 54.9 16.6 54.7 28.7
Source: NSSO, Unit Level Data, 61st (2004-05) & 66
th (2009-10) round
0
2
4
6
8
10
12
14
rural male rural female urban male urban female
2004-05 2009-10

4
Where do the women work?
In rural areas, more than 80% of the women are employed in agricultural activities, with a distant second at manufacturing (7.5%), construction (5.2%) and only 7% in services sector. About 60% of all agricultural operations are handled exclusively by women. Female hourly wage rates in agriculture vary from 50 to 75% of male rates, and are too low to overcome absolute poverty. Though the share of women in non-farm sectors is increasing, going by the rate of change of the share of women in wage employment in the non-agricultural sector which was only about 6 percentage points (from 13% to 18%) between 1990‐ 91 to 2004‐ 05 and by 2 percentage points over a period of 5 years from 2003-08 (M/o Statistics and Programme Implementation, “The India Country Report 2009, Millennium Development Goals”), it is projected that the share of women in wage employment can at best reach to a level of about 24% by 2015. This is an extremely slow progress for the women in the labour markets towards industry and service sectors, thus hindering achievement of parity in employment opportunities for women, particularly in male dominated sectors. It is worth noting that, in general, 53 % of the workforce (70 percent of the Indian women workforce) is producing barely 15% of the Gross Domestic Product (GDP); therefore, there should be faster transition of labour, as such, from agriculture to industry and services to reduce the incidence of poverty.
In the manufacturing sector, share of female workers registered a fall from 8.4% to 7.5% in rural areas and 28.2% to 27% in urban areas. Over the period 2004-05 to 2009-10, gender differential increased in the manufacturing sector (see table 2); the gap being more significant when subsidiaryix workers are taken into account. There are two alarming implications to these findings, (i) the share of workers in the manufacturing sector is declining and (ii) for women, jobs in this sector are increasingly becoming subsidiary in naturex. In order that the growth in India is truly inclusive and sustainable, manufacturing has to become an engine of growth; it must provide a large portion of the additional employment opportunities required, particularly for India’s increasing number of youths.
Though majority of the female workers are in agriculture, they neither have better access, control and ownership of land and other productive resources, nor do they have access to market or a role in decision making. Women’s lack of title/ownership of productive inputs have naturally impaired their access to facilities like credit, subsidies and have rendered them more vulnerable to economic vagaries. They are engaged in agriculture, largely as subsistence farmers, who farm small pieces of land, often less than 0.2 hectares. Feminization of agriculture, in India, has been caused by increased "casualization" of work, unprofitable crop production and distress migration of men "for higher casual work in agriculture and non-agriculture sectors", leaving women to take up low paid casual work in agriculturexi. Women have now become custodians of the family land, in the absence of men. In the coming years there would necessarily be a need for job opportunities for women in the manufacturing and services sectors especially in rural areas where jobs in agriculture are not growing and, in any case, such jobs may not satisfy the aspirations of younger women who will be entering the workforce with some educational qualifications.
In construction sector, with the MGNREGS, employment opportunities have increased in the rural areas, to the extent that it has surpassed the share of corresponding construction workers in urban areas. 24 per cent of the rural households got work in MGNREGS works in 2009-10. In general, the nature of the construction work is such that it is mostly contractual in nature on a day today basis and low paid. Women here mainly scaffold, carry bricks and water, and do earth work; they are often dissuaded from learning masonry, painting or other specialised trades

5
which are mainly under men’s domain. With such occupational segregation, their wages are much lesser than men. Opportunities in services sector for women remain very limited in rural areas; they are largely under government dispensation, sectors like health, education etc. and women’s access to employment are in the lower echelons of the hierarchy. In education sector, women constitute a high proportion of primary school teachers but a much lower proportion of the higher education teaching staff (UN 2010, pp. 92-93)xii.
Approximately 50 lakh womenxiii are employed in various government schemes without being
recognised as government workers with the right to government level wages. Flagship programmes like the ICDS, NRHM and the Mid-Day Meal Scheme are dependent for their day-to-day operations on them. It is only appropriate to provide necessary recognition to them as government employees with an urgent need to increase their remuneration and social security benefits. In urban areas women are largely concentrated in ‘other’ services, with 37 percent of the workers employed as domestic workers.
Table 2: Distribution of the workers by Broad Industrial Classification (%)
Rural Urban
male female male female
Sectors 2004-05
2009-10
2004-05
2009-10
2004-05
2009- 10
2004-05
2009-10
Agriculture 66.5 62.8 83.3 79.4 6.1 6.0 18.1 13.9
Mining &Quarrying 0.6 0.8 0.3 0.3 0.9 0.7 0.2 0.3
Manufacturing 7.9 7.0 8.4 7.5 23.5 21.8 28.2 27.9
Electricity, water, etc. 0.2 0.2 0 0 0.8 0.7 0.2 0.4
Construction 6.8 11.3 1.5 5.2 9.2 11.4 3.8 4.7
Trade , Hotel & Restaurant 8.3 8.2 2.5 2.8 28 27 12.2 12.1
Transport , Storage& Communications
3.8 4.1 0.2 0.2 10.7 10.4 1.4 1.4
Other Services 5.9 5.5 3.9 4.6 20.8 21.9 35.9 39.3
All 100 100 100 100 100 100 100 100
Source: NSSO, Unit Level Data, 61st (2004-05) & 66
th (2009-10) round
Increase in casual workers
More women work as casual workers relative to men. They undertake casual work to supplement their/ family income.
40% of the rural women workers are casual workers (those working on day-to-day basis) an increase from 32% in 2004-05.
The share of casual workers among women workers has reached a record high in 2009-10 since the early 1980s.
One-fifth of the women workers in urban India are casual workers – an increase from 16% during the last period.

6
Incidence of casualisation is more among women than men.
Box 1: Access to social security benefits
61% of the regular women workers in rural India do not receive any sort of social security benefits. In urban areas this figure stands at 52%. 10.5% of the female regular workers are eligible for only Provident Fund /pension. Condition of casual workers is worse - 97% of the casual women workers in rural India do not receive any sort of social security benefits. Same is the situation in urban areas. 65% of the women working as regular workers in urban areas do not have any written job contract. And for casual workers, no written job contract is the thumb rule - as 98% of them work without any such thing in their hand. There is no question of job security for them.
Source: NSSO, Unit Level Data, 61st (2004-05) & 66
th (2009-10) round
Decrease in workforce participation rates coupled with increasing informalization and increasing stake in agriculture is leading to the feminization of poverty and low levels of asset building by women. This is recognized as an extremely “troubling” trend, resulting in “capabilities failure” (Martha Nussabaum and Amartya Sen).
Education of workers
58 % of rural women workers are illiterate while 28 percent of male workers are illiterate.
30 % of urban women workers are illiterate as compared to 11 % of men.
Table 3: Distribution of usually employed workers by different education level (%)
Education Level Rural Urban
male female male female
2004-05 2009-10 2004-05 2009-10 2004-05 2009-10 2004-05 2009-10
Not Literate 33.8 28.0 66.4 57.8 13.1 11.4 37.3 29.7
Literate & up to Primary 29.4 28.1 18.4 22.6 22.7 18.3 20.3 19.3
Middle 18.1 19.8 8.7 10.6 19.4 17.9 11.9 12.9
Secondary 9.3 12.6 3.6 4.9 15 17.6 7.3 8.4
Higher Secondary 4.6 6.3 1.4 2.1 9.2 10.8 5.1 6.2
Diploma / Certificate 1.0 0.9 0.5 0.4 3.7 2.9 3.4 2.8
Graduate & above 3.8 4.4 0.9 1.5 16.9 21.1 14.7 20.7
All 100.0 100.0 100.0 100.0 100.0 100.0 100.0 100.0
Source: NSSO, Unit Level Data, 61st (2004-05) & 66
th (2009-10) round

7
A profile of the women workers:
Women in rural areas are engaged mainly in agricultural activities followed by manufacturing, construction and other services (public administration, education, health, working in private households etc.).
o Within manufacturing sector, they work largely in units manufacturing tobacco products (30%), followed by units manufacturing food products, beverages, textiles, wearing apparel etc.
o 42% of women workers in the manufacturing sector in rural areas are illiterate; 30% have literacy up to primary level of education; only 16% of them are educated till middle level.
Table 4: Women workers in different service sectors in rural areas by different education level (%)
Level of Education Public administration and defence; compulsory
social security
Education Health and
Social Work
Activities of private
households
Not literate 6.6 9.5 5.4 58.3 Literate and up to primary 7.6 7.0 18.2 26.7 Middle 20.1 9.8 12.1 10.3 Secondary 23.0 15.0 21.3 2.7 Higher secondary and above
41.6 52.4 25.7 0.2
Source: NSSO, Unit Level Data, 66th
(2009-10) round
Though 52% of the rural women working in the education sector have education level of higher secondary and above, the fact that 10% of them in this sector are still illiterate and 17% of them are educated only up to middle school level is a matter of concern. Therefore, it is likely that they would be concentrated only in lower echelons in this sector.
In health and social work, the education level of the rural women is extremely grim. 18% of the rural women workers have education level up to primary; 30% have education till middle school. .
Only one-fourth of the women in health and social work have education more than higher secondary.
Is education the sole impediment?
Sectoral distribution for each education level reveals that o 63% of the rural women with secondary level of education are still engaged in
agricultural activities. o 23% of graduate women are working in agriculture/ agriculture related work.
Women in urban areas are engaged primarily in services like public administration, health, education, domestic workers, followed by trade and then manufacturing.
o Within services, 37.4% of urban women work in education; 20% work as domestic workers and 13% are employed in health sector.

8
o About 26% of women in each of public administration and health and social work have education up to secondary level.
o 50% of the women workers in urban areas employed in private households as domestic staff are illiterate. Along with that 28% are literate and up to primary. There is a very meek chance that with such less education level they can move upward for a better opportunity.
Technical education
Gender based disparities exist in Technical and Vocational Education and Training (TVET), with girls accounting for just 7% of enrolment at the secondary level concentrated in some stereotyped courses such as nursing and sewing. The benefits of vocational training in terms of Opportunities in the labour market are also not very promising. there is also a bleak chance in entry to higher technical education courses. This needs to be addressed and institutions that have been set up to enhance skills for employability need to be made more sensitive to gender issues
Only 1 – 1.5% of rural person in the working age (15-59 years) have some technical education.
In urban areas, 2.9% of women are technically educated as compared to 7% of men. Among them there is high gendered segregation with men more in technical degree in technology, engineering, medicine etc., in diploma or certificate courses in technology.
Vocational training
3.6% of women in rural India have received/receiving some sort of vocational training as compared to 8% of men.
6.5% of women in urban India have received/receiving some sort of vocational training as compared to 14.4% of men.
Table 5: Distribution of the casual workers in the age group 15-59 years by different education level (%)
Not literate
Literate and up to primary
Middle Secondary and above
Total
Rural Male 35.5 32.8 19.3 12.4 100
Rural Female 63.5 24.4 8.6 3.5 100
Urban Male 24.7 33.5 23.6 18.2 100
Urban Female 52.5 26.3 14.5 6.7 100
Source: NSSO, Unit Level Data, 66th (2009-10) round

9
Subsidiary workers – more women than men
Figure 4: Age specific usual status subsidiary status worker population ratio, 2009-10 (%)
Source: NSSO, Unit Level Data, 61st (2004-05) & 66
th (2009-10) round
More women than men pursue economic activities for shorter duration of the reference year (subsidiary workers). The extent of subsidiary work is higher in rural areas.
5.6% of usually employed rural women with secondary level of education are subsidiary workers as compared to 1.5% of their male counterparts. At this education level only 22% of women are usually employed vis-a-vis 70% of men.
Education wise gender gap among subsidiary workers in rural areas is higher at the lower levels of education; highest being at the middle level of education.
Regional disparity
Women’s work participation rate is lower than that of men in every state in India.
Women’s WPR has declined in every State during 2004-05 to 2009-10
WPR for women is extremely grim in rural Bihar, Jharkhand, West Bengal, Uttaranchal, Kerala, Goa and Tripura (<20%). However, the situation is not so dismal for men. Gender gap in WPR is high in these States.
WPR among women is on the higher side in rural Tamil Nadu, Rajasthan, Maharashtra, Karnataka and Andhra Pradesh (40-45%). But in all these States the female WPR has declined since 2004-05.
In urban Bihar, Assam, Delhi, Goa, Uttaranchal and Tripura WPR for women is very low (<10%). Men’s WPR is, however, about 50% in these States.
In urban areas, women’s participation in economic activities is more in Tamil Nadu, Mizoram, Meghalaya, Kerala, Karnataka and Andhra Pradesh. Current employment situation of women in these States have worsened over the last five year period.
11.7 10.7
10.9 11.2
3.9 4.2 2.8 3.7
0.0
2.0
4.0
6.0
8.0
10.0
12.0
Rural Female Urban Female Rural Male Urban Male

10
Conclusion Labour is the primary asset at the disposal of the poor and hence labour markets are the key transmission mechanism for them – translating labour into paid work and then paid work into improved levels of poverty, to distribute the benefits of growth. However, there are difficulties in this process, further more for women than men because of various constraints related to social norms and values that govern the gender division of labour in production and reproduction. With declining participation of women in the labour market in India coupled with increasing incidences of unemployment, increasing informalization, dependence on the primary sector, the building blocks towards empowerment and equality are at stake. On all the parameters discussed above, women in India fare worse than men; the rate of transition of labour, particularly women, out of agriculture to industry and services, is still far too slow to reckon. Women face multiple barriers in terms of occupational segregation, low wages, unequal access to assets and other productive inputs, lack of decision making power and education. In addition they face care work, household chores and time poverty. Opening up of the economy and rapid economic growth have escalated some of the existing structural barriers faced by women. New challenges in the form of dismantling of traditional support structures, displacement due to migration, obsolescence of traditional skill sets have cropped up. The decline in women’s workforce participation rate is a matter for concern and has implications for their overall economic empowerment. There is an urgent need to increase decent work and productive employment with more opportunities for women in different sectors.
Note:
Population = labour force + not in the labour force (students, housewives (includes those who along with
domestic duties was also engaged in free collection of goods (vegetables, roots, firewood, cattle feed, etc.), sewing, tailoring, weaving, etc. for household use.)
Labour force = workforce + unemployed Workforce = self-employed + regular workers + casual workers
i All Figures are taken from NSSO Unit Level Data various Rounds. ii Census 2011, provisional population estimates.
iii Labour force figures reflect the share of population that is willing to or already working.
iv based on the usual principal and subsidiary status taken together
v Usual status
vi Government of India, Press Information Bureau, Poverty Estimates For 2009-10, New Delhi, 19th March, 2012
vii Current daily status is determined on the basis of his/her activity status on each day of the reference week.
viii Work force participation rate is the share of persons/persondays employed. ix The status in which an economic activity is pursued for less than 183 days but not less than 30 days during the
reference year is called the subsidiary economic activity status of that person. x Sinha, Sharmistha 2012 ‘Female employment and the Planning process in India’- paper presented at the
International Conference on Feminism and the Law: Revisiting the Past, Rethinking the Present and Thinking the Way Forward, ILS Law College, Pune in partnership with the University of New South Wales University of Technology, Sydney. xi
Sujaya,C.P (2006), Climbing a Long Road: Women in Agriculture in India: Ten Years after Beijing, M.S. Swaminathan Research Foundation, Chennai. xii
UN (2010), The World’s Women in 2010, Trends and Statistics, UN Department of Economics and Social Affairs, (New York).

11
xiii
The hindu (30,Sep,2012), Guwahati, September 30, 2012, Why are women disappearing from workforce, asks Brinda, SUSHANTA TALUKDAR, Guwahati, September 30, 2012.