Embed Size (px)
Citation preview

An Overview of the HPGR and
Fine Grinding Technologies to
Characterize Ore Grindability
F.O. Verret
Group Leader Metallurgy – Québec City
SGS Minerals Services, Québec, Qc, Canada.

2
Outline
Introduction
Bench-scale Testing
Pilot-scale Testing
Conclusions

3
Introduction
New Technologies
New technologies… but not that recent:
High Pressure Grinding Rolls (HPGR)
– Cement industry: early 1980’s
– Diamond: mid 1980’s
– Iron ore: mid 1990’s
– Hard rock / Minerals: 2003
First IsaMill in operation: 1994 (Mount Isa)
HiGmillTM:
– Calcium carbonate industry: mid 1980’s
– Mineral industry: 2013
First Vertimill®: 1979

4
Outline
Introduction
Bench-scale Testing
Bond Test Recap
HPGR (Polysius)
IsaMill (Glencore)
HiG 5 (Outotec)
Jar Test (Metso)
Pilot-scale Testing
Conclusions

5
Grindability Tests - Review
Small-scale Test
Mill
Dia.Top Size
Closing
Size
Sample
Requested1
Sample
Consumed2 TypeSteady-
state
(m) (mm) (Core) (mm) (kg) (kg) (Y/N)
Lab-scale HPGR 0.25 12.7 BQ 3.35 350 300 Locked-cycle Y
SPT N/A 19.1 BQ 3.35 10 7 Locked-cycle Y
Pilot-scale HPGR 0.71 35 NQ Various 150 150 Locked-cycle Y
HPGR Pilot Plant 0.9 50 - Various >2,000 >2,000 Continuous Y
Bond Ball Mill 0.305 3.35 Any 0.149 10 5 Locked-cycle Y
Mod Bond 0.305 3.35 Any N/A 2 1.2 Batch N
Sign. Plot (Isamill) 0.15 0.5 Any Int. Class. 15 15 Semi-Cont. Y
Lab-scale HiG 5 0.1 0.3 Any Int. Class. 15 15 Semi-Cont. Y
Jar Mill Test (Vertimill) 0.2 0.5 Any Various 15 15 Batch N
HP
GR
Ball
Mil
lsR
eg
rin
d

6
Blasting
Prim. Crusher (Gyr./Jaw)
Sec. Crusher (Cone)
Tert. Crusher (Cone)
Impact Crusher
Roll Crusher
CWI
AG Mill
AMCT
AWI
DWT
SMC
JKRBT
SAGDesign
SPI
AG Pilot Plant
HPGR
Lab-scale HPGR
SPT
Pilot-scale HPGR
Rod Mill
RWI
Primary Ball Mill
Secondary Ball Mill
BWI
IsaMill
Sign. Plot
HiG Mill
Lab-scale HiG 5
Vertimill
Stirred Media Detritor
0.1 1 100
Size K80 (mm)
100.001 1,0000.01
Grey: Industrial/ProductionBlue: Testing
7
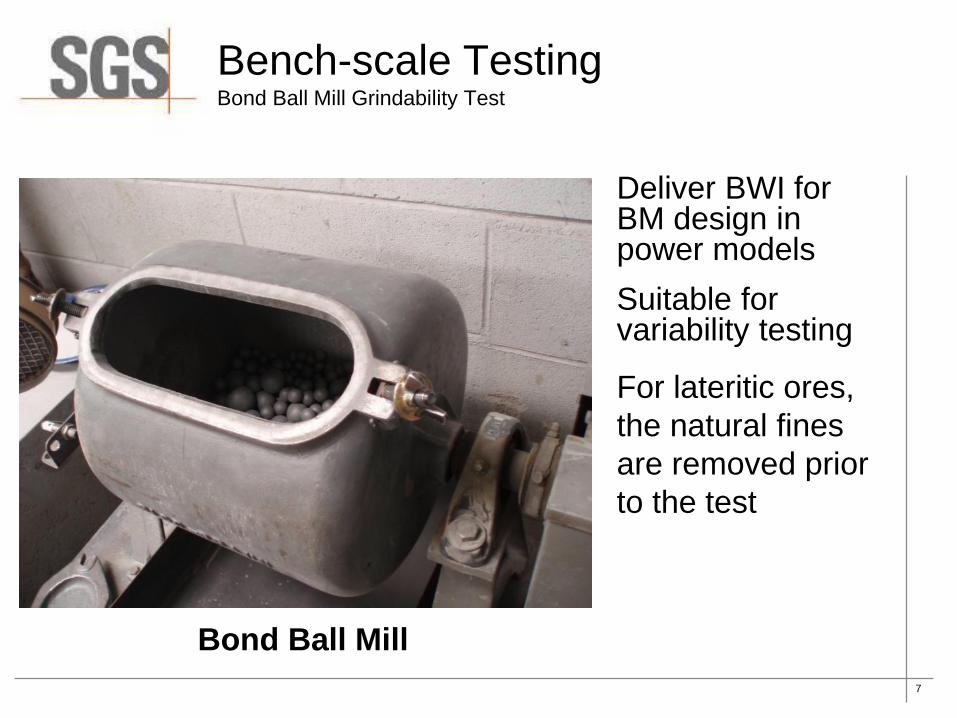
Bench-scale Testing Bond Ball Mill Grindability Test
Bond Ball Mill
Deliver BWI for BM design in power models
Suitable for variability testing
For lateritic ores,
the natural fines
are removed prior
to the test

8
Bench-scale Testing LABWAL HPGR Testing
LABWAL HPGR
25 kg of 12.5 mm per test. 350 kg for full program
Batch / Locked-cycle Test
Deliver HPGR and BM power
HPGR vs conventional mill trade off studies
Preliminary scale-up but need full PP
Less suitable for variability testing
Prepare material for float / leaching trade off studies

9
Bench-scale Testing LABWAL HPGR Testing
Two procedures:
Batch Test
– 7 batch tests 25kg+ each, for 30sec+ of operating time
– Investigate impact of moisture and pressure on kWh/t
and fineness
Locked-cycle Test
– On optimal performance determined in Batch test
– Standard closing screen size is 3.35mm (6 mesh), or
as per client needs
– Provide kWh/t for locked-cycle test, and other
parameters use for design.
– Prepare material for BWI testing (micro-cracks and
additional fines in the feed)

10
Bench-scale Testing LABWAL HPGR Testing

11
Bench-scale Testing LABWAL HPGR Testing
Test Results Summary
Batch Tests Locked-cycle
Test Number B1 B2 B3 B4 B5 B6 B7 LC3 LC4 LC5 AVG
Date: 06/12/10 06/12/10 06/12/10 06/12/10 06/12/10 06/12/10 06/12/10 10/12/10 10/12/10 10/12/10 -
Operation
Pressure of Operation (bar) 32 69 32 56 68 35 69 54 53 54 54
Moisture (%H2O) 1.1 1.0 2.0 1.9 1.9 3.7 3.8 - - - 1.9
Dry Net Throughput (t/h) 2.7 2.6 2.7 2.6 2.5 2.7 2.4 1.7 1.6 1.6 1.6
Circulating Load (%) - - - - - - - 50.5 52.8 52.2 51.9
Gross Power (kW) 3.5 5.8 3.7 5.0 5.8 3.7 5.8 4.9 4.9 5.0 4.9
Net Power (kW) 2.6 4.9 2.7 4.1 4.9 2.7 4.8 3.9 3.9 4.0 3.9
Gross Specific Energy Requirement (kWh/t) 1.30 2.28 1.37 1.93 2.29 1.38 2.39 2.84 3.09 3.03 2.98
Net Specific Energy Requirement (kWh/t) 0.94 1.91 1.01 1.57 1.93 1.03 2.01 2.25 2.45 2.43 2.38
HPGR Product Analysis
P50 (µm) 2,338 1,628 2,589 1,711 1,706 2,377 1,552 - - - 1,101
P80 (µm) 5,130 4,149 5,298 4,374 4,302 5,292 3,950 - - - 2,350
Percent Passing 6 mesh 62.1 72.0 59.0 69.4 70.6 61.6 73.9 - - - 99.4
Percent Passing 100 mesh 12.0 16.9 11.4 16.4 16.2 12.8 16.4 - - - 18.8
Flake Density (kg/L) 2.3 2.3 2.3 2.3 2.3 2.3 2.3 2.3 2.3 2.3 2.3
Flake Thickeness (mm) 6.0 6.0 6.0 6.0 6.0 6.0 6.0 6.0 6.0 6.0 6.0
Performance Indicators
Specific Grinding Force (N/mm2) 1.59 3.45 1.61 2.77 3.41 1.76 3.44 2.68 2.66 2.69 2.68
Specific Throughput (ts/hm3)-(mf ) 241 227 238 231 225 238 215 228 212 220 220
Specific Throughput Rate (ts/hm3)-(mc) 199 199 199 199 199 199 199 199 199 199 199
Specific Power (kWs/m3) 228 433 240 364 433 244 431 513 521 535 523
New minus 6 Produced (%) 25.4 35.4 22.4 32.8 33.9 24.9 37.2 - - - 62.8
New minus 100 Produced (%) 5.5 10.4 4.9 9.9 9.7 6.3 9.9 - - - 12.3
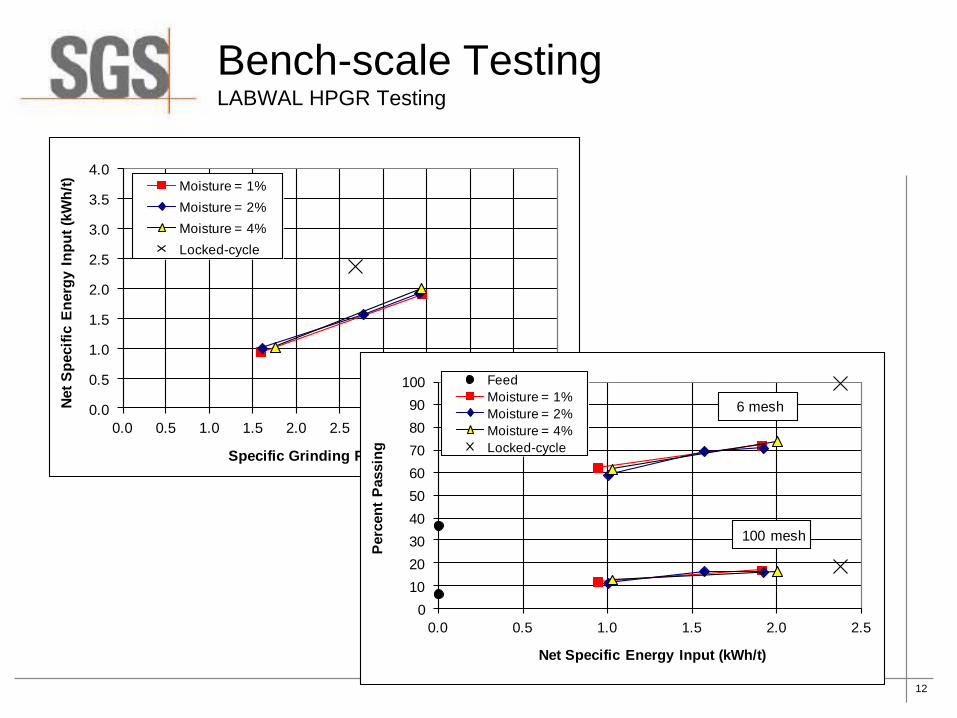
12
Bench-scale Testing LABWAL HPGR Testing
0.0
0.5
1.0
1.5
2.0
2.5
3.0
3.5
4.0
0.0 0.5 1.0 1.5 2.0 2.5 3.0 3.5 4.0 4.5 5.0
Net
Sp
ecif
ic E
nerg
y I
np
ut
(kW
h/t
)
Specific Grinding Force (N/mm2)
Moisture = 1%
Moisture = 2%
Moisture = 4%
Locked-cycle
0
10
20
30
40
50
60
70
80
90
100
0.0 0.5 1.0 1.5 2.0 2.5
Perc
en
t P
assin
g
Net Specific Energy Input (kWh/t)
Feed
Moisture = 1%
Moisture = 2%
Moisture = 4%
Locked-cycle
100 mesh
6 mesh

13
Bench-scale Testing LABWAL HPGR Testing
Sample NameMesh of
Grind
F80
(mm)
P80
(mm)
Gram per
Revolution
Work Index
(kWh/t)
Hardness
Percentile
HPGR Feed 120 2,357 93 1.43 14.5 50
HPGR Product 120 2,362 93 1.53 13.7 42
BWI Balance, % weight Work Index gram per revolution kWh/t*
Sample Name Feed %U/Sto be
GroundkWh/t Net
Gross
(O'all)
%
Reduction
HPGR Feed 100 10.9 89.1 14.5 1.43 1.61 -
HPGR Product 100 15.5 84.5 13.7 1.53 1.81 11
* kWh/t reduction based on [gross gram per revolution] -1
0
10
20
30
40
50
60
70
80
90
100
-10 0 10 20 30 40 50
Cu
mu
lati
ve %
Passin
g
Estimated kWh/t Reduction Following HPGR Preparation
Database - kWh/t Reduction (%)
your sample
BWI test on HPGR product when HPGR-Ball mill circuit is contemplated

14
Static Pressure Test (SPT)
For variability study
Piston with incremental pressure
Uses between 3 and10kg
Ore abrasiveness can be measured
through the Atwal test (Polysius)
Bench-scale Testing LABWAL HPGR Testing

15
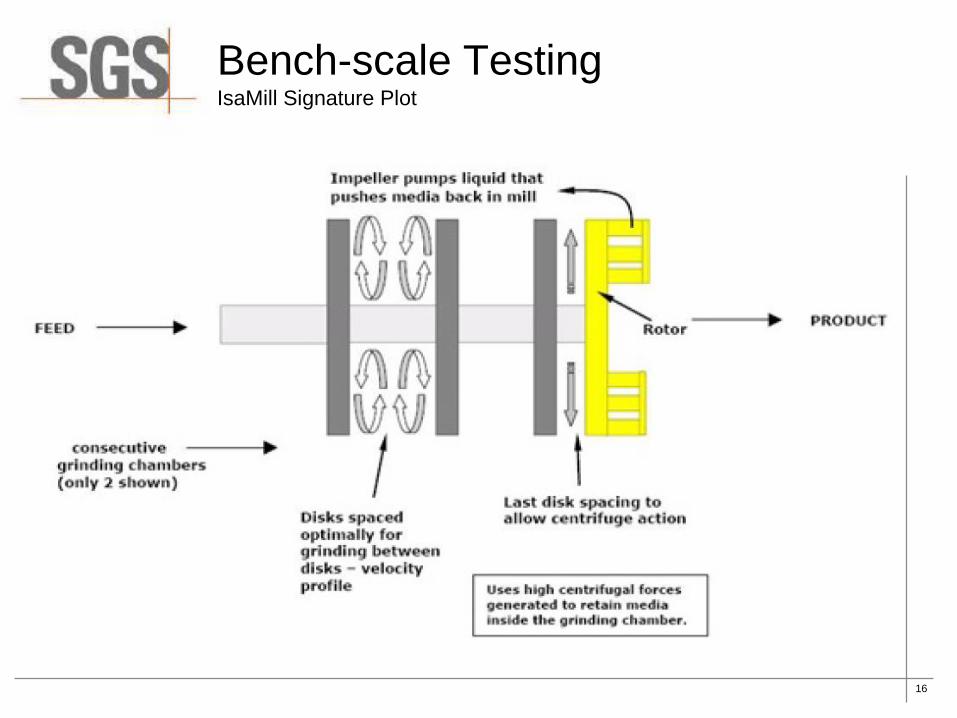
Bench-scale Testing IsaMill Signature Plot
Requires 15-kg of
sample
From 150 down to ~10
microns (K80)
Generate kWh/t and
media consumption
Internal classification
Direct scale-up
Continuous operation for
pilot plant testing
16
Bench-scale Testing IsaMill Signature Plot

17
Setup
Parameters recorded: Feed % solids
Throughput rate
Number of passes required
Media selection
Feed and product pulp densities and viscosities
Specific energy input
Specific energy input vs. P80 curve
Feed and product particle size analyses
Media consumption
Bench-scale Testing IsaMill Signature Plot
IsaMill
Feed TankProduct Tank
Viscosity is monitored at
every pass, and water
added when pulp too thick
18
Bench-scale Testing IsaMill Signature Plot
Pass # Net kW % Solids M (t/h)Cumul. E
(kWh/t)
Average
P80 (µm)
Average
P98 (µm)
Feed - 33.8% 0.19 0.0 38.0 107.3
1 0.76 33.2% 0.11 7.0 26.9 73.3
2 0.73 33.4% 0.10 14.2 20.3 48.4
3 0.74 33.0% 0.05 28.6 16.3 39.4
4 0.72 32.7% 0.05 43.4 14.2 35.2
5 0.72 32.5% 0.04 60.4 12.7 33.5
6 0.71 32.2% 0.03 80.6 11.3 28.1
7 0.62 32.3% 0.03 98.5 11.0 26.7
8 0.60 32.4% 0.03 116.3 10.2 24.5
9 0.60 32.2% 0.04 133.1 9.4 22.5
10 0.59 32.0% 0.04 150.0 8.8 22.5
Power Requirement @ 10μm: 115.8 kWh/t
Media Consumption: 6.7 g/kWh 0.79 kg/t
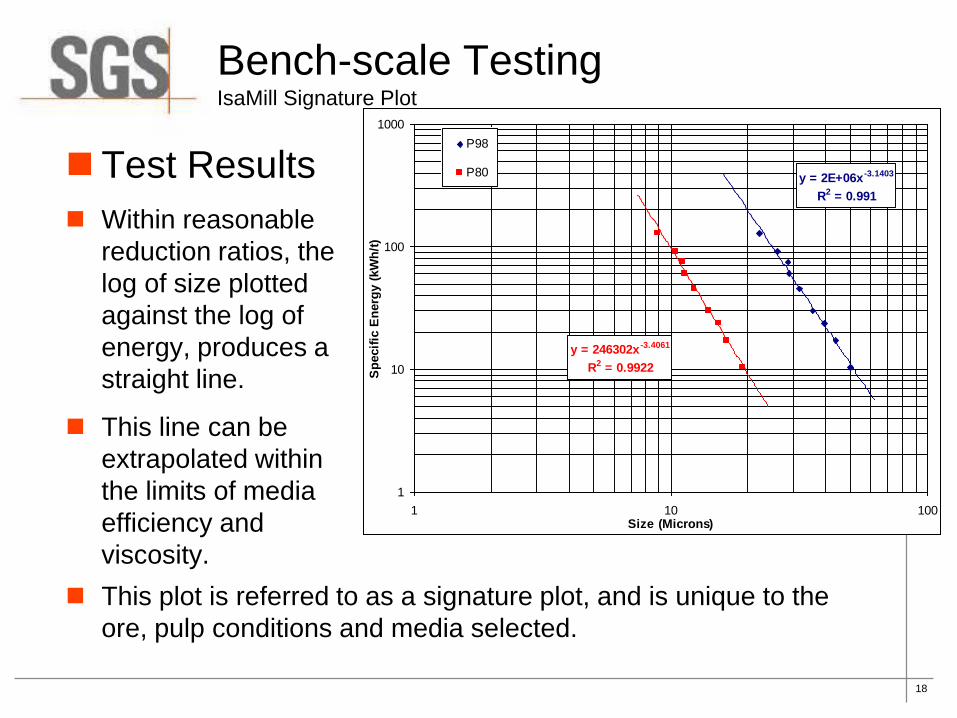
y = 2E+06x -3.1403
R2 = 0.991
y = 246302x-3.4061
R2 = 0.9922
1
10
100
1000
1 10 100Size (Microns)
Sp
ecif
ic E
nerg
y (
kW
h/t
)
P98
P80 Test Results
Within reasonable
reduction ratios, the
log of size plotted
against the log of
energy, produces a
straight line.
This line can be
extrapolated within
the limits of media
efficiency and
viscosity.
This plot is referred to as a signature plot, and is unique to the
ore, pulp conditions and media selected.

19
Bench-scale Testing HiG 5
Requires 15-kg of
sample
From 200 down to ~20
microns (K80)
Generate kWh/t and
media consumption
Internal classification
Continuous operation
for pilot plant testing

20
Bench-scale Testing HiG 5
Variables: Feed % solids
Throughput rate
Number of passes required
Shaft speed
Media selection
Feed and product pulp densities and viscosities
Specific energy input
Specific energy input vs. P80 curve
Feed and product particle size analyses

21
Bench-scale Testing Jar Mill Test
Multiple wet batch
tumbling grinding test
(4-5 per sample)
Calculations for
indicated energy
requirements
Specific energy
input vs. P98 curve

22
Outline
Characterisation Objectives
Bench-scale Testing
Pilot-scale Testing
Conclusions
23
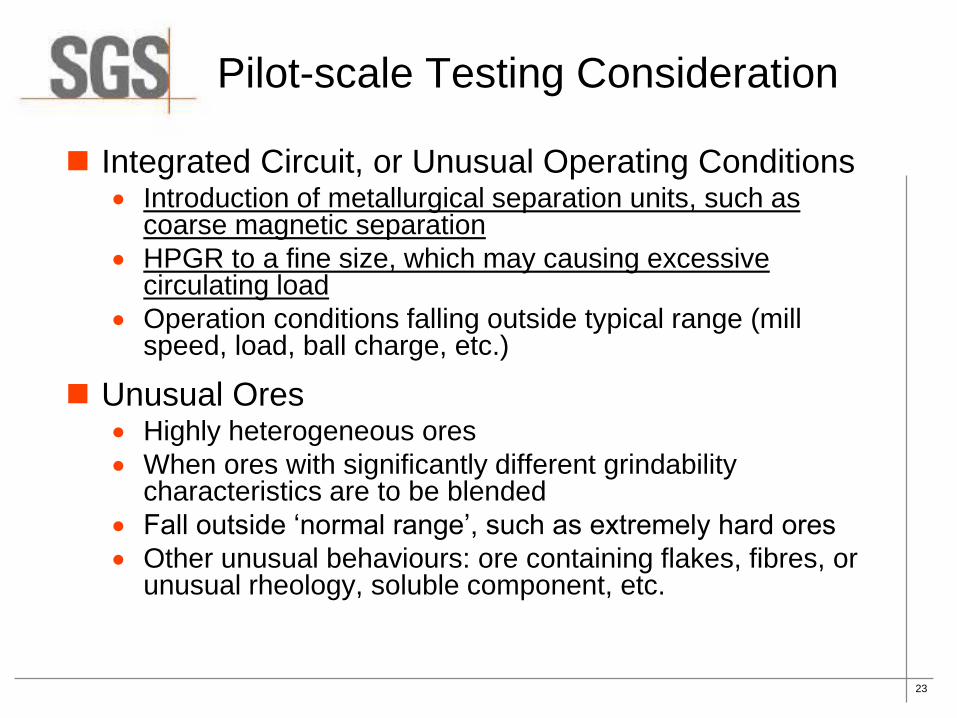
Pilot-scale Testing Consideration
Integrated Circuit, or Unusual Operating Conditions Introduction of metallurgical separation units, such as
coarse magnetic separation
HPGR to a fine size, which may causing excessive circulating load
Operation conditions falling outside typical range (mill speed, load, ball charge, etc.)
Unusual Ores Highly heterogeneous ores
When ores with significantly different grindability characteristics are to be blended
Fall outside ‘normal range’, such as extremely hard ores
Other unusual behaviours: ore containing flakes, fibres, or unusual rheology, soluble component, etc.

24
Pilot-scale Testing Consideration
Conflicting Results Two methodologies presenting significantly different
conclusions
Should be Conducted when in Doubt

25
Outline
Introduction
Bench-scale Testing
Pilot-scale Testing
Conclusions

26
Conclusions
HPGR and HiGmillTM technologies were not available to the hard rock industry until recently (wear, fear of different technology, etc).
HPGR should be considered early in the project (not only AG milling)
Important to do regrind test on proper material, as regrind feed characteristics are significantly different than raw material.
Confirmation through pilot plant is always desirable

27
Blasting
Prim. Crusher (Gyr./Jaw)
Sec. Crusher (Cone)
Tert. Crusher (Cone)
Impact Crusher
Roll Crusher
CWI
AG Mill
AMCT
AWI
DWT
SMC
JKRBT
SAGDesign
SPI
AG Pilot Plant
HPGR
Lab-scale HPGR
SPT
Pilot-scale HPGR
Rod Mill
RWI
Primary Ball Mill
Secondary Ball Mill
BWI
Vertimill
Stirred Media Detritor
HiG Mill
Lab-scale HiG 5
IsaMill
Sign. Plot
0.1 1 100
Size K80 (mm)
100.001 1,0000.01
Grey: Industrial/ProductionBlue: Testing
Questions?


![Ultra Fine Grinding - A Practical Alternative to Oxidative [1]](https://img.pdfslide.net/doc/110x75/55cf9a63550346d033a17b05/ultra-fine-grinding-a-practical-alternative-to-oxidative-1.jpg)