Embed Size (px)
Citation preview
An Overview of the Indian River Lagoon
Keri A. Smith
The University of Florida
Soil and Water Science Department
Introduction:
The Indian River Lagoon (IRL) ecosystem is one of the most diverse estuarine systems in North America, stretching 156 miles along Florida’s east coast (De Freese, 2005). The feature that most distinguishes this lagoon from other estuarine systems is its geographical location straddling the biogeographic temperate Carolinean Province and the subtropical Floridian/Caribbean Province (BioScience, 2002). The lagoon is comprised of numerous tributaries found along its length, and is also affected by man-made drainage canals. The value of the IRL can be best defined by its high diversity of flora and fauna, extensive wetland systems utilized for water purification, and economic benefits from the fishing industry, ports, and recreational activities. However, in recent years, the value of the IRL has been negatively impacted by agricultural use, urban development, in addition to natural causes. Primarily because of anthropogenic activities, algal superblooms have become common in the IRL. Poor water quality has led to deleterious health effects in humans and the widespread loss of many protected species, including manatees, mangroves, and seagrass. Numerous plans and acts have been put in place to offset further damage to the IRL, such as the National Estuary Program (NEP) and the Surface Water Management Plan (SWIM). The Florida Department of Environmental Protection (FDEP) has established Total Maximum Daily Loads (TMDL’s) to improve water quality within the lagoon. In addition, the acquisition of land has been a priority to improve the re-connection of natural drainage systems, to restore of historical flows, and to increase the wetland mass within the IRL. An increase in public awareness and education of the general public will contribute to the long range success of IRL restoration.
History of the IRL:
The records of early human existence in the IRL date back some 8,000 years (Surface Water Improvement and Management (SWIM), Appendix B, 1994). The coastal wetlands of the IRL are relatively young and probably developed less than 6,000 years ago (SWIM, Appendix B, 1994). Early settlers and Indians within the IRL watershed subsisted on the IRL to provide livelihood for food, transportation, commerce, and tools.
1
In the late 1800’s, the railroad system from Jacksonville to Miami was completed. The lagoon was already becoming established as a major area of commerce where tourism, fisheries, shipping, and agriculture flourished. Because of the degree of human activity and growth, it was necessary to alter the lagoon to fit the needs of the people at that time. Extensive drainage projects took place that would prepare land adjacent to the lagoon for future urban and agricultural development. In 1912, the Intracoastal Waterway was completed from Jacksonville to Miami. Devastating hurricanes in the mid 1930’s challenged flood control, and droughts and saltwater intrusion became commonplace by 1945 (SWIM), Appendix B, 1994). As part of the war effort, the IRL was both widened and deepened. The space age and population increase contributed to the advent of air conditioning, need for mosquito control, and improved drainage systems (SWIM, Appendix B, 1994). The construction of mosquito control impoundment structures began in the 1930’s, and would allow the retention of water and eliminate locations where salt marsh mosquito egg laying would normally occur (SWIM, 1994). This construction changed natural wetland water flows and isolated the wetlands from the open waters of the lagoon. It would take many years for the isolation of critically important foraging and nursery areas to be reflected in species’ numbers and habitat losses (SWIM, 2002 update). Throughout the mid and late portion of the 1900’s, the quality of fresh water and habitat for species survival was on the decline.
Geographical areas of the IRL:
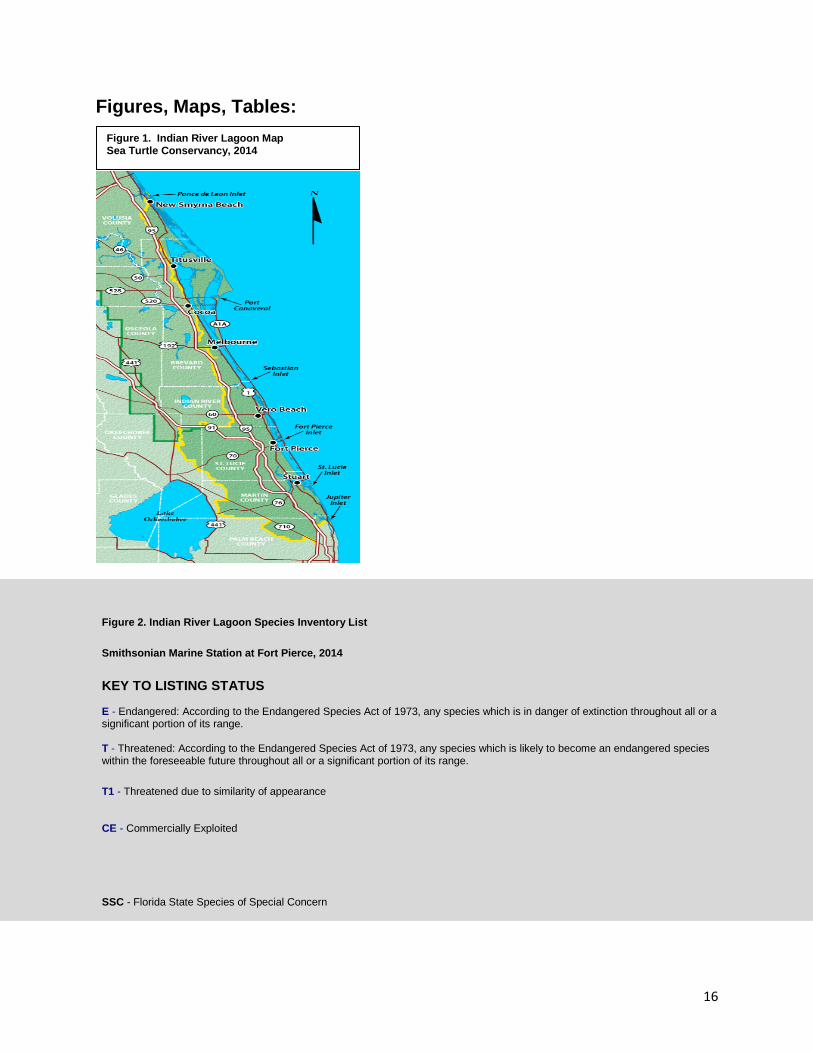
The Indian River Lagoon watershed (Figure 1) covers approximately 2,284 square miles and its waters span some 353 square miles (St. John’s River Water Management District (SJRWMD), 2014). Five counties border the lagoon (Volusia, Brevard, Indian River, St. Lucie, and Martin) but seven counties are within its watershed (including the former, as well as Okeechobee and Palm Beach County). There are five inlets connecting the IRL with the Atlantic Ocean. Ponce de Leon Inlet and Jupiter Inlet are natural inlets, while Sebastian Inlet, Fort Pierce Inlet, and St. Lucie Inlet are man-made. There is a lock system at Port Canaveral to separate the port basin from the lagoon and limit water exchange (SJRWMD), 2014). The IRL is comprised of three lagoons: Mosquito Lagoon, Banana River, and Indian River, which is often separated into the North, Central, and South segments of the Indian River (SJRWMD), 2014). The Mosquito Lagoon extends from Ponce de Leon Inlet to the north end of Merritt Island. The Banana River is an offshoot of the Indian River on Merritt Island’s eastern shore. The Indian River is the main body of water and extends from northern Brevard County to the southern boundary of Martin County (SJRWMD, 2014). The Mosquito Lagoon and Banana River are both poorly flushed, but, the Banana River has more freshwater inflow due to the locks at Port Canaveral. The lagoon and river are affected by direct and overland runoff, as well as ground-water infiltration. The lagoon receives inflow
2
from many small drainage canals, and various wastewater treatment facilities, whereas the river receives inflow primarily from Sykes Creek. The Indian River is connected to the Atlantic Ocean via 4 of the 5 inlets, which creates more tidal mixing within its boundaries. Sources of freshwater inflow are comprised of natural streams, drainage canals, storm water outfalls, overland runoff, ground water seepage, and wastewater treatment effluent.
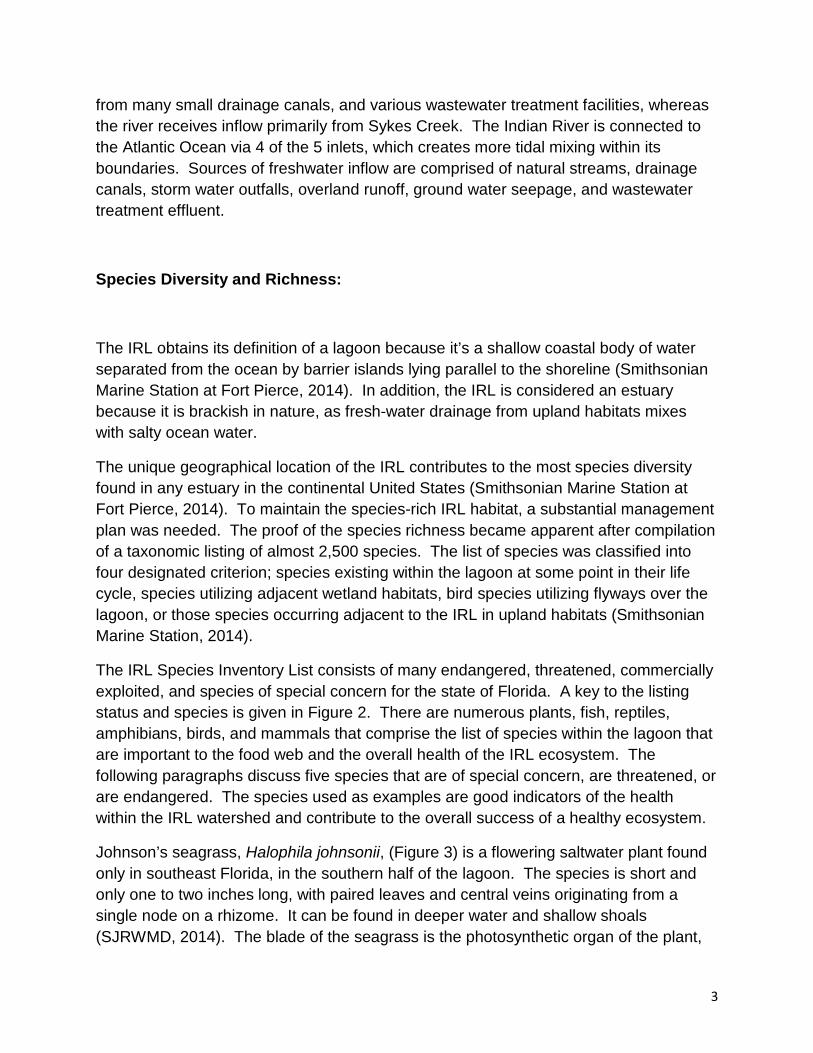
Species Diversity and Richness:
The IRL obtains its definition of a lagoon because it’s a shallow coastal body of water separated from the ocean by barrier islands lying parallel to the shoreline (Smithsonian Marine Station at Fort Pierce, 2014). In addition, the IRL is considered an estuary because it is brackish in nature, as fresh-water drainage from upland habitats mixes with salty ocean water.
The unique geographical location of the IRL contributes to the most species diversity found in any estuary in the continental United States (Smithsonian Marine Station at Fort Pierce, 2014). To maintain the species-rich IRL habitat, a substantial management plan was needed. The proof of the species richness became apparent after compilation of a taxonomic listing of almost 2,500 species. The list of species was classified into four designated criterion; species existing within the lagoon at some point in their life cycle, species utilizing adjacent wetland habitats, bird species utilizing flyways over the lagoon, or those species occurring adjacent to the IRL in upland habitats (Smithsonian Marine Station, 2014).
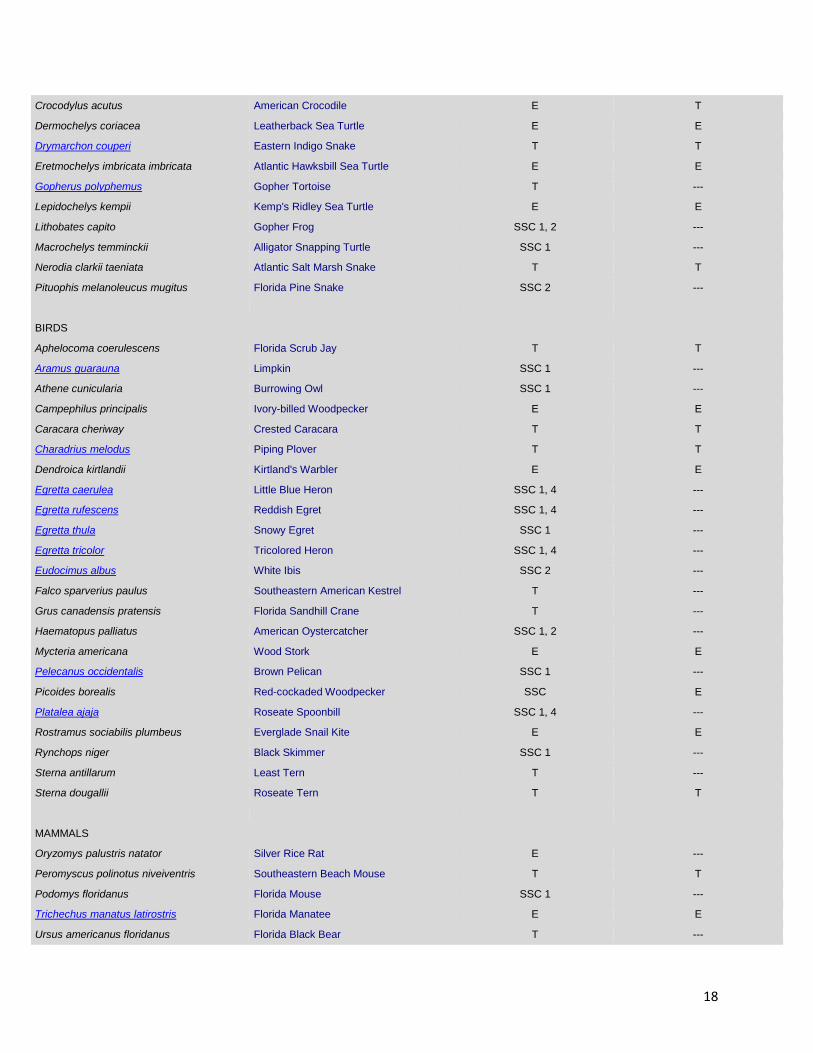
The IRL Species Inventory List consists of many endangered, threatened, commercially exploited, and species of special concern for the state of Florida. A key to the listing status and species is given in Figure 2. There are numerous plants, fish, reptiles, amphibians, birds, and mammals that comprise the list of species within the lagoon that are important to the food web and the overall health of the IRL ecosystem. The following paragraphs discuss five species that are of special concern, are threatened, or are endangered. The species used as examples are good indicators of the health within the IRL watershed and contribute to the overall success of a healthy ecosystem.
Johnson’s seagrass, Halophila johnsonii, (Figure 3) is a flowering saltwater plant found only in southeast Florida, in the southern half of the lagoon. The species is short and only one to two inches long, with paired leaves and central veins originating from a single node on a rhizome. It can be found in deeper water and shallow shoals (SJRWMD, 2014). The blade of the seagrass is the photosynthetic organ of the plant,
3
and the rhizome anchors it to the substrate, helps obtain nutrients and excrete waste, and functions in reproduction (Rey and Rutledge, 2001).
The Florida Manatee, Trichechus manatus latirostris, (Figure 4) is Florida’s state marine mammal. The manatee is a warm-blooded herbivore that lives in the IRL and feeds primarily on seagrasses and other vegetation. The manatees’ numbers have dwindled with time, prompting their listing as an endangered species. The decline in quantity of Johnson’s seagrass is directly proportional to the success of the manatee. In addition, anthropogenic activity within the lagoon also makes the manatee particularly vulnerable and contributes to a decline in manatee numbers. Indeed, the presence of the manatee contributes to the biodiversity of the lagoon.
The mangrove rivulus, Rivulus marmoratus, (Figure 5) is an extremely unique species inhabiting Florida marine habitats. The rivulus is capable of spending months out of water, inhabiting burrows of the great land crab and other marginal habitats that are likely undisturbed, which is why its numbers are likely underestimated. The rivulus is the only simultaneous hermaphroditic vertebrate of its kind. Its body color is generally reflective of its habitat, with light body color reflecting water with high turbidity and light substratum and dark body color reflecting that of dark bottoms. This fish tolerates ranges of salinity and temperature and its furthest range north is within the IRL (Smithsonian Marine Station at Fort Pierce, 2001).
The Atlantic Salt Marsh Snake, Nerodia clarkia taeniata, (Figure 6) is found only in a coastal strip in Volusia county in the IRL. The small marsh snake is mostly terrestrial in nature and thrives primarily in muddy littoral areas of the marsh. However, they have been spotted swimming through calm waters within the IRL. It is one of the few successful snakes surviving in estuarine systems, despite its lack of organs to excrete salt water (Smithsonian Marine Station in Fort Pierce, 2001). It is a threatened species in the lagoon and quite vulnerable to anthropogenic activity.
The Brown Pelican, Pelecanus occidentalis, (Figure 7) is found in all habitats along the IRL. It is a species of special concern because it’s highly vulnerable to habitat modification, environmental alteration, and human exploitation. Evidence of their drastic reduction in numbers could be seen early in the 20th century, due to the use of pesticide effects on nesting behavior and reproduction rates (Smithsonian Marine Station in Ft. Pierce, 2010). In the IRL, the brown pelican will hopefully continue to thrive.
Role of Wetlands:
In addition to species diversity within the lagoon, wetlands play an integral role in the quality of fresh water flowing into the lagoon from tributaries, canals, storm water drains,
4
and other sources of runoff. Many species, including the threatened Atlantic Salt Marsh Snake, discussed previously, depend on the littoral areas of the coastal wetland marshes throughout their existence. Other species depend on the wetland marshes throughout some time in their lifecycle. Wetlands consist of salt marshes and mangrove forests that are important components of estuarine and coastal systems in the IRL. These types of habitats play important roles in both terrestrial and aquatic food cycles. And, wetlands are efficient in their capacity to naturally filter water by the removal of excess nutrients and pollutants from upland runoff before reaching the lagoon. Wetlands also provide many types of habitats suitable for invertebrates, fish, birds, and others, while providing protection against coastal erosion.
Vegetation in the IRL:
The north end of the lagoon is primarily populated with grassy, salt tolerant species such as smooth cordgrass (Spartina alterniflora) in the lower end of the marsh, and salt grass (Distichlis spicata), saltwort (Batis maritime), perennial (Salicornia virginica) and annual glasswort (Salicornia bigelovii), and black rush (Juncus roemerianus) in the high marsh. In the southern portion of the lagoon, there are three species of true Florida mangroves shown in Figures 8 through 10: red (Rhizophora mangle), black (Avicennia germinans), and white (Laguncularia racemosa) mangroves. Red mangroves are typically found along the shore while black and white mangroves are normally found in the upper marsh. But, both red and black mangroves can be found in mixed marsh regimes where red are mixed in with cordgrass at the water’s edge, and black are mixed in with herbaceous vegetation (Rey and Rutledge, 2006). Mangroves provide many essential functions in the IRL, including storm buffers against some of Florida’s hurricanes and storms, and stabilization of shore lines and soils, which enhance water quality and reduce turbidity (PBC ERM, 2013). Mangroves provide safe havens for recreational, sport, threatened and endangered species, and nesting habitat for many juvenile species.
Economic Value:
The IRL Economic Assessment and Analysis Update performed in 2008 for the IRL National Estuary Program, in cooperation with the St. John’s and South Florida Water Management Districts, established recreational and economical values for residents and visitors to the 5 counties comprising the IRL. In Figure 11, an annual value of more than 3.7 billion dollars was estimated for the IRL in its current environmental condition (Indian River Lagoon Economic Assessment and Analysis Update, 2008). Recreational expenditures consist of boat purchases, repairs, dock usage and slip rental fees, and
5
refer to the percentage of time spent out on the lagoon. The hope is that recreational use puts a value to the willingness of humans to pay for utilization of the lagoon, in addition to the amount they are already spending. Types of recreation in the lagoon consist of power boating, sail boating, kayaking, hunting, recreational fishing (fin fishing, shrimp netting, and shell fishing), wildlife viewing, photography, and educational learning purposes. Non-use value of the lagoon is defined as the willingness of people to pay a one-time tax to maintain the IRL in its current state, regardless of whether or not they recreate on the lagoon. Annualized real estate value is the contribution of the lagoon to the price of real estate for people living within 0.3 miles of the lagoon. It is a good real estate value to support the willingness of people to live on the IRL. Income generated is a value determined by the willingness of people to recreate on the lagoon, support lagoon research, education, restoration, and the commercial fishing industry. Restoration, research, and education expenditures are the willingness of other entities like concerned parties and local and federal governments to pay for and study the lagoon. Commercial fishing dockside values are the market value of fish harvested from the lagoon in 2006, and include the willingness of consumers to pay for fish species from the IRL. The included table clearly shows how much of a contribution the IRL generates in terms of recreation, monetary value, diversity of species, education, and research opportunities.
Current Conditions:
A growing population and coastal development has contributed to an increase in stormwater and tributary discharge carrying pollutants into the lagoon, which have scientists concerned about declines in water quality, habitat loss, and other negative impacts on the quality of water flowing into the lagoon (DeFreese, 2005). Today, the IRL watershed receives drainage from 1.4 million acres, as opposed to approximately 572,000 acres in 1916 (FDEP, 2014). Some of the suspected culprits are drainage from agricultural lands around Lake Okeechobee, mosquito control impoundments, construction and dredging changing flow patterns in the lagoon, limited tidal flushing (FDEP, 2014), and inadequate sewage treatment, street runoff, and effluent from septic tanks in the area (Sea Turtle Conservancy, 2013).
Water quality in the lagoon is affected by the discharge of water from Lake Okeechobee into the lagoon. Lake Okeechobee is situated in the heart of agricultural fields that are ideal for growing sugar-cane, rice, turfgrass sod, and vegetables. Fertilizers are necessary to increase crop yields, but Nitrogen and Phosphorus fertilization may contribute to eutrophication of surface waters draining these agricultural lands. Urban stormwater runoff can also be a major source of nutrients to surface waters entering the IRL. Lake Okeechobee is surrounded by the Herbert Hoover Dike, which cannot
6
tolerate high water levels without breaching its borders. Because of the concern about flooding to the nearby communities of Pahokee, South Bay, and Clewiston, it’s necessary to release water more frequently (Audubon Florida, 2013).
Research has shown significant degradation of water quality when there is an interruption of the free flow of nutrients and organisms between wetlands and the lagoon. The interruption results in an isolation of habitat necessary to support fish species during critical life cycle times, and an elimination of natural wetland marsh vegetation, adversely impacting seagrass species (Rey and Connelly, rev. 2012). To keep mosquito breeding in check, and to accommodate an increasing human population growth, approximately 75% of the watersheds marshes have been impounded for mosquito control, thereby reducing or eliminating connection with open waters of the lagoon (FDEP, 2014). Figure 12 shows a typical mosquito control impoundment that is constructed with a dike around the perimeter to allow for the area to be flooded during the breeding season of the salt marsh mosquito. A number of water control structures are used to artificially alter water level depths and control the timing of discharge by way of pumps, culverts, spillways, and weirs.
Hydrologic Changes to the IRL:
The Intracoastal Waterway was constructed and dredged to be a deep channeled, navigable waterway. Because of the nature of this activity, the way in which water flows in the lagoon has been altered. Dredged material from the channel has even been used to create spoil islands. In addition, the further construction of various causeways over the lagoon has contributed to the narrowing of open-water area, affecting lagoon water circulation, which is mostly wind driven. There is an increased vulnerability to pollutants because of the very shallow nature of the lagoon and limited tidal flushing with the Atlantic Ocean (FDEP, 2014).
Inadequate sewage treatment, storm water runoff, and septic tank effluent are considered non-point sources of pollution in the IRL. The five counties within the IRL watershed boundary are all dealing with the effects increased impervious surfaces have on stormwater runoff. Because of anthropogenic activity, approximately twice as much freshwater enters the system as it did 100 years ago (FDEP, 2014). Most of the runoff is discharged within the first few hours after a major storm event (FDEP, 2014). There are also approximately 237,000 septic tanks in just three of the five counties that border the lagoon (Sea Turtle Conservancy, 2013). There are approximately 120,000 septic systems comprising the Treasure coast of Indian River, St. Lucie, and Martin counties (Save the Lagoon, 2013). At least half are grandfathered in before stricter regulation came along in 1983, which means that those installed before 1983 could potentially be
7
leaking sewage into the soil/groundwater that drains into the lagoon (Save the Lagoon, 2013). Some of the cities and counties are already in the process of installing water and sewer infrastructure to offset non-point pollution from septic tanks (SJRWMD, 2002 Update).
In addition to addressing factors affecting the IRL, it is important to elaborate on the impacts these factors have had and will continue to have on the health of the watershed and all species that utilize it. Poor water quality is the suspected cause for algal blooms and is primarily responsible for several recent algal superblooms that have led to the death of many seagrass species. For example, as a cause and affect scenario, the loss of seagrass has contributed to health concerns for marine and human species, declines in native plant and animal species, increases in invasive species, economic impacts on commercial and sport fishing, and reductions in recreational numbers of people boating, swimming, and kayaking.
Because the interaction of ground and surface water in the IRL is so significant, it’s appropriate to define water quality in terms of ground water statistics in the Surficial and Floridan Aquifers seen in Figures 13 and 14 below (Water Quality Assessment, FDEP, 2008). The surficial aquifer in the IRL watershed is an unconfined layer of undifferentiated sediments and peat deposits between approximately 50 and 100 feet in thickness. The aquifer is thicker in the southern portion of the IRL basin. On the other hand, the Floridan aquifer is confined and consists of more permeable layers of sand, shell, and limestone. The Floridan aquifer is approximately 50 and 200 feet in thickness in the IRL basin and is an important local water source.
Currently there are 38 segments along the IRL on the impaired list (FDEP, 2014), and as a way in which to improve water quality, Total Maximum Daily Loads (TMDLs) were implemented and required (FDEP, 2008). TMDLs are defined as written analyses to ensure that a water body will attain and maintain water quality standards, including consideration of current pollutant loads and potential increases in pollutant loads (EPA, 2012).
Pollutants:
According to the FDEP, pollutants responsible for excessive chlorophyll growth are mainly considered to be nitrogen and phosphorus. Both exist naturally but their elevated concentrations in the IRL are likely the result of anthropogenic activity. Nitrogen is derived from sources like atmospheric deposition, domestic wastewater, and agricultural and residential fertilizers (FDEP, 2008). Total Kjehldahl nitrogen (TKN) is a combination of organically bound nitrogen and ammonia, and its concentration in waters is an indicator of industrial pollution and sewage inputs. Phosphorus can be derived
8
from historical accumulation, as well as recent anthropogenic activity, and is problematic due to its binding characteristics dependent on the types of soils found. Research has shown that phosphorus adsorbs to sediments enriched with iron in aerobic conditions, and can be released after burial in anaerobic conditions. Iron is a metal that is naturally occurring in the IRL, but anthropogenic activity can cause localized concentrations of iron that negatively impact the water column (FDEP, 2008). Spoil islands consisting of peat and muck in the IRL are associated with high phosphorus content and retention, and seasonal fluctuations within the lagoon can contribute to the binding or release of phosphorus in the water column.
Dissolved oxygen (DO) can be attributed to poor water circulation caused by high inputs of organic matter or elevated primary production in the IRL, leading to increased oxygen consumption and decreased oxygen concentration in the water (FDEP, 2008). Coliform bacteria is also found in the IRL and contributes to poor water quality.
Eutrophication, Algal Blooms, and Seagrass:
An unprecedented loss of seagrass acreage throughout the lagoon was documented in 2011 due to two specific blooms of phytoplankton extending from the Titusville area to just north of the Fort Pierce Inlet as can be seen in Figure 15 (SJRWMD, 2014).
The smaller of the two blooms extended from Eau Galle to the Fort Pierce area, and covered approximately 47,000 acres, while the other, much larger bloom, covered approximately 130,000 acres north of Eau Galle to the Scottsmoor area (SJRWMD, 2014). The blooms followed a 2-year drought where there were few rain events, less runoff, and therefore, fewer nutrients entering the lagoon. Scientists theorize that cool weather and less aquatic macrophyte numbers to absorb nutrients contributed to a flux in available nutrients (SJRWMD, 2014). Not only did the availability of nutrients change, theories propose that the severe decrease in water temperatures led to the reduction of grazing pressures on phytoplankton (algae) (SJRWMD, 2014). A second cold snap in combination with the drought-induced hypersalinity might have lessened the recovery of macrophytes, grazers, or other biota impacted with the first cold snap (SJRWMD, 2014). With algal blooms of this magnitude, the lagoon waters were no longer transparent. Algae blocked the sunlight driving photosynthesis and affected the ability of seagrass survival, and approximately 60% of seagrass beds were decimated.
The extensive loss of seagrass beds can also directly affect the regional and local economy within the IRL watershed that depends on its fisheries and harvest of the sea trout and other species strongly tied to seagrass coverage. Data from Environmental Protection Agency (EPA) reports indicate declines in excess of 50% in commercial catches of sea trout, large yearly fluctuations of other species like black mullet,
9
decreases in snook and red drum populations, the disappearance of oysters in some areas of the IRL, and major decreases in commercial blue crab (Bioscience, 2002). It is thought that seagrasses may contribute $5,000-$10,000 per acre per year to the local economy. The superbloom is suspected to have caused a substantial loss of $235-$470 million for every year that seagrass remains absent (SJRWMD, 2014). The overall economic worth of the IRL is said to be in the neighborhood of $750 million per year (DeFreese, 2005).
The FDEP’s Water Quality Assessment Report has documented changes in the health of the lagoon due to numerous wildlife-related diseases and mortalities, the presence of non-native species, and the decrease in native species within the boundaries of the IRL. Many resident dolphins have Lobo mycosis, a skin disease, and large numbers of green sea turtles have fibropapilloma lesions, as well as many hard clams showing an increase in tumors. There has been a decrease in the number of horseshoe crabs, while the non-native Australian spotted jellyfish and exotic macroalga, Caulerpa brachypus, have appeared in larger numbers within the lagoon. Further research is being conducted by the Florida Department of Environmental Protection to ascertain some of the relationships between biotoxins and these observed marine animal issues (FDEP, Water Quality Assessment Report, IRL, 2008).
Legal and Restoration Efforts:
The Florida legislature passed the Surface Water Improvement and Management Act (SWIM) in 1987, designed to improve water quality and maintain and improve natural habitat in the IRL and other water bodies within the state. Since 1987, many revisions have been written to update SWIM’s projected failures and successes, documenting changes in long term goals and approaches. Together, the SJRWMD and the SFWMD work jointly to oversee all aspects of improving the IRL watershed. In 1991, the EPA joined forces with the Districts, and the IRL became part of the National Estuary Program Act (IRLNEP or NEPA) (Bioscience, 2002). Before the algal superbloom of 2011, seagrass coverage in the lagoon had been steadily climbing. The installation of baffle boxes to trap sediments before reaching the lagoon, muck dredging of spoil islands, coastal wetland projects, including the reconnection of impoundment structures, water quality and sediment studies, seagrass mapping and monitoring, water quality monitoring, and fish population monitoring, all contributed to the progress and improvements made in the lagoon. The advent of the algal superbloom in 2011 changed the focus toward increasing seagrass acreage. In the spring of 2013, the Indian River Lagoon Protection Initiative (IRLPI) was launched to better understand the lagoon’s complex ecosystem. The primary focus is to increase scientific focus on the 2011 algal superbloom through monitoring, data collection, field and lab analysis, and
10
modeling. This investigation will supplement and augment other programs while providing the basis for understanding and maximizing lagoon recovery and restoration. The IRLPI will focus on a completion of algal bloom investigations, a partnership with the National Estuary Program and stakeholders to improve lagoon health, identification of a sustainable plan to reduce nutrients implemention, creation of an action plan on how to control and/or lessen algal blooms, and promotion of effective communication with stakeholders. Work will focus on strategies for controlling algae blooms, enhancing the biologically diverse estuary, facilitating seagrass growth and transplanting, targeting removal of drift algae, describing imbalances contributing to algae formation, and providing recommendations for addressing anthropogenic sources of pollution and nutrients (IRLPI, SJRWMD, 2014).
In addition, the Indian River Lagoon “Blueway” Initiative is a comprehensive program that is based on the premise that the protection of wetlands and uplands within the IRL watershed will best be protected by the acquisition of these lands to protect living resources and maintain clear public access to their resources (DeFreese, 2005). Approximately 9,000 acres have been identified for future acquisition (DeFreese, 2005). In 2005, Florida Forever was created as the premier land acquisition program.
Conclusions:
Along with continued success in legislative acts, initiatives, and effective public awareness, there are numerous viable educational tools and actions we can take that contribute to creating positive environmental effects within the IRL basin. According to the SJRWJD, people within the IRL watershed can utilize fertilizers sparingly and wisely. It is estimated that a single pound of fertilizer will grow more than 500 pounds of algae in the lagoon (SJRWJD, 2014). Individuals can pick up after their pets, as domestic animal waste can be a significant source of nutrients and coliform bacteria. When landscaping, all yard clippings, oils, trash, etc. should be picked up and only rain should be sent down storm drains. Landscaping with native Florida plants require less water and fertilizers as well as providing habitat for animals and supporting biodiversity. If non-native and invasive species are controlled by land owners within the IRL, the species will continue to remain endemic (SJRWMD, 2014).
The Indian River Lagoon’s rich history, unique geographical location, high diversity of species, and economic value contribute to its designation as one of the most biologically diverse watersheds in existence. The factors affecting and impacting the lagoon are complex in nature, but the degree of importance placed on efforts to save the lagoon, are underway. SWIM consistently undergoes revisions to approach ways in which anthropogenic activity can minimize its impacts on the lagoon. In conjunction with the
11
aforementioned, extensive public awareness and education, as well as coordination with government and stakeholders, the water quality of the lagoon will continue to improve despite population growth and anthropogenic activity.
12
References:
Audubon Florida, 2013. “Crisis in the Indian River Lagoon: Solutions for an Imperiled Ecosystem.” August 2013. Retrieved from: http://fl.audubon.org/sites/default/files/documents/audubon_indianriverlagoon_solutions_august2013_0.pdf.
BioScience, 2002. Dybas, Cheryl Lyn. “Florida’s Indian River Lagoon: An Estuary in Transition.” 52 (7) 554-559.
De Freese, D.E. 2005. "Connecting People to the Sea: The Indian River Lagoon". In Naturally Central Florida: Fitting the Pieces Together. Keith Schue, Editor. "myregion.org" and University of Central Florida. Orlando, FL. Pp 12-15.
Environmental Protection Agency (EPA), 2012. Chapter 3: Establishing and Implementing TMDLs. Website retrieved from: http://water.epa.gov/lawsregs/lawsguidance/cwa/tmdl/TMDL-ch3.cfm.
Florida Department of Environmental Protection, 2008. Water Quality Assessment Report. Indian River Lagoon. Central District, Group 5 Basin.
Florida Department of Environmental Protection, 2014. “Learn About Your Watershed. Indian River Lagoon Watershed.” Water Resource Management and Environmental Assessment and Restoration. Florida’s Water: Ours to Protect. Retrieved June 12, 2014.
Florida Department of Environmental Protection, 2014. “Final Lists of Impaired Waters for the Group 5 (Cycle 2) Basins.” Retrieved from website: http://www.dep.state.fl.us/water/watersheds/assessment/adopted_gp5-c2.htm.
Hill, K., 2001. Smithsonian Marine Station at Fort Pierce. “What is a Lagoon?” Updated August 1, 2001.
Indian River Lagoon Economic Assessment and Analysis Update, 2008 FINAL REPORT, Contract No. 247060. Hazen and Sawyer Environmental Engineers and Scientists.
Palm Beach County, Environmental Resources Management, 2013.
Rey, Jorge R. and Connelly, C. Roxanne, 2001. “Mosquito Control Impoundments.” University of Florida IFAS Extension. Revised June 2012.
Rey, Jorge and Rutledge, C. Roxanne, 2001. “Coastal Wetlands of the Indian River Lagoon.” University of Florida IFAS Extension. Revised January 2006.
13
Rey, Jorge R. and Rutledge, C. Roxanne, 2001. “Seagrass Beds of the Indian River Lagoon.” University of Florida IFAS Extension. Revised January 2006 and September 2013.
Save the Lagoon, 2013. “Indian River Lagoon is in Crisis.” Savethelagoon.org. Posted on August 11, 2013.
SeaTurtle Conservancy Blog, 2013. “What’s Happening to the Indian River Lagoon? An Update from STC.” Posted on October 15, 2013.
SJRWMD and SFWMD, 1994. Surface Water Improvement (SWIM) Plan for the Indian River Lagoon. Appendices A-1 and B.1. Revised September 1994.
SJRWMD and SFWMD, 2002. Indian River Lagoon. Surface Water Improvement and Management (SWIM) Plan, 2002 Update.
SJRWMD, 2013. “Indian River Lagoon: background and history.” Updated on 4-5-2013.
SJRWMD, 2013. “What people in the region can do to help the Indian River Lagoon.” Updated on 4-5-2013.
SJRWMD, 2013. “Fast Facts about the Indian River Lagoon.” Posted on 4-5-2013.
SJRWMD, 2013. “The ‘perfect storm’ and 2011 superbloom.” Updated on 5-16-2013.
SJRWMD, 2013. “The Indian River Lagoon: An estuary of national significance.” Updated on 10-4-2013.
SJRWMD, 2013. “The Indian River Lagoon Protection Initiative.” Updated on 11-5-2013.
SJRWMD, 2014. “Seagrasses of the Indian River Lagoon.” Posted on 5-7-2014.
SJRWMD, 2014. “The Indian River Lagoon protection projects.” Updated on 1-13-2014.
Smithsonian Marine Station. “An Overview of the Indian River Lagoon Species Inventory Project.” Smithsonian Marine Station at Fort Pierce. Retrieved June 9, 2014.
Smithsonian Marine Station. “Special Status Species of the Indian River Lagoon.” Smithsonian Marine Station at Fort Pierce. Updated on August 14, 2011.
Smithsonian Marine Station. “Species Name: Nerodia clarkia and Rivulus marmoratus.” Smithsonian Marine Station at Fort Pierce. Updated on July 25, 2001.
14
Smithsonian Marine Station. “Species Name: Pelecanus occidentalis.” Smithsonian Marine Station at Fort Pierce. Updated on September 28, 2010.
15
Figures, Maps, Tables:
Figure 2. Indian River Lagoon Species Inventory List
Smithsonian Marine Station at Fort Pierce, 2014
KEY TO LISTING STATUS
E - Endangered: According to the Endangered Species Act of 1973, any species which is in danger of extinction throughout all or a significant portion of its range.
T - Threatened: According to the Endangered Species Act of 1973, any species which is likely to become an endangered species within the foreseeable future throughout all or a significant portion of its range.
T1 - Threatened due to similarity of appearance
CE - Commercially Exploited
SSC - Florida State Species of Special Concern
Figure 1. Indian River Lagoon Map Sea Turtle Conservancy, 2014
16
Note: These species are listed by the Florida Fish & Wildlife Conservation Commission under one or more of the following criteria:
1: Species has a significant vulnerability to habitat modification, environmental alteration, human disturbance, or human exploitation which, in the foreseeable future, may result in its becoming a threatened species unless appropriate protective or management techniques are initiated or maintained.
2: Species may already meet certain criteria for designation as a threatened species, but for which conclusive data are limited or lacking.
3: Species may occupy such an unusually vital or essential ecological niche that, should it decline significantly in numbers or distribution, other species would be adversely affected to a significant degree.
4: Species has not sufficiently recovered from past population depletion.
5: Species occurs as a population either intentionally introduced or being experimentally managed to attain specific objectives, and the species of special concern prohibitions in Rule 68A-27.002, F.A.C., shall not apply to species so designated, provided that the intentional killing, attempting to kill, posession or sale of such species is prohibited.
SPECIES NAME COMMON NAME FL STATE STATUS US FEDERAL STATUS
PLANTS
Acrostichum aureum Golden Leather Fern T ---
Argusia gnaphalodes Sea Rosemary E ---
Asimina tertramera Four-petal Pawpaw E E
Cladonia perforata Cup Lichen E E
Conradina grandiflora Largeflower False Rosemary T ---
Dicerandra immaculata Lakela's Mint E E
Halophila johnsonii Johnson's Seagrass --- T
Harrisia fragrans Caribbean Apple Cactus E E
Opuntia stricta Erect Prickly Pear T ---
Osmunda regalis Royal Fern CE ---
Polygala smallii Tiny Polygala E E
Tillandsia balbisiana Northern Needleleaf T ---
Tillandsia fasciculata Giant Airplant E ---
Tillandsia utriculata Spreading Airplant E ---
Warea carteri Carter's Mustard E E
FISHES
Acipenser brevirostrum Shortnose Sturgeon E E
Pristis pectinata Smalltooth Sawfish E E
Rivulus marmoratus Mangrove Rivulus SSC 1 ---
REPTILES & AMPHIBIANS
Alligator mississippiensis American Alligator SSC 1, 3 T1
Caretta caretta Loggerhead Sea Turtle T T
Chelonia mydas Green Sea Turtle E E
17
Crocodylus acutus American Crocodile E T
Dermochelys coriacea Leatherback Sea Turtle E E
Drymarchon couperi Eastern Indigo Snake T T
Eretmochelys imbricata imbricata Atlantic Hawksbill Sea Turtle E E
Gopherus polyphemus Gopher Tortoise T ---
Lepidochelys kempii Kemp's Ridley Sea Turtle E E
Lithobates capito Gopher Frog SSC 1, 2 ---
Macrochelys temminckii Alligator Snapping Turtle SSC 1 ---
Nerodia clarkii taeniata Atlantic Salt Marsh Snake T T
Pituophis melanoleucus mugitus Florida Pine Snake SSC 2 ---
BIRDS
Aphelocoma coerulescens Florida Scrub Jay T T
Aramus guarauna Limpkin SSC 1 ---
Athene cunicularia Burrowing Owl SSC 1 ---
Campephilus principalis Ivory-billed Woodpecker E E
Caracara cheriway Crested Caracara T T
Charadrius melodus Piping Plover T T
Dendroica kirtlandii Kirtland's Warbler E E
Egretta caerulea Little Blue Heron SSC 1, 4 ---
Egretta rufescens Reddish Egret SSC 1, 4 ---
Egretta thula Snowy Egret SSC 1 ---
Egretta tricolor Tricolored Heron SSC 1, 4 ---
Eudocimus albus White Ibis SSC 2 ---
Falco sparverius paulus Southeastern American Kestrel T ---
Grus canadensis pratensis Florida Sandhill Crane T ---
Haematopus palliatus American Oystercatcher SSC 1, 2 ---
Mycteria americana Wood Stork E E
Pelecanus occidentalis Brown Pelican SSC 1 ---
Picoides borealis Red-cockaded Woodpecker SSC E
Platalea ajaja Roseate Spoonbill SSC 1, 4 ---
Rostramus sociabilis plumbeus Everglade Snail Kite E E
Rynchops niger Black Skimmer SSC 1 ---
Sterna antillarum Least Tern T ---
Sterna dougallii Roseate Tern T T
MAMMALS
Oryzomys palustris natator Silver Rice Rat E ---
Peromyscus polinotus niveiventris Southeastern Beach Mouse T T
Podomys floridanus Florida Mouse SSC 1 ---
Trichechus manatus latirostris Florida Manatee E E
Ursus americanus floridanus Florida Black Bear T ---
18
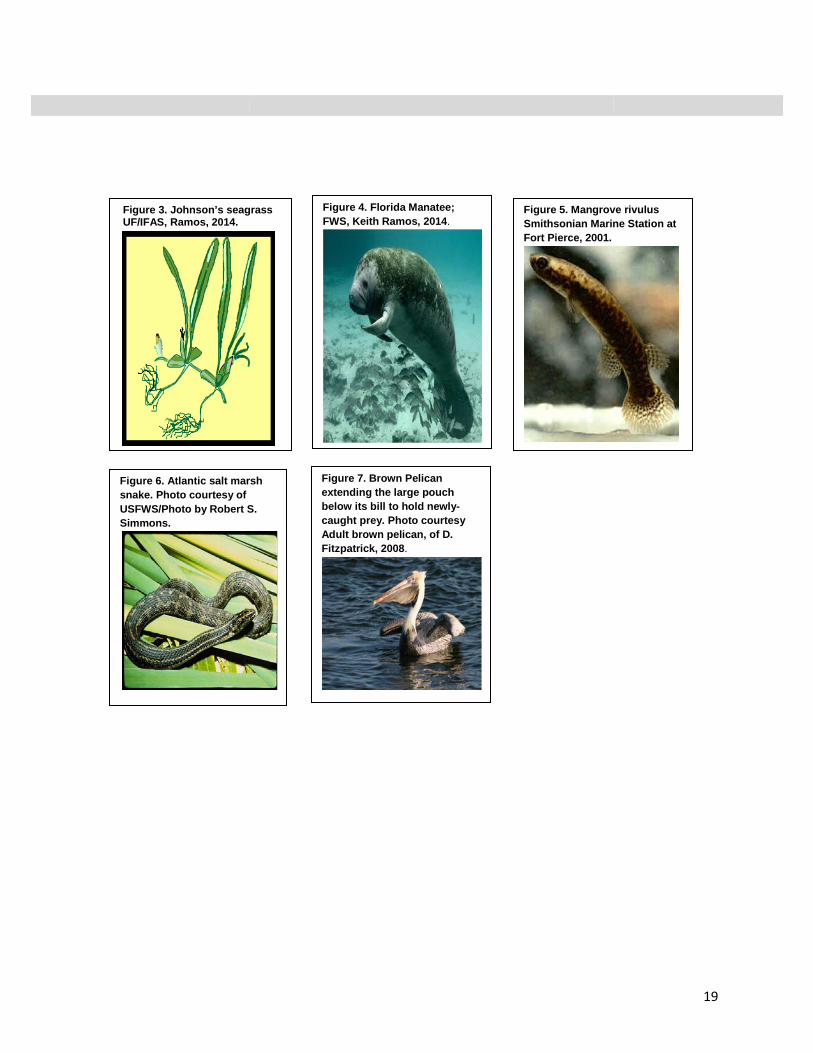
Figure 6. Atlantic salt marsh snake. Photo courtesy of USFWS/Photo by Robert S. Simmons.
Figure 4. Florida Manatee; FWS, Keith Ramos, 2014.
Figure 5. Mangrove rivulus Smithsonian Marine Station at Fort Pierce, 2001.
Figure 7. Brown Pelican extending the large pouch below its bill to hold newly-caught prey. Photo courtesy Adult brown pelican, of D. Fitzpatrick, 2008.
Figure 3. Johnson’s seagrass UF/IFAS, Ramos, 2014.
19
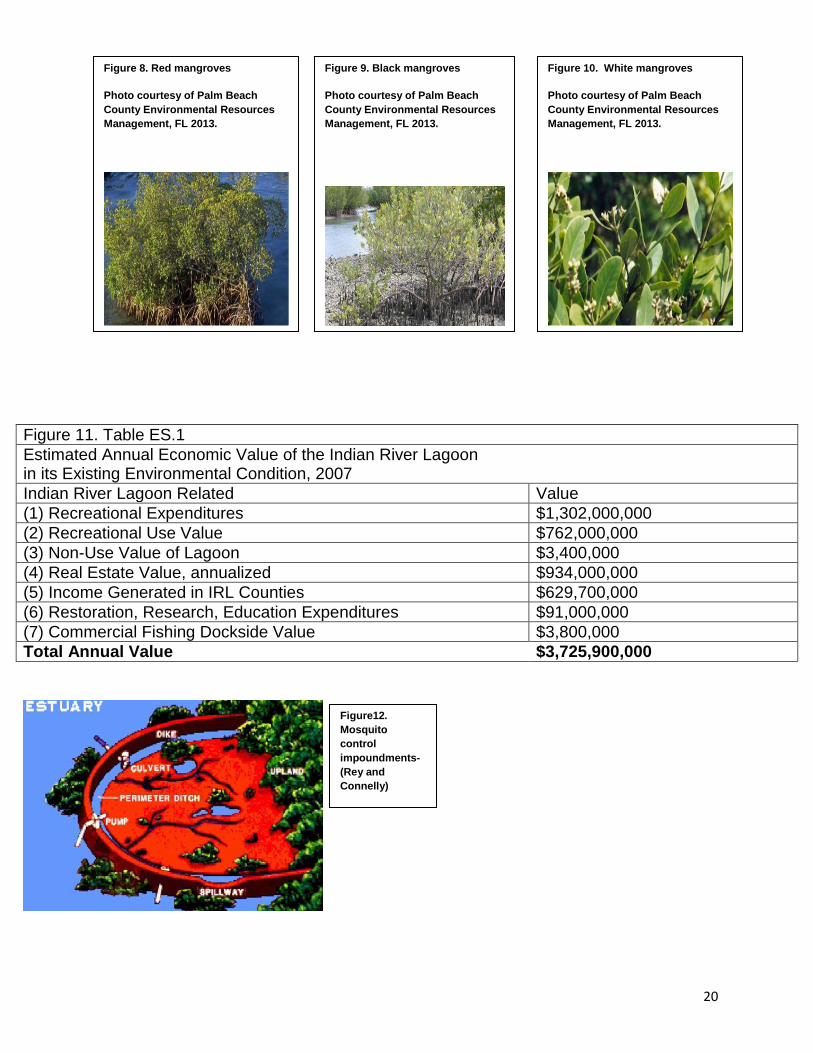
Figure 11. Table ES.1 Estimated Annual Economic Value of the Indian River Lagoon in its Existing Environmental Condition, 2007 Indian River Lagoon Related Value (1) Recreational Expenditures $1,302,000,000 (2) Recreational Use Value $762,000,000 (3) Non-Use Value of Lagoon $3,400,000 (4) Real Estate Value, annualized $934,000,000 (5) Income Generated in IRL Counties $629,700,000 (6) Restoration, Research, Education Expenditures $91,000,000 (7) Commercial Fishing Dockside Value $3,800,000 Total Annual Value $3,725,900,000
Figure 10. White mangroves
Photo courtesy of Palm Beach County Environmental Resources Management, FL 2013.
Figure 9. Black mangroves
Photo courtesy of Palm Beach County Environmental Resources Management, FL 2013.
Figure 8. Red mangroves
Photo courtesy of Palm Beach County Environmental Resources Management, FL 2013.
Figure12. Mosquito control impoundments- (Rey and Connelly)
20
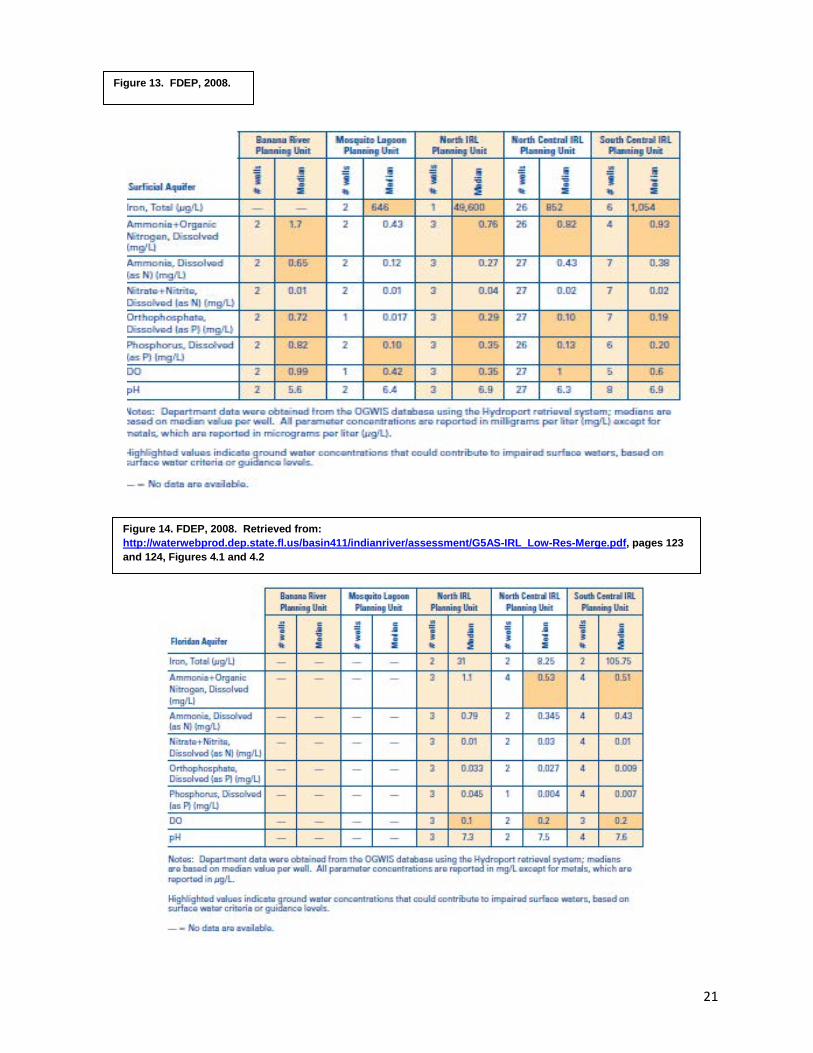
Figure 13. FDEP, 2008.
Figure 14. FDEP, 2008. Retrieved from: http://waterwebprod.dep.state.fl.us/basin411/indianriver/assessment/G5AS-IRL_Low-Res-Merge.pdf, pages 123 and 124, Figures 4.1 and 4.2
21
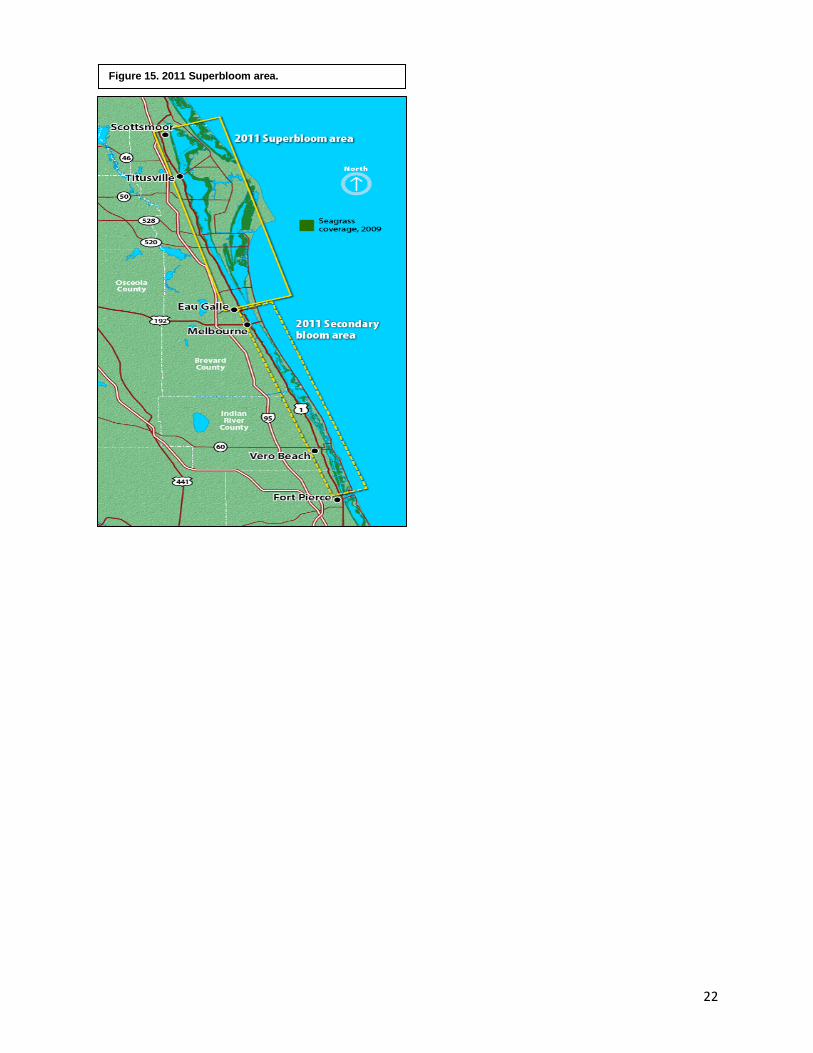
Figure 15. 2011 Superbloom area.
22