Embed Size (px)
Citation preview

An Overview of Water Management and
Planning in Nevada
Maria E. JaureguiNovember 16, 2010

Overview History Population CharacteristicsEnvironmental Considerations

Early History
Las Vegas first visited by Spanish in 1830s
Deposits of silver, gold attract miners 1859
Admitted as 36th state in 1863 Became outpost of railroad in 1905

Where does the water come from?
Las Vegas valley served by artesian springs until 1962
Unexpected growth and ignorance of region’s hydrology lead to subsidence
Need for reliable, accessible source
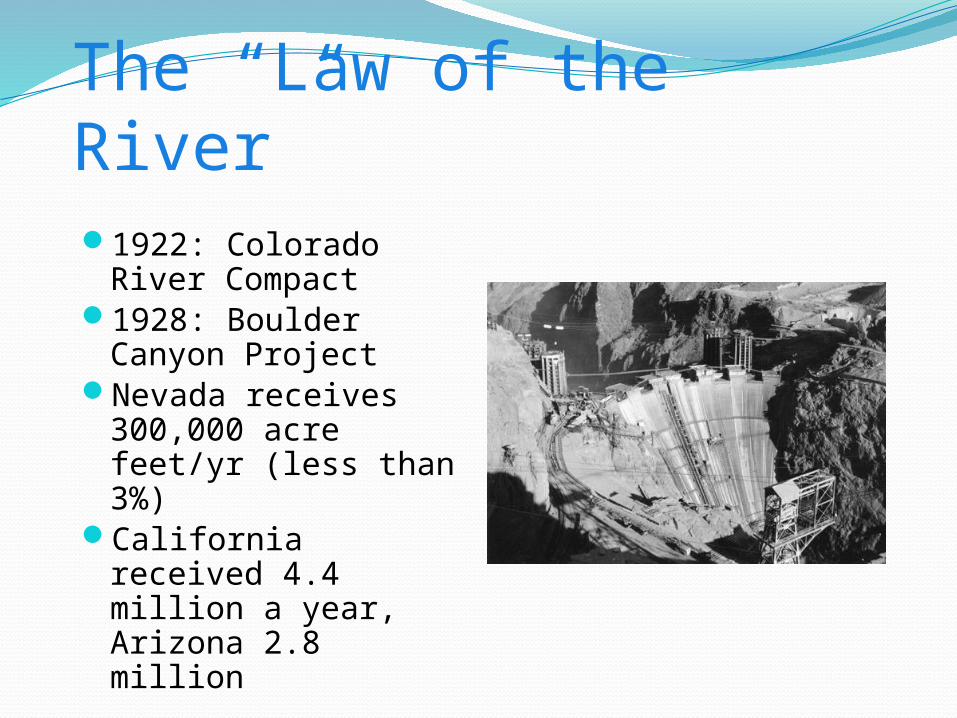
The “Law of the River”1922: Colorado River
Compact1928: Boulder
Canyon ProjectNevada receives
300,000 acre feet/yr (less than 3%)
California received 4.4 million a year, Arizona 2.8 million

Where does the water come from in Northern Nevada?
Truckee River provides 40-80 million gallons/day
Fed by Sierra Nevada, low evapotranspiration
85% from Truckee, 15% groundwater wells

Who uses the water?
Nearly 90% of Southern Nevada’s water is drawn from Colorado River
Agricultural users account for nearly 70% of all consumptive use
In Southern Nevada outdoor uses account for 70% of municipal consumption
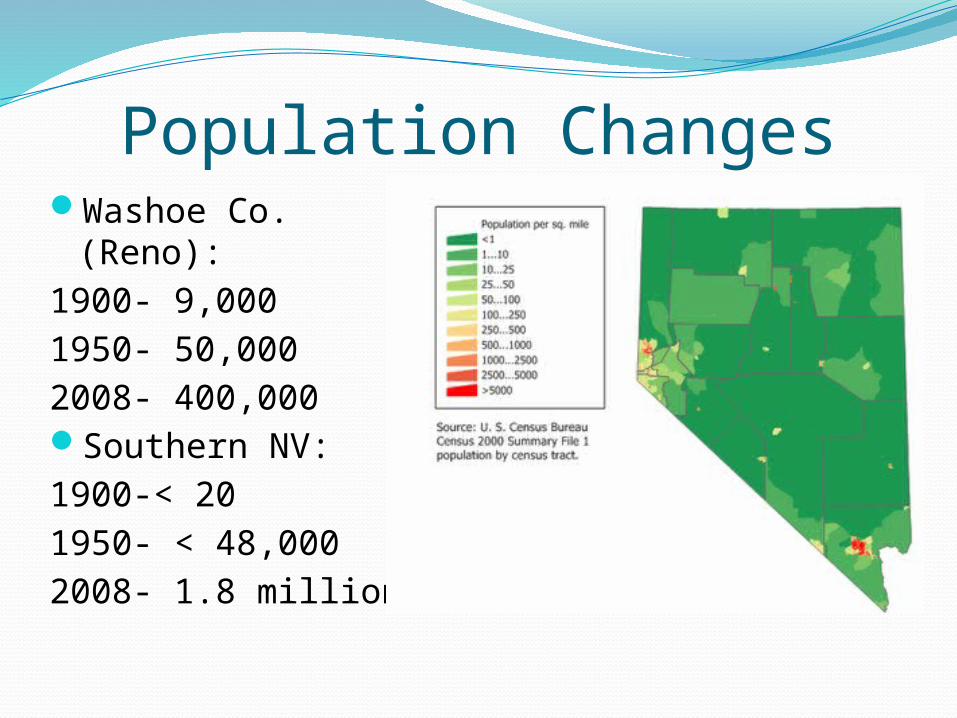
Population ChangesWashoe Co.
(Reno):1900- 9,000 1950- 50,0002008- 400,000Southern NV:1900-< 201950- < 48,0002008- 1.8 million

Population ProjectionsNorthern NV: Up
to 20,000/year400 acre ft
surplus, plus banked supply
Southern NV: Between 20,000-60,000/year
Lake Mead dry by 2021!

Pipe Dreams
Spring Valley & Snake Valley claims could deliver up to 90,000 af/year
Opponents include residents, Great Basin Water Network, Sierra Club, The Church of Latter Day Saints, The State of Utah, U.S. Parks and Wildlife
Hydrological studies show conflicting projections of availability
Reservoirs, “banked” water only augment supply
Sources: Forestry Images, Wikipedia

National problem?Lake Mead at
lowest levels since 1937
Shortages not limited to arid West
Top 10 Cities Impacted: Los Angeles, Houston, Fort Worth, Orlando, Atlanta, SF Bay Area

Water QualitySNWA, TMWA annual report indicate
water meets or exceeds federal guidelinesChlorinationContaminants include: Arsenic,
cryptosporidium, fluoride, giardia, pharmaceuticals, radon, sulfate, and perchlorate (rocket fuel!)
Urban runoff, ag contaminants, suspended solids from returned flows
Source: Las Vegas Valley Water District

Nevada Test Site
From 1951-1962 approximately 100 above ground tests conducted
From 1962-1992 over 800 subsurface tests conducted, several in aquifers or within 1000 feet of water table

Nuclear Fallout Dept. of Energy “monitors”
migration of radioactive particles with wells
NTS not considered a “top priority” despite potential magnitude of contamination
1992, 2000 Radiation Exposure Compensation Act (RECA): Provides pre-determined lump sum to uranium miners/ mill workers/ transporters, “onsite participants,” “downwinders”
Clark, Nye, Lincoln, White Pine Counties included in affected area

ConclusionsUnforeseen growth and lack of deep hydrologic
knowledge have greatly contributed to current crisis
Water managers across the state and region are obligated to pursue various courses of action to secure water for their customers
Thorough environmental studies should be conducted to assess water quality and threats posed by projects
Rural/Urban interests must be balancedConservation, cooperation with local and state
government to control growth must be firmly implemented