Embed Size (px)
Citation preview

An Update on TBSSs and Relatively Moist Environments
Matthew J. Bunkers2006 Spring Training

Three-Body Scatter Spike (TBSS)

TBSS Review
• Radar artifact typically associated with hail ≥ 1”(high POD and low FAR)
• Observed down-radial of ~62+ dBZ core(use 4-panel and/or all-tilts displays)
• May also indicate potential for damaging winds?
• More at P:\Training\8thGreatDivide\TBSS

Recent Trends
• At least two events in 2005 with TBSSs but only limited, or no, severe hail
• Another case around the same time with TBSSs and very large hail
• What’s going on here?

#1 – 10 August 2005, 2130z
Max Ref = 68.5 dBZ
Hgt50dBZ = 20,345 ft AGL
TBSS length = 8 nm
POSH = 50 %
MEHS = 1 ¼ “ (250%)
MLT = 11,180 ft AGL
WBZ = 9,849 ft AGL
RH700-300mb = 33 %
Max Obs. Hail = ½ “*** Next five sets of images are all the at same scale
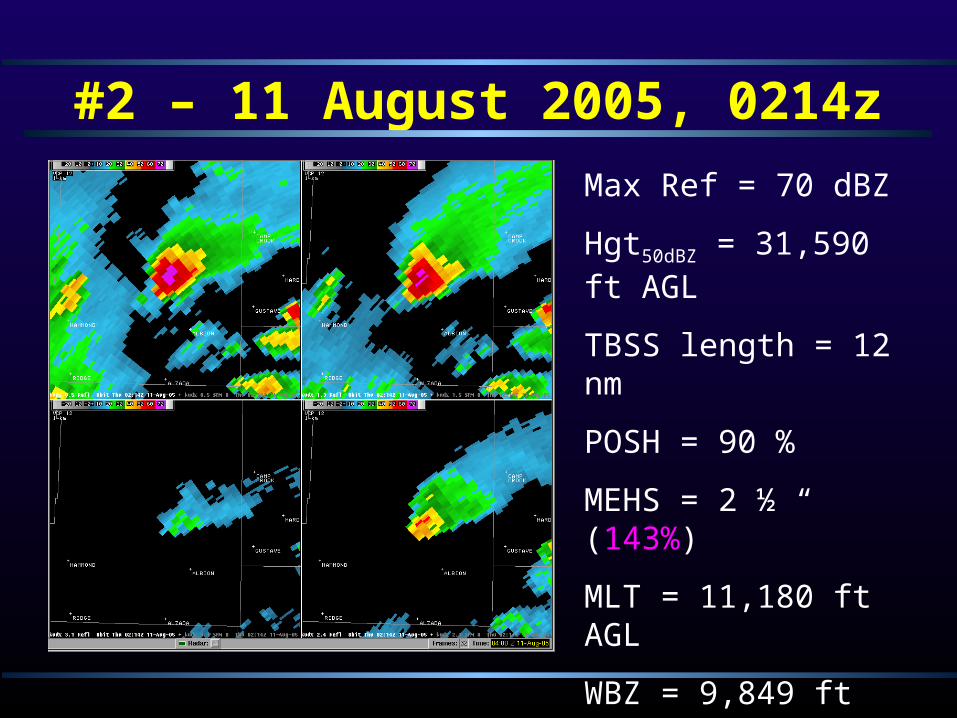
#2 – 11 August 2005, 0214z
Max Ref = 70 dBZ
Hgt50dBZ = 31,590 ft AGL
TBSS length = 12 nm
POSH = 90 %
MEHS = 2 ½ “ (143%)
MLT = 11,180 ft AGL
WBZ = 9,849 ft AGL
RH700-300mb = 33 %
Max Obs. Hail = 1 ¾ “

#3 – 25 July 2005, 0438z
Max Ref = 65.5 dBZ
Hgt50dBZ = 33,689 ft AGL
TBSS length = 8 nm
POSH = 80 %
MEHS = 2 ¼ “ (225%)
MLT = 13,322 ft AGL
WBZ = 9,885 ft AGL
RH700-300mb = 19 %
Max Obs. Hail = 1 “

#4 – 25 July 2005, 0453z
Max Ref = 65.5 dBZ
Hgt50dBZ = 33,931 ft AGL
TBSS length = 10 nm
POSH = 70 %
MEHS = 2 “ (400%)
MLT = 13,322 ft AGL
WBZ = 9,885 ft AGL
RH700-300mb = 19 %
Max Obs. Hail = ½ “
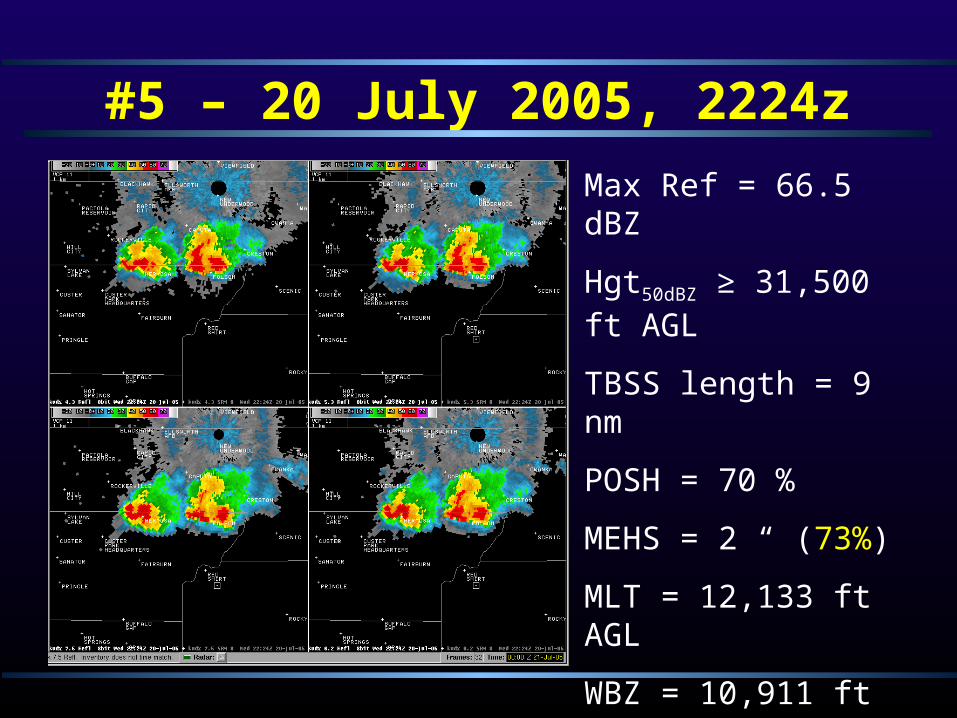
#5 – 20 July 2005, 2224z
Max Ref = 66.5 dBZ
Hgt50dBZ ≥ 31,500 ft AGL
TBSS length = 9 nm
POSH = 70 %
MEHS = 2 “ (73%)
MLT = 12,133 ft AGL
WBZ = 10,911 ft AGL
RH700-300mb = 23 %
Max Obs. Hail = 2 ¾ “
What does this show?
• Not much difference up to this point…– Similar max reflectivity, TBSS lengths, and
MLT/WBZ levels
• Generally small-to-moderate storm cores
• Is there a pattern in the moisture field that can help explain this?

#1 – 10 August 2005, 2131z (wv sat)

#2 – 11 August 2005, 0215z (wv sat)

#3,4 – 25 July 2005, 0445z (wv sat)

#5 – 20 July 2005, 2224z (wv sat)

From AWOC…
• Recall that a moist atmosphere can accelerate the hail melting process
• Flash presentation… http://www.wdtb.noaa.gov/courses/awoc/ICsvr1/ICSvr1-lesson3/ic1-lesson3_color/
• Let’s look at one final case from 2004

#6 – 3 July 2004, 2128z
Max Ref = 74.5 dBZ
Hgt50dBZ = 33,348 ft AGL
TBSS length = 22 nm
POSH = 100 %
MEHS > 4 “ (400%)
MLT = 9,153 ft AGL
WBZ = 8,017 ft AGL
*RH700-300mb = 50 %
Max Obs. Hail = 1 “*** Note this is at a smaller scale than the previous radar images
Produced flash flooding and copious small hail

03 July 2004, 2115z (wv sat)

Summary
• Phone logs indicate these storms with TBSSs and sub-severe to marginally severe hail produced very heavy rainfall and copious small hail
• Some of these storms were supercells, but still struggled to produce very large hail
• The best discriminator for these events may be the water vapor imagery

Summary
• The length of the TBSSs were below average, based on J. Johnson’s local study(however the last event was 22 nm)
0
2
4
6
8
10
12
<5 5-8 9-12 13-16 17-20 21-24 25-28 29-32 33-36 >37
Max TBSS Length (nm)
# o
f T
BS
S's
<5
5-8
9-12
13-16
17-20
21-24
25-28
29-32
33-36
>37

Summary
• The SOO proposes an additional CTA for severe thunderstorm warnings to account for these kinds of events/environments…
“This storm is capable of producing a lot of small to moderate size hail and very heavy rainfall…possibly causing low lying roads to become covered with ice.”
(or something like this)


![UK P I Bunkers and Bunkering[1]](https://img.pdfslide.net/doc/110x75/55cf968c550346d0338c3534/uk-p-i-bunkers-and-bunkering1.jpg)