Embed Size (px)
Citation preview
February 2011 Doc ID 18453 Rev 1 1/24
AN3340Application note
Loudspeaker characterization and compensation
1 Introduction
The application note describes how to measure and analyze the performance of a loudspeaker and how to compensate the frequency response using the ST Speaker Tune software, a tool available in the APWorkbench.
Scope
Although the application note focusses on compensation using Sound Terminal® devices, the principles can be applied to a variety of other DSPs.
www.st.com
Contents AN3340
2/24 Doc ID 18453 Rev 1
Contents
1 Introduction . . . . . . . . . . . . . . . . . . . . . . . . . . . . . . . . . . . . . . . . . . . . . . . . 1
2 Overview . . . . . . . . . . . . . . . . . . . . . . . . . . . . . . . . . . . . . . . . . . . . . . . . . . 3
2.1 What is a loud speaker . . . . . . . . . . . . . . . . . . . . . . . . . . . . . . . . . . . . . . . . 3
2.2 Why compensate a loud speaker . . . . . . . . . . . . . . . . . . . . . . . . . . . . . . . . 3
2.3 How to compensate a loud speaker . . . . . . . . . . . . . . . . . . . . . . . . . . . . . . 4
3 Mechanical structure of a loud speaker . . . . . . . . . . . . . . . . . . . . . . . . . 5
4 Electrical model of a loudspeaker . . . . . . . . . . . . . . . . . . . . . . . . . . . . . . 7
5 Frequency response of a loudspeaker . . . . . . . . . . . . . . . . . . . . . . . . . . 9
6 Loudspeaker compensation . . . . . . . . . . . . . . . . . . . . . . . . . . . . . . . . . . 10
6.1 General procedure . . . . . . . . . . . . . . . . . . . . . . . . . . . . . . . . . . . . . . . . . . 10
6.2 Speaker Tune tool . . . . . . . . . . . . . . . . . . . . . . . . . . . . . . . . . . . . . . . . . . 10
6.2.1 Speaker Tune tool in practice . . . . . . . . . . . . . . . . . . . . . . . . . . . . . . . . . 11
6.2.2 An example and verification . . . . . . . . . . . . . . . . . . . . . . . . . . . . . . . . . . 18
7 Conclusions . . . . . . . . . . . . . . . . . . . . . . . . . . . . . . . . . . . . . . . . . . . . . . . 21
Appendix A APWorkbench information . . . . . . . . . . . . . . . . . . . . . . . . . . . . . . . . 22
A.1 Frequency response data . . . . . . . . . . . . . . . . . . . . . . . . . . . . . . . . . . . . . 22
A.2 On-line presentation . . . . . . . . . . . . . . . . . . . . . . . . . . . . . . . . . . . . . . . . . 22
Revision history . . . . . . . . . . . . . . . . . . . . . . . . . . . . . . . . . . . . . . . . . . . . . . . . . . . . 23
AN3340 Overview
Doc ID 18453 Rev 1 3/24
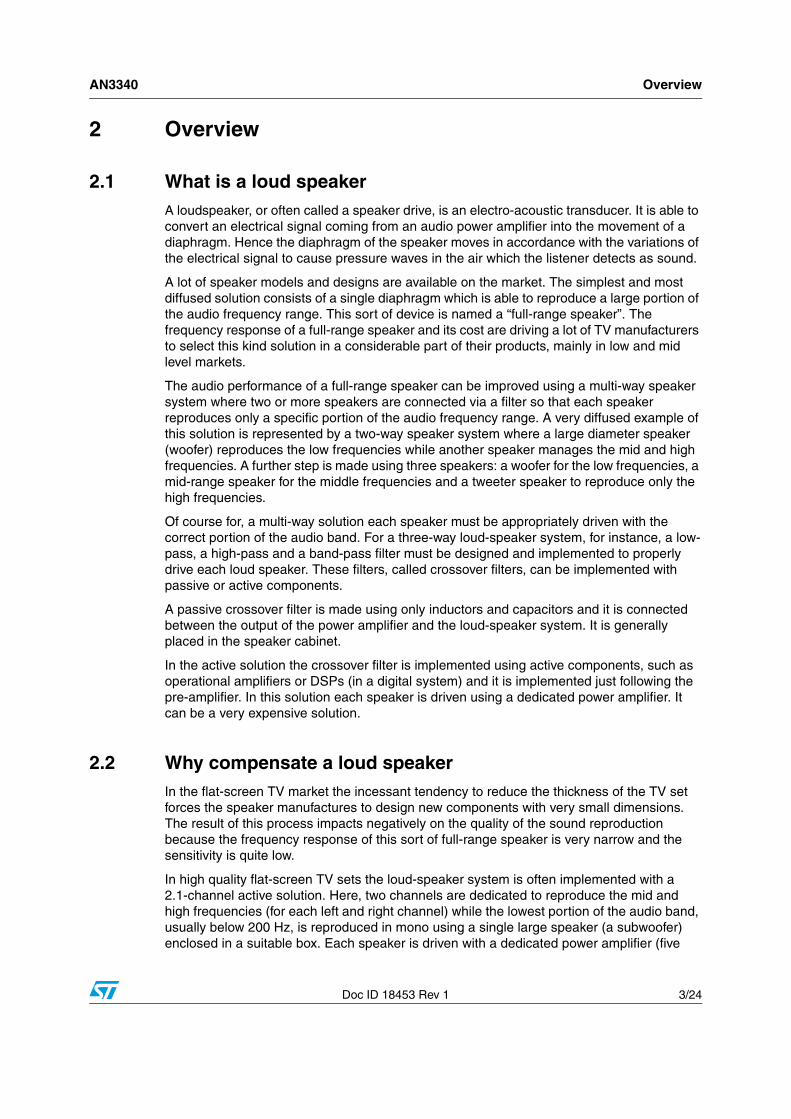
2 Overview
2.1 What is a loud speakerA loudspeaker, or often called a speaker drive, is an electro-acoustic transducer. It is able to convert an electrical signal coming from an audio power amplifier into the movement of a diaphragm. Hence the diaphragm of the speaker moves in accordance with the variations of the electrical signal to cause pressure waves in the air which the listener detects as sound.
A lot of speaker models and designs are available on the market. The simplest and most diffused solution consists of a single diaphragm which is able to reproduce a large portion of the audio frequency range. This sort of device is named a “full-range speaker”. The frequency response of a full-range speaker and its cost are driving a lot of TV manufacturers to select this kind solution in a considerable part of their products, mainly in low and mid level markets.
The audio performance of a full-range speaker can be improved using a multi-way speaker system where two or more speakers are connected via a filter so that each speaker reproduces only a specific portion of the audio frequency range. A very diffused example of this solution is represented by a two-way speaker system where a large diameter speaker (woofer) reproduces the low frequencies while another speaker manages the mid and high frequencies. A further step is made using three speakers: a woofer for the low frequencies, a mid-range speaker for the middle frequencies and a tweeter speaker to reproduce only the high frequencies.
Of course for, a multi-way solution each speaker must be appropriately driven with the correct portion of the audio band. For a three-way loud-speaker system, for instance, a low-pass, a high-pass and a band-pass filter must be designed and implemented to properly drive each loud speaker. These filters, called crossover filters, can be implemented with passive or active components.
A passive crossover filter is made using only inductors and capacitors and it is connected between the output of the power amplifier and the loud-speaker system. It is generally placed in the speaker cabinet.
In the active solution the crossover filter is implemented using active components, such as operational amplifiers or DSPs (in a digital system) and it is implemented just following the pre-amplifier. In this solution each speaker is driven using a dedicated power amplifier. It can be a very expensive solution.
2.2 Why compensate a loud speakerIn the flat-screen TV market the incessant tendency to reduce the thickness of the TV set forces the speaker manufactures to design new components with very small dimensions. The result of this process impacts negatively on the quality of the sound reproduction because the frequency response of this sort of full-range speaker is very narrow and the sensitivity is quite low.
In high quality flat-screen TV sets the loud-speaker system is often implemented with a 2.1-channel active solution. Here, two channels are dedicated to reproduce the mid and high frequencies (for each left and right channel) while the lowest portion of the audio band, usually below 200 Hz, is reproduced in mono using a single large speaker (a subwoofer) enclosed in a suitable box. Each speaker is driven with a dedicated power amplifier (five
Overview AN3340
4/24 Doc ID 18453 Rev 1
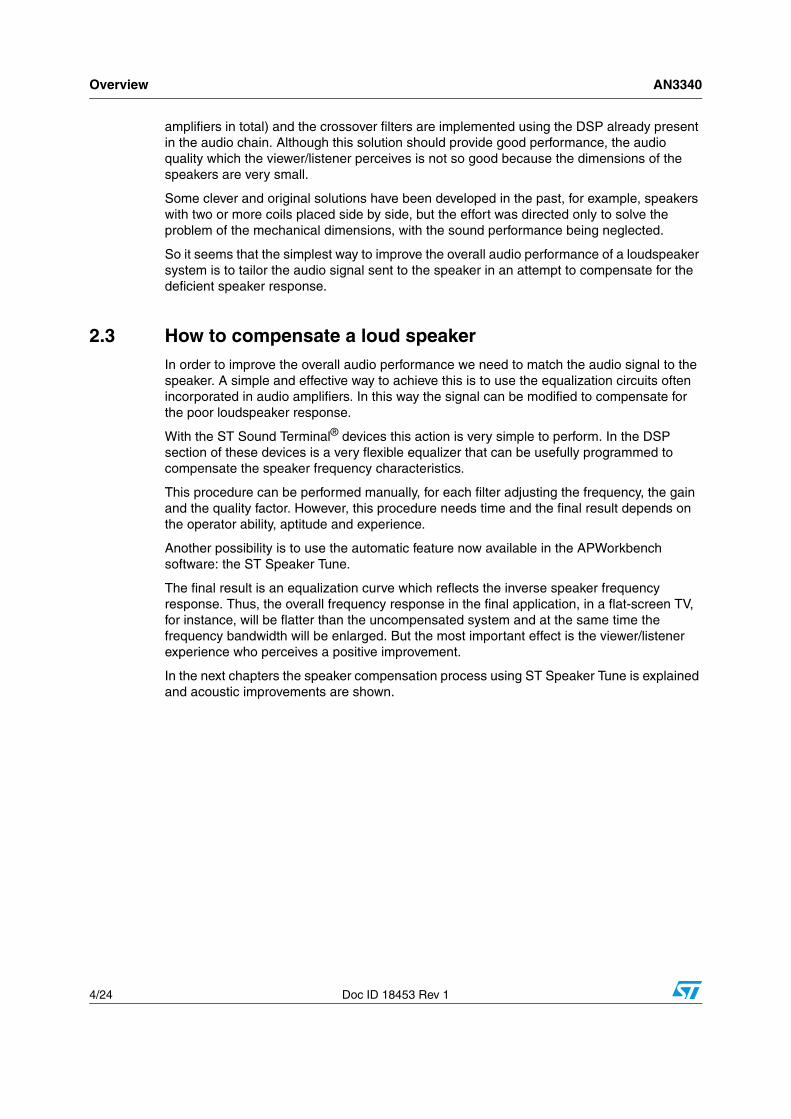
amplifiers in total) and the crossover filters are implemented using the DSP already present in the audio chain. Although this solution should provide good performance, the audio quality which the viewer/listener perceives is not so good because the dimensions of the speakers are very small.
Some clever and original solutions have been developed in the past, for example, speakers with two or more coils placed side by side, but the effort was directed only to solve the problem of the mechanical dimensions, with the sound performance being neglected.
So it seems that the simplest way to improve the overall audio performance of a loudspeaker system is to tailor the audio signal sent to the speaker in an attempt to compensate for the deficient speaker response.
2.3 How to compensate a loud speakerIn order to improve the overall audio performance we need to match the audio signal to the speaker. A simple and effective way to achieve this is to use the equalization circuits often incorporated in audio amplifiers. In this way the signal can be modified to compensate for the poor loudspeaker response.
With the ST Sound Terminal® devices this action is very simple to perform. In the DSP section of these devices is a very flexible equalizer that can be usefully programmed to compensate the speaker frequency characteristics.
This procedure can be performed manually, for each filter adjusting the frequency, the gain and the quality factor. However, this procedure needs time and the final result depends on the operator ability, aptitude and experience.
Another possibility is to use the automatic feature now available in the APWorkbench software: the ST Speaker Tune.
The final result is an equalization curve which reflects the inverse speaker frequency response. Thus, the overall frequency response in the final application, in a flat-screen TV, for instance, will be flatter than the uncompensated system and at the same time the frequency bandwidth will be enlarged. But the most important effect is the viewer/listener experience who perceives a positive improvement.
In the next chapters the speaker compensation process using ST Speaker Tune is explained and acoustic improvements are shown.
AN3340 Mechanical structure of a loud speaker
Doc ID 18453 Rev 1 5/24
3 Mechanical structure of a loud speaker
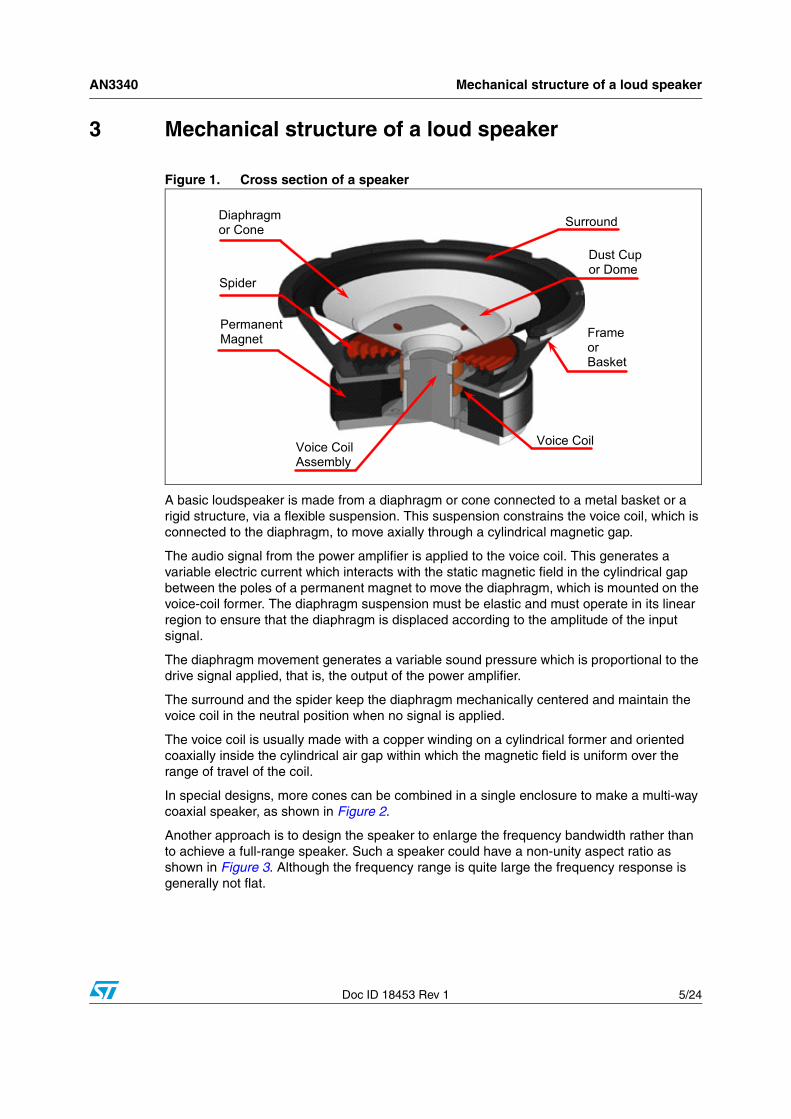
Figure 1. Cross section of a speaker
A basic loudspeaker is made from a diaphragm or cone connected to a metal basket or a rigid structure, via a flexible suspension. This suspension constrains the voice coil, which is connected to the diaphragm, to move axially through a cylindrical magnetic gap.
The audio signal from the power amplifier is applied to the voice coil. This generates a variable electric current which interacts with the static magnetic field in the cylindrical gap between the poles of a permanent magnet to move the diaphragm, which is mounted on the voice-coil former. The diaphragm suspension must be elastic and must operate in its linear region to ensure that the diaphragm is displaced according to the amplitude of the input signal.
The diaphragm movement generates a variable sound pressure which is proportional to the drive signal applied, that is, the output of the power amplifier.
The surround and the spider keep the diaphragm mechanically centered and maintain the voice coil in the neutral position when no signal is applied.
The voice coil is usually made with a copper winding on a cylindrical former and oriented coaxially inside the cylindrical air gap within which the magnetic field is uniform over the range of travel of the coil.
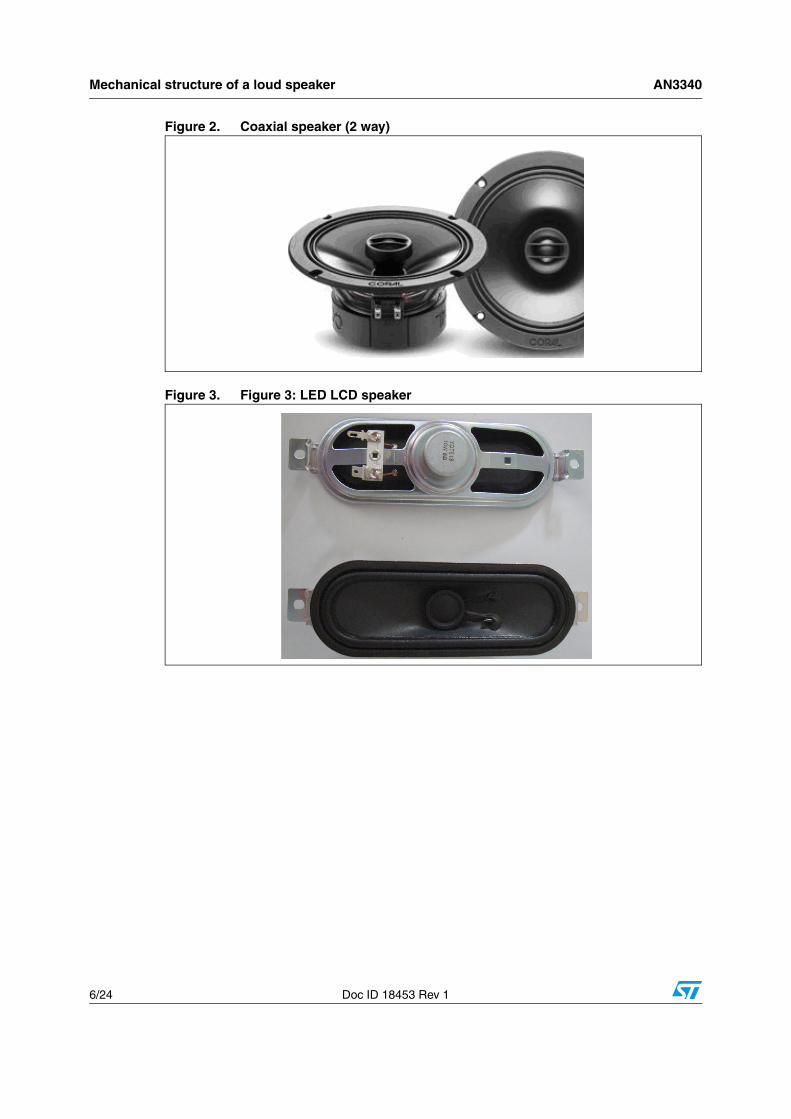
In special designs, more cones can be combined in a single enclosure to make a multi-way coaxial speaker, as shown in Figure 2.
Another approach is to design the speaker to enlarge the frequency bandwidth rather than to achieve a full-range speaker. Such a speaker could have a non-unity aspect ratio as shown in Figure 3. Although the frequency range is quite large the frequency response is generally not flat.
Diaphragm or Cone
Spider
Permanent Magnet
Voice Coil
Surround
Voice Coil Assembly
Frame or Basket
Dust Cup or Dome
Mechanical structure of a loud speaker AN3340
6/24 Doc ID 18453 Rev 1
Figure 2. Coaxial speaker (2 way)
Figure 3. Figure 3: LED LCD speaker
AN3340 Electrical model of a loudspeaker
Doc ID 18453 Rev 1 7/24
4 Electrical model of a loudspeaker
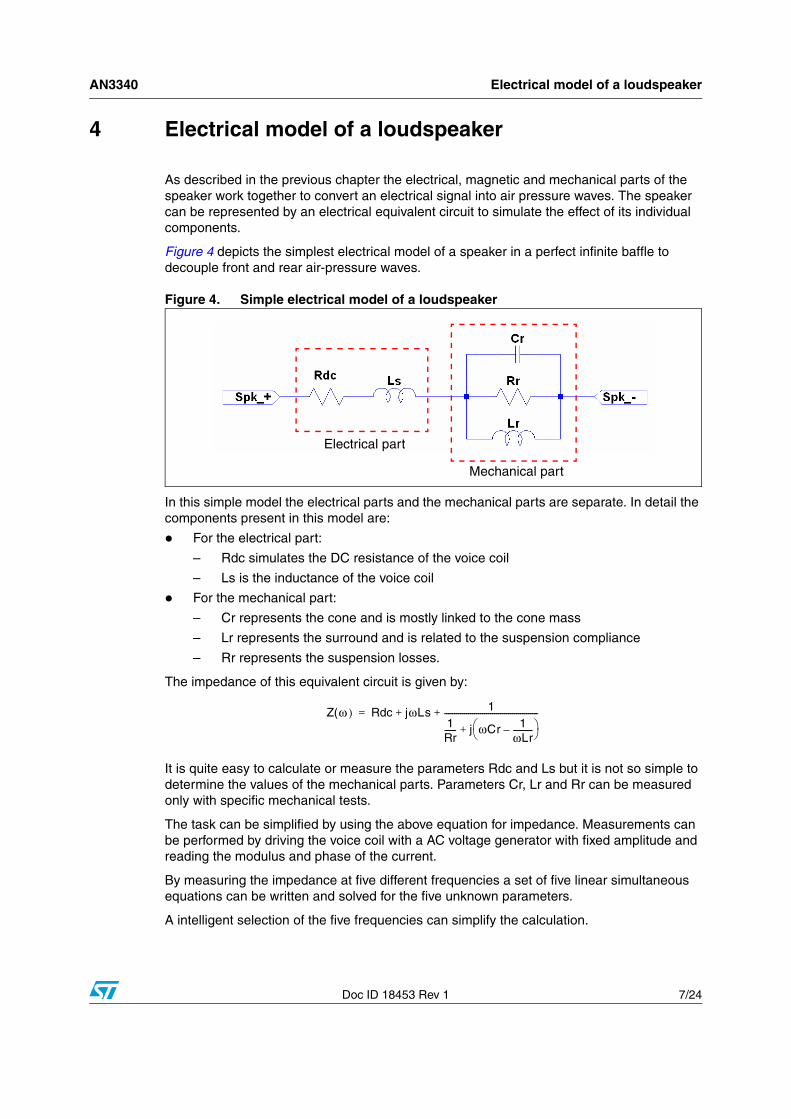
As described in the previous chapter the electrical, magnetic and mechanical parts of the speaker work together to convert an electrical signal into air pressure waves. The speaker can be represented by an electrical equivalent circuit to simulate the effect of its individual components.
Figure 4 depicts the simplest electrical model of a speaker in a perfect infinite baffle to decouple front and rear air-pressure waves.
Figure 4. Simple electrical model of a loudspeaker
In this simple model the electrical parts and the mechanical parts are separate. In detail the components present in this model are:
For the electrical part:
– Rdc simulates the DC resistance of the voice coil
– Ls is the inductance of the voice coil
For the mechanical part:
– Cr represents the cone and is mostly linked to the cone mass
– Lr represents the surround and is related to the suspension compliance
– Rr represents the suspension losses.
The impedance of this equivalent circuit is given by:
It is quite easy to calculate or measure the parameters Rdc and Ls but it is not so simple to determine the values of the mechanical parts. Parameters Cr, Lr and Rr can be measured only with specific mechanical tests.
The task can be simplified by using the above equation for impedance. Measurements can be performed by driving the voice coil with a AC voltage generator with fixed amplitude and reading the modulus and phase of the current.
By measuring the impedance at five different frequencies a set of five linear simultaneous equations can be written and solved for the five unknown parameters.
A intelligent selection of the five frequencies can simplify the calculation.
Electrical part
Mechanical part
Z(ω ) Rdc jωLs 11Rr------ j ωCr 1
ωLr----------–⎝ ⎠
⎛ ⎞+
-----------------------------------------------+ +=
Electrical model of a loudspeaker AN3340
8/24 Doc ID 18453 Rev 1
Rdc can be identified immediately considering the impedance at very low frequencies, for example, at 20Hz or even at DC.
The effect of Ls is predominant at high frequencies and so this parameter can be measured at a frequency around 20 kHz.
The remaining three parameters can be calculated considering the property of a parallel resonant circuit. Rr is the mathematical difference between the peak impedance measured at the resonant frequency and Rdc, assuming that the term with Ls is negligible.
The last two parameters Cr and Lr can be calculated considering the value of the resonant frequency and the quality factor of the parallel resonator or simply using two other frequencies.
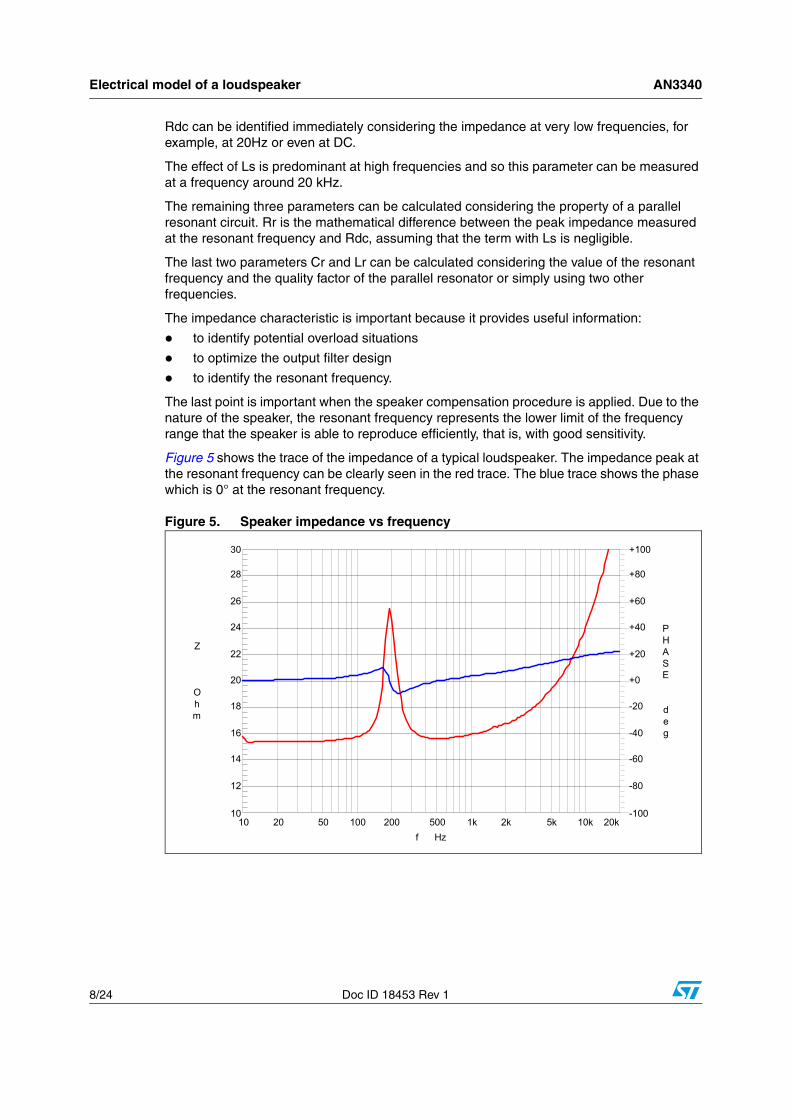
The impedance characteristic is important because it provides useful information:
to identify potential overload situations
to optimize the output filter design
to identify the resonant frequency.
The last point is important when the speaker compensation procedure is applied. Due to the nature of the speaker, the resonant frequency represents the lower limit of the frequency range that the speaker is able to reproduce efficiently, that is, with good sensitivity.
Figure 5 shows the trace of the impedance of a typical loudspeaker. The impedance peak at the resonant frequency can be clearly seen in the red trace. The blue trace shows the phase which is 0° at the resonant frequency.
Figure 5. Speaker impedance vs frequency
-100
+100
-80
-60
-40
-20
+0
+20
+40
+60
+80
PHASE
deg
10
30
12
14
16
18
20
22
24
26
28
Z O h m
10 20k20 50 100 200 500 1k 2k 5k 10k f Hz
AN3340 Frequency response of a loudspeaker
Doc ID 18453 Rev 1 9/24
5 Frequency response of a loudspeaker
While the speaker electrical characteristics and the impedance measurement can be performed using standard electrical equipment available in an electronics laboratory (oscilloscope, function generator, current probe and so on), the frequency response measurement needs a dedicated environment and specialized tools.
To determine the frequency response of a speaker it is necessary to measure the sound pressure that the cone produces when a signal is applied to the voice coil.
To perform the sound pressure measurement it is necessary to use a microphone to convert the sound back to an electrical signal. The microphone frequency response must be known since this is also part of the measurement loop and must be subtracted from the overall response.
The test should be performed in an acoustically shielded environment, that is, in an anechoic chamber, to eliminate reflections and background noise.
If an anechoic chamber and the related tools (microphone, specialized software) are not available then the speaker frequency response must be estimated using an alternative method.
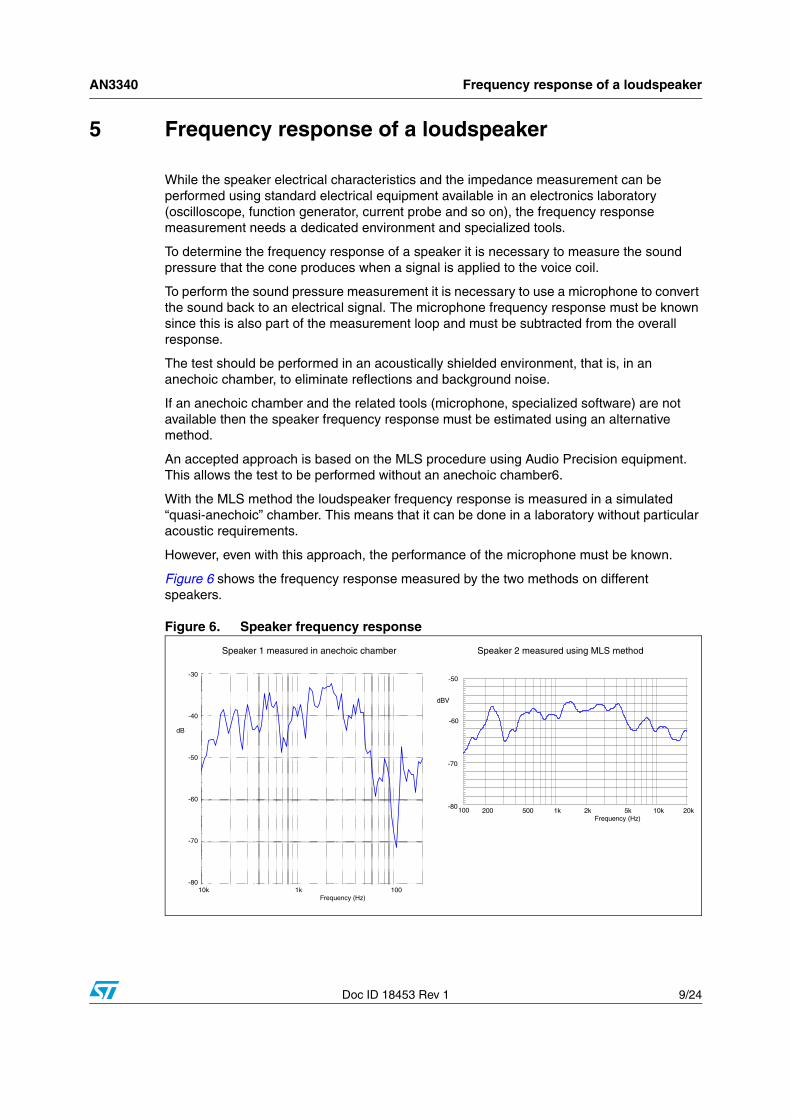
An accepted approach is based on the MLS procedure using Audio Precision equipment. This allows the test to be performed without an anechoic chamber6.
With the MLS method the loudspeaker frequency response is measured in a simulated “quasi-anechoic” chamber. This means that it can be done in a laboratory without particular acoustic requirements.
However, even with this approach, the performance of the microphone must be known.
Figure 6 shows the frequency response measured by the two methods on different speakers.
Figure 6. Speaker frequency response
-80
-50
-70
-60
dBV
200 20k500 1k 2k 5k 10k Frequency (Hz)
100
dB
-30
-40
-50
-60
-70
-801001k10k
Frequency (Hz)
Speaker 1 measured in anechoic chamber Speaker 2 measured using MLS method
Loudspeaker compensation AN3340
10/24 Doc ID 18453 Rev 1
6 Loudspeaker compensation
It should now be clear that using an amplifier with a flat frequency response in the band 20 Hz to 20 kHz does not guarantee a flat overall response for the listener. The global performance is limited by the poor frequency response of the speakers.
To compensate for a non-ideal speaker response we need to modify the response of the amplifier. This can be achieved using a set of independent tunable filters to modify the amplifier response either over a bandwidth as large as possible or over a defined frequency range. The filters could be analog filters in an analog system and could be digital filters in a digital system.
Audio amplifiers already having an embedded DSP, such as the one in the Sound Terminal® family of amplifiers, have the advantage that the processor can also be programmed as filters to tailor the amplifier response.
6.1 General procedureFor Sound Terminal® devices the DSP can be programmed manually by adding and modifying, step by step, the parameters of the filters. This manual procedure has, of course, its drawbacks:
it is time-consuming to repeatedly modify each filter in turn and measure the frequency response.
the result is user depended. The experience of the user to select the types of filters (such as peak, low pass, high shelf) and their parameters (such as cut-off frequency, gain, quality factor) plays a fundamental role.
6.2 Speaker Tune toolThe ST Speaker Tune tool available in the APWorkbench software allows very fast and reliable frequency compensation of the whole audio chain and in detail the speaker frequency response. The final result is unique because it is the result of an automatic procedure based on an algorithm that manages the filter parameters in line with defined and optimized procedures.
Speaker Tune is a very user friendly tool. It does not need special settings or specific knowledge of filters. The only information that the tool needs is the frequency response of the uncompensated loudspeaker.
The speaker frequency response can be imported into the tool in two different ways
tabulated in Microsoft® Excel format
graphically.
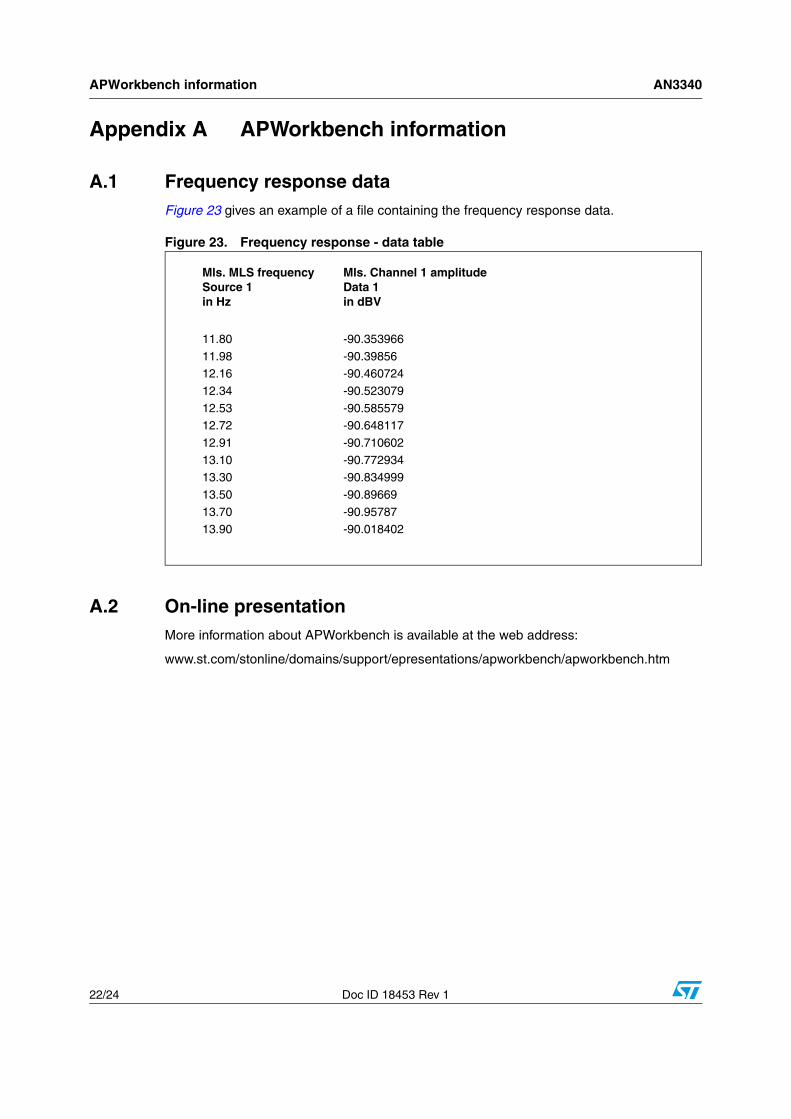
In the tabulated method, an example is given in Figure 23 on page 22, the first column contains the frequencies and the second the sound level measurements. Maximum data length is 4096 samples and maximum number of header lines is 3.
The frequency response can be measured using professional equipment and with an anechoic chamber or using an MLS test (with microphone and equipment from Audio Precision). The only stipulation is that the frequency response data must be expressed in dB or dBSPL.
AN3340 Loudspeaker compensation
Doc ID 18453 Rev 1 11/24
If the speaker frequency response is not available in tabular format then, using a special feature of APWorkbench, it is possible to overlay the graphical response in the equalizer panel and manually add filters to simulate the speaker curve.
The reliability of the final result is strongly dependent on the quality of the input data. For this reason the speaker frequency-response measurement must be carried out with extreme care and a good microphone (with flat response if possible).
6.2.1 Speaker Tune tool in practice
Automatic compensation
No special knowledge is required to use the Speaker Tune tool to make the frequency response compensation.
The following steps and accompanying figures will help you to get started.
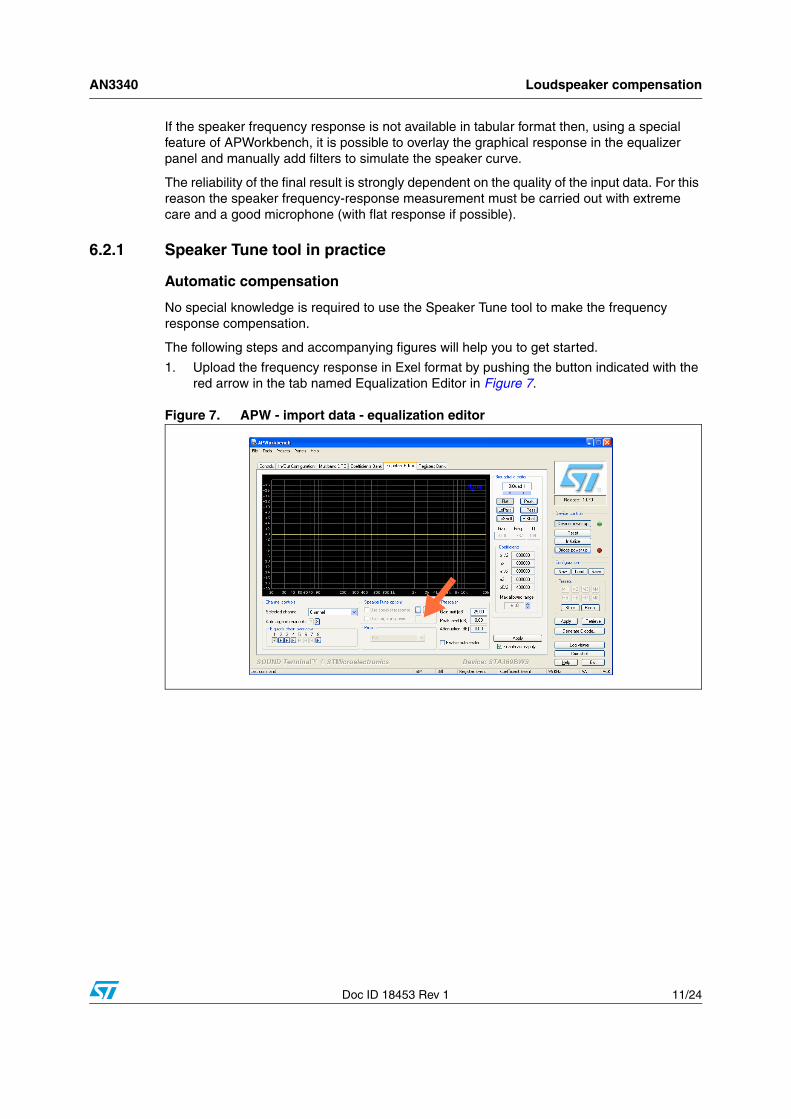
1. Upload the frequency response in Exel format by pushing the button indicated with the red arrow in the tab named Equalization Editor in Figure 7.
Figure 7. APW - import data - equalization editor
Loudspeaker compensation AN3340
12/24 Doc ID 18453 Rev 1
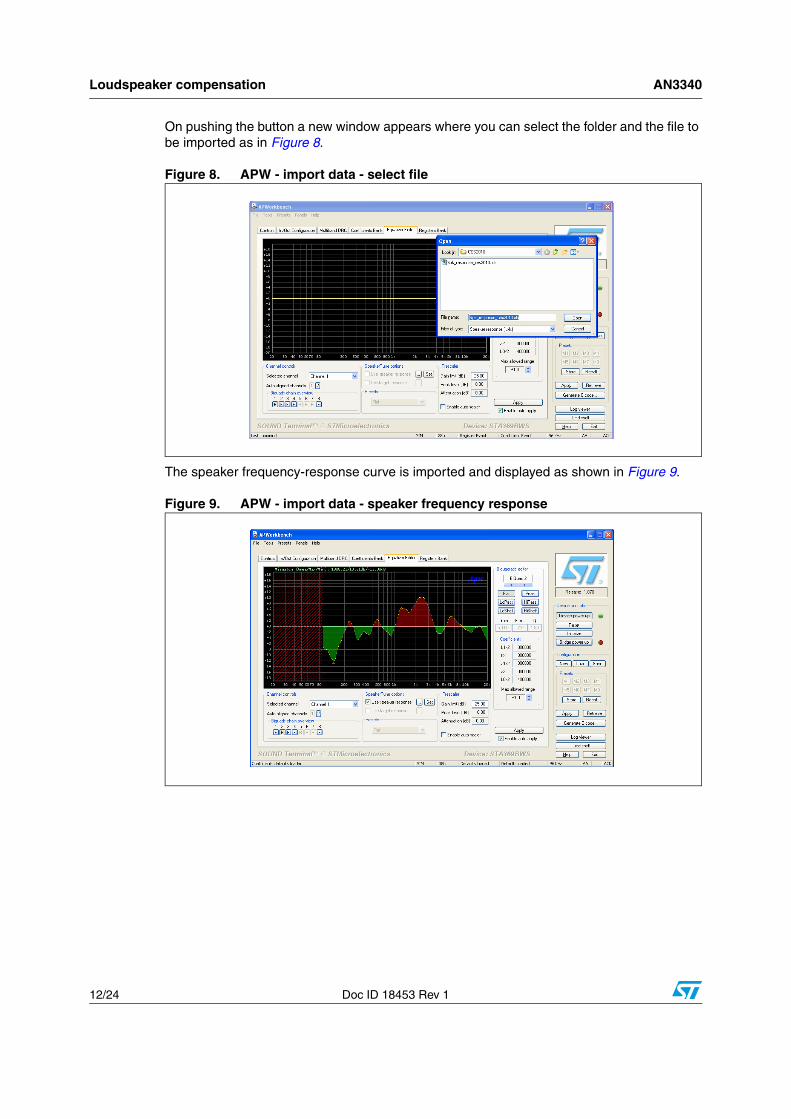
On pushing the button a new window appears where you can select the folder and the file to be imported as in Figure 8.
Figure 8. APW - import data - select file
The speaker frequency-response curve is imported and displayed as shown in Figure 9.
Figure 9. APW - import data - speaker frequency response
AN3340 Loudspeaker compensation
Doc ID 18453 Rev 1 13/24
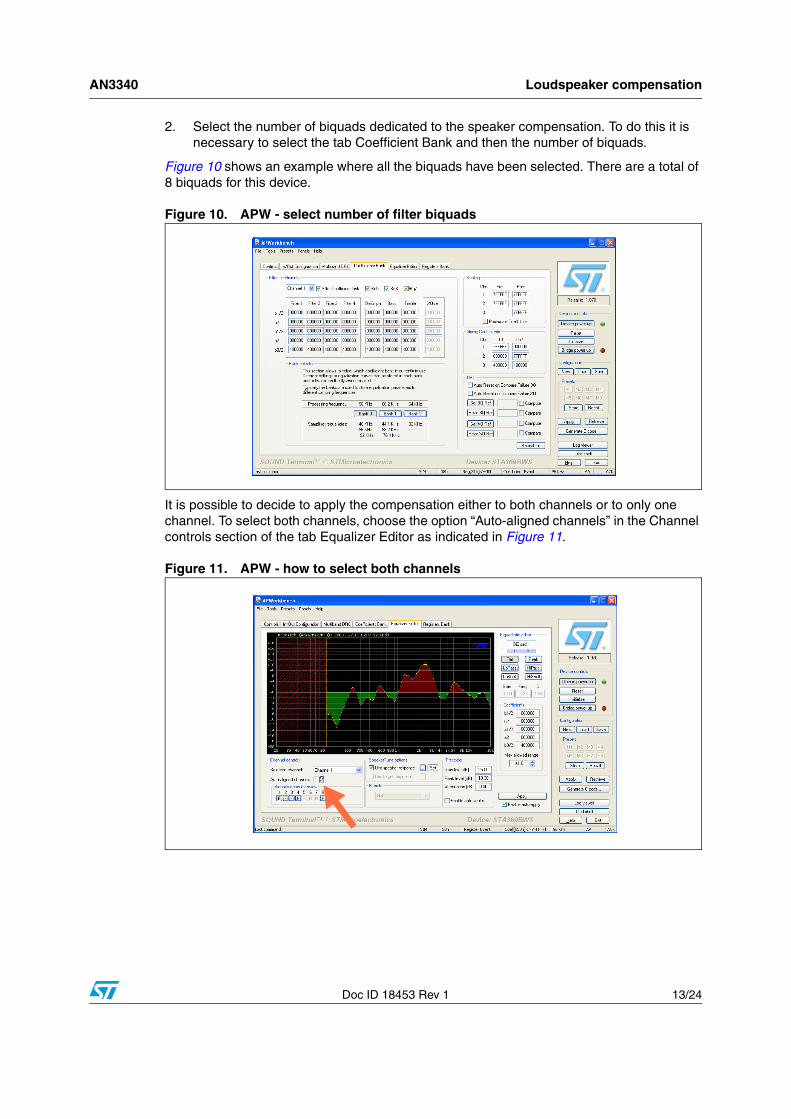
2. Select the number of biquads dedicated to the speaker compensation. To do this it is necessary to select the tab Coefficient Bank and then the number of biquads.
Figure 10 shows an example where all the biquads have been selected. There are a total of 8 biquads for this device.
Figure 10. APW - select number of filter biquads
It is possible to decide to apply the compensation either to both channels or to only one channel. To select both channels, choose the option “Auto-aligned channels” in the Channel controls section of the tab Equalizer Editor as indicated in Figure 11.
Figure 11. APW - how to select both channels
Loudspeaker compensation AN3340
14/24 Doc ID 18453 Rev 1
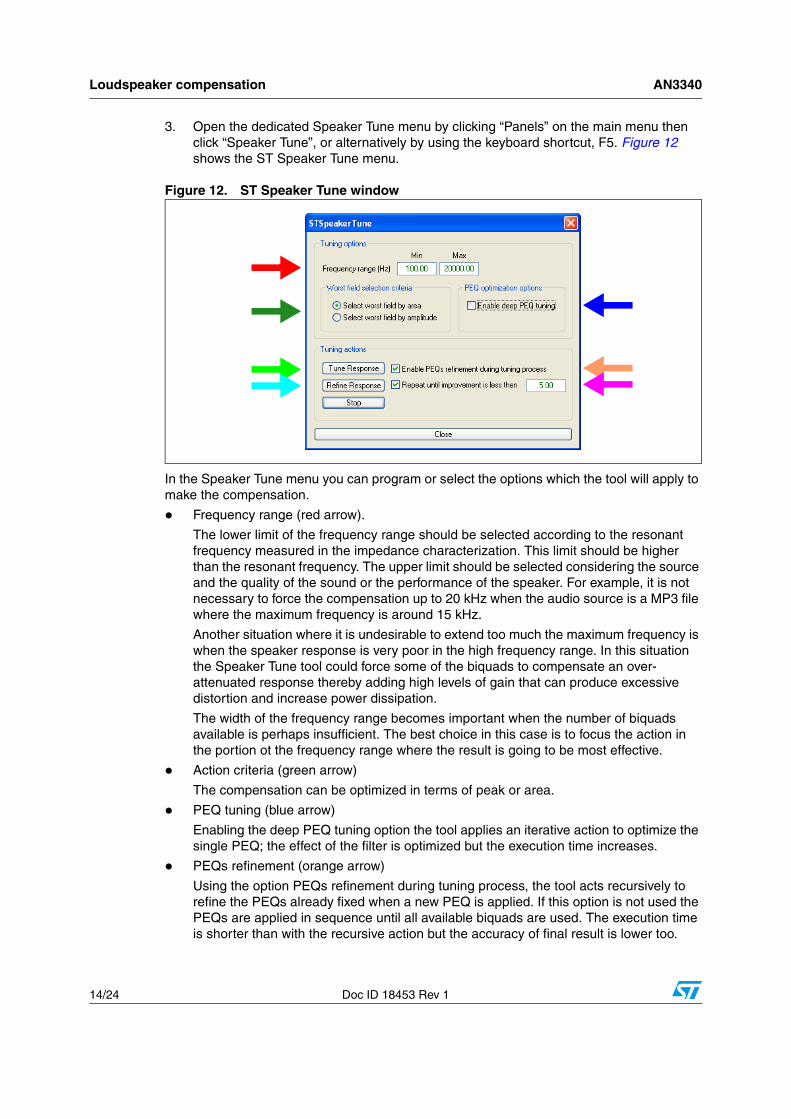
3. Open the dedicated Speaker Tune menu by clicking “Panels” on the main menu then click “Speaker Tune”, or alternatively by using the keyboard shortcut, F5. Figure 12 shows the ST Speaker Tune menu.
Figure 12. ST Speaker Tune window
In the Speaker Tune menu you can program or select the options which the tool will apply to make the compensation.
Frequency range (red arrow).
The lower limit of the frequency range should be selected according to the resonant frequency measured in the impedance characterization. This limit should be higher than the resonant frequency. The upper limit should be selected considering the source and the quality of the sound or the performance of the speaker. For example, it is not necessary to force the compensation up to 20 kHz when the audio source is a MP3 file where the maximum frequency is around 15 kHz.
Another situation where it is undesirable to extend too much the maximum frequency is when the speaker response is very poor in the high frequency range. In this situation the Speaker Tune tool could force some of the biquads to compensate an over-attenuated response thereby adding high levels of gain that can produce excessive distortion and increase power dissipation.
The width of the frequency range becomes important when the number of biquads available is perhaps insufficient. The best choice in this case is to focus the action in the portion ot the frequency range where the result is going to be most effective.
Action criteria (green arrow)
The compensation can be optimized in terms of peak or area.
PEQ tuning (blue arrow)
Enabling the deep PEQ tuning option the tool applies an iterative action to optimize the single PEQ; the effect of the filter is optimized but the execution time increases.
PEQs refinement (orange arrow)
Using the option PEQs refinement during tuning process, the tool acts recursively to refine the PEQs already fixed when a new PEQ is applied. If this option is not used the PEQs are applied in sequence until all available biquads are used. The execution time is shorter than with the recursive action but the accuracy of final result is lower too.
AN3340 Loudspeaker compensation
Doc ID 18453 Rev 1 15/24
Threshold of improvement (magenta arrow)
A value for the threshold of improvement can be used here is desired.
Activate procedure (light green arrow)
The speaker compensation procedure is activated by pressing clicking on “Tune Response”. The tool automatically positions the PEQs in accordance to the settings in the Speaker Tune panel. Then, in real time, the shape of the frequency response is modified as each PEQ is applied. The effect of the recursive adjustment is also visible if this option is selected.
The procedure stops when all the biquads have been optimized.
Refine Response (light blue arrow)
A further optimization can be applied by clicking “Refine Response”. The procedure stops when there is on improvement in two consecutive steps.
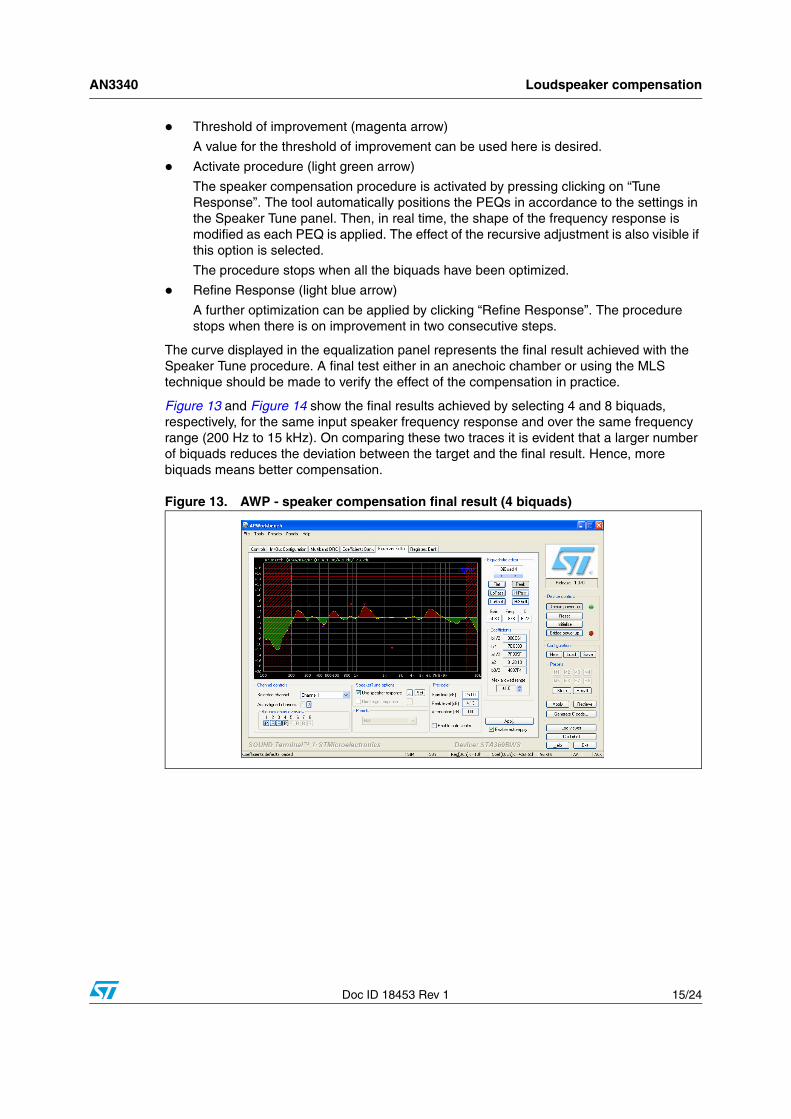
The curve displayed in the equalization panel represents the final result achieved with the Speaker Tune procedure. A final test either in an anechoic chamber or using the MLS technique should be made to verify the effect of the compensation in practice.
Figure 13 and Figure 14 show the final results achieved by selecting 4 and 8 biquads, respectively, for the same input speaker frequency response and over the same frequency range (200 Hz to 15 kHz). On comparing these two traces it is evident that a larger number of biquads reduces the deviation between the target and the final result. Hence, more biquads means better compensation.
Figure 13. AWP - speaker compensation final result (4 biquads)
Loudspeaker compensation AN3340
16/24 Doc ID 18453 Rev 1
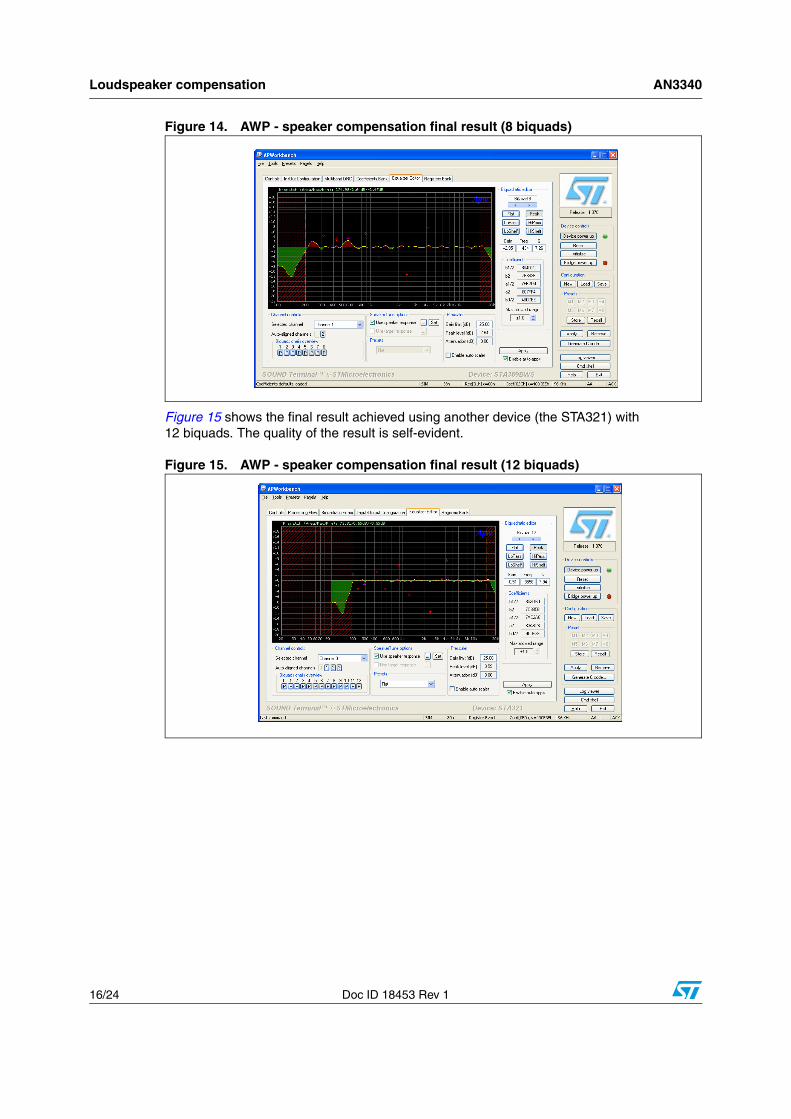
Figure 14. AWP - speaker compensation final result (8 biquads)
Figure 15 shows the final result achieved using another device (the STA321) with 12 biquads. The quality of the result is self-evident.
Figure 15. AWP - speaker compensation final result (12 biquads)
AN3340 Loudspeaker compensation
Doc ID 18453 Rev 1 17/24
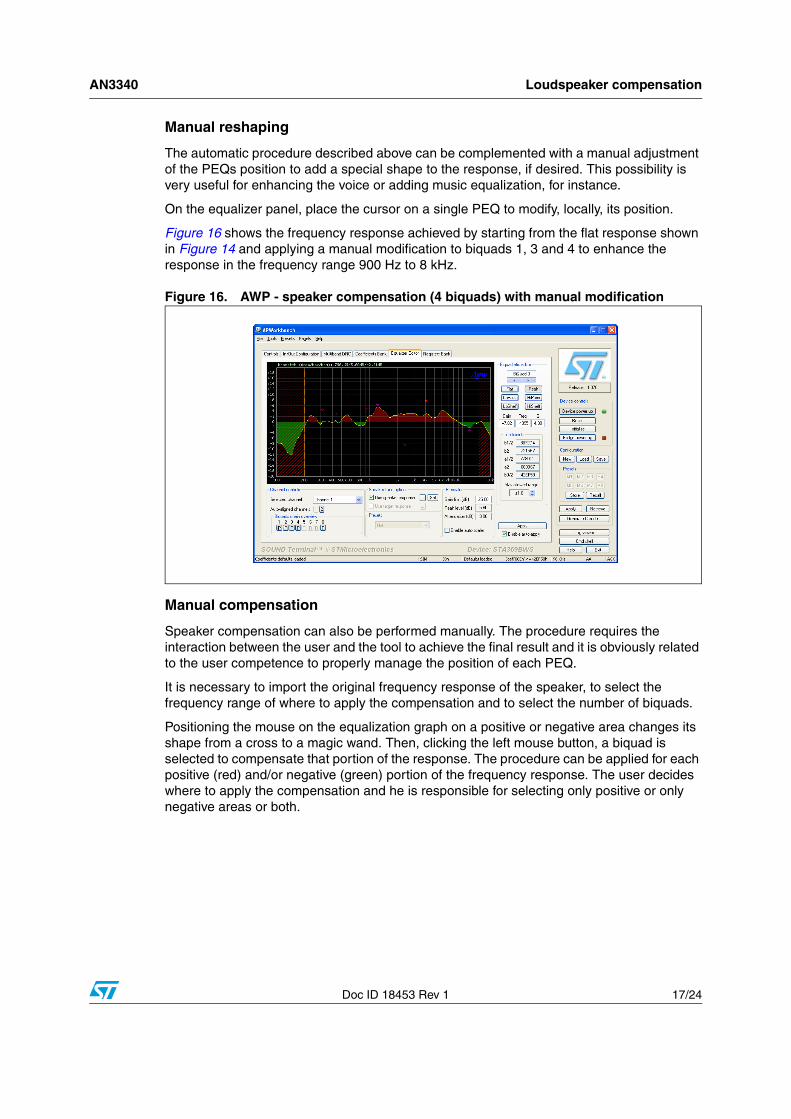
Manual reshaping
The automatic procedure described above can be complemented with a manual adjustment of the PEQs position to add a special shape to the response, if desired. This possibility is very useful for enhancing the voice or adding music equalization, for instance.
On the equalizer panel, place the cursor on a single PEQ to modify, locally, its position.
Figure 16 shows the frequency response achieved by starting from the flat response shown in Figure 14 and applying a manual modification to biquads 1, 3 and 4 to enhance the response in the frequency range 900 Hz to 8 kHz.
Figure 16. AWP - speaker compensation (4 biquads) with manual modification
Manual compensation
Speaker compensation can also be performed manually. The procedure requires the interaction between the user and the tool to achieve the final result and it is obviously related to the user competence to properly manage the position of each PEQ.
It is necessary to import the original frequency response of the speaker, to select the frequency range of where to apply the compensation and to select the number of biquads.
Positioning the mouse on the equalization graph on a positive or negative area changes its shape from a cross to a magic wand. Then, clicking the left mouse button, a biquad is selected to compensate that portion of the response. The procedure can be applied for each positive (red) and/or negative (green) portion of the frequency response. The user decides where to apply the compensation and he is responsible for selecting only positive or only negative areas or both.
Loudspeaker compensation AN3340
18/24 Doc ID 18453 Rev 1
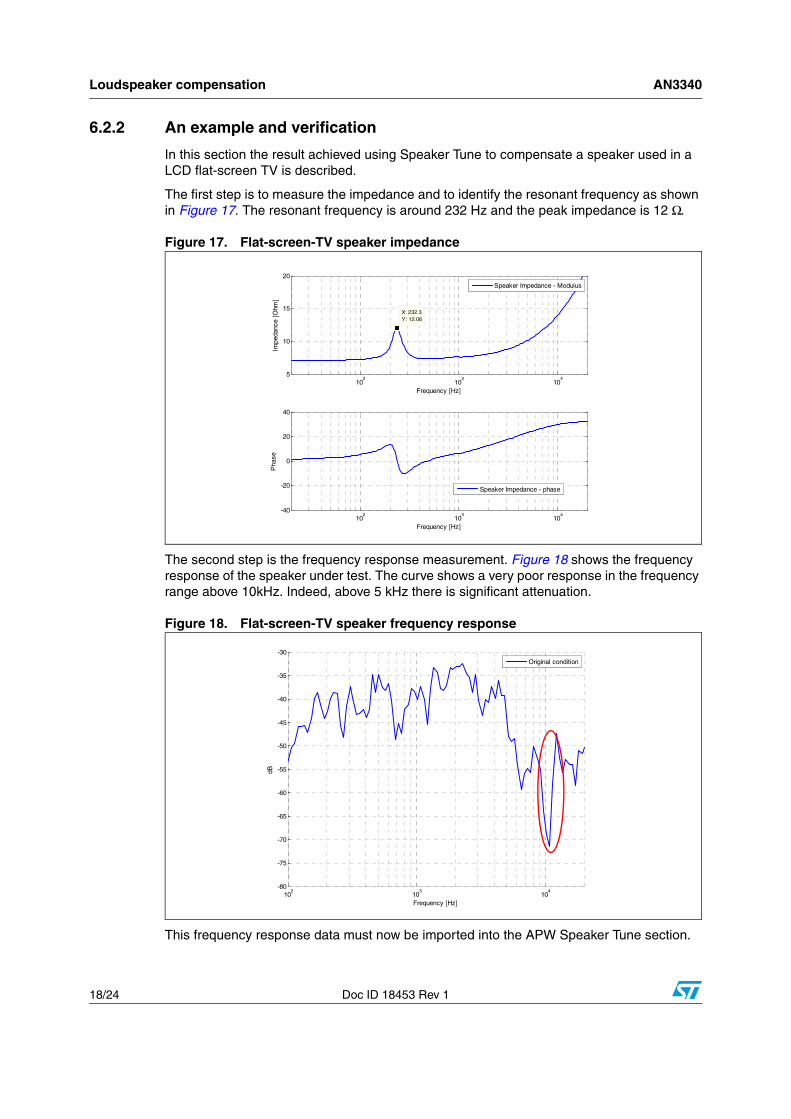
6.2.2 An example and verification
In this section the result achieved using Speaker Tune to compensate a speaker used in a LCD flat-screen TV is described.
The first step is to measure the impedance and to identify the resonant frequency as shown in Figure 17. The resonant frequency is around 232 Hz and the peak impedance is 12 Ω.
Figure 17. Flat-screen-TV speaker impedance
The second step is the frequency response measurement. Figure 18 shows the frequency response of the speaker under test. The curve shows a very poor response in the frequency range above 10kHz. Indeed, above 5 kHz there is significant attenuation.
Figure 18. Flat-screen-TV speaker frequency response
This frequency response data must now be imported into the APW Speaker Tune section.
102
103
104
5
10
15
20
X: 232.3Y: 12.06
Frequency [Hz]
Impe
danc
e [O
hm]
Speaker Impedance - Modulus
102
103
104
-40
-20
0
20
40
Frequency [Hz]
Pha
se
Speaker Impedance - phase
102
103
104
-80
-75
-70
-65
-60
-55
-50
-45
-40
-35
-30
Frequency [Hz]
dB
Original condition
AN3340 Loudspeaker compensation
Doc ID 18453 Rev 1 19/24
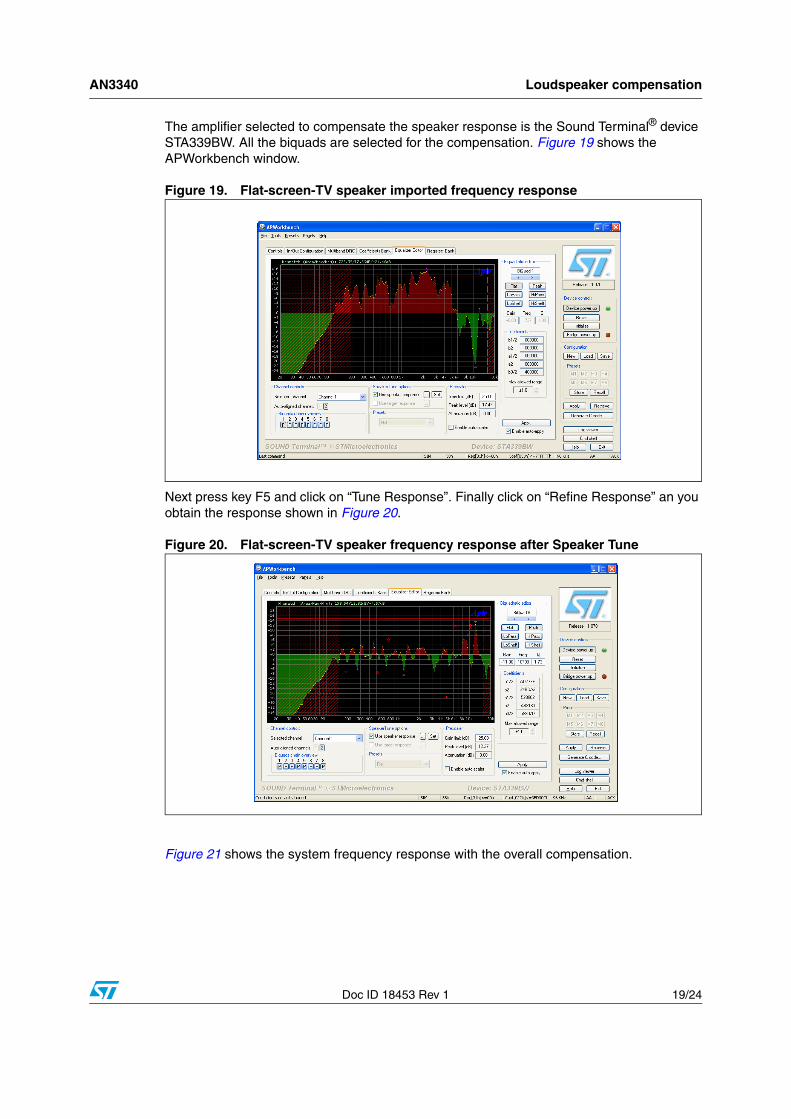
The amplifier selected to compensate the speaker response is the Sound Terminal® device STA339BW. All the biquads are selected for the compensation. Figure 19 shows the APWorkbench window.
Figure 19. Flat-screen-TV speaker imported frequency response
Next press key F5 and click on “Tune Response”. Finally click on “Refine Response” an you obtain the response shown in Figure 20.
Figure 20. Flat-screen-TV speaker frequency response after Speaker Tune
Figure 21 shows the system frequency response with the overall compensation.
Loudspeaker compensation AN3340
20/24 Doc ID 18453 Rev 1
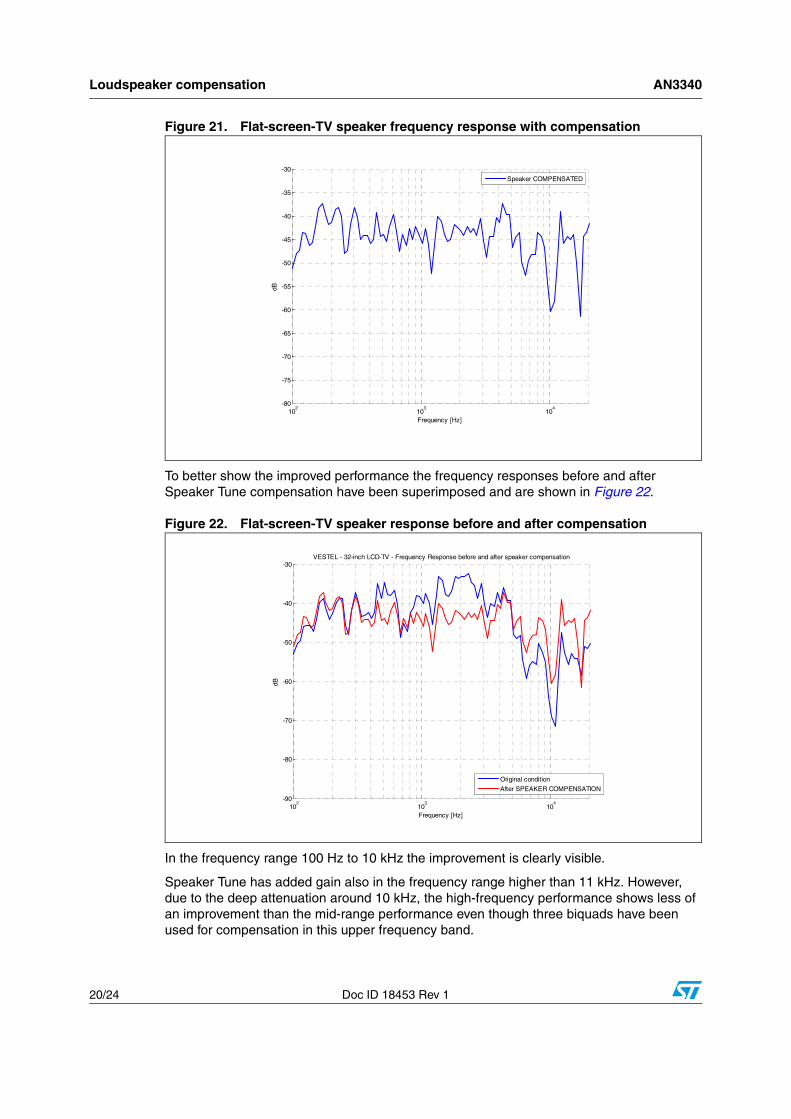
Figure 21. Flat-screen-TV speaker frequency response with compensation
To better show the improved performance the frequency responses before and after Speaker Tune compensation have been superimposed and are shown in Figure 22.
Figure 22. Flat-screen-TV speaker response before and after compensation
In the frequency range 100 Hz to 10 kHz the improvement is clearly visible.
Speaker Tune has added gain also in the frequency range higher than 11 kHz. However, due to the deep attenuation around 10 kHz, the high-frequency performance shows less of an improvement than the mid-range performance even though three biquads have been used for compensation in this upper frequency band.
102
103
104
-80
-75
-70
-65
-60
-55
-50
-45
-40
-35
-30
Frequency [Hz]
dB
Speaker COMPENSATED
102
103
104
-90
-80
-70
-60
-50
-40
-30VESTEL - 32-inch LCD-TV - Frequency Response before and after speaker compensation
Frequency [Hz]
dB
Original condition
After SPEAKER COMPENSATION
AN3340 Conclusions
Doc ID 18453 Rev 1 21/24
7 Conclusions
This application note has described the basic methodology and the ST Speaker Tune tool in order to assist the user to achieve good speaker compensation results.
A speaker used in a LCD flat-screen TV set has been used as a practical example to analyze the frequency performance before and after speaker compensation.
It has also been shown how the number of biquads and the frequency range affect the compensation.
APWorkbench information AN3340
22/24 Doc ID 18453 Rev 1
Appendix A APWorkbench information
A.1 Frequency response dataFigure 23 gives an example of a file containing the frequency response data.
Figure 23. Frequency response - data table
A.2 On-line presentationMore information about APWorkbench is available at the web address:
www.st.com/stonline/domains/support/epresentations/apworkbench/apworkbench.htm
Mls. MLS frequencySource 1in Hz
11.80
11.9812.16
12.34
12.5312.72
12.91
13.1013.30
13.50
13.7013.90
Mls. Channel 1 amplitudeData 1in dBV
-90.353966
-90.39856-90.460724
-90.523079
-90.585579-90.648117
-90.710602
-90.772934-90.834999
-90.89669
-90.95787-90.018402
AN3340 Revision history
Doc ID 18453 Rev 1 23/24
Revision history
Table 1. Document revision history
Date Revision Changes
11-Feb-2011 1 Initial release.
AN3340
24/24 Doc ID 18453 Rev 1
Please Read Carefully:
Information in this document is provided solely in connection with ST products. STMicroelectronics NV and its subsidiaries (“ST”) reserve theright to make changes, corrections, modifications or improvements, to this document, and the products and services described herein at anytime, without notice.
All ST products are sold pursuant to ST’s terms and conditions of sale.
Purchasers are solely responsible for the choice, selection and use of the ST products and services described herein, and ST assumes noliability whatsoever relating to the choice, selection or use of the ST products and services described herein.
No license, express or implied, by estoppel or otherwise, to any intellectual property rights is granted under this document. If any part of thisdocument refers to any third party products or services it shall not be deemed a license grant by ST for the use of such third party productsor services, or any intellectual property contained therein or considered as a warranty covering the use in any manner whatsoever of suchthird party products or services or any intellectual property contained therein.
UNLESS OTHERWISE SET FORTH IN ST’S TERMS AND CONDITIONS OF SALE ST DISCLAIMS ANY EXPRESS OR IMPLIEDWARRANTY WITH RESPECT TO THE USE AND/OR SALE OF ST PRODUCTS INCLUDING WITHOUT LIMITATION IMPLIEDWARRANTIES OF MERCHANTABILITY, FITNESS FOR A PARTICULAR PURPOSE (AND THEIR EQUIVALENTS UNDER THE LAWSOF ANY JURISDICTION), OR INFRINGEMENT OF ANY PATENT, COPYRIGHT OR OTHER INTELLECTUAL PROPERTY RIGHT.
UNLESS EXPRESSLY APPROVED IN WRITING BY AN AUTHORIZED ST REPRESENTATIVE, ST PRODUCTS ARE NOTRECOMMENDED, AUTHORIZED OR WARRANTED FOR USE IN MILITARY, AIR CRAFT, SPACE, LIFE SAVING, OR LIFE SUSTAININGAPPLICATIONS, NOR IN PRODUCTS OR SYSTEMS WHERE FAILURE OR MALFUNCTION MAY RESULT IN PERSONAL INJURY,DEATH, OR SEVERE PROPERTY OR ENVIRONMENTAL DAMAGE. ST PRODUCTS WHICH ARE NOT SPECIFIED AS "AUTOMOTIVEGRADE" MAY ONLY BE USED IN AUTOMOTIVE APPLICATIONS AT USER’S OWN RISK.
Resale of ST products with provisions different from the statements and/or technical features set forth in this document shall immediately voidany warranty granted by ST for the ST product or service described herein and shall not create or extend in any manner whatsoever, anyliability of ST.
ST and the ST logo are trademarks or registered trademarks of ST in various countries.
Information in this document supersedes and replaces all information previously supplied.
The ST logo is a registered trademark of STMicroelectronics. All other names are the property of their respective owners.
© 2011 STMicroelectronics - All rights reserved
STMicroelectronics group of companies
Australia - Belgium - Brazil - Canada - China - Czech Republic - Finland - France - Germany - Hong Kong - India - Israel - Italy - Japan - Malaysia - Malta - Morocco - Philippines - Singapore - Spain - Sweden - Switzerland - United Kingdom - United States of America
www.st.com