Embed Size (px)
Citation preview

Comptes Rendus
Chimie
Selsabila Zara, Rachida Rihani, Walid Blel and Fatiha Bentahar
Anaerobic co-digestion of dairy raw by-products and Ulva sp.macroalgae: effect of organic and inorganic additives
Online first, 6th May 2021
<https://doi.org/10.5802/crchim.74>
Part of the Special Issue: Sustainable Biomass Resources for Environmental,Agronomic, Biomaterials and Energy Applications 2
Guest editors:Mejdi Jeguirim (Institut de Science des Matériaux de Mulhouse,France), Salah Jellali (Sultan Qaboos University, Oman)and Besma Khiari (Water Research and Technologies Centre, Tunisia)
© Académie des sciences, Paris and the authors, 2021.Some rights reserved.
This article is licensed under theCreative Commons Attribution 4.0 International License.http://creativecommons.org/licenses/by/4.0/
Les Comptes Rendus. Chimie sont membres duCentre Mersenne pour l’édition scientifique ouverte
www.centre-mersenne.org

Comptes RendusChimieOnline first, 6th May 2021https://doi.org/10.5802/crchim.74
Sustainable Biomass Resources for Environmental, Agronomic, Biomaterials and EnergyApplications 2 / Ressources de biomasse durables pour des applications environnementales,agronomiques, de biomatériaux et énergétiques 2
Anaerobic co-digestion of dairy raw by-products and
Ulva sp. macroalgae: effect of organic and inorganic
additives
Selsabila Zara a, Rachida Rihani ∗, a, Walid Blel b and Fatiha Bentahara
a Laboratoire phénomènes de Transfert. Faculté de génie mécanique et génie desprocédés. Université des Sciences et de la Technologie Houari Boumediene,U.S.T.H.B, BP 32 El-Alia, Bab-Ezzouar, Algérie
b Université de Nantes, CNRS, GEPEA, UMR 6144 F-44600 Saint-Nazaire, France
E-mails: [email protected] (S. Zara), [email protected] (R. Rihani),[email protected] (W. Blel), [email protected] (F. Bentahar)
Abstract. An investigation has been carried out for biogas production from dairy raw materials (DRM)and Ulva sp. macroalgae as a co-substrate in order to find a usefulness for these species. Some nutrientmedia have been selected to optimize methane yield. The effect of the mineral additive medium(medium I), based on bicarbonate compound, and the organic additive one (medium II), based onglucose, on the anaerobic digestibility of DRM has been assessed by using a single-stage anaerobicprocess. Four batch experiments (batch 1, batch 2, batch 3 and batch 4) have been performed andcorrespond respectively to DRM without inoculum, DRM with additive medium I, DRM with additivemedium II and DRM and Ulva sp. with additive medium I. Measurements of methane produced,chemical oxygen demand (COD), proteins, lipids, carbohydrates and volatile fatty acids have beencarried out. It has been found that the mineral additive medium provided a higher specific methaneyield compared to the organic additive one, the methane yield was about 0.208 LCH4 /gVS. The co-digestion of DRM with Ulva sp. showed that the methane yield reached was about 0.118 LCH4 /gVS,and revealed that the use of Ulva sp. as co-substrate reduces the concentration of volatile fatty acids,and enhances the biogas quality which contains 96% of methane and only 0.5 to 2% of hydrogensulphide. Furthermore, a first-order kinetic model has been applied to describe proteins, lipids andcarbohydrates biodegradation and showed that these three compounds follow a different kineticsaccording to the composition of the medium and the presence or not of additive medium.
Keywords. Dairy raw materials, Additives, Ulva sp. macroalgae, Biogas, Volatile fatty acids.
Online first, 6th May 2021
∗Corresponding author.
ISSN (electronic) : 1878-1543 https://comptes-rendus.academie-sciences.fr/chimie/

2 Selsabila Zara et al.
1. Introduction
According to the International Energy Agency reportentitled “key world energy statistics” natural gas pro-vided about 20.3% of the total world energy con-sumption in 2014 [1]. The methane is the main com-ponent of natural gas and can be used as a fuel oras a feedstock in the chemical industry, dependingon the quality of the processed gas. Biogas can beconsidered as a replacement for fossil gas fuels usedin transport and power production, in order to han-dle environmental concerns [2–4]. It can be producedby the anaerobic digestion (AD) of organic mattercontained in food processing wastes, lignocellulosicbiomass, and animal manures, which contain carbo-hydrates, fats and proteins. Often, these feedstocksare available at a low cost, thus making the produc-tion of biogas economically more profitable [5].
The dairy industry was an important world eco-nomic driver for many years, and it remains so today,it accounts since almost $400 billion in 2015 [6].In addition, among the food processing indus-tries, the processing of milk consumes substan-tial amounts of water to ensure the quality controland hygiene standards, thus, large quantities of ef-fluents are generated [7]. For example, the Algeriandairy industry generates nearly 47,000 t only for thewhey, which can produce up to 1.41 million m3 ofmethane [8].
The physico-chemical characteristics of the re-lated produced effluents are variable. They dependon the targeted dairy products and the used clean-ing procedures [9]. For instance, the chemical oxy-gen demand (COD) contents of effluents from dairyindustry vary regarding the applied processing. Ac-cording to Matos et al. [5], the milk processinggenerate effluents with average COD value around3000 mg·L−1. While, this value becomes much higherin the case of cheese production and can reach about50,000 mg·L−1 [8]. Several dairy industries, particu-larly, those using cheese whey, discharge effluentswith low alkalinity. The use of these substrates forbiogas production, increases the volatile fatty acidsproduction which could significantly inhibit the ac-tivity of methanogenic bacteria [10].
Demirel et al. [11] emphasize that the presenceof certain compounds such as fats, suspended solidsand nutrients (nitrogen and phosphorus) also con-tribute in the increase of the COD level. If dairyeffluents are not properly disposed, they may resultin significant environmental hazards [12]. Indeed, in-effective and inefficient treatment of these wastesmay contribute to the eutrophication of waters. Thelatter can lead to serious water related quality prob-lems such as loss of biodiversity and toxic effects ofalgal toxins on the whole ecosystems [13].
Among the available techniques for biologicalwaste treatment, anaerobic digestion (AD) of dairyindustries is suggested as a truly sustainable pro-cess which can handle the contained high organiccontents. The effluents from dairy industries have ahigh organic matter and low alkalinity due to the by-products generated, several solutions have been ad-vanced, such as the co-digestion by using biomasseswith large buffering capacity or the addition of chem-icals compounds [13–16].
Macroalgae accumulation in the near-shore areasand their subsequent decomposition can constitutea particularly serious threat to the marine ecosys-tem [17]. Particular interest may be assigned to themacroalgae or microalgae biomasses as feedstocksto produce energy [18]. Indeed, macroalgae biomasscan be used as potential materials for the biogas andbioethanol production, because of their high level ofcarbohydrates and low contents of lignins [3].
Ulva species, well known as sea lettuce is eas-ily biodegradable and can provide several nutri-ents and minerals to sustain bacterial growth [19].This species remains less valued than other algalbiomass at industrial scale due to the seasonality ofthe seaweed availability and the high H2S content inthe biogas produced by anaerobic digestion of thismacroalgae [20,21].
Co-digestion can improve AD performance andstability by monitoring the ratio of carbon/nutrient,overcoming deficiencies of some elements, improv-ing the buffering effect, and reducing the effect ofsome inhibitors compounds [22–25]. The use of Ulvasp. as co-substrate with the dairy raw effluents may
C. R. Chimie — Online first, 6th May 2021

Selsabila Zara et al. 3
enhance therefore the properties of the feedstockmixture and methane production, thus promotingthe activity of methanogen bacteria compared to thesulfate-reducing ones, given that these propertieswere underlined during the co-digestion of this al-gae with other substrates [23,26,27]. Indeed, the al-gal biomass has the advantage to be biodegradableand has a high content of organic matter and othermacronutrients [28].
The bicarbonate ion is often used in some appli-cations as a buffering effect and can be added inthe medium to buffer the pH variation [8,9]. Further-more, bacterial activity could also be improved byadding compounds that stimulate their growth [29].The production of biogas using industrial effluentsincluding additives media to activate methanogensbacteria remains a better way to treat these wastes,while reducing greenhouse gas emissions.
Previous studies have treated the effect of nitro-gen, contained in the urea, and the oligo-elements onbiogas production from sugarcane vinasse [16], andshowed that a stable biogas production is obtained.This result is explained by the sufficient alkalinity ofthe medium even at higher OLR (9.6 gCOD·L−1·d−1)and lower HRT (2.5 days), since the addition of es-sential micronutrients stimulated the methanogenicactivity avoiding major VFA accumulation. While theaddition of phosphate in the form of KH2PO4 in-duced volatile fatty acids accumulation [16].
During the anaerobic digestion of raw by-products, it is necessary to add a buffering medium,since the rapid degradation of the soluble com-pounds causes the pH drop and could compromisethe digester stability [30]. Co-digestion of a mixturecontaining dairy effluents is often responsible of theproduction of VFA. It is therefore important to testthe effect of some additives media to remedy thisproblem. The aim of this study was to highlight theenergetic valorization, using anaerobic digestion, oflocal wastes generated from dairy industry. The co-digestion of this effluent with the macroalgae Ulvasp. was also performed in order to explore this sub-strate present in significant quantities in the Algeriancoast and responsible of the release of a large amountof H2S by natural fermentation. Additives media in-cluding bicarbonate or glucose for methanogen bac-teria activation or pH stabilization have been usedon the basis of our previous study [31] and the yieldsof anaerobic digestion have been compared to the
co-digestion of DRM by-products and Ulva biomass.Biogas production and volatile fatty acids (VFAs)accumulation have been assessed during this study.
2. Materials and methods
2.1. Substrate and inoculum characterization
The DRM selected in this study are the effluents pro-vided from the washing unit and the expired dairyproducts, characterized by their high COD. The plantis located at Boudouaou, near of Algiers (Algeria).This plant is ranked amongst the top ten in term ofproducing and selling of fruit juices in Algeria. Thesubstrate to inoculum ratios (S/I) are taken 14.79 and22.13 respectively for batch with nutrient medium Iand medium II, respectively. The used Ulva sp. wascollected from Bordj-El Bahri coastal marine areas,north of Algiers (Algeria). The macroalgae was driedat 70 °C during 24 h and then crushed according toVergara-Fernández et al. [32]. The dairy raw materialsamples were collected fresh and stored immediatelyat 4 °C until subsequent use throughout the experi-mentation period.
2.2. Analytical methods
The organic matter degradation has been investi-gated by monitoring COD evolution according tothe procedure reported by Wolf and Nordmann [33].For carbohydrates characterization before and af-ter the AD process, the phenol-sulfuric acid methodhas been used [34]. Proteins and lipids concentra-tions are determined respectively by using Lowry etal. [35] and Bligh and Dyer [36] methods. A highperformance liquid chromatography (HPLC) (AgilentYL9100) has been used in order to estimate the evo-lution of the VFA concentrations using a C8 col-umn (5 µm–25× 0.46). The mobile phase is the sul-phuric acid (0.005 M) at the flow rate was fixed to0.7 mL/min. The column temperature was set at30 °C and the detection was made spectrophotomet-rically at a wavelength of 210 nm. The pH, the redoxpotential, the conductivity and the temperature havebeen measured using an Inolab multi-parameter720 device (Prolabmas, MurniSwadaya, Indonesia).Concerning the biogas composition, a coupling be-tween gas chromatography and mass spectrometry(GC/MS) (Perkin Elmer Clarus 600, Perkin Elmer,
C. R. Chimie — Online first, 6th May 2021

4 Selsabila Zara et al.
Waltham, MA, USA) has been used. Percentages ofmethane and carbon dioxide (% v/v) present in thebiogas have been determined by comparing the sam-ple biogas with pure standard gases. The GC has beenfitted with an Rtx®-VMS Column (60 m × 250 µmID) (Restek Corporation, Bellefonte, PA, USA). He-lium has been used as the carrier gas at a flow rateof 1 mL/min. The oven temperature has been setto 40 °C with a rate increase of 3 °C/min until thetemperature of 180 °C has been reached, then ithas been kept at this temperature for 3 min. Theinjector and detector temperatures have been setto 180 °C.
2.3. Experimental set-up
Experiments have been carried out in a cylindricalstainless steel digester at with a conical bottom (Fig-ure 1). This digester has 15 cm of diameter and 30 cmof height with a total volume of 5 L. This geometryis well suited to perform anaerobic digestion of low-viscous effluent [37]. The mixing was promoted byan impeller of 0.14 m diameter, which was locatedat a distance about 1/3 above the bottom. This im-peller turns at 150 rpm, inducing a radial flow in-side the fermenter. The ratio of bioreactor diameterto impeller one was about 1.071. To heat and controlthe operating temperature during the AD process, thebioreactor was equipped wi th an integrated heat-ing element and a thermostat. On the top of the re-actor, several ports have been placed in the tight fit-ting lid, one serves to monitor the output of biogas,while the other control several parameters throughinserted probes such as: pH, temperature, and to col-lect liquid samples for consequent analysis. The di-gester is fitted with a purge valve at the bottom of theconical arrangement for an easy draining of the efflu-ent. A stainless steel flange has also been included inthe digester in order to prevent gas leakage. The ex-periments have been carried out for an initial pH of7.1 which is adjusted by adding NaOH or HCl (respec-tively at 2 N and 1.6 N).
Four batch experiments (batch 1, batch 2, batch3 and batch 4) were performed. The volume of dairyraw material of each digester was about 4 L. 0.5 Lof inoculum contained medium I or medium II wereadded to the dairy raw material in the case of batches2, 3 and 4 to activate methanogenic bacteria or to en-sure stable operation, the volume choice is based on
Figure 1. Experimental set-up. (1) bioreactor;(2) jacket; (3) pH control; (4) Rushton turbine;(5) electric heater; (6) drain valve; (7) recyclingvalve; (8) substrate; (9) gas outlet.
the C/N ratio and according to Zerrouki et al. [37].The AD of the batch 1 has been performed withoutinoculum in order to highlight the contribution of en-dogenous lactic acid bacteria of the substrate in bio-gas production. 3 g of Ulva sp. having a COD of about52 g/L was used as a co-substrate in batch 4. This al-gae mass choice is based on the corresponding I/S ra-tio, according to the study of Karray et al. [17], whichshowed that an optimal yield of biogas productionwas obtained at this condition.
Samples were taken daily from the sampling portto measure COD, VFA, lipids, protein, carbohydratesand pH and the tests were performed in duplicates.The digester was operated during 35 days.
2.4. Kinetic modeling
2.4.1. Biogas yield
Biogas yield was expressed as a function of theCOD equivalent using the following equation:
yBiogas =VBiogas
COD(1)
C. R. Chimie — Online first, 6th May 2021

Selsabila Zara et al. 5
where yBiogas is the biogas yield (Lbiogas·g−1·L), VBiogas
the volume of produced biogas (L) and COD the de-graded chemical oxygen demand (g·L−1).
2.4.2. Biogas production kinetics
Kinetic study of anaerobic digestion of DRM withadditive mediums and Ulva sp. macroalgae as a co-substrate was carried out using a nonlinear kineticmodel. Kinetic parameters are estimated by fittingthe experimental cumulative biogas data with themodified Gompertz model [38]:
B(t ) = P ·exp
{−exp
[Rm ·e
P(λ− t )+1
]}(2)
where B(t ) is the cumulative methane produced dur-ing the digestion time t (L/gVS), P is the methaneproduction potential (L/gVS), Rm is the maximummethane production rate (L/gVS·d), λ is the lag phaseduration (d) and “e” is a mathematical constant(equal to 2.718281828).
Equation (2) has been regarded as a valuable em-pirical non-linear model to predict data of anaerobicdigestion using different types of reactors [39,40].
2.4.3. Kinetics of substrates biodegradation
The biogas production depends mainly of theamount of COD, presents under carbohydrates, pro-teins and lipids compounds. Food waste consists ofthis three main organic compounds, which lead intodifferent biogas yields and bioconversion rates [41].The removal rate of these substrates can be modelledusing the following equation [42]:
C (t ) = a +be−kt (3)
where, C (t ) is the amount of organic matter at time t ,“a” is a constant, “b” is the amount of biodegradableorganic matter, and “k” is the reaction rate constant.
2.4.4. Statistical analysis
Regression coefficients (R2) between experimen-tal data and estimated during fermentation process,were estimated. Standard deviations (SD) and coef-ficients of variation (CV) were calculated for the ki-netic parameters for each batch. The Tuckey-Kramertest (p < 0.05) was used for analysis of variance(ANOVA).
Table 1. Elemental composition of Ulva sp.
Element wt% Element wt%
C 48.05
N 5.93 Cl 0.09
O 31.92 K 0.09
Na 0.12 Ca 4.84
Si 0.28 Fe 0.19
P 0.18 Cu 0.30
S 4.73
3. Results and discussion
3.1. Composition of dried Ulva sp.
Elementary analysis, provided the elementary com-position of Ulva sp., is presented in Table 1. The val-ues found revealed a high percentage of carbon andoxygen, this macroalgae contains N, S and microele-ments such as Cu, Ca, P, K and Fe which are consid-ered as beneficial for the AD. In many previous works,these elements were used as additive elements to im-prove the AD yield [43]. Thus, the used of this algalbiomass as a co-substrate is an important advantagedue to its high content of nutrients and its thinnerand simpler morphological structure, and a large sur-face area, with more efficient digestion compared toother macroalgae [44]. Moreover, this biomass offersmore ecological characteristics, such as, biodegrad-ability.
3.2. Batch experiments
The composition and characteristics of substratesand inocula are given in Tables 2 and 3. Additivesmedia compositions were chosen based on the syn-thetic salt often used in the sludge activity tests. Glu-cose was chosen in medium II because it was oftenused as a co-substrate to support microbial activ-ity [45] and enhances methane production [37]. Theiron was often supplied in the form of FeCl3 in nu-trient medium to reduce the H2S content in the bio-gas composition and to further reduce the cost forH2S treatment. AD process required macronutrientsthat can be supplied in the form of Na2HPO4, MgSO4,CaCl2, they were considered as essential elements ofbiomass and can be used as buffering agent to keepdigester stability [46,47]. The effluents were selected
C. R. Chimie — Online first, 6th May 2021

6 Selsabila Zara et al.
Table 2. Composition of additives media
Medium I Medium II
Component Concentration (g·L−1) Component Concentration (g·L−1)
NaHCO3 1.68 C6H12O6 4.00
NH4Cl 1.44 Na2HPO4 0.90
MgSO4, 7H2O 0.28 MgSO4, 7H2O 0.20
KH2PO4 0.60 FeCl3 0.04
CaCl2, 2H2O 0.05 CaCl2, 2H2O 0.10
Yeast extract 0.10
Table 3. Substrate and inoculum characterization
Experiment Batch 1 Batch 2 Batch 3 Batch 4
Dairy raw materials (L) 4.5 4 4 4
Inoculum (L) — 0.5 0.5 0.5
Ulva sp. macroalgae (g) — — — 3
Additive medium — Nutrient medium I Nutrient medium II Nutrient medium I
C/N ratio 40.81 27.87 41.82 22.57
VS (g·L−1) 96.6±6.489 99.4±6.677 99.5±6.684 55.89±3.754
COD (gO2 ·L−1) 100±6.717 132±8.867 136±9.135 96±6.448
pH 6.8 7 7 7
Conductivity (µS·cm−1) 4.28 7.44 4.93 4.59
Carbohydrates (g·L−1) 87.23±5.859 91.92±6.175 84.41±5.670 72.23±4.852
MSS (mg·L−1) 31±2.081 7±0.470 4±0.268 24±1.612
Lipids (g·L−1) 0.085±0.006 0.098±0.006 0.056±0.004 0.034±0.002
Protein (g·L−1) 5.347±0.359 5.937±0.398 5.285±0.355 3.855±0.258
Ammonium Nitrogen (g·L−1) 0.435±0.029 0.493±0.033 0.839±0.056 0.903±0.061
Acetic acid (g·L−1) 0.090±0.006 0.018±0.001 0.210±0.014 0.500±0.034
Propionic acid (g·L−1) 0.006±0.0004 0.004±0.003 0.116±0.008 0.027±0.002
Butyric acid (g·L−1) 0.050±0.003 0.018±0.001 0.009±0.0006 0.035±0.0023
COD: Chemical Oxygen Demand; VS: Volatile solid; MSS: Dry matter in suspension.
according to their organic loads and C/N ratios. Theinitial C/N was about 40.81, 27.87, 41.82 and 22.57,respectively for batches 1, 2, 3 and 4. According toChandra et al. [48], the optimum C/N ratio is between20 and 40. The C/N ratio in algal biomass is low, it isabout 10 which leads to ammonia accumulation. Toovercome this accumulation, addition of organic ma-terials at high COD rate is often required in order toenhance the digestion process. The initial chemicalorganic load was about 100, 132, 136 and 96 gO2 ·L−1
respectively for batch 1, batch 2, batch 3 and batch 4.The analysed samples are characterized by a high
COD load which corresponds to the values reportedby Escalante et al. [49]. The chemical composition ofeffluents is characterized by high carbohydrates andproteins and low lipids contents making them moresuitable for methane production.
3.3. Methane production analysis under the dif-ferent substrates mixing
The experimental profiles of the cumulative bio-gas volume for batch reactors performed undermesophilic digestion (35 °C) are depicted in Figure 2.
C. R. Chimie — Online first, 6th May 2021

Selsabila Zara et al. 7
Table 4a. Kinetic model parameters of modified Gompertz model
Batch 1 Batch 2 Batch 3 Batch 4
Methane yield (LCH4 /gVS) 0.0792 0.208 0.112 0.118
P (LCH4 /gVS) 0.091 0.227 0.112 0.118
Rmax (LCH4 /gVS·d) 0.0034 0.0091 0.0068 0.0086
λ (d) 3.057 4.625 0.075 0.063
R2 0.993 0.995 0.974 0.973
RMSE 0.0027 0.0052 0.0077 0.0082
Figure 2. Methane yield production in batchreactors (T = 35 °C, pH = 7).
It can be seen that the cumulative methane tendstowards a maximum value of 0.208 LCH4 /gVS in thecase of batch 2, which shows the high potential ofthis complex substrate for methane production withlonger production period. While, the cumulative bio-gas production exhibits an asymptotical profile forbatches 1, 3 and 4. Table 4a summarizes the kineticparameters of the modified Gompertz model. Themaximum methane production rate (Rm) was moreimportant in batch 2 than the other batches, it wasabout 0.0091 LCH4 /gVS·d, while it was only about0.0034, 0.0068 and 0.0086 LCH4 /(gVS·d) in batches1, 3 and 4, respectively. This could be explained bythe high methane yield after 15 days of AD witha high slope compared to the other batches (Fig-ure 2). This result allows to expect a high methaneproductivity during the co-digestion of DRM andUlva sp. biomass. Modelled lag phase duration, λ,was significantly reduced in batches 3 and 4, thevalues obtained were 0.075 d and 0.063 d, respec-
Table 4b. Kinetic model parameters of first or-der model
Batch 1 Batch 2 Batch 3 Batch 4
k (d−1) 0.0075 0.0009 0.0894 0.1040
R2 0.993 0.980 0.979 0.975
RMSE 0.0024 0.0106 0.0053 0.0064
tively, which indicates that the methane productionwas beginning immediately on the first day of di-gestion. Thus, the addition of nutrient medium Iwith Ulva sp. biomass (batch 4) or the use of nu-trient medium II (batch 3) shows a low lag phase,while this parameter is higher in batches 1 and 2(3.057 d and 4.625 d, respectively). In this case, theundissolved compounds such as proteins and fatstake more time to decay into monomers [50]. In thisstudy, the hydrolysis constant remains low comparedto other studies which used the dairy by-products.It was in the range of 0.0009–0.104 d−1 for all batches(Table 4b). Indeed, the value of 0.084 d−1 was pre-viously reported by Kafle and Chen [39] for dairymanure, while the range of 0.36–0.55 d−1 has beenpreviously reported by Mainardis et al. [51] for somecheese whey varieties. It should be noted that a goodagreement is observed between the methane yieldreached (LCH4 /gVS) and the predicted data using (2),with correlation coefficients R2 varied from 0.973 to0.995 and the RMSE value fell within the range of0.0027–0.0082.
The specific methane yields gradually increas-ing and then levelling off at 0.208 LCH4 /gVS,0.112 LCH4 /gVS, 0.118 LCH4 /gVS and 0.079 LCH4 /gVS,for batches 2, 3, 4 and 1, respectively after 35 daysof AD. Macroalgae added in batch 4 allowed to bringessential elements and to create a synergistic ef-
C. R. Chimie — Online first, 6th May 2021

8 Selsabila Zara et al.
fect by alleviating the imbalance of nutrients. How-ever, lipids accumulation in batch 4 causes a slowerhydrolysis rate, resulting in a lower methane yieldcompared to batch 2 and confirms results obtainedby Rodolfi et al. [52]. The methane production ismore meaningful in batch 2 than the other batches,certainly due to the presence of inorganic additive(medium I) which ensures an appropriate nutrientbalance between C and N, in addition to the digesterstability. This substrate has a good biodegradabilityof the complex organic matter without any inhibitoryeffect upon the biomass. These findings were consis-tent with BMP values of the literature for dairy wastesand Ulva sp. It was about 0.208 LCH4 ·g−1
VS in the caseof dairy residues, while in the case of Ulva sp., theBMP values varied between 0.094–0.177 LCH4 ·g−1
VSdepending upon the pretreatment techniquesemployed [26].
Compared to the literature, the methane produc-tion from batch 2 can be considered as a promisingway forward regarding the use of combined treat-ment of dairy residues in AD. Lhanafi et al. [53]previously reported a maximum methane yieldof about 0.093 LCH4 /gVS. These authors added amixture of dairy residues into inoculum which in-cluded diluted sludge of methanogenic bacteriain addition to formic, propionic and lactic acids.Some authors have underlined a methane yield of0.197 LCH4 /gVS from anaerobic digestion of man-ufacturing milk. Their yield has been improved onthe basis of mixing ratios performed between foodwaste leachate from dairy factory and wastewatertreatment sludge, the methane produced variedfrom 0.118 to 0.223 LCH4 /gVS [54]. Low methaneyield has been recorded from cheese whey wastew-ater effluents; it was only about 0.065 LCH4 /gVS [55].Significant methane yields have been reported byMainardis et al. [51] which ranged from 0.353 to0.437 NL CH4/gVS from a variety a cheese whey. Thedifference may be due to the operating conditionsand the composition of substrate. Indeed, these au-thors have mixed the sludge with dairy substrateat different ratios and the obtained mixtures arecharacterized by low organic content (50.10–78.73g/L) compared to our study (96–136 g/L). Besidesthat, no-pretreatment of substrate has been per-formed in this work. Moreover, the co-digestionof the mixture of cow dung and Ulva sp. led tomethane yield of 0.195 LCH4 /gVS at Ulva sp.: cow
Figure 3. Comparison of modelled (accordingto (3)) and experimental chemical oxygen de-mand for batch reactors (T = 35 °C, pH = 7).
dung ratio of 1:1 [56] which is higher to the methaneyield found in this study at Ulva sp. DRM ratioof 1/10.
In addition, it was also known that the AD ofthis macroalgae specie gave low potential methane(0.097 L/gVS according to Vanegas and Bartlett [57]).This low biogas yield was due to the low VS con-tent and a late methanogenic phase [58]. However, inthis study, it was shown that it is possible to valorizethis type of waste, which invades the Algerian coasts,by anaerobic digestion. Even if the biogas yield waslower in the batch containing this macroalgae, it isobserved that the quality of this biogas is better withhigher methane content.
The co-digestion of DRM with Ulva sp. macroal-gae overcomes this problem of valorization of the al-gae effluent present in large quantity on the Mediter-ranean coast, despite the low initial COD value of themixture (96 gO2 ·L−1) compared to the DRM whereno inoculum was added (100 gO2 ·L−1 at batch 1).Note that in the anaerobic digestibility process ofDRM, the lactic and non-lactic acid bacteria playan important role in organic compounds degrada-tion to methanogenic substrates [59]. Then, the mostbiodegradable organic fraction can easily be con-verted into biogas. This case is observed in batch 1where no inoculum was added. The biogas is pro-duced only from the endogenous flora, mainly lac-tic acid bacteria. The dimensionless number of COD(C/C0) of batches 1, 2, 3 and 4, were 0.28, 0.15,
C. R. Chimie — Online first, 6th May 2021
Selsabila Zara et al. 9
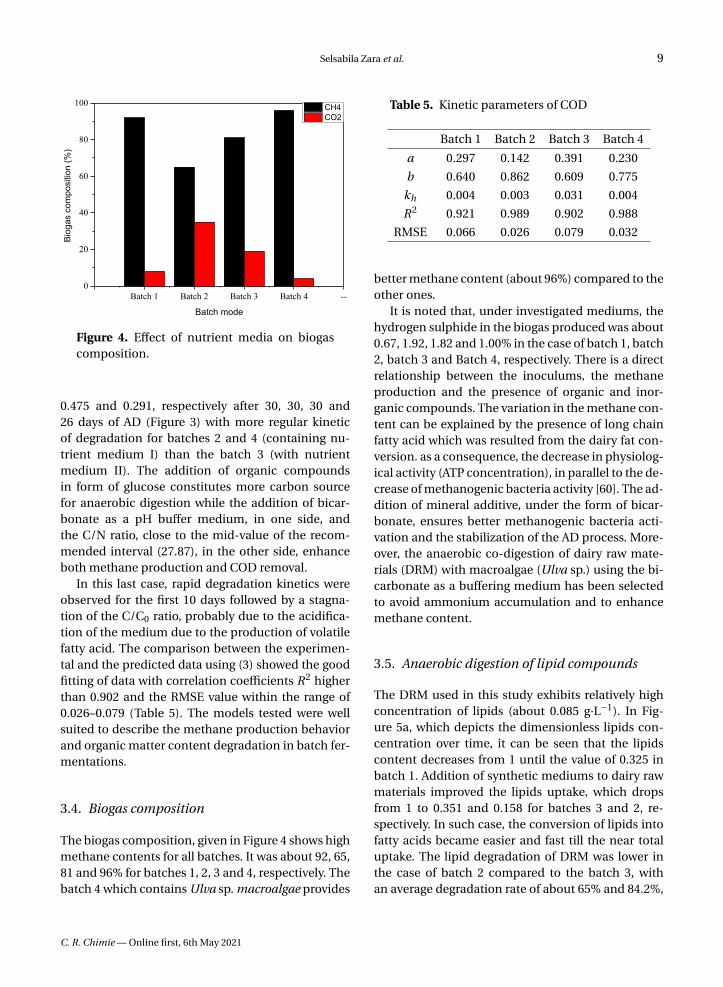
Figure 4. Effect of nutrient media on biogascomposition.
0.475 and 0.291, respectively after 30, 30, 30 and26 days of AD (Figure 3) with more regular kineticof degradation for batches 2 and 4 (containing nu-trient medium I) than the batch 3 (with nutrientmedium II). The addition of organic compoundsin form of glucose constitutes more carbon sourcefor anaerobic digestion while the addition of bicar-bonate as a pH buffer medium, in one side, andthe C/N ratio, close to the mid-value of the recom-mended interval (27.87), in the other side, enhanceboth methane production and COD removal.
In this last case, rapid degradation kinetics wereobserved for the first 10 days followed by a stagna-tion of the C/C0 ratio, probably due to the acidifica-tion of the medium due to the production of volatilefatty acid. The comparison between the experimen-tal and the predicted data using (3) showed the goodfitting of data with correlation coefficients R2 higherthan 0.902 and the RMSE value within the range of0.026–0.079 (Table 5). The models tested were wellsuited to describe the methane production behaviorand organic matter content degradation in batch fer-mentations.
3.4. Biogas composition
The biogas composition, given in Figure 4 shows highmethane contents for all batches. It was about 92, 65,81 and 96% for batches 1, 2, 3 and 4, respectively. Thebatch 4 which contains Ulva sp. macroalgae provides
Table 5. Kinetic parameters of COD
Batch 1 Batch 2 Batch 3 Batch 4
a 0.297 0.142 0.391 0.230
b 0.640 0.862 0.609 0.775
kh 0.004 0.003 0.031 0.004
R2 0.921 0.989 0.902 0.988
RMSE 0.066 0.026 0.079 0.032
better methane content (about 96%) compared to theother ones.
It is noted that, under investigated mediums, thehydrogen sulphide in the biogas produced was about0.67, 1.92, 1.82 and 1.00% in the case of batch 1, batch2, batch 3 and Batch 4, respectively. There is a directrelationship between the inoculums, the methaneproduction and the presence of organic and inor-ganic compounds. The variation in the methane con-tent can be explained by the presence of long chainfatty acid which was resulted from the dairy fat con-version. as a consequence, the decrease in physiolog-ical activity (ATP concentration), in parallel to the de-crease of methanogenic bacteria activity [60]. The ad-dition of mineral additive, under the form of bicar-bonate, ensures better methanogenic bacteria acti-vation and the stabilization of the AD process. More-over, the anaerobic co-digestion of dairy raw mate-rials (DRM) with macroalgae (Ulva sp.) using the bi-carbonate as a buffering medium has been selectedto avoid ammonium accumulation and to enhancemethane content.
3.5. Anaerobic digestion of lipid compounds
The DRM used in this study exhibits relatively highconcentration of lipids (about 0.085 g·L−1). In Fig-ure 5a, which depicts the dimensionless lipids con-centration over time, it can be seen that the lipidscontent decreases from 1 until the value of 0.325 inbatch 1. Addition of synthetic mediums to dairy rawmaterials improved the lipids uptake, which dropsfrom 1 to 0.351 and 0.158 for batches 3 and 2, re-spectively. In such case, the conversion of lipids intofatty acids became easier and fast till the near totaluptake. The lipid degradation of DRM was lower inthe case of batch 2 compared to the batch 3, withan average degradation rate of about 65% and 84.2%,
C. R. Chimie — Online first, 6th May 2021

10 Selsabila Zara et al.
Figure 5. Evolution of organic material degradation during anaerobic digestion of dairy raw materials:(a) lipids, (b) protein and (c) carbohydrate.
respectively. This result can be related to the effectof inorganic additive (based on bicarbonate) or or-ganic additive (based on glucose) into the mediumon the anaerobic digestibility of DRM, which in turnimproved both lipids uptake and biogas production.It is noted that there was competition between bac-terial degradation of lipids and proteins. It is alsonoted that the milk fat has an inhibiting effect on theactivity of methanogenic bacteria [45]. For Batch 4,the analysis of lipids degradation distinguished twophases (Figure 5). The first phase is between 1 and0.573 and the second one from 0.573 to 0.855 wherethe lipids increase after 26 d of anaerobic digestion.
This is due to the accumulation of intermedi-ate compounds such as the long chain fatty acids(LCFAs) and the volatile fatty acids (VFAs) [61], thataffect the lipid degradation process, this then repre-sents a limiting mass transfer between substrate and
microbial cells. This mass transfer depends to diffi-culty in transport and transform from liquid phaseto solid and biological degradation of LCFAs [62]. Ad-sorption onto cell wall is restricted by bacteria coatedLCFAs thus decrease the substrate degradation andyield of biogas [63].
3.6. Anaerobic digestion of protein compounds
The protein content is one of the most importantcriteria for the milk producers especially for caseinand nitrogen sources in general. Figure 5b gives theprotein concentration evolution for a series of batchreactors. It can be seen that at the beginning, the pro-tein levels dropped quickly for the proposed series.This means that the lactic and non-lactic acid bacte-ria converted both the proteins and the lipids com-pounds, but the conversion rate was more important
C. R. Chimie — Online first, 6th May 2021

Selsabila Zara et al. 11
Table 6. Kinetic parameters of protein
Batch 1 Batch 2 Batch 3 Batch 4
a 0.265 0.161 0.141 0.292
b 0.751 0.845 0.813 0.678
k 0.008 0.012 0.009 0.026
R2 0.818 0.985 0.943 0.823
RMSE 0.096 0.032 0.073 0.111
for proteins. The reaction rate constants reached val-ues of 0.008, 0.012, 0.009 and 0.026 h−1, in the case ofbatches 1, 2, 3 and 4, respectively.
It can be seen also that there is a good fit betweenthe experimental and modelled curves for the pro-teins uptake in the case of batches 2 and 3, wherethe R2 and RMSE values were respectively 0.985 and0.032 for the first case and 0.943 and 0.079 for thesecond one (Table 6). However, for batches 1 and4, the R2 values showed that the fitted data by thefirst order kinetic model for proteins uptake are de-viated from the experimental ones (0.818 and 0.823,respectively).
Similar findings have been previously reportedby [60]. In such case, the dimensionless protein con-centrations decreased from 1 until the average valuesof 0.287, 0.183 and 0.122 after 30, 23 and 25 days ofdigestion in batches 1, 2 and 3 respectively.
This decrease means that the nitrogen was usedas a nutrient by methanogens and lactic acid bac-teria, and also converted into ammonia as previ-ously pointed out by [64]. It has been found that agood rate of proteins assimilation by methanogensbacteria has been occurred in batches 2 and 3, par-ticularly, when the sodium bicarbonate has beenadded to the medium, probably due to the effectof this compound on the pH of the fermentationmedium. Indeed, according to Browne and Mur-phy [65], the methane production reduction can beinduced by the increase of the total ammonia nitro-gen rate in the digester at high VS organic loads. Thus,sodium bicarbonate addition could moderate this ef-fect. Note that the medium II contains glucose thatconstitutes other carbon source, easily biodegrad-able, and can explain the utilization of proteins andlipids rather than carbohydrates in the AD. In thecase of batch 4, the dimensionless protein concen-tration goes down to 0.264 after 22 days of fermen-tation with uptake of 74% and a maximum reaction
Table 7. Kinetic parameters of carbohydrates
Batch 1 Batch 2 Batch 3 Batch4
a 0.034 0 0.231 0.075
b 0.994 1.000 0.694 0.877
k 0.002 0.003 0.006 0.011
R2 0.965 0.962 0.917 0.985
RMSE 0.057 0.063 0.072 0.036
rate constant of 0.026 h−1. This behavior is certainlydue to the complex composition of DRM with Ulvasp. which contains some types of proteins, carbohy-drates and lipids with different biodegradation be-havior. Indeed, it is known that carbohydrates aremore biodegradable in anaerobic medium than pro-teins and lipids, which take a longer time for hy-drolysis [66]. Moreover, it has been found an in-crease of the ammonia concentration to the valuesof 127.46 mg·L−1 and 119.86 mg·L−1 in batch 4 andbatch 2, respectively which remain below the value200 mg·L−1 previously reported by Elbeshbishy andNakhla [67].
3.7. Anaerobic digestion of carbohydrate com-pounds
Comparison of modelled and experimental carbo-hydrates digestion results for a series of batch reac-tors is given in Figure 5c. It shows that the carbohy-drates uptake occurred gradually in the same way fora series of batch reactors but at different rates. Theuptake of the proteins and the carbohydrates wasperformed exponentially and it seemed more pro-nounced and extremely fast in the case of proteins.The analysis of the reaction rate constant (k) con-firms this remark (Table 7). Indeed, for all batches,the constants kinetic, k, of carbohydrates degrada-tion showed lower values compared to those of pro-teins (0.008, 0.012, 0.009, 0.026 h−1 against to 0.002,0.003, 0.006 and 0.011 h−1 in batches 1, 2, 3 and 4,respectively for proteins and carbohydrates). This re-sult can be ascribed to the carbohydrates content inthe batch reactors.
In all cases, carbohydrates concentration de-creases were recorded at the beginning of the diges-tion, i.e. during the first 6 days. Note that in batch 1,the carbohydrates uptake reached the efficiency of
C. R. Chimie — Online first, 6th May 2021
12 Selsabila Zara et al.
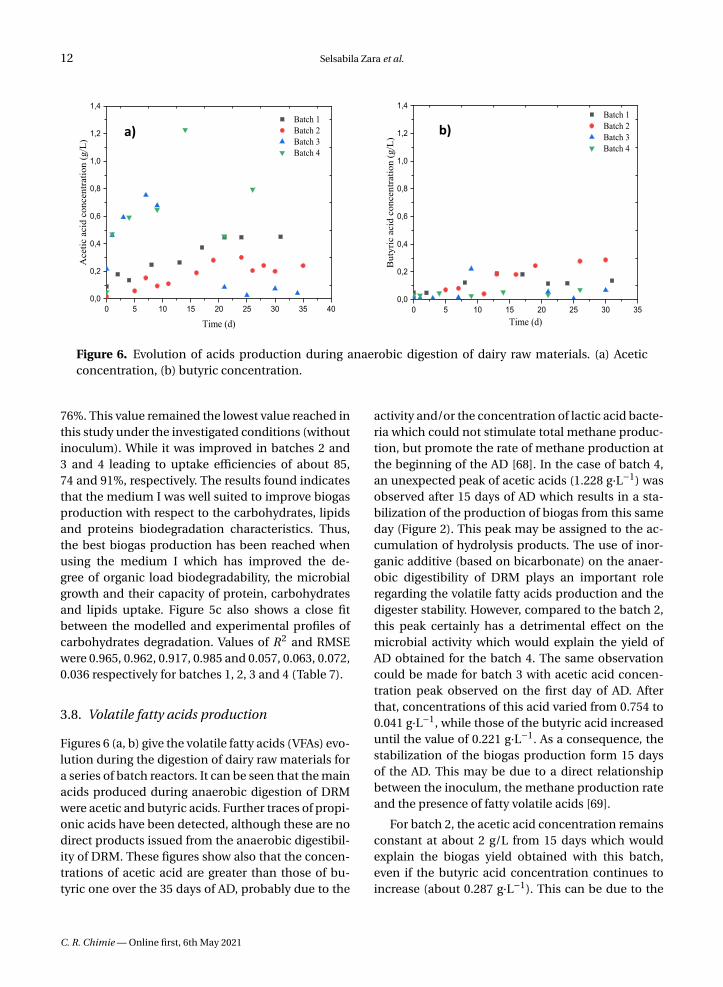
Figure 6. Evolution of acids production during anaerobic digestion of dairy raw materials. (a) Aceticconcentration, (b) butyric concentration.
76%. This value remained the lowest value reached inthis study under the investigated conditions (withoutinoculum). While it was improved in batches 2 and3 and 4 leading to uptake efficiencies of about 85,74 and 91%, respectively. The results found indicatesthat the medium I was well suited to improve biogasproduction with respect to the carbohydrates, lipidsand proteins biodegradation characteristics. Thus,the best biogas production has been reached whenusing the medium I which has improved the de-gree of organic load biodegradability, the microbialgrowth and their capacity of protein, carbohydratesand lipids uptake. Figure 5c also shows a close fitbetween the modelled and experimental profiles ofcarbohydrates degradation. Values of R2 and RMSEwere 0.965, 0.962, 0.917, 0.985 and 0.057, 0.063, 0.072,0.036 respectively for batches 1, 2, 3 and 4 (Table 7).
3.8. Volatile fatty acids production
Figures 6 (a, b) give the volatile fatty acids (VFAs) evo-lution during the digestion of dairy raw materials fora series of batch reactors. It can be seen that the mainacids produced during anaerobic digestion of DRMwere acetic and butyric acids. Further traces of propi-onic acids have been detected, although these are nodirect products issued from the anaerobic digestibil-ity of DRM. These figures show also that the concen-trations of acetic acid are greater than those of bu-tyric one over the 35 days of AD, probably due to the
activity and/or the concentration of lactic acid bacte-ria which could not stimulate total methane produc-tion, but promote the rate of methane production atthe beginning of the AD [68]. In the case of batch 4,an unexpected peak of acetic acids (1.228 g·L−1) wasobserved after 15 days of AD which results in a sta-bilization of the production of biogas from this sameday (Figure 2). This peak may be assigned to the ac-cumulation of hydrolysis products. The use of inor-ganic additive (based on bicarbonate) on the anaer-obic digestibility of DRM plays an important roleregarding the volatile fatty acids production and thedigester stability. However, compared to the batch 2,this peak certainly has a detrimental effect on themicrobial activity which would explain the yield ofAD obtained for the batch 4. The same observationcould be made for batch 3 with acetic acid concen-tration peak observed on the first day of AD. Afterthat, concentrations of this acid varied from 0.754 to0.041 g·L−1, while those of the butyric acid increaseduntil the value of 0.221 g·L−1. As a consequence, thestabilization of the biogas production form 15 daysof the AD. This may be due to a direct relationshipbetween the inoculum, the methane production rateand the presence of fatty volatile acids [69].
For batch 2, the acetic acid concentration remainsconstant at about 2 g/L from 15 days which wouldexplain the biogas yield obtained with this batch,even if the butyric acid concentration continues toincrease (about 0.287 g·L−1). This can be due to the
C. R. Chimie — Online first, 6th May 2021

Selsabila Zara et al. 13
conversion of lactate from glucose by Butyri bac-terium methylotrophicum as previously reported by(Shen et al. [70]). The increase in butyric acid canstimulate methanogens bacteria rather than their in-hibition Stronach et al. [10]. Volatile fatty acids arethe intermediate coproducts in the biogas produc-tion during the anaerobic digestion process, the lev-els reached are not toxic as long as batch 2 ensuresbuffering capacity, using additive medium I, to keepthe process stability. While, the co-digestion of DRMand Ulva sp. (batch 4) resulted in the accumulationof hydrolysis products, which explains the increase inthe concentration of the acetic acid.
Furthermore, for a series of batch reactors a con-tinuous mechanization mode has been suggestedto avoid accumulation of volatile acids and keepsubstrate concentrations constant. The continuousmode can be expected to provide better gas efficiencyof the pilot-scale dairy plants.
4. Conclusion
This study has been carried out to evaluate anaero-bic co-digestion performance of dairy raw materials(DRM) with macroalgae (Ulva sp.) In addition, the ef-fect of organic additive (based on glucose) and min-eral additive (based on bicarbonate) on the anaer-obic digestibility of DRM was also evaluated. Thedairy raw material containing the nutrient medium I(batch 2) is more suitable to improve biogas produc-tion, the highest specific methane yield reached, itwas about 0.208 LCH4 /gVS after 35 days. This nutrientmedium allows to improve the degree of anaerobicdigestibility of DRM, the microbial growth and theircapacity of protein, carbohydrates and lipids uptake,it may be a useful pattern to convert food industrystreams.
The co-digestion of DRM with Ulva sp. resultedin higher biogas yield compared to DRM only-fedcondition and enhances the biogas quality whichcontains only 0.5 to 2% of hydrogen sulphide. Themethane production is more meaningful in batch 2than the other batches, certainly due to the presenceof inorganic additive (medium I) which ensures anappropriate nutrient balance between C and N, inaddition to the digester stability. Lipids accumulationin batch 4 causes a slower hydrolysis rate, resulting ina lower methane yield compared to batch 2. Effect of
organic and inorganic additives in a series of anaer-obic laboratory tests to produce biogas from dairyresidues and macroalgal biomass can give a contri-bution to sustainability and circular economy per-spective.
The used models have well described the cumula-tive methane production and also the kinetic of theremoval organic matters (proteins, lipid and carbo-hydrates). This analysis showed that these three com-pounds follow a different kinetics according to thecomposition of the medium and the addition of or-ganic or inorganic media. Furthermore, the continu-ous mode and the co-digestion of DRM with Ulva sp.by optimizing the I/S ratio can be expected to providebetter methane yield.
Nomenclature
VBiogas Biogas volume produced during batch ex-periments (m3).
COD Chemical oxygen demand, gO2 ·L−1.
BP Cumulative biogas yield during the fer-mentation
P Cumulate biogas production (N·mL)
kh First order kinetic constant (h−1)
t Time (h).
Lu Total amount of biodegradable organicsmatter (gCOD/L)
MS Mineral solids
R2 Correlation coefficient
T Temperature (°C)
VFA Volatile fatty acids
y(t ) Amount of organic matter at time t
a Constant
b An initial amount of biodegradable organicmatter, and k is the reaction rate constant.
Acknowledgment
Authors gratefully acknowledged the financial sup-port from the Algerian ministry of scientific research.
References
[1] IEA, Key World Energy Statistics, International Energy Agecy,Paris, France, 2016.
[2] M. Jeguirim, S. Jellali, B. Khiari, C. R. Chim., 2020, 23, 583-587.
C. R. Chimie — Online first, 6th May 2021

14 Selsabila Zara et al.
[3] N. Boukaous, L. Abdelouahed, M. Chikhi, C. Mohabeer,B. Taouk, A. Meniai, C. R. Chim., 2020, 23, 623-634.
[4] C. Tanios, Y. Saadeh, M. Labaki, M. Boutros, C. Gennequin,H. L. Tidahy, A. Aboukaïs, E. Abi-Aad, C. R. Chim., 2020, 23,1-19.
[5] A. Matos, S. Abrahao, P. Lo Monaco, A. Sarmento, M. Matos,“Extraction capacity of plant grown in constructed wetlandsystems used to dairy wastewater treatment”, in 12th Inter-national Conference on Wetland Systems for Water PollutionControl (Venice), IWA, 2010.
[6] MarketLine, “Dairy Global Industry Guide 2015-2024”, 2020(accessed 18.06.12), http://www.researchandmarkets.com/research/e7e4d9/dairy_global_indu.
[7] E. Buabeng-Baidoo, N. Mafukidze, J. Pal, S. Tiwari, B. Srini-vasan, T. Majozi, R. Srinivasan, Chem. Eng. Res. Des., 2017,121, 81-91.
[8] A. Akbi, M. Saber, M. Aziza, N. Yassaa, Renew. Sustain. EnergyRev., 2017, 72, 240-245.
[9] M. Fahim, M. Hassanein, A. Abou Hadid, M. Kadah, “Impactsof climate change on the widespread and epidemics of sometomato diseases during the last decade in Egypt”, in III Inter-national Symposium on Tomato Diseases, vol. 914, 2010, 317-320.
[10] S. Stronach, T. Rudd, J. Lester, “Toxic Substances in Anaero-bic Digestion”, in Anaerobic Digestion Processes in IndustrialWastewater Treatment, Biotechnology Monographs, vol. 2,Springer-Verlag, 1986, 71-92.
[11] B. Demirel, O. Yenigun, T. T. Onay, Process. Biochem., 2005, 40,2583-2595.
[12] J. Rivas, A. R. Prazeres, F. Carvalho, J. Agric. Food Chem., 2011,59, 2511-2517.
[13] F. Carvalho, A. R. Prazeres, J. Rivas, Sci. Total Environ., 2013,445, 385-396.
[14] G. Luo, I. Angelidaki, Appl. Microbiol. Biotechnol., 2013, 97,1373-1381.
[15] S. Gao, Y. Huang, L. Yang, H. Wang, M. Zhao, Z. Xu, Z. Huang,W. Ruan, Energy Convers. Manag., 2015, 93, 166-174.
[16] L. Janke, S. Weinrich, A. F. Leite, H. Sträuber, C. M. Radetski,M. Nikolausz, M. Nelles, W. Stinner, Energy Convers. Manag.,2018, 168, 188-199.
[17] R. Karray, F. Karray, S. Loukil, N. Mhiri, S. Sayadi, WasteManag., 2017, 61, 171-178.
[18] M. El Ati-Hellal, F. Hellal, M. Dachraoui, A. Hedhili, C. R.Chim., 2007, 10, 839-849.
[19] J. Kim, H. Kim, G. Baek, C. Lee, Waste Manag., 2017, 60, 322-328.
[20] G. Bonanno, M. Orlando-Bonaca, Ecotoxicol. Environ. Safety,2018, 148, 44-71.
[21] P. Peu, J.-F. Sassi, R. Girault, S. Picard, P. Saint-Cast, F. Béline,P. Dabert, Bioresour. Technol., 2011, 102, 10794-10802.
[22] X. Dai, N. Duan, B. Dong, L. Dai, Waste Manag., 2013, 33, 308-316.
[23] X. Fonoll, S. Astals, J. Dosta, J. Mata-Alvarez, Chem. Eng. J.,2015, 262, 1268-1274.
[24] A. Khalid, M. Arshad, M. Anjum, T. Mahmood, L. Dawson,Waste Manag., 2011, 31, 1737-1744.
[25] J. G. Usack, L. T. Angenent, Water Res., 2015, 87, 446-457.[26] X. Briand, P. Morand, J. Appl. Phycol., 1997, 9, 511-524.[27] A. Bruhn, J. Dahl, H. B. Nielsen, L. Nikolaisen, M. B. Ras-
mussen, S. Markager, B. Olesen, C. Arias, P. D. Jensen, Biore-sour. Technol., 2011, 102, 2595-2604.
[28] M. E. Montingelli, S. Tedesco, A. G. Olabi, Renew. Sustain.Energy Rev., 2015, 43, 961-972.
[29] S. Arif, R. Liaquat, M. Adil, Renew. Sustain. Energy Rev., 2018,97, 354-366.
[30] A. P. Flores-Mendoza, H. Hernández-García, Y. Cocotle-Ronzón, E. Hernandez-Martinez, J. Chem. Technol. Biotech-nol., 2020, 95, 1946-1952.
[31] J. Fernández-Rodríguez, E. Robles, O. Gordobil, M. González-Alriols, J. Labidi, Chem. Eng. Trans., 2016, 52, 187-192.
[32] A. Vergara-Fernández, G. Vargas, N. Alarcón, A. Velasco,Biomass Bioenergy, 2008, 32, 338-344.
[33] V. Wolf, W. Nordmann, Abwasser, 1977, 24, 277-279.[34] M. Dubois, K. A. Gilles, J. K. Hamilton, P. t. Rebers, F. Smith,
Anal. Chem., 1956, 28, 350-356.[35] O.-I. Lowry, N. Rosebrough, A. Farr, R. Randall, J. Biol. Chem.,
1951, 193, 265-275.[36] E. G. Bligh, W. J. Dyer, Can. J. Biochem. Physiol., 1959, 37, 911-
917.[37] S. Zerrouki, R. Rihani, F. Bentahar, K. Belkacemi, Water Sci.
Technol., 2015, 72, 123-134.[38] J.-J. Lay, Y.-Y. Li, T. Noike, Water Res., 1997, 31, 1518-1524.[39] G. K. Kafle, L. Chen, Waste Manag., 2016, 48, 492-502.[40] G. K. Kafle, S. H. Kim, K. I. Sung, Bioresour. Technol., 2013, 127,
326-336.[41] G. Esposito, L. Frunzo, A. Giordano, F. Liotta, A. Panico,
F. Pirozzi, Rev. Environ. Sci. Bio./Technol., 2012, 11, 325-341.[42] K. Bernat, A. Cydzik-Kwiatkowska, M. Zielinska,
I. Wojnowska-Baryła, J. Wersocka, Biochem. Eng. J., 2019,148, 87-96.
[43] M. Debowski, M. Kisielewska, J. Kazimierowicz, A. Rudnicka,M. Dudek, Z. Romanowska-Duda, M. Zielinski, Energies, 2020,13, 2186-2198.
[44] J. Costa, P. Gonçalves, A. Nobre, M. Alves, Bioresour. Technol.,2012, 114, 320-326.
[45] M. D. Khan, N. Khan, A.-S. Nizami, M. Rehan, S. Sabir, M. Z.Khan, Bioresour. Technol., 2017, 238, 492-501.
[46] A. Hendriks, J. Van Lier, M. De Kreuk, Biotechnol. Adv., 2018,36, 1-13.
[47] M. Romero-Güiza, J. Vila, J. Mata-Alvarez, J. Chimenos,S. Astals, Renew. Sustain. Energy Rev., 2016, 58, 1486-1499.
[48] R. Chandra, H. Takeuchi, T. Hasegawa, Renew. Sustain. EnergyRev., 2012, 16, 1462-1476.
[49] H. Escalante, L. Castro, M. Amaya, L. Jaimes, J. Jaimes-Estévez, Waste Manag., 2018, 71, 711-718.
[50] I. Angelidaki, S. Petersen, B. Ahring, Appl. Microbiol. Biotech-nol., 1990, 33, 469-472.
[51] M. Mainardis, S. Flaibani, M. Trigatti, D. Goi, J. Environ.Manag., 2019, 246, 557-563.
[52] L. Rodolfi, G. Chini Zittelli, N. Bassi, G. Padovani, N. Biondi,G. Bonini, M. R. Tredici, Biotechnol. Bioeng., 2009, 102, 100-112.
[53] S. Lhanafi, Z. Anfar, B. Chebli, M. Benafqir, R. El Haouti,Y. Azougarh, M. Abbaz, N. El Alem, Sustainable Environ. Res.,2018, 28, 389-395.
[54] Y. Yoon, S. Lee, K. Kim, T. Jeon, S. Shin, J. Mat. Cycles WasteManag., 2018, 20, 283-292.
C. R. Chimie — Online first, 6th May 2021

Selsabila Zara et al. 15
[55] M. Carlini, S. Castellucci, M. Moneti, Energy Procedia, 2015,82, 811-818.
[56] V. Akila, A. Manikandan, D. S. Sukeetha, S. Balakrishnan, P. M.Ayyasamy, S. Rajakumar, Biocatalysis Agric. Biotechnol., 2019,18, article no. 101035.
[57] C. Vanegas, J. Bartlett, Environ. Technol., 2013, 34, 2277-2283.[58] M. Tomei, C. Braguglia, G. Mininni, Bioresour. Technol., 2008,
99, 6119-6126.[59] J. Bohn, A. Yüksel-Dadak, S. Dröge, H. König, J. Biotechnol.,
2017, 244, 4-15.[60] M. Perle, S. Kimchie, G. Shelef, Water Res., 1995, 29, 1549-
1554.[61] S. Park, Y. Li, Bioresour. Technol., 2012, 111, 42-48.[62] A. Rinzema, M. Boone, K. van Knippenberg, G. Lettinga, Water
Environ. Res., 1994, 66, 40-49.
[63] M. Pereira, D. Sousa, M. Mota, M. Alves, Biotechnol. Bioeng.,2004, 88, 502-511.
[64] R. Li, S. Chen, X. Li, Appl. Biochem. Biotechnol., 2010, 160,643-654.
[65] J. D. Browne, J. D. Murphy, Renew. Energy, 2014, 71, 69-76.[66] Y. Miron, G. Zeeman, J. B. Van Lier, G. Lettinga, Water Res.,
2000, 34, 1705-1713.[67] E. Elbeshbishy, G. Nakhla, Bioresour. Technol., 2012, 116, 170-
178.[68] S. Menardo, P. Balsari, E. Tabacco, G. Borreani, Bioenergy Res.,
2015, 8, 1810-1823.[69] T. Gemechu, Afr. J. Food Sci., 2015, 9, 170-175.[70] G.-J. Shen, B. Annous, R. Lovitt, M. Jain, J. Zeikus, Appl. Micro-
biol. Biotechnol., 1996, 45, 355-362.
C. R. Chimie — Online first, 6th May 2021