Embed Size (px)
Citation preview
1
Anaerobic Co‐Digestion of Municipal Sludge and High‐Strength Waste
A Path to Net Bioenergy Production
Spyros G. Pavlostathis, PhD, BCEEM, F.IWA, F.WEFSchool of Civil & Environmental Engineering
Georgia Institute of TechnologyAtlanta, GA 30332‐0512
Georgia ASCE Environmental and Water Resources GroupAtlanta, GA
September 18, 2015
S. G. Pavlostathis/GIT 2
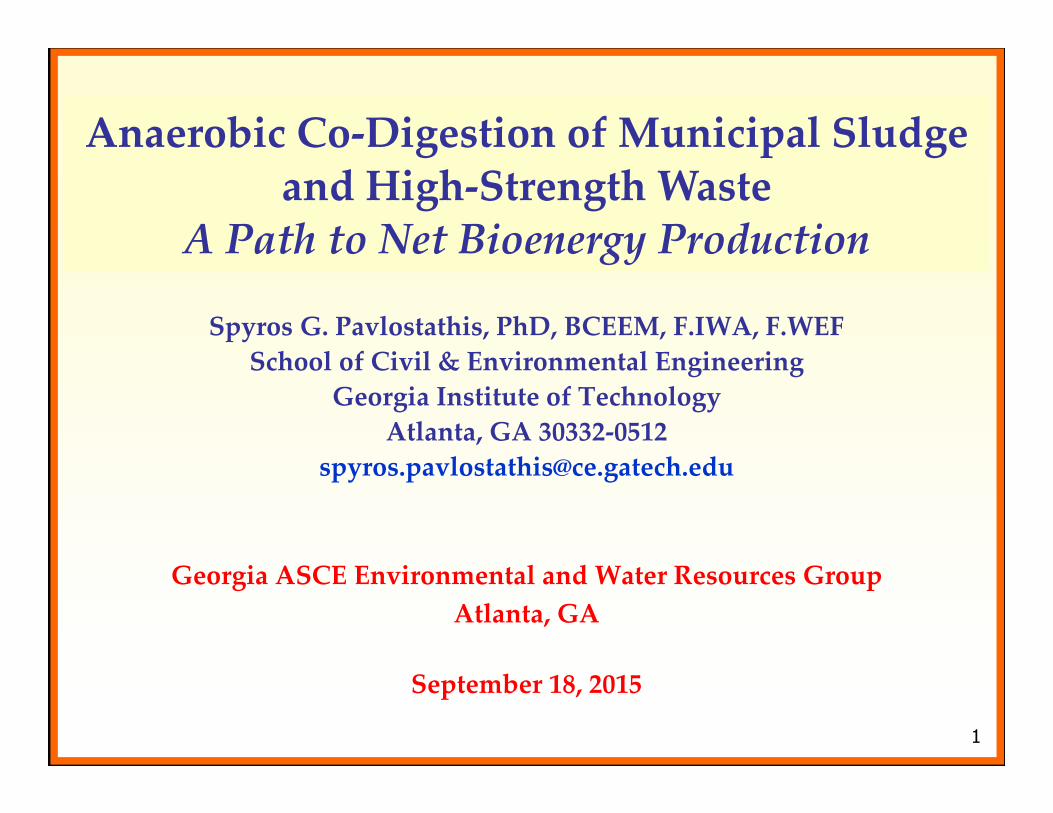
Anaerobic Digestion of Complex Organic Material
COMPLEX ORGANIC POLYMERS(Polysaccharides, Proteins, Lipids)
MONO AND OLIGOMERS(Sugars, Amino acids, Peptides, Long-chain Fatty Acids)
PROPIONATE, BUTYRATE, ETC.
1
1
CH4, CO2
H2 + CO2 ACETATE3
4 5
2
1
2
1
Physiological Groups of Microorganisms:1. Hydrolytic, fermentative, acidogenic bacteria2. Hydrogen-producing acetogenic bacteria3. Hydrogen-consuming (= hydrogenotrophic) acetogenic bacteria4. Carbon dioxide-reducing (= hydrogenotrophic) methanogens5. Acetoclastic (= acetotrophic) methanogens
S. G. Pavlostathis/GIT 3
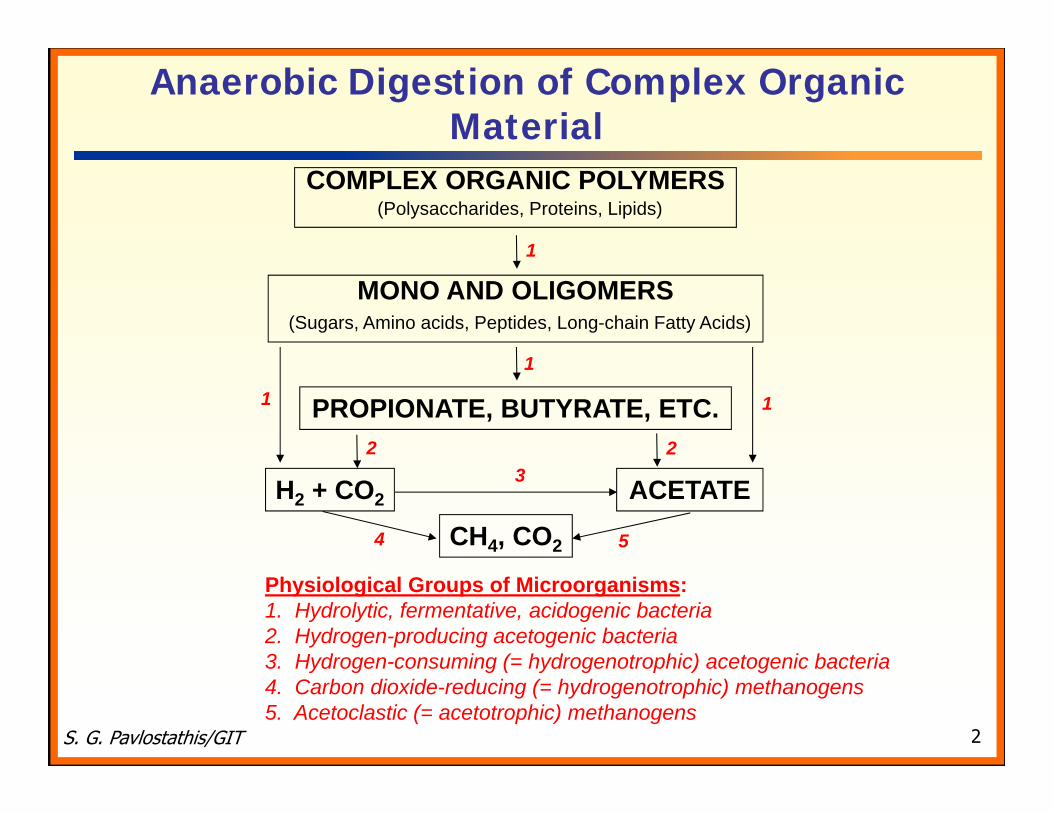
Anaerobic Digestion Model 1(ADM 1)
International Water Association -- Task Group for Mathematical Modelling of Anaerobic Digestion Processes; IWA Publishing, 2002
Death
Complex particulate waste and Inactive biomass
Inert soluble
Sugars Amino acids LCFA
Inert particulate
Carbohydr. Proteins Lipids
CH4
Propionate HVa, HBu
Acetate H2
1 3
5
6 7
4
2
Processes(1) Acidogenesis from sugars(2) Acidogenesis from amino acids(3) Acetogenesis from LCFA(4) Acetogenesis from propionate(5) Acetogenesis from butyrate and valerate(6) Acetotrophic methanogenesis(7) Hydrogenotrophic methanogenesis

S. G. Pavlostathis/GIT 4
Advantages of Anaerobic Treatment
Energy production (CH4)
Low energy consumption (O2 is not required; thus, no O2 transfer limitations; Carbon credit!)
Low biomass (i.e., sludge) production
Low nutrient requirements (e.g., N, P; important for industrial wastes)
Detoxification of xenobiotics
S. G. Pavlostathis/GIT 5
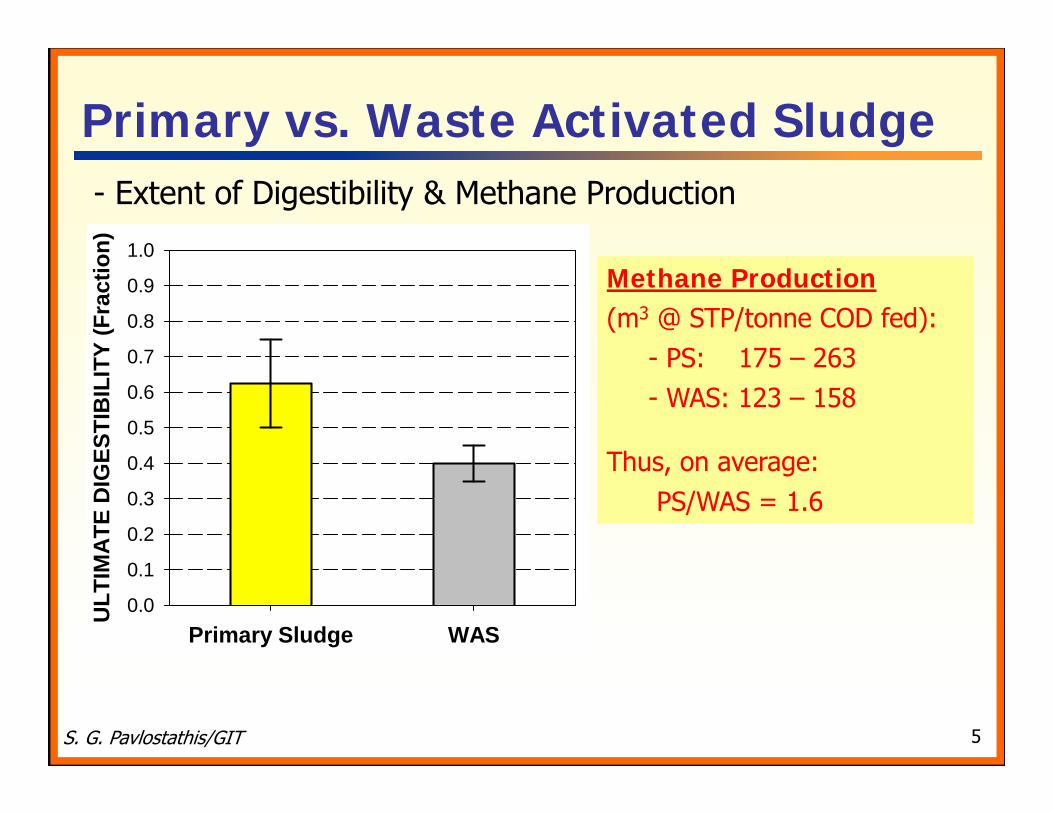
Primary vs. Waste Activated Sludge
Methane Production(m3 @ STP/tonne COD fed):
- PS: 175 – 263- WAS: 123 – 158
Thus, on average:PS/WAS = 1.6
Primary Sludge WAS
ULT
IMAT
E D
IGES
TIB
ILIT
Y (F
ract
ion)
0.0
0.1
0.2
0.3
0.4
0.5
0.6
0.7
0.8
0.9
1.0
- Extent of Digestibility & Methane Production
S. G. Pavlostathis/GIT 6
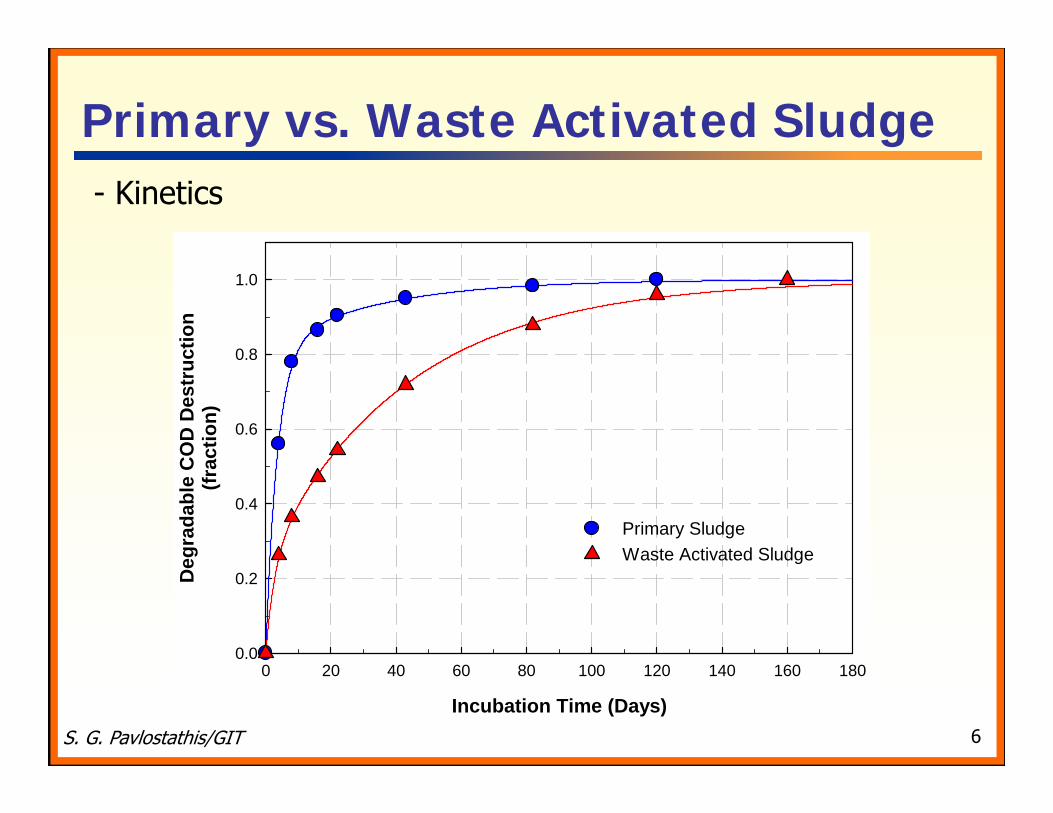
Primary vs. Waste Activated Sludge
Incubation Time (Days)
0 20 40 60 80 100 120 140 160 180
Deg
rada
ble
CO
D D
estr
uctio
n(fr
actio
n)
0.0
0.2
0.4
0.6
0.8
1.0
Primary Sludge Waste Activated Sludge
- Kinetics
S. G. Pavlostathis/GIT 7
Co-Digestion: Rationale & Motivation Domestic wastewater is increasingly viewed as a resource for water,
energy, and nutrients. To increase efficiency and improve the sustainability of municipal
wastewater treatment plants (WWTPs), efforts have focused on reducing energy consumption and/or increasing onsite renewable energy production.
Anaerobic digestion is a major source of energy production at municipal WWTPs via the conversion of sludge (and wastewater) to methane.
Use of methane as a fuel along with combined heat and power (CHP) systems are employed in several municipal WWTPs in the USA (below 10% of those with an influent flow rate large enough to justify CHP systems).
The realization that most municipal anaerobic digesters are underloadedhas led to adoption of co-digestion of municipal sludge and high-strength waste to increase both energy production and digester efficiency.
S. G. Pavlostathis/GIT 8
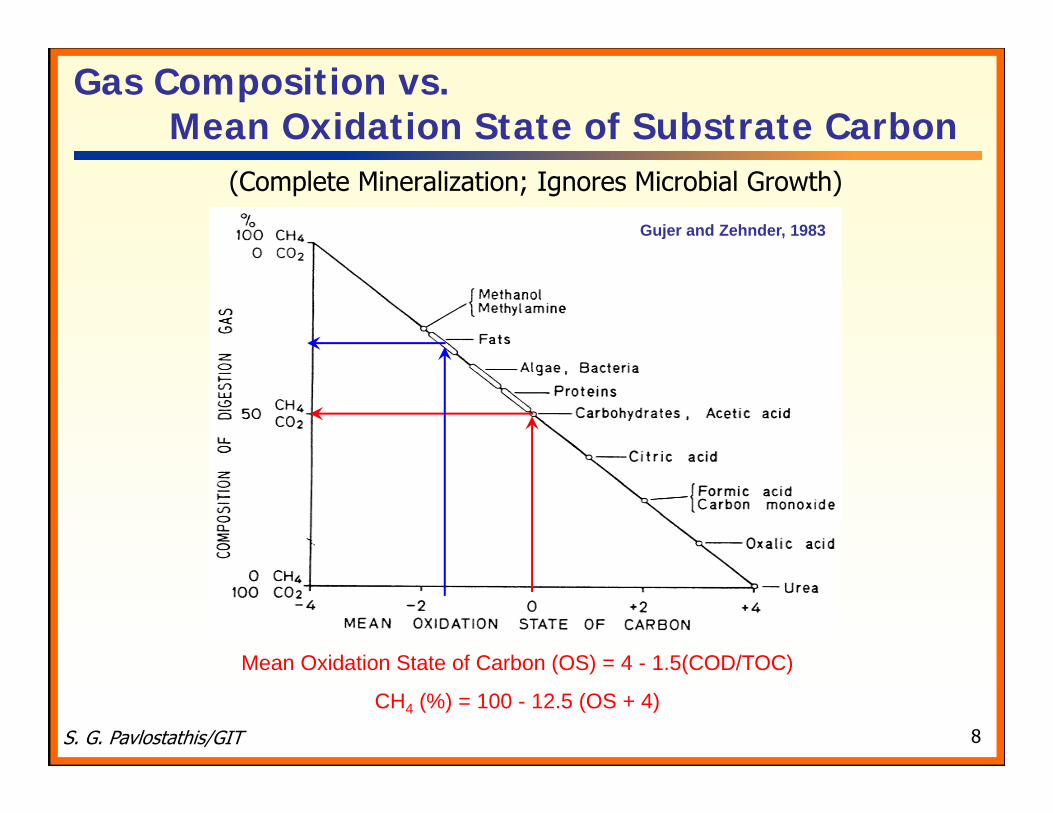
Gas Composition vs. Mean Oxidation State of Substrate Carbon
(Complete Mineralization; Ignores Microbial Growth)
Mean Oxidation State of Carbon (OS) = 4 - 1.5(COD/TOC)
CH4 (%) = 100 - 12.5 (OS + 4)
Gujer and Zehnder, 1983
S. G. Pavlostathis/GIT 9
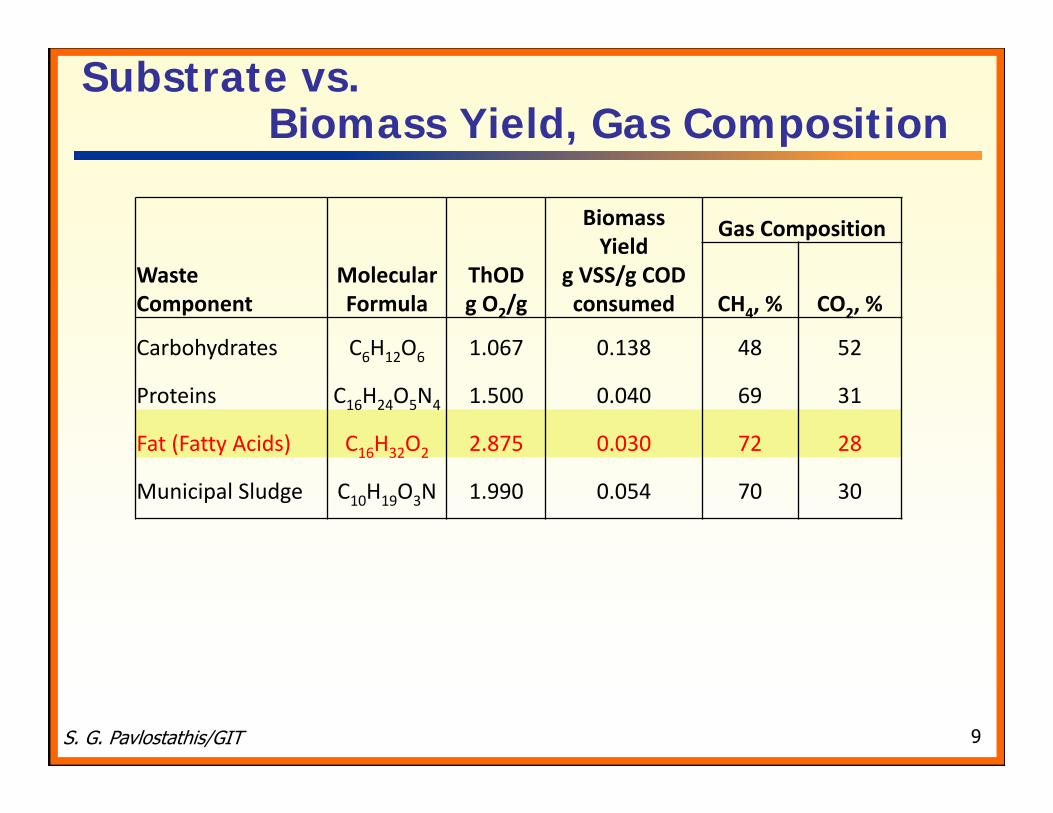
Substrate vs. Biomass Yield, Gas Composition
Waste Component
Molecular Formula
ThOD g O2/g
BiomassYield
g VSS/g COD consumed
Gas Composition
CH4, % CO2, %
Carbohydrates C6H12O6 1.067 0.138 48 52
Proteins C16H24O5N4 1.500 0.040 69 31
Fat (Fatty Acids) C16H32O2 2.875 0.030 72 28
Municipal Sludge C10H19O3N 1.990 0.054 70 30
S. G. Pavlostathis/GIT 10
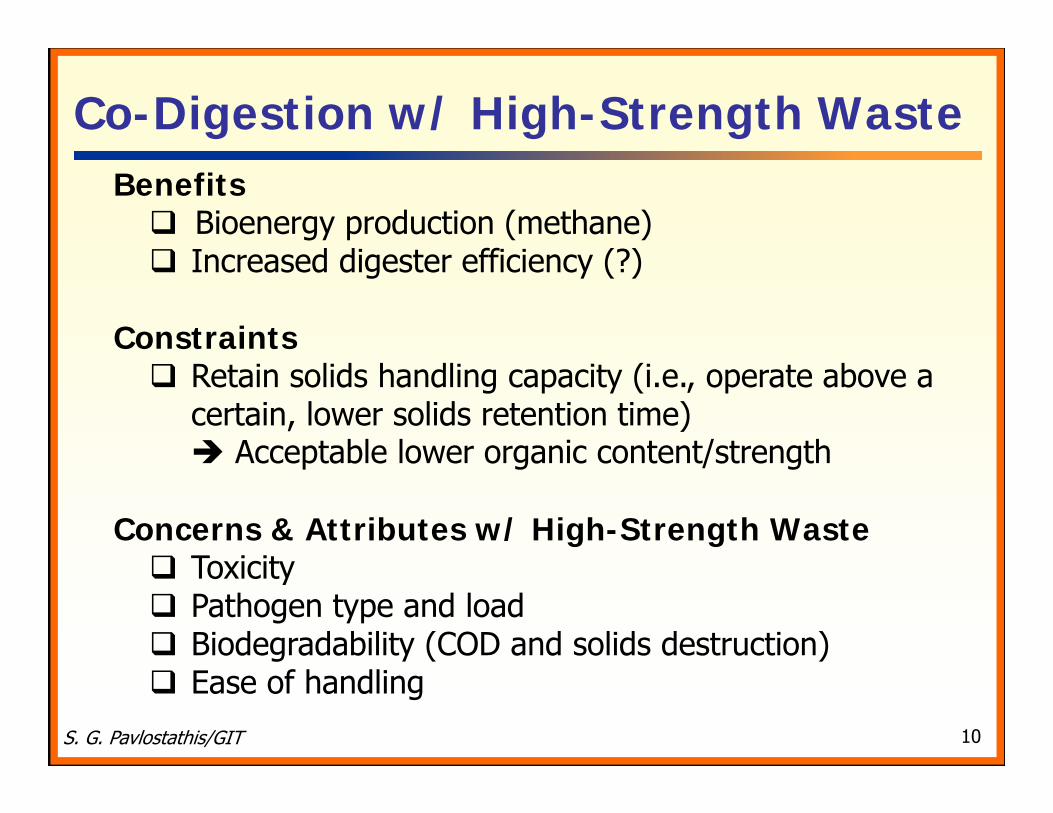
Co-Digestion w/ High-Strength WasteBenefits Bioenergy production (methane) Increased digester efficiency (?)
Constraints Retain solids handling capacity (i.e., operate above a
certain, lower solids retention time) Acceptable lower organic content/strength
Concerns & Attributes w/ High-Strength Waste Toxicity Pathogen type and load Biodegradability (COD and solids destruction) Ease of handling
S. G. Pavlostathis/GIT 11
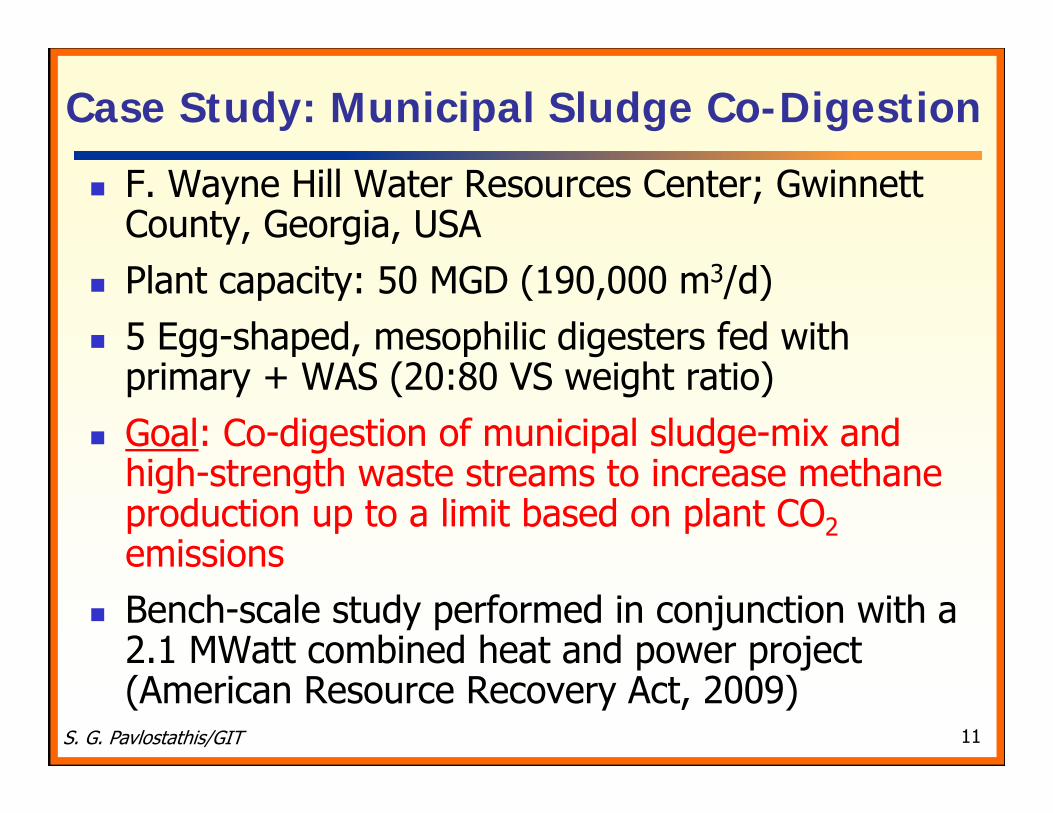
F. Wayne Hill Water Resources Center; Gwinnett County, Georgia, USA
Plant capacity: 50 MGD (190,000 m3/d) 5 Egg-shaped, mesophilic digesters fed with
primary + WAS (20:80 VS weight ratio) Goal: Co-digestion of municipal sludge-mix and
high-strength waste streams to increase methane production up to a limit based on plant CO2emissions
Bench-scale study performed in conjunction with a 2.1 MWatt combined heat and power project (American Resource Recovery Act, 2009)
Case Study: Municipal Sludge Co-Digestion
S. G. Pavlostathis/GIT 12
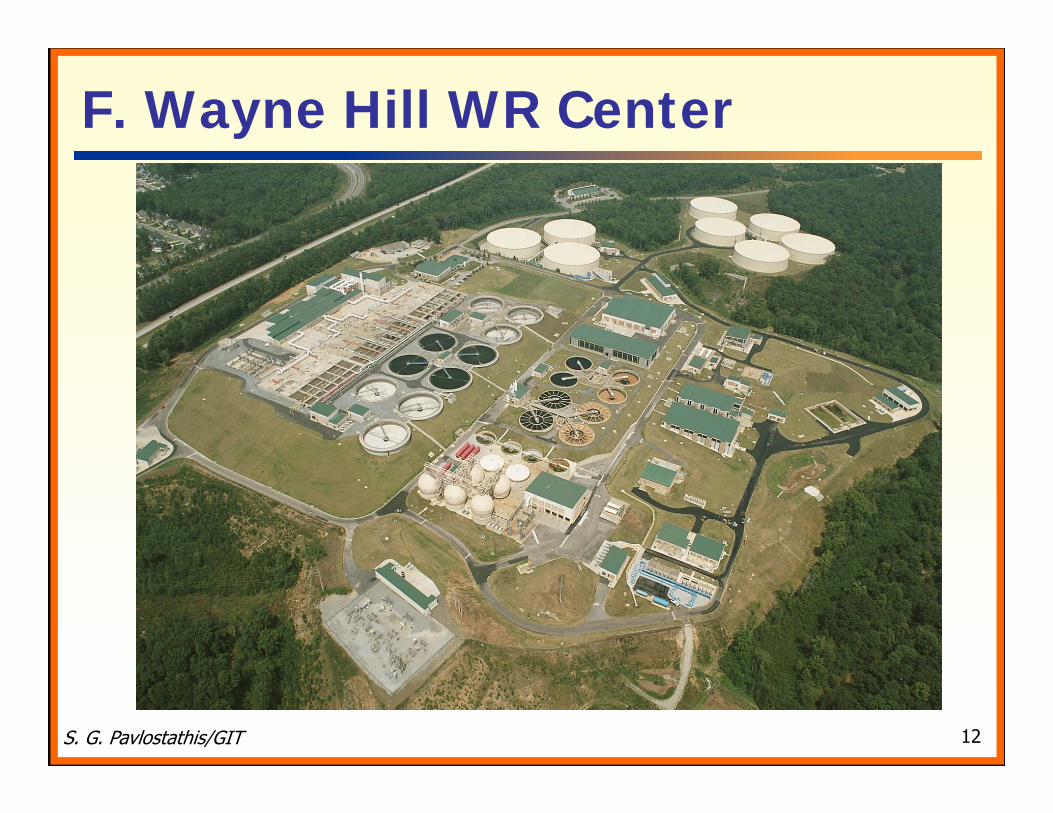
F. Wayne Hill WR Center
S. G. Pavlostathis/GIT 13
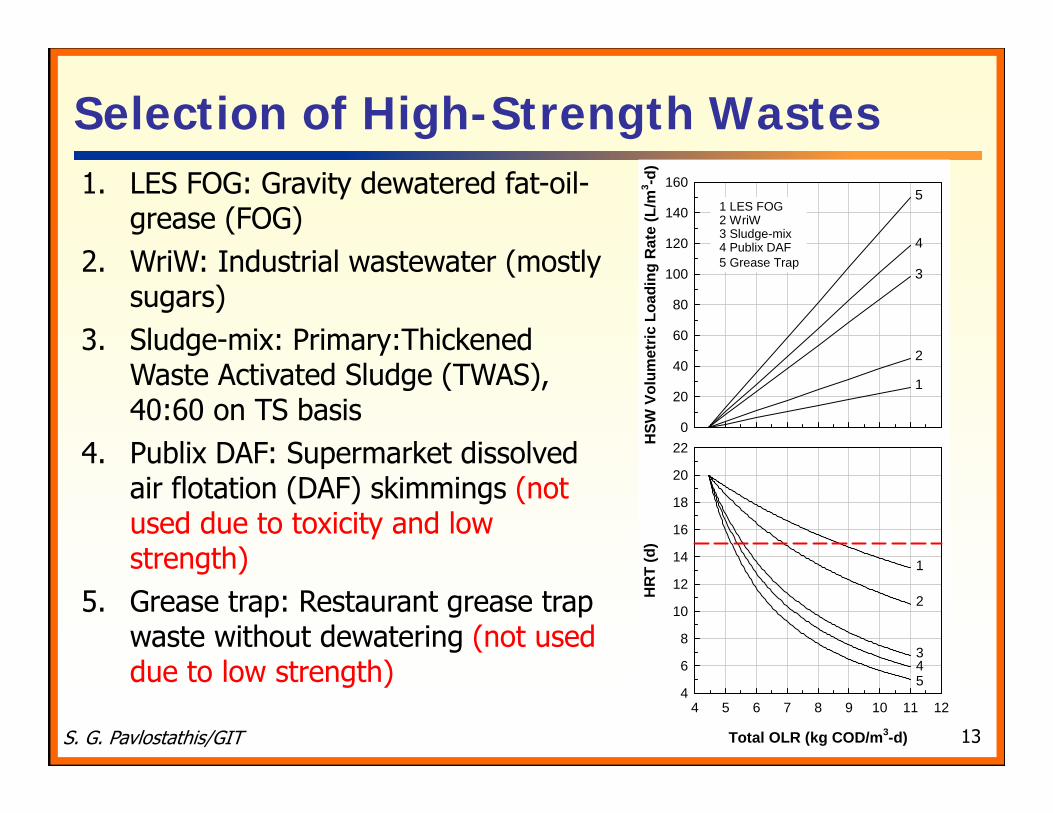
Selection of High-Strength Wastes1. LES FOG: Gravity dewatered fat-oil-
grease (FOG)2. WriW: Industrial wastewater (mostly
sugars)3. Sludge-mix: Primary:Thickened
Waste Activated Sludge (TWAS), 40:60 on TS basis
4. Publix DAF: Supermarket dissolved air flotation (DAF) skimmings (not used due to toxicity and low strength)
5. Grease trap: Restaurant grease trap waste without dewatering (not used due to low strength)
Total OLR (kg COD/m3-d)
4 5 6 7 8 9 10 11 12
HR
T (d
)
4
6
8
10
12
14
16
18
20
22HSW
Vol
umet
ric L
oadi
ng R
ate
(L/m
3 -d)
0
20
40
60
80
100
120
140
160
1 LES FOG2 WriW3 Sludge-mix4 Publix DAF5 Grease Trap
3
4
5
1
2
345
1
2
S. G. Pavlostathis/GIT 14
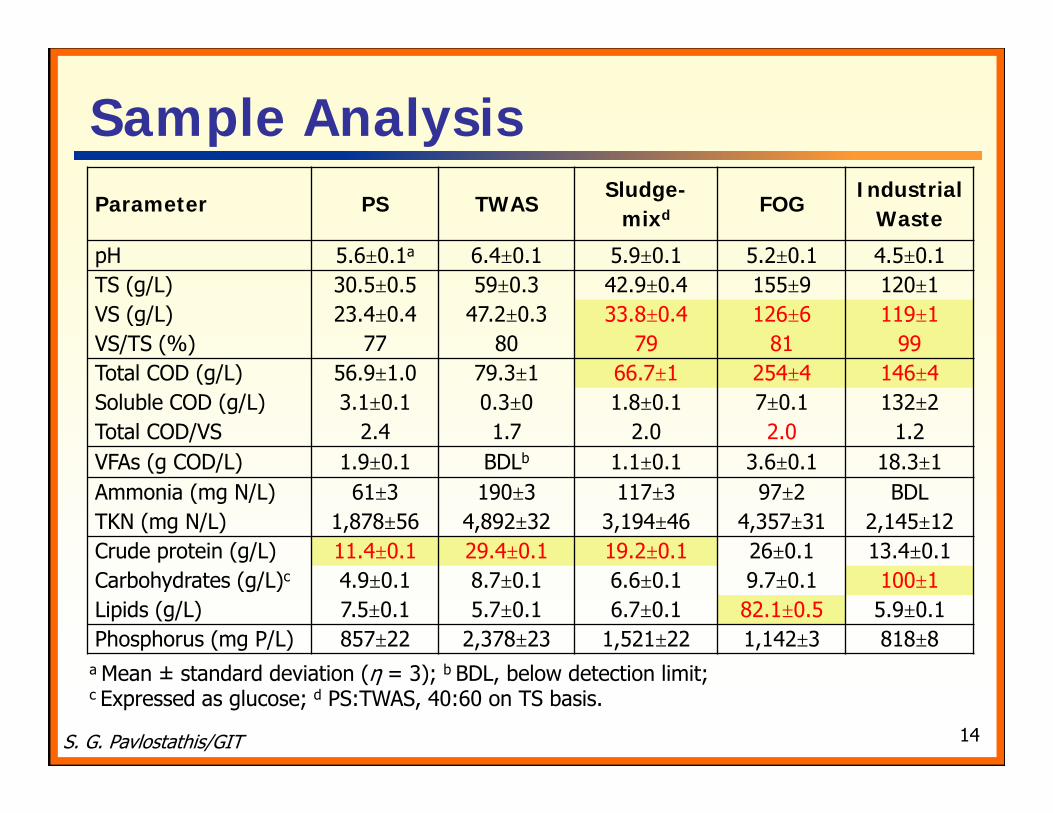
Sample Analysis
a Mean ± standard deviation (η = 3); b BDL, below detection limit;c Expressed as glucose; d PS:TWAS, 40:60 on TS basis.
Parameter PS TWASSludge-
mixd FOGIndustrial
Waste
pH 5.6±0.1a 6.4±0.1 5.9±0.1 5.2±0.1 4.5±0.1TS (g/L) 30.5±0.5 59±0.3 42.9±0.4 155±9 120±1VS (g/L) 23.4±0.4 47.2±0.3 33.8±0.4 126±6 119±1VS/TS (%) 77 80 79 81 99Total COD (g/L) 56.9±1.0 79.3±1 66.7±1 254±4 146±4Soluble COD (g/L) 3.1±0.1 0.3±0 1.8±0.1 7±0.1 132±2Total COD/VS 2.4 1.7 2.0 2.0 1.2VFAs (g COD/L) 1.9±0.1 BDLb 1.1±0.1 3.6±0.1 18.3±1Ammonia (mg N/L) 61±3 190±3 117±3 97±2 BDLTKN (mg N/L) 1,878±56 4,892±32 3,194±46 4,357±31 2,145±12Crude protein (g/L) 11.4±0.1 29.4±0.1 19.2±0.1 26±0.1 13.4±0.1Carbohydrates (g/L)c 4.9±0.1 8.7±0.1 6.6±0.1 9.7±0.1 100±1Lipids (g/L) 7.5±0.1 5.7±0.1 6.7±0.1 82.1±0.5 5.9±0.1Phosphorus (mg P/L) 857±22 2,378±23 1,521±22 1,142±3 818±8
S. G. Pavlostathis/GIT 15
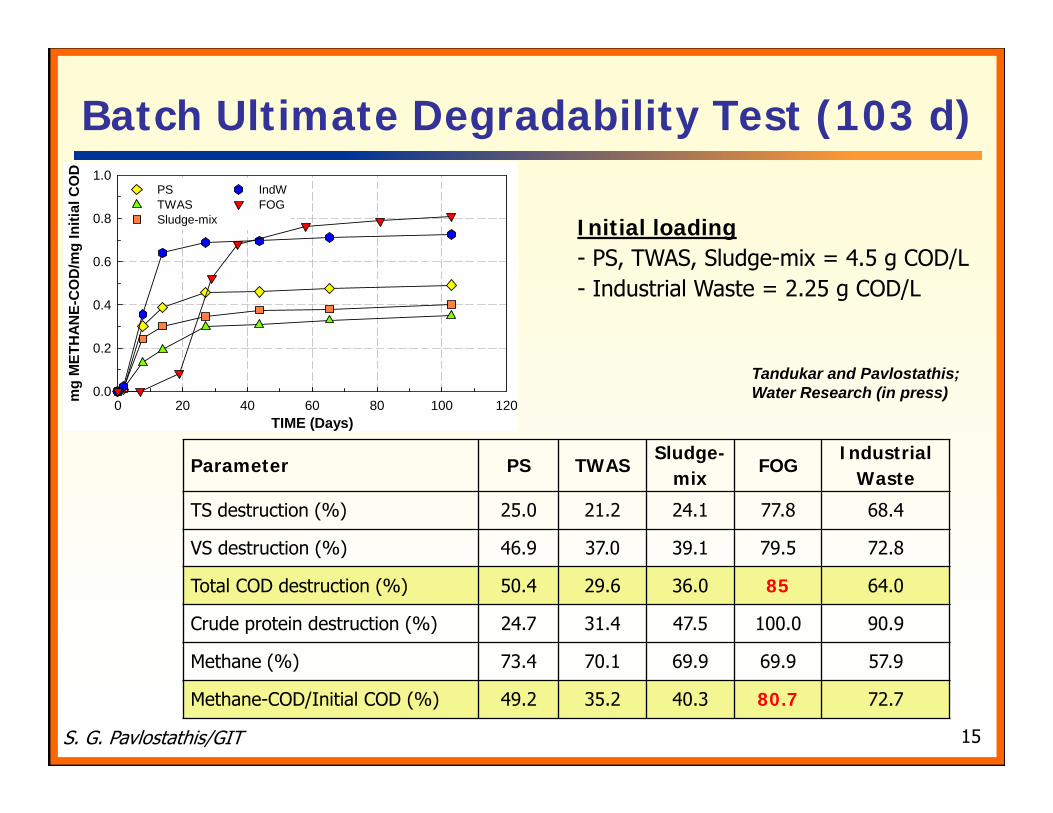
Batch Ultimate Degradability Test (103 d)
Parameter PS TWASSludge-
mixFOG
IndustrialWaste
TS destruction (%) 25.0 21.2 24.1 77.8 68.4
VS destruction (%) 46.9 37.0 39.1 79.5 72.8
Total COD destruction (%) 50.4 29.6 36.0 85 64.0
Crude protein destruction (%) 24.7 31.4 47.5 100.0 90.9
Methane (%) 73.4 70.1 69.9 69.9 57.9
Methane-COD/Initial COD (%) 49.2 35.2 40.3 80.7 72.7
TIME (Days)0 20 40 60 80 100 120m
g M
ETH
ANE-
CO
D/m
g In
itial
CO
D
0.0
0.2
0.4
0.6
0.8
1.0PS TWAS Sludge-mix
IndWFOG
Initial loading- PS, TWAS, Sludge-mix = 4.5 g COD/L- Industrial Waste = 2.25 g COD/L
Tandukar and Pavlostathis; Water Research (in press)
S. G. Pavlostathis/GIT 16
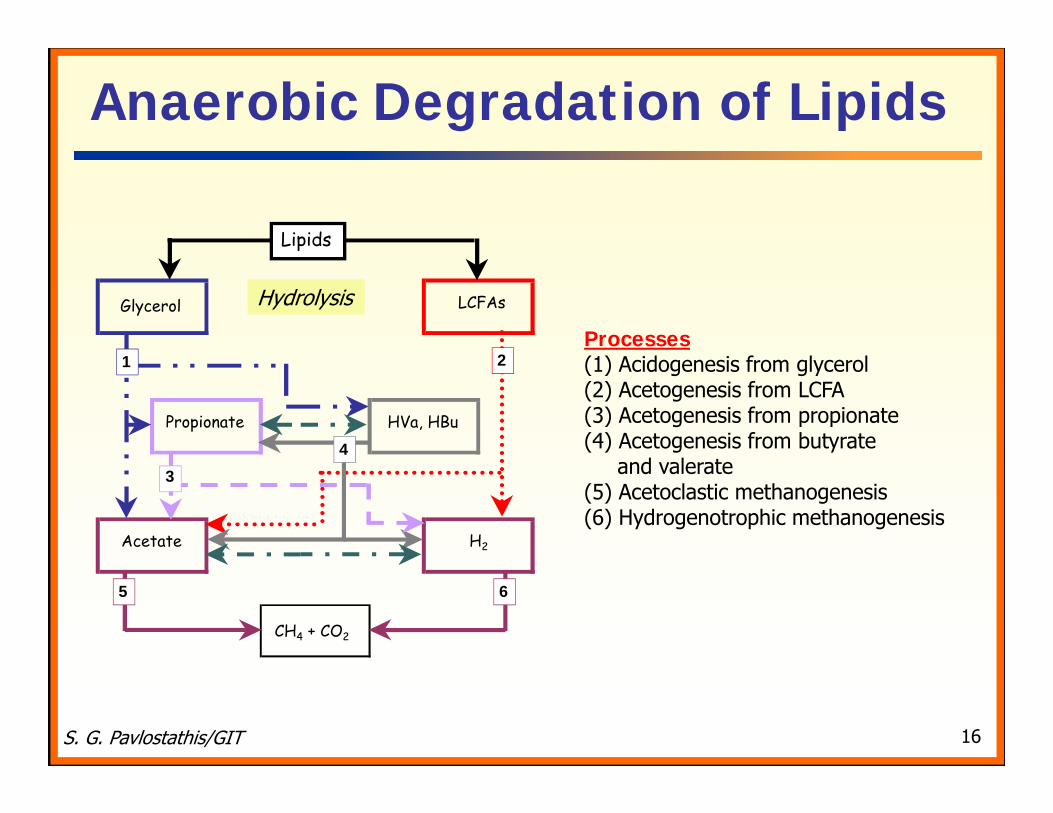
Anaerobic Degradation of Lipids
Processes(1) Acidogenesis from glycerol(2) Acetogenesis from LCFA(3) Acetogenesis from propionate(4) Acetogenesis from butyrate
and valerate(5) Acetoclastic methanogenesis(6) Hydrogenotrophic methanogenesis
Glycerol LCFAs
CH4 + CO2
Propionate HVa, HBu
Acetate H2
1 2
4
5 6
3
Lipids
Hydrolysis
S. G. Pavlostathis/GIT 17
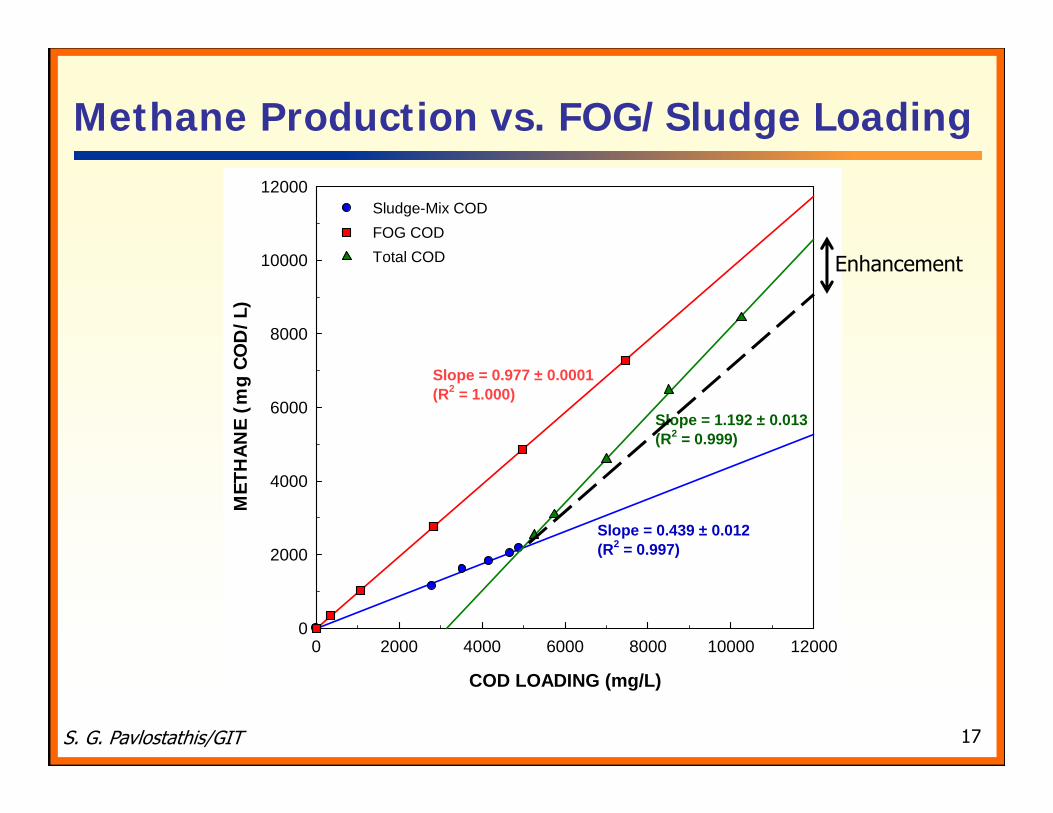
Methane Production vs. FOG/Sludge Loading
COD LOADING (mg/L)
0 2000 4000 6000 8000 10000 12000
MET
HAN
E (m
g/L)
0
2000
4000
6000
8000
10000
12000
Slope = 0.439 ± 0.012 (R2 = 0.997)
Slope = 0.977 ± 0.0001(R2 = 1.000)
Total COD
Sludge-Mix CODFOG COD
Slope = 1.192 ± 0.013(R2 = 0.999)
EnhancementM
ETH
AN
E (m
g C
OD
/L)

S. G. Pavlostathis/GIT 18
Enhanced Sludge COD & VS Destruction
FOG COD RATIO (%)
0 10 20 30 40 50 60 70 80
ENH
ANC
ED C
OD
DES
TRU
CTI
ON
(%)
0
2
4
6
8
10
12
FOG VS RATIO (%)
0 10 20 30 40 50 60 70 80
ENH
ANC
ED V
S D
ESTR
UC
TIO
N (%
)
0
2
4
6
8
10
12
SOLIDS RETENTION TIME (Days)
0 2 4 6 8 10 12 14 16 18 20 22
CO
D D
ESTR
UC
TIO
N (%
)
0
5
10
15
20
25
30
35
40
45
50
25%
56%
40%
Activated SludgeUltimate Biodegradability

S. G. Pavlostathis/GIT 19
Continuous-Flow Testing ConditionsParameter
Digester B(Control)
Digester C Digester DDigester E
Run 1 Run 2 Run 1 Run 2 Feed type SMa SM+IndW SM+IndW SM+FOG SM+FOG SM+IndW+FOG
HRT/SRT (d) 15.0 14.1 15.0 15.0 15.0 15.0OLR (g COD/L·d)b
Sludge-mixIndWFOGTotal
4.45----
4.45
4.450.58--
5.03
4.390.12--
4.51
4.12--
1.275.39
4.36--
0.364.72
4.300.120.364.78
OLR (%)Sludge-mixIndWFOG
100----
88.511.5--
97.32.7--
76.4--
23.6
92.4--7.6
90.02.57.5
a SM, sludge-mix;b OLR, organic loading rate
S. G. Pavlostathis/GIT 20
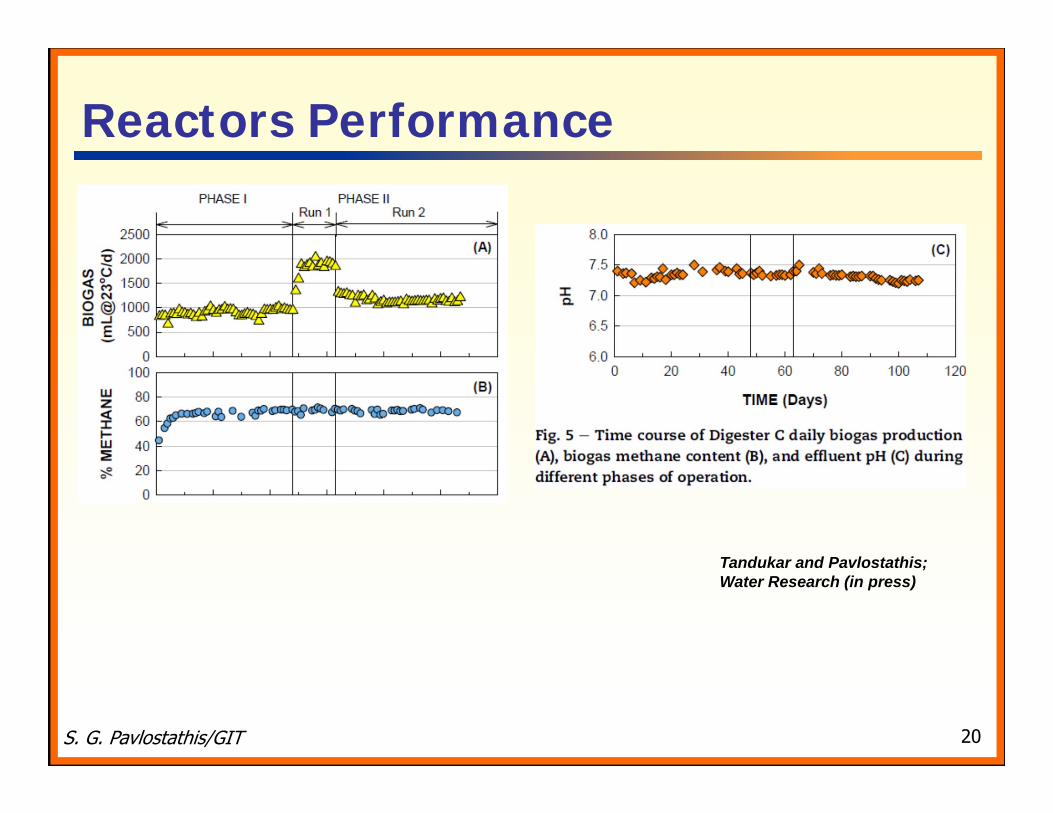
Reactors Performance
Tandukar and Pavlostathis; Water Research (in press)
S. G. Pavlostathis/GIT 21
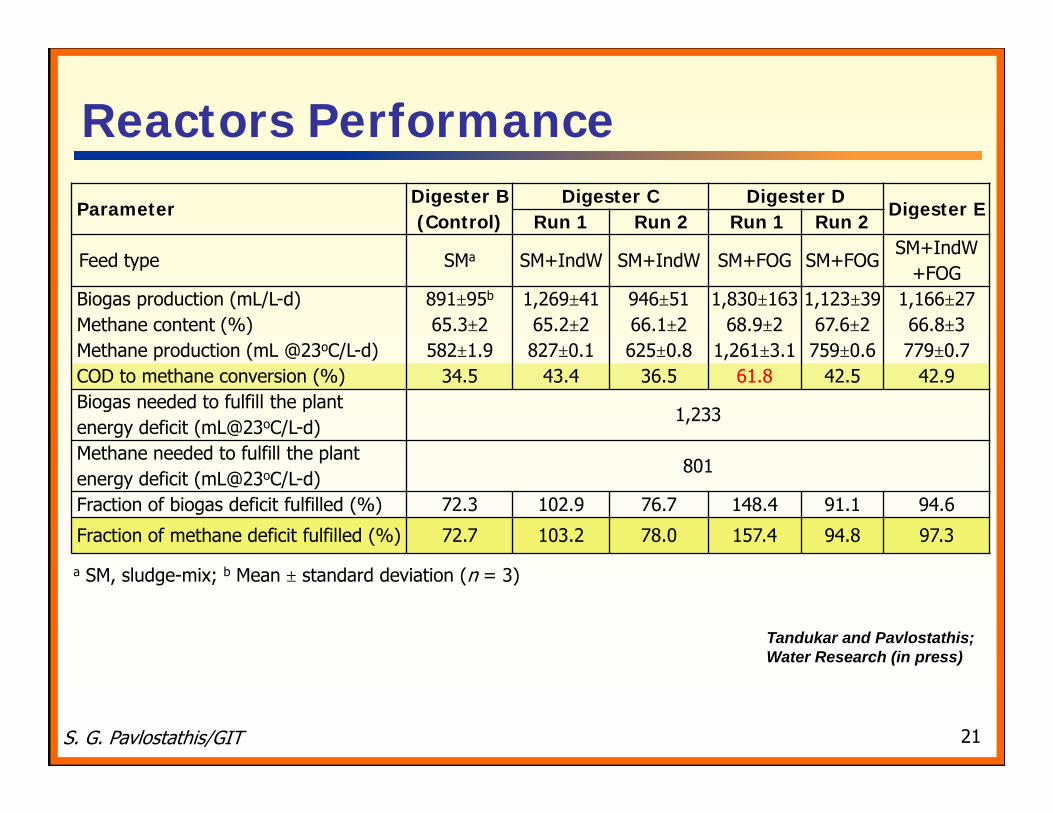
Reactors Performance
ParameterDigester B(Control)
Digester C Digester DDigester E
Run 1 Run 2 Run 1 Run 2
Feed type SMa SM+IndW SM+IndW SM+FOG SM+FOGSM+IndW
+FOGBiogas production (mL/L-d) 891±95b 1,269±41 946±51 1,830±163 1,123±39 1,166±27Methane content (%) 65.3±2 65.2±2 66.1±2 68.9±2 67.6±2 66.8±3Methane production (mL @23oC/L-d) 582±1.9 827±0.1 625±0.8 1,261±3.1 759±0.6 779±0.7COD to methane conversion (%) 34.5 43.4 36.5 61.8 42.5 42.9Biogas needed to fulfill the plant energy deficit (mL@23oC/L-d)
1,233
Methane needed to fulfill the plant energy deficit (mL@23oC/L-d)
801
Fraction of biogas deficit fulfilled (%) 72.3 102.9 76.7 148.4 91.1 94.6
Fraction of methane deficit fulfilled (%) 72.7 103.2 78.0 157.4 94.8 97.3
a SM, sludge-mix; b Mean ± standard deviation (n = 3)
Tandukar and Pavlostathis; Water Research (in press)
S. G. Pavlostathis/GIT 22
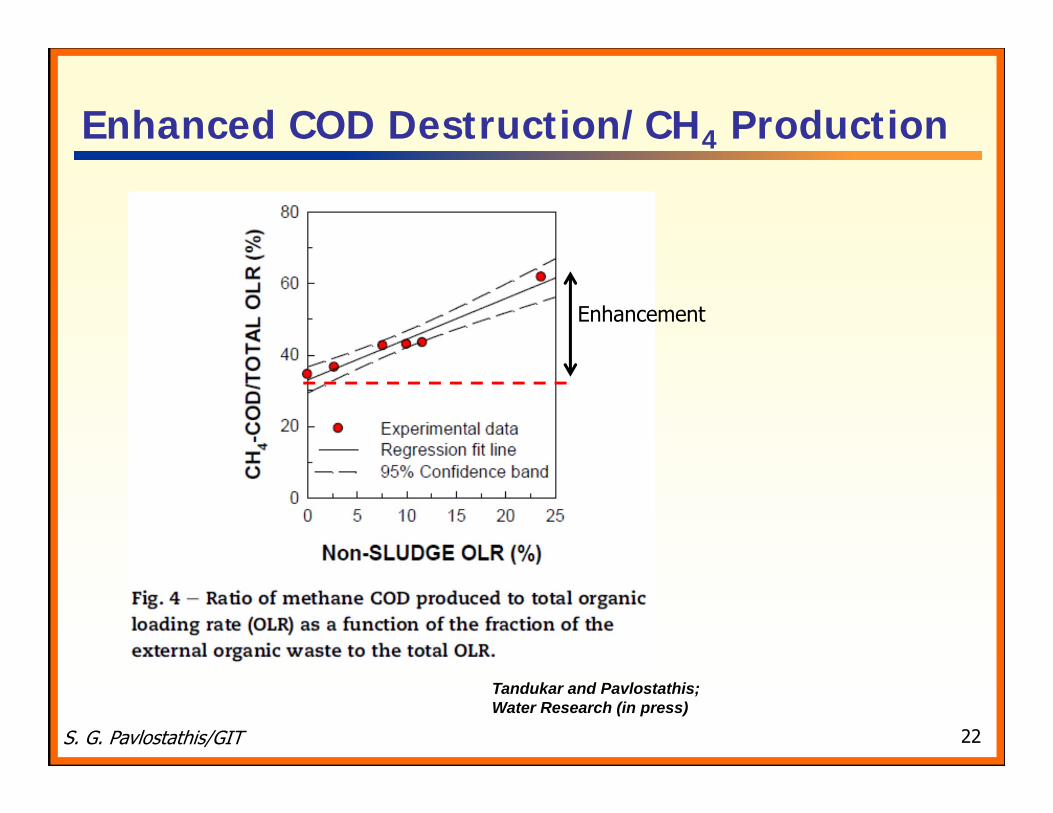
Enhanced COD Destruction/CH4 Production
Tandukar and Pavlostathis; Water Research (in press)
Enhancement

S. G. Pavlostathis/GIT 23
Filtrate Quality
SampleSoluble
COD(mg/L)
Ammonia(mg N/L)
Total P(mg/L)
Sludge-mix (feed)a 1,800±100b 131±4 53±2
Digester B effluent 447±69 1,067±23 46±4
Digester C effluent; Run 2 502±46 1,005±36 38±1
Digester D effluent; Run 2 469±11 1,112±41 41±2
Digester E effluent 437±91 1,010±21 39±1
a40:60 mixture of PS and TWAS on a TS basis;bMean ± standard deviation (n = 2) Tandukar and Pavlostathis;
Water Research (in press)
S. G. Pavlostathis/GIT 24
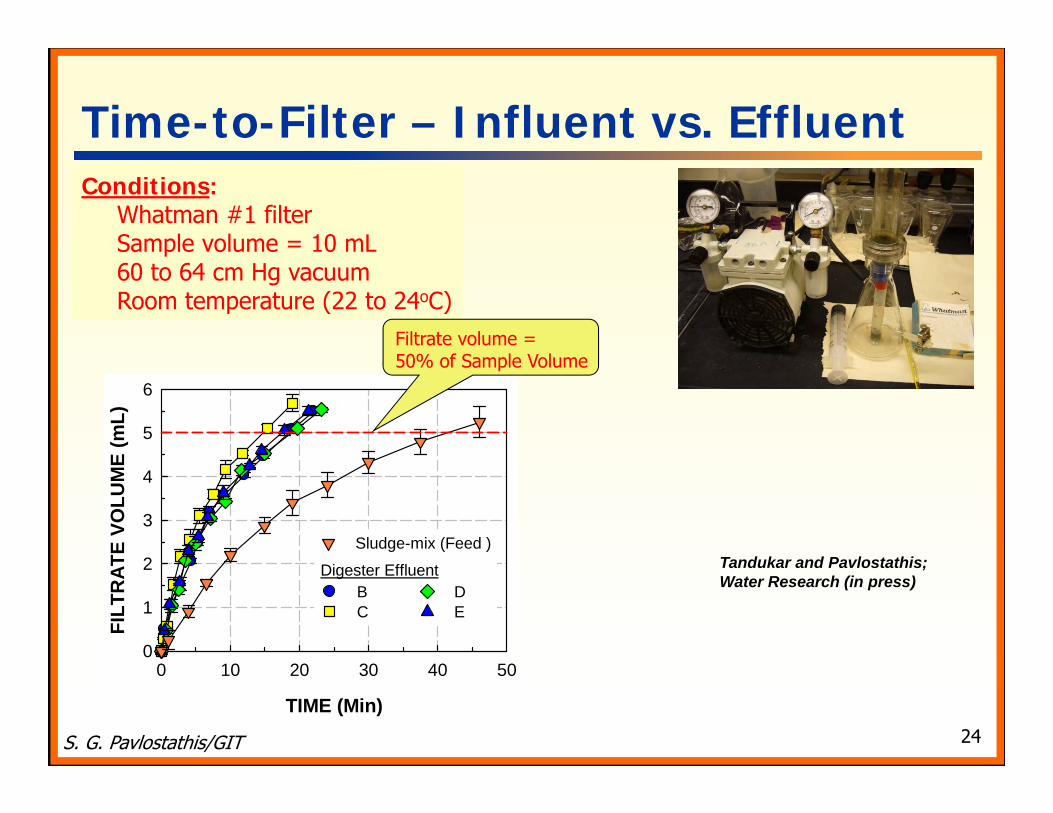
Time-to-Filter – Influent vs. EffluentConditions:
Whatman #1 filterSample volume = 10 mL60 to 64 cm Hg vacuumRoom temperature (22 to 24oC)
TIME (Min)
0 10 20 30 40 50
FILT
RAT
E VO
LUM
E (m
L)
0
1
2
3
4
5
6
BC
DE
Sludge-mix (Feed )
Digester Effluent
Filtrate volume =50% of Sample Volume
Tandukar and Pavlostathis; Water Research (in press)
S. G. Pavlostathis/GIT 25
Case Study – Conclusions Co-digestion of sludge-mix with Industrial Wastewater, FOG or
both: Increased methane production by at least 2X and was able
to generate biogas and methane very close to target values necessary to fulfill the plant energy deficit.
Enhanced the destruction of sludge COD and volatile solids (VS) by as much as 10.9%.
Resulted in an effluent quality very similar to that of the control digester fed only with the municipal sludge-mix.
Did not affect the digested sludge dewaterability (based on time-to-filter results).
Net annual cost savings estimated to be $300,000 at start-up flow (30 MGD; 114,000 m3/d) and $700,000 at full design capacity (60 MGD; 228,000 m3/d)(2012 basis).
S. G. Pavlostathis/GIT 26
Overall Conclusions High methane production can be achieved by the co-
digestion of municipal sludge with increased high-strength waste loading as long as the digester retention time, as well as the COD and VS destruction do not drop below acceptable lower values.
Overall digestion system performance, along with plant-wide materials and permit constraints, should be considered in order to benefit from the trade-off between energy production and solids destruction to meet the energy needs of a wastewater treatment facility.
Pre-screening and evaluation of potential toxicity, ultimate biodegradability, and methane production potential of high-strength wastes is necessary to avoid unnecessary complications and realize the benefits of co-digestion for net-zero energy treatment plants or even net bioenergy production.
S. G. Pavlostathis/GIT 27
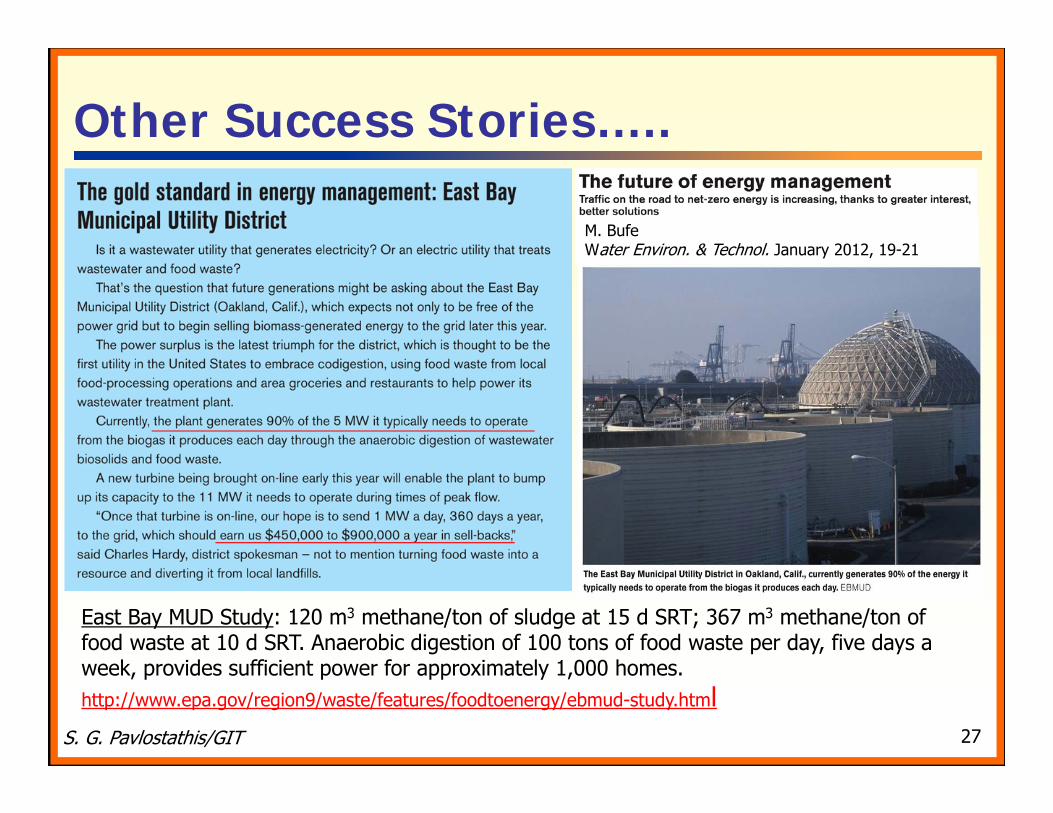
Other Success Stories…..
M. BufeWater Environ. & Technol. January 2012, 19-21
East Bay MUD Study: 120 m3 methane/ton of sludge at 15 d SRT; 367 m3 methane/ton of food waste at 10 d SRT. Anaerobic digestion of 100 tons of food waste per day, five days a week, provides sufficient power for approximately 1,000 homes.http://www.epa.gov/region9/waste/features/foodtoenergy/ebmud-study.html
S. G. Pavlostathis/GIT 28
Acknowledgements This study was financially supported by the Department of
Water Resources, Gwinnett County, GA, through a federal grant based on the American Resource Recovery Act, administered by the Georgia Environmental Facilities Authority's “Green Project Reserve” program.
Special thanks to Dr. M. Tandukar (Research Associate), R. Porter, H. Elmendorf, S. Jalla, T. Richards (Gwinnett County) and S. Hardy, R. Latimer (Hazen and Sawyer, PC; Atlanta, GA).
For further information contact: S. G. PavlostathisE-mail: [email protected] Website: http://www.ce.gatech.edu/people/faculty/961/overviewPersonal Website: http://people.ce.gatech.edu/~spavlost/