Embed Size (px)
Citation preview

169
8
Anaerobic Degradation of Organics
8.1
Catabolic Reactions – Cooperation of Different Groups of Bacteria
8.1.1
Survey
In contrast to most widely propagated aerobic degradation processes, the anaero-bic conversion of organics down to methane and carbon dioxide is limited to thework of three different groups of bacteria (see Table 8.1 and Fig. 8.1 in the sectionsbelow):
1. Acidogenic bacteria produce extracellular enzymes (exoenzymes) for the hydroly-sis of all organic solid particles and those dissolved colloids and molecules whichare too large to diffuse through cell walls and membranes. Carbonhydrates arehydrolyzed down to mono- and disaccharides, proteins into amino acids and lip-ids into fatty acids. These compounds are transformed to acetate and longerchain fatty acids as well as CO2 and H2.
2. Acetogenic bacteria transform lower fatty acids such as butyrate and propionate intoacetate, CO2 and H2. It is of great importance that H2 is oxidized by other anaero-bic bacteria. Otherwise, propionate concentrations would continually increase.
3. Therefore, hydrogen and acetate must be utilized by methanogenic bacteria. Theyexhibit two main products of catabolic metabolism. Methane is not very solublein water and carbon dioxide is in equilibrium with HCO3
– and CO32– as a func-
tion of pH (see Fig. 4.2). Most of the CO2 and nearly all the methane producedare desorbed, forming biogas bubbles which can be recovered for utilization.
8.1.2
Anaerobic Bacteria
8.1.2.1 Acidogenic BacteriaThe most important organics in wastewater are proteins, lipids and hydrocarbons.All can be utilized by acidogenic bacteria, which encompass a very large group ofdifferent, mostly facultative anaerobic bacteria.
Fundamentals of Biological Wastewater Treatment. Udo Wiesmann, In Su Choi, Eva-Maria DombrowskiCopyright © 2007 WILEY-VCH Verlag GmbH & Co. KGaA, WeinheimISBN: 978-3-527-31219-1
SOFTbank E-Book Center Tehran, Phone: 66403879,66493070 For Educational Use.

170 8 Anaerobic Degradation of Organics
Proteins are hydrolyzed into amino acids by proteases which function as exo-en-zymes. The amino acids can be taken up by diffusion through cell walls and mem-branes at a relatively high rate. This process is not rate-limiting for subsequent re-actions (Seyfried 1979). A small amount of amino acids is used directly for growth(anabolism), while a large amount is converted to lower fatty acids, CO2, H2 as wellas NH4
+ and is excreted (catabolism).Lipids are esters formed from glycerine, an alcohol with three valences, and fatty
acids. These have been hydrolyzed previously by lipase enzymes. Glycerine can bepartially used for anabolic reactions and is converted in part to lower alcohols(catabolism). The fatty acids cannot be used by acidogenic bacteria and are ex-creted.
Polymeric hydrocarbons are hydrolyzed into monomers (glucose and other sug-ars) by most facultative anaerobic bacteria via exo-enzymes (McInerney and Bryant1981). One part is totally used for protein synthesis and bacterial growth, while an-other part is converted into lower fatty acids. An example is presented by Eq. (8.1),see Fig. 8.1:
C6H12O6 → CH3CH2COOH + CH3COOH + CO2 + H2 (8.1)
This first reaction step results in a reduction of DOC (16.7%) and the formation ofCO2 as well as H2. Mosey (1983) proposed a mechanism for the formation of fattyacids from glucose (Fig. 8.2).
Fig. 8.1 Anaerobic metabolism.
SOFTbank E-Book Center Tehran, Phone: 66403879,66493070 For Educational Use.

1718.1 Catabolic Reactions – Cooperation of Different Groups of Bacteria
The conversion of chemical energy into ATP during anaerobic fermentation isvery low and only 1 mol ATP per 1 mol glucose is converted for growth.
8.1.2.2 Acetogenic BacteriaOnly a part of acetate is formed directly during fermentation. Most of it is formedby synthrophic reactions (McInerney 1999). Until now, only a few cultures havebeen isolated which are capable of this.
Synthrophobacter wolinii was described by Boone and Bryant (1980) and is able toconvert propionate to acetate.
CH3CH2COO– + 3 H2O → CH3COO– + HCO3– + H+ + 3 H2
ÄGo = 76.1 kJ mol–1 (8.2)
Synthrophomonas wolfeii was first described by McInerney et al. (1979). Butyrate istransformed to acetate:
CH3CH2CH2COO– + 2 H2O → 2 CH3COO– + H+ + 2 H2
ÄGo = 48.1 kJ mol–1 (8.3)
In both reactions hydrogen is formed. However, problems arise at higher H2 con-centrations, as discussed in Section 8.1.3.
8.1.2.3 Methanogenic BacteriaLower fatty acids such as butyrate and propionate can only be mineralized if twocatabolic products of acetogenic bacteria, i.e. hydrogen and acetate, are consumedby methanogenic bacteria.
Fig. 8.2 Fermentation of 1 molglucose to lower fatty acids and the production of 1 mol ATP (Mosey 1983).
SOFTbank E-Book Center Tehran, Phone: 66403879,66493070 For Educational Use.

172 8 Anaerobic Degradation of Organics
CH3COOH + H2O → CH4 + HCO3– + H+
ÄGo = –31 kJ mol–1 (8.4)
4 H2 + HCO3– + H+ → CH4 + 3 H2O
ÄGo = –135.6 kJ mol–1 (8.5)
The methanogens are very old microorganisms, living on earth since before theoxygen-rich atmosphere was formed. Methanosarcina and Methanothrix are able togrow using acetate for catabolism; and 70% of the methane formed in digestionprocesses and elsewhere in nature is produced via Eq. (8.4) (Jeris and McCarty1965). Methanosarcina spp are the most versatile methanogens producing ATPfrom acetate (Eq. 8.4) and hydrogen (Eq. 8.5). Methanol and methyl amine (Weimer and Zeikus 1978) are further intermediate products which can be bio-degraded down to CH4 and CO2.
Four spherical cell species of Methanosarcina barkeri often grow in a close com-munity (Fig. 8.3a). In contrast with Methanosarcina, Methanotrix does not use H2.It was first isolated by Zehnder et al. (1980) and is rod-shaped, similar to Methano-bacterium bryantii (Fig. 8.3d). M. ruminantium (Fig. 8.3b) and M. bryantii (Fig. 8.3d)
Fig. 8.3 Electron microscopic photographs of methanogenic bacteria.(a) Methanosarcina barkeri; (b) Methanobacteria ruminantium; (c) Methanospirillum hungatii; (d) Methanobacterium bryantii(Zehnder and Wuhrmann 1977).
SOFTbank E-Book Center Tehran, Phone: 66403879,66493070 For Educational Use.

1738.1 Catabolic Reactions – Cooperation of Different Groups of Bacteria
are able to produce ATP using H2/CO2 and formicate HCOOH, but both do notgrow on acetate (Balch et al. 1979). H2/CO2-using Methanobacteria produce con-siderably more ATP than bacteria using acetate. They have a correspondingly high-er maximum growth rate.
Although only about 30% of all CH4 is produced from H2/CO2, Methanobacteriaare very important for the regulation of anaerobic wastewater treatment processes.This will be explained in the next section.
Detailed information about anaerobic bacteria has been published by Zehnderand Wuhrmann (1977) and by Zehnder (1988).
8.1.3
Regulation of Acetogenics by Methanogenics
Table 8.1 presents several catabolic reactions which yield acetate and H2. First weshall have a look at Eq. (8.2), the degradation of propionate to acetate. It is interest-ing to note how far the concentration of hydrogen must be decreased to make thedegradation of propionate possible.
This makes it necessary to study the equilibrium of Eq. (8.2). First, we write forthe equilibrium constant:
Ke = (8.6)SPr – S3
H2O
SAc – SHCO3– SH+·c3
H2
Table 8.1 Arrangement of some important catabolic anaerobic reactions for oxidation (electron-donating reaction) and respiration (electron-accepting reaction). In part from Harper and Pohland (1986) and Pohland (1992).
Process Reaction ÄÄG° (kJ mol–1)
Fermentation C6H12O6 → CH3CH2COOH + CH3COOH + CO2 + H2
by acidogenic C6H12O6 → CH3CH2CH2COOH + 2 CO2 + 2 H2
bacteria
â-Oxidation by CH3CH2CH2COO– + 2 H2O → 2 CH3COO– + H+ + 2 H2 48.1acetogenic CH3CH2COO– + 3 H2O → CH3COO– + H+ + HCO3
– + 3 H2 76.1bacteria CH3CH2OH + H2O → CH3COO– + H+ + 2 H2 9.6 (synthrophic CH3CHOH COO– + 2 H2O → CH3COO– + H+ + HCO3
– + 2 H2 –4.2 reactions)
CH4 formation HCO3– + H+ + 4 H2 → CH4 + 3 H2O –135.6
by methano- CH3COO– + H2O → CH4 + HCO3– –31.0
genic bacteria
Further 2 CH3CHOH COO– + SO42– → 2 CH3COO– + 2 HCO3
– + 2 H+ + S2– –1120.5 respiration CH3COO– + SO4
2– → 2 HCO3– + H+ + S2–
reactions 4 H2 + SO42– → 2 H2O + S2–
2 NO3– + 5 H2 + 2 H+ → N2 + 6 H2O
SOFTbank E-Book Center Tehran, Phone: 66403879,66493070 For Educational Use.

174 8 Anaerobic Degradation of Organics
After introducing partial pressures for:
cH2 = (8.7)
Kc = (RT)3 (8.8)
Kc = (RT)3 k (8.9)
where R is the ideal gas constant and:
k = S3H2O (8.10)
The equilibrium constant is a function of the free enthalpies of reaction:
Kc = exp �– � (8.11)
where ÄG is the free enthalpy of reaction and ÄGo is the standard free enthalpy forT = 0 K.
From Eqs. (8.9) and (8.10), it follows that:
ÄG = ÄGo +RT(3 lnRT + lnk + lnSPr– – lnSAc– – lnSHCO3– – lnSH
+ – 3 lnpH2) (8.12)
For given values of SPr –, SAc –, S–HCO3
–, pH and T, the reaction enthalpy can be calcu-lated as a function of pH2 (McInerney and Bryant 1981; Pohland 1992; McInerney1999). Curve 1 in Fig. 8.4 presents some results.
(ÄGo –ÄG)
RT
SPr–
SAc – SHCO –3
SH+·p3H2
SPr– S3H2O
SAc– SHCO3– SH+·p3
H2
pH2
RT
Fig. 8.4 Influence of hydrogen partial pressure pH2 on free enthalpy ÄGfor anaerobic degradation of propionate (curve 1), butyrate (curve 2),ethanol (curve 3) and for CH4-formation from H2 (curve 4). Curve 1 iscalculated from Eq. (8.12) using SPr– = 1 mmol L–1, SAc– = 1 mmol L–1, SHCO
–3
= 50 mmol L–1, pH 7, T = 25 °C (McInerney and Bryant 1981).
SOFTbank E-Book Center Tehran, Phone: 66403879,66493070 For Educational Use.

1758.1 Catabolic Reactions – Cooperation of Different Groups of Bacteria
Only at partial pressures pH2 <10 Pa or pH2 <10–4 bar is ÄG negative at the givenconditions and the equilibrium constant Kc increases, resulting in a higher rate ofpropionate conversion. Compared with that, for pH2 > 10 Pa or pH2 > 10–4 bar ÄG ispositive, Kc decreases and the propionate concentration increases. But there is animportant catabolic reaction utilized by some methanogenic bacteria which pro-duces CH4 from H2 (see Eq. 8.5).
This cooperation of acetogenic bacteria which produces H2 from butyrate andpropionate (Eqs. 8.2 and 8.3), but which is not able to transfer hydrogen to other â-oxidation products and methanogenics using H2 is called â-oxidation (Stronachet al. 1986).
If the thermodynamic equilibrium is calculated using the same method as de-scribed above, a straight line with a positive slope follows, resulting from the neg-ative free enthalpy ÄGo = –135.6 kJ mol–1 (Fig. 8.4, curve 2).
For pH2 = 2·10–6 bar, the difference of reaction enthalpies is nearly zero. Meth-ane cannot be produced via the reaction in Eq. (8.5) and pH2 must increase. The re-action can only “move along the two sides of the triangle” formed by curves 1, 4and the vertical line for ÄG = 0. But for other T, pH and concentrations of propion-ate, acetate and CO2, the triangle with the two paths of reaction is moved somewhatand a somewhat higher or lower pH2 must be reached.
Following the same thermodynamic consideration, curve 2 can be obtained forbutyrate and curve 3 for ethanol. For given conditions (not shown here) ÄG is al-ready negative for pH2;10–1 bar (ethanol) and pH2;10–3 bar (butyrate). The fer-mentation of butyrate or ethanol, in each case by a pure culture, is inhibited byhigher partial pressures of H2. However, for experiments with mixed cultures thelowest value of pH2 = 10–4 bar is crucial for the whole process. In nature this prob-lem was solved billions of years ago by forming communities which included me-thanogenic bacteria able to use H2 and acetate.
8.1.4
Sulfate and Nitrate Reduction
Sulfate-reducing bacteria of the genera Desulfovibrio and Desulfotomaculum grow inanaerobically treated wastewater that contains sulfate (Zeikus 1979). Several organ-ic compounds can be mineralized or partly used with lactate, i.e. Desulfovibrio de-sulfuricans (Gottschalk 1986; Yoo 2000):
2 CH3CHOHCOO– + SO42– → 2 CH3COO– + 2 HCO3
– + 2 H+ + S2– (8.13)
and acetate by Desulfobacter postgateii (Widdel and Pfennig 1981):
CH3COO– + SO42– → 2 HCO3
– + H+ + S2– (8.14)
Beside these chemoorganoheterotrophic sulfate reducers even chemolitho-auto-trophics have been isolated (Brandis and Thauer 1981; Nethe-Jaenchen andThauer 1984):
4 H2 + SO42– → 4 H2O + S2– (8.15)
SOFTbank E-Book Center Tehran, Phone: 66403879,66493070 For Educational Use.

176 8 Anaerobic Degradation of Organics
Depending on the pH, the sulfur exists mainly in the form of S2– (high pH) or H2S(low pH):
S2– + H+ i HS– (8.16)HS– + H+ i H2S (8.17)
The formation of H2S is a serious problem because of its corrosive effects and itssmell. Therefore, it must be separated from biogas, e.g. by reaction with ironsharings. Another disadvantage of sulfate reduction is the consumption of acetate(Eq. 8.14) and hydrogen (Eq. 8.15). Via these reactions, sulfate-reducing and somedenitrifying bacteria compete with the methanogenic bacteria for hydrogen:
2 NO3– + 5 H2 → N2 + 2 OH– + 4 H2O (8.18)
and the CH4 content of the biogas is reduced.
8.2
Kinetics – Models and Coefficients
8.2.1
Preface
We must distinguish between the hydrolysis of solids and that of dissolved organ-ics. The anaerobic treatment process of solids and sludge stabilization are fre-quently used in municipal WWTPs in order to obtain residual solids which cannotbe utilized further by microorganisms as their carbon and energy source. It is to alarge extent odorless and can be dewatered easily. About 25–30% of dry mass isconverted thereby into sludge gas containing CH4. Therefore, it can be used as aform of gaseous energy. This process will not be discussed here in detail.
The hydrolysis of dissolved organics is the first step of anaerobic wastewatertreatment. Higher-loaded wastewater, such as that generated by breverage andfood industries, offers the possibility to separate, concentrate and recycle the anaer-obic bacteria from the treated wastewater or to immobilize the bacteria on solidsupport materials (Section 8.4). The efficiency of these processes can be increasedand the processes can be optimized considerably. Micro- and macrokinetics are thefoundation of process construction and control. In the next section we will discussthe present knowledge of anaerobic microkinetics.
8.2.2
Hydrolysis and Formation of Lower Fatty Acids by Acidogenic Bacteria
The formation rate of amino acids from proteins, glycerine and fatty acids fromlipids and monosaccharides from higher hydrocarbons depends on:
• the mole mass of polymers,• their stability during hydrolysis,• the portion of colloids,• the concentration of enzymes.
SOFTbank E-Book Center Tehran, Phone: 66403879,66493070 For Educational Use.
1778.2 Kinetics – Models and Coefficients
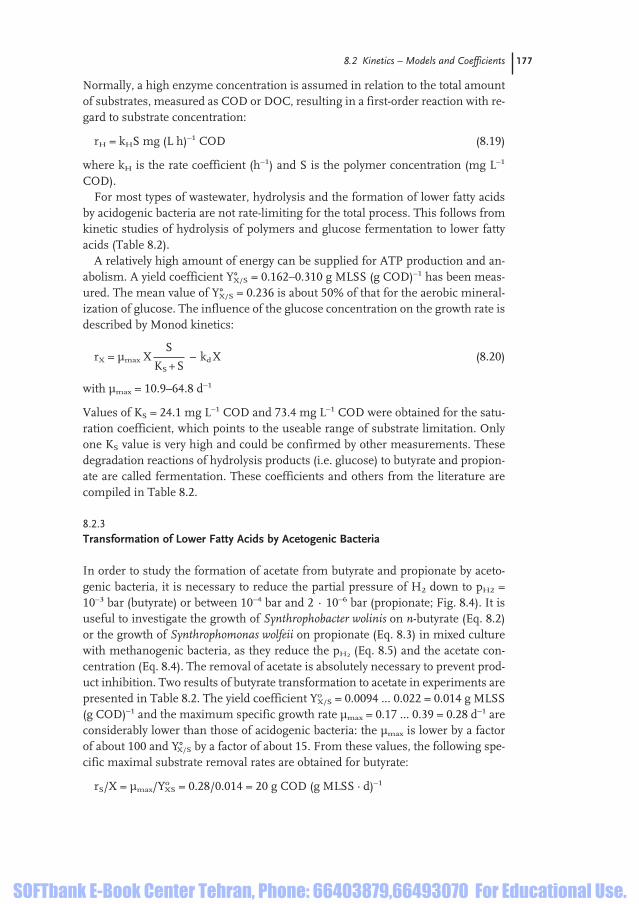
Normally, a high enzyme concentration is assumed in relation to the total amountof substrates, measured as COD or DOC, resulting in a first-order reaction with re-gard to substrate concentration:
rH = kHS mg (L h)–1 COD (8.19)
where kH is the rate coefficient (h–1) and S is the polymer concentration (mg L–1
COD).For most types of wastewater, hydrolysis and the formation of lower fatty acids
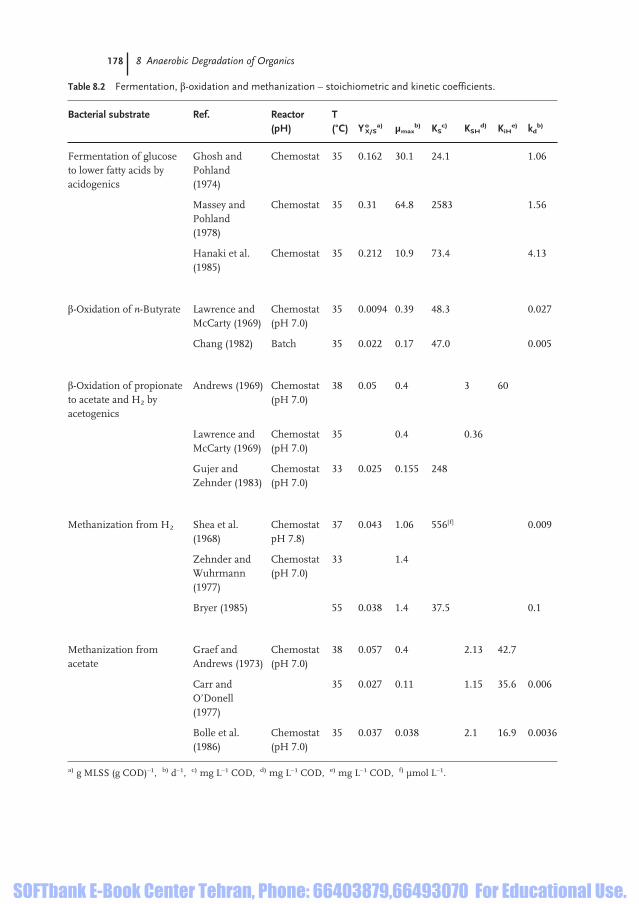
by acidogenic bacteria are not rate-limiting for the total process. This follows fromkinetic studies of hydrolysis of polymers and glucose fermentation to lower fattyacids (Table 8.2).
A relatively high amount of energy can be supplied for ATP production and an-abolism. A yield coefficient Y°X/S = 0.162–0.310 g MLSS (g COD)–1 has been meas-ured. The mean value of Y°X/S = 0.236 is about 50% of that for the aerobic mineral-ization of glucose. The influence of the glucose concentration on the growth rate isdescribed by Monod kinetics:
rX = µmax X – kd X (8.20)
with µmax = 10.9–64.8 d–1
Values of KS = 24.1 mg L–1 COD and 73.4 mg L–1 COD were obtained for the satu-ration coefficient, which points to the useable range of substrate limitation. Onlyone KS value is very high and could be confirmed by other measurements. Thesedegradation reactions of hydrolysis products (i.e. glucose) to butyrate and propion-ate are called fermentation. These coefficients and others from the literature arecompiled in Table 8.2.
8.2.3Transformation of Lower Fatty Acids by Acetogenic Bacteria
In order to study the formation of acetate from butyrate and propionate by aceto-genic bacteria, it is necessary to reduce the partial pressure of H2 down to pH2 =10–3 bar (butyrate) or between 10–4 bar and 2 · 10–6 bar (propionate; Fig. 8.4). It isuseful to investigate the growth of Synthrophobacter wolinis on n-butyrate (Eq. 8.2)or the growth of Synthrophomonas wolfeii on propionate (Eq. 8.3) in mixed culturewith methanogenic bacteria, as they reduce the pH2 (Eq. 8.5) and the acetate con-centration (Eq. 8.4). The removal of acetate is absolutely necessary to prevent prod-uct inhibition. Two results of butyrate transformation to acetate in experiments arepresented in Table 8.2. The yield coefficient Yo
X/S = 0.0094 ... 0.022 = 0.014 g MLSS(g COD)–1 and the maximum specific growth rate µmax = 0.17 ... 0.39 = 0.28 d–1 areconsiderably lower than those of acidogenic bacteria: the µmax is lower by a factorof about 100 and Y°X/S by a factor of about 15. From these values, the following spe-cific maximal substrate removal rates are obtained for butyrate:
rS/X = µmax/YoXS = 0.28/0.014 = 20 g COD (g MLSS·d)–1
S
KS +S
SOFTbank E-Book Center Tehran, Phone: 66403879,66493070 For Educational Use.
178 8 Anaerobic Degradation of Organics
Table 8.2 Fermentation, â-oxidation and methanization – stoichiometric and kinetic coefficients.
Bacterial substrate Ref. Reactor T (pH) (°C) Yo
X/Sa) µmax
b) KSc) KSH
d) KiHe) kd
b)
Fermentation of glucose Ghosh and Chemostat 35 0.162 30.1 24.1 1.06 to lower fatty acids by Pohland acidogenics (1974)
Massey and Chemostat 35 0.31 64.8 2583 1.56 Pohland (1978)
Hanaki et al. Chemostat 35 0.212 10.9 73.4 4.13 (1985)
â-Oxidation of n-Butyrate Lawrence and Chemostat 35 0.0094 0.39 48.3 0.027McCarty (1969) (pH 7.0)
Chang (1982) Batch 35 0.022 0.17 47.0 0.005
â-Oxidation of propionate Andrews (1969) Chemostat 38 0.05 0.4 3 60 to acetate and H2 by (pH 7.0)acetogenics
Lawrence and Chemostat 35 0.4 0.36McCarty (1969) (pH 7.0)
Gujer and Chemostat 33 0.025 0.155 248Zehnder (1983) (pH 7.0)
Methanization from H2 Shea et al. Chemostat 37 0.043 1.06 556[f] 0.009(1968) pH 7.8)
Zehnder and Chemostat 33 1.4Wuhrmann (pH 7.0)(1977)
Bryer (1985) 55 0.038 1.4 37.5 0.1
Methanization from Graef and Chemostat 38 0.057 0.4 2.13 42.7acetate Andrews (1973) (pH 7.0)
Carr and 35 0.027 0.11 1.15 35.6 0.006 O’Donell (1977)
Bolle et al. Chemostat 35 0.037 0.038 2.1 16.9 0.0036(1986) (pH 7.0)
a) g MLSS (g COD)–1, b) d–1, c) mg L–1 COD, d) mg L–1 COD, e) mg L–1 COD, f) µmol L–1.
SOFTbank E-Book Center Tehran, Phone: 66403879,66493070 For Educational Use.

1798.2 Kinetics – Models and Coefficients
and for propionate:
rS/X = 0.0028/0.001 = 2.8 g COD (g MLSS)–1
if the results of three studies are considered (Table 8.2). The maximum specific re-moval rate of propionate is lower than that of butyrate nearly by a factor of 7. Butin reality, the reaction in Eq. (8.2) is very sensitive to the following influences:
• As mentioned in Section 8.13, pH2 must be reduced by methanogenic bacteriadown to 10–4 bar.
• The conversion of propionate to acetate can be inhibited by higher concentra-tions of non-ionized propionate SHPr. As shown by several authors, the influenceof SHPr on the specific growth rate can be described by Haldane kinetics (An-drews 1969; Attal et al. 1988; Fukuzaki et al. 1990):
µ = µmax (8.21)
• In addition to SHPr, the concentration of non-ionized acetate SHAC influences µby non-competitive inhibition (Mosey 1983; Denac 1986; Fukuzaki et al. 1990;Kus 1993):
µ = µmax · (8.22)
Therefore, the formation of methane from H2 and acetate should not be disturbed.Otherwise, propionate and butyrate cannot be biodegraded.
8.2.4
Transformation of Acetate and Hydrogen into Methane
As described by Fig. 8.4, the hydrogen partial pressure must be reduced down topH2 < 10–4 bar by Methanosarcina and Methanobacterium to enable conversion ofpropionate to acetate (see Section 8.1.3). The specific growth rate was described us-ing Monod kinetics (Table 8.2). If the rate of H2 oxidation is measured as COD, themean specific removal rate follows as:
rS/X = µmax/Y°X/S = 32.5 g COD (g MLSS d)–1
with mean values of µmax = 1.3 d–1 and Y°X/S = 0.04 g MLSS (g COD)–1. This specif-ic rate is higher than that of propionate degradation (see Section 8.2.3). If there areno toxic effects from heavy metal ions, these bacteria grow rapidly and propionatedegradation is not inhibited by higher pH2.
Methane formation from acetate by Methanosarcina and Methanotrix (Eq. 8.4) isa much slower reaction. From three studies (Table 8.2), a mean specific removalrate can be calculated as:
rS/X = µmax/YoX/S = 4.9 g COD (g MLSS d)–1
KiH
KiH +SHAc
SHPr
KSH +SHPr + S2HPr/KiH
SHPr
KSH +SHPr +S2HPr/KiH
SOFTbank E-Book Center Tehran, Phone: 66403879,66493070 For Educational Use.

180 8 Anaerobic Degradation of Organics
with µmax = 0.18 d–1 and Y°X/S = 0.037 g MLSS (g COD)–1. This is low compared toacetate formation from propionate. Therefore, it is the most important step of an-aerobic digestion and is more frequently studied. All authors mentioned in Ta-ble 8.2 considered Haldane kinetics with non-ionized acetate as the substrate:
µ = µmax (8.23)
The frequently observed disruption of digestion processes with sinking pH and en-richment of lower fatty acids can be explained in part by substrate inhibition. Asshown in Eq. (8.22), some authors observed an inhibition of methane formation bypropionate described as a non-competitive inhibition.
Because we have to distinguish three totally different groups of anaerobic bacte-ria, we actually have to measure the concentration of these groups X. This is verydifficult and often not realized although it is a requirement for correct determina-tions of µmax values. Normally, the unit g L–1 MLSS or MLVSS (mixed liquid volu-tile suspended solids) is used (Table 2.6).
8.2.5
Conclusions
The anaerobic degradation of organics is a rather complicated process. Even if weonly wish to discuss the digestion of glucose, we must take into account three dif-ferent groups of bacteria. It is not easy to separate them and, in the case of conver-sion of propionate to acetate and hydrogen, the acetogenic and methanogenic bac-teria are dependant upon each other. Although it is important to know the value ofX, the bacterial concentration responsible for one interesting catabolic reaction,measurements are frequently impossible and X must be obtained by calculationsusing mass balances.
In many studies the concentrations:
SAc = SHAc + SAc– and SPr = SHPr + SPr–
are used in Monod or Haldane kinetics instead of cHAc and cHPr in recent publica-tions.
Let us write:
µmax = µmax (8.24)
and CH3COOH v CH3COO– + H+
Then, respectively:
K = (8.25)SAc– SH+
SHAc
SHAc
KSH +SHAc +S2HAc/KiH
SAc
KS +SAc +S2Ac/Ki
SHAc
KSH + SHAc +S2HAc/KiH
SOFTbank E-Book Center Tehran, Phone: 66403879,66493070 For Educational Use.

as well as:
SAc = SAc– + SHAc (8.26)
and:
SHAc = (8.27)
After introducing Eq. (8.27) into Eq. (8.24), we obtain:
KSH = (8.28)
and:
KiH = (8.29)
Note that, in contrast to KS and Ki, KSH and KiH are not functions of pH, because ofEq. (8.25), which yields:
K = (8.30)
The next important point is to calculate how much methane is produced if 1 molCH3COOH or 1 mol C6H12O6 is degraded anaerobically. We can compare bothsubstrates according to their COD. Let us start with CH3COOH.
For chemical oxidation of CH3COOH we write:
CH3COOH + 2 O2 → 2 CO2 + 2 H2O
and therefore 1 mol CH3COOH needs 2 mol O2; or 60 g HAc give 64 g COD.
Methane production from CH3COOH can be calculated using:
CH3COOH → CH4 + CO2
giving a yield coefficient of:
YoCH4/HAc = = = = 0.35 Nm3 (kg COD)–1 (8.31)
Now we calculate the yield of CH4 from glucose: for the chemical oxidation ofC6H12O6, it follows that:
C6H12O6 + 6 O2 → 6 CO2 + 6 H2O
Therefore, 1 mol C6H12O6 needs 6 mol O2; or 180 g C6H12O6 is equivalent to 192 gCOD.
CH4
COD
Nm3
kg
22.4
64
1 mol CH4
1 mol HAc
rCH4
rHAc
SAc–
SHAc ·10pH
Ki
1+K 10pH
KS
1+ K 10pH
SAc
1+K 10pH
1818.2 Kinetics – Models and Coefficients
SOFTbank E-Book Center Tehran, Phone: 66403879,66493070 For Educational Use.

182 8 Anaerobic Degradation of Organics
Methane production from C6H12O6 can be calculated by summarizing Eqs. (8.1),(8.2), (8.4) and (8.5)
C6H12O6 → 3 CH4 + 3 CO2
giving a yield coefficient of:
YoCH4/C6H12O6 = = = (8.32)
= 0.35 Nm3 CH4 (kg COD)–1
Conclusion: from wastewater loaded with hydrocarbons (CH2O) and a given reac-tion rate of kg COD (m3 d)–1, which can be mineralized by anaerobic processes (di-gestion), the maximum rate of methane production can be calculated usingEq. (8.31):
rCH4 = 0.35 rCOD Nm3 CH4 (kg COD)–1
regardless of whether polysaccharides, monosaccharides or acetate are present inthe wastewater.
8.3Catabolism and Anabolism
The catabolic conversion of acetate into CH4 and CO2 (Eq. 8.4) is a very simple re-action. We will use the method realized by methanogenic Methanotrix bacteria asan example for the evaluation of the stoichiometric equation describing catabolismand anabolism.
Starting from a general form considering only carbon, hydrogen and oxygen aselements of bacterial mass, we do not need to add nutrients and we can write:
CHSHOSO → YoX–C/S–CCHBHOBO + Yo
CH4–C/S–CCH4 +(8.33)
YoCO2–C/S–CCO2 + Yo
H2O–H/S–CH2O
Note that the substrate molecule and the “bacteria molecule” are each standardizedrelative to one carbon atom, resulting in the yield coefficients, three of which canbe measured:
YoXC/SC I
YoCH4–C/SC I
YoCO2–C/SC I
C for CO2 formation
C of total substrate removal
C for CH4 formation
C of total substrate removal
C for growth
C of total substrate removal
Nm3 CH4
kg · COD
22.4
64
3 mol CH4
1 mol
rCH4
rGlu
SOFTbank E-Book Center Tehran, Phone: 66403879,66493070 For Educational Use.

1838.3 Catabolism and Anabolism
According to these formulas, the content of hydrogen and oxygen in the substratemolecule and the “bacteria molecule” are given by SH and SO as well as BH andBO, respectively. Now, we already know that we will obtain three mass balances forthe three elements C, H and O. Therefore, we can calculate only three of the fouryield coefficients. In order to complete the stoichiometric equations describingcatabolism and anabolism, one of the four yield coefficients must be measured(however, see Section 4.2.1).
Let us use acetate as the substrate with CH2O (CH3COOH, written as C2H4O2
and divided by two, gives CH2O) and CH1.8O0.5 as a mean composition for the bac-terial mass. Instead of Eq. (8.33), we now write:
CH2O → YoXC/SCCH1.8O0.5 + Yo
CH4–C/SCCH4 +
YoCO2–C/SCCO2 + Yo
H2O–H/SCH2O(8.34)
The balances for each of the three elements are:
C balance: 1 = YoXC/SC + Yo
CH4–C/SC + YoCO2–C/SC (8.35)
H balance: 2 = 1.8 YoXC/SC + 4 Yo
CH4–C/SC + 2 YoH2O–H/SC (8.36)
O balance: 1 = 0.5 YoXC/SC + 2 Yo
CO2–C/SC + YoH2O–H/SC (8.37)
From these three balances, three of the four yield coefficients can be calculated. Tofind the stoichiometry of Eq. (8.34), one of these yields must be measurable. Let usassume that we measure Yo
CH4–C/S–C and we obtain:
YoCH4–C/SC = 0.48 mol CH4 (mol C)–1
Remember that, for catabolism alone, we would write YoCH4–C/SC = 0.5 and
YoCO2–C/SC = 0.5. The solution of the three balances gives:
YoXC/SC = = 0.03 mol X–C (mol S–C)–1
YoCO2–C/SC = 0.167 + 0.67 Yo
CH4–C/SC = 0.49 mol CO2 (mol S–C)–1
YoH2O–H/SC = 0.01 mol H2O–H (mol S–C)–1
The reaction describing the elements used for anabolism and catabolism is ob-tained after multiplying by a factor of two, considering the 2 C atoms in one acetatemolecule:
CH3COOH → 0.060 CH1.8O0.5 + 0.96 CH4 + 0.98 CO2 + 0.026 H2O (8.38)
Only 3% of the acetate carbon is used for growth!
1–2YoCH4–C/SC
1.2
SOFTbank E-Book Center Tehran, Phone: 66403879,66493070 For Educational Use.

184 8 Anaerobic Degradation of Organics
8.4
High-rate Processes
8.4.1
Introduction
Compared with anaerobic sludge treatment, anaerobic wastewater treatment al-lows us to increase the concentration of bacteria remarkably, resulting in an in-crease in reaction rate (high-rate processes). Three different mechanisms are effec-tive at increasing the bacterial concentration:
• Sedimentation of floc-forming bacteria and recycling of the thickened sludgeinto the bioreactor.
• Sedimentation and suspension of particles formed from bacteria and mineralsinside the bioreactor.
• Immobilizing the bacteria at the surface of either fixed or suspended solid mate-rials, as well as at rotating solid plates.
Comparing the specific maximum removal rate:
= (8.39)
for an aerobic and an anaerobic process (degradation of acetate by methanogenicbacteria) and using mean values for µmax and Yo
X/S from Table 6.2 (aerobic bacteria)and Table 8.2 (methanogenic bacteria) for unlimited substrate removal, we obtainfor aerobics:
= = = 20 g COD (g MLSS d)–1
and for anaerobics:
= = = 5 g COD (g MLSS d)–1
This real difference of only a factor of four is remarkably low because:
• The higher sludge density results in a higher bacterial concentration inside an-aerobic reactors.
• There is less influence from mass transfer and diffusion than in aerobic aeratedreactors, which can be limited by low dissolved oxygen levels.
Some effective and economical high-rate anaerobic treatment processes whichtake advantage of these benefits have gone into operation over recent decades(Dauber 1993).
In all these high-rate processes, the temperature is increased to about 35 °C. It istherefore absolutely necessary to construct the bioreactor with a thermal insulationand a preheating system for the inflowing and recycled wastewater and the settled
0.2
0.04
µmax
YoX/S
rs max
X
12
0.6
µmax
YoX/S
rs max
X
µmax
YoX/S
rs max
X
SOFTbank E-Book Center Tehran, Phone: 66403879,66493070 For Educational Use.

1858.4 High-rate Processes
sludge, especially in northern climates. The biogas produced should be used near-ly completely and only a very low amount should be burned off in a bypass flame.
The lowest substrate concentrations which can be reduced anaerobically in aneconomical way are about S0 = 2000–3000 mg L–1 COD.
About 80–90% of the BOD5 can be removed:
α = · 100 = 80 – 90%
If it is intended to discharge the treated water into surface water, it must be treat-ed aerobically in a second stage to adhere to local legislation.
8.4.2Contact Processes
In the anaerobic contact process, the higher bacterial concentration is most oftenobtained in an incompletely mixed tank reactor (suspended growth) as a result ofrecycling sludge after settling in a sedimentation tank (Fig. 8.5), similar to an acti-vated sludge reactor.
The reactor is mixed using:• stirrers,• the distribution of recycled external wastewater near the reactor bottom,• the recycling of compressed biogas (not presented in Fig. 8.5).
In some reactors, two or three of these mixing processes are applied. Nevertheless,the case of nearly ideal mixing is rarely obtainable. It is absolutely necessary to in-stall a system for degasifying the mixed liquor, i.e. the treated wastewater, sus-pended bacterial flocs and gas bubbles, before sedimentation. Several methods areavailable. In most degasifying systems, the water flows through tanks kept under apartial vacuum. In addition, the mass transfer rate and the gas/liquid interfacialsurface are increased by the use of rotating stirrers or the formation of fallingdrops or trickling films. Temperatures fall during the degasification, resulting inlower CH4 and CO2 production rates and higher saturation concentrations of bothgases. This significantly reduces the amount of gas bubbles which form duringsedimentation.
S0 –S1
S0
Fig. 8.5 Contact process.
SOFTbank E-Book Center Tehran, Phone: 66403879,66493070 For Educational Use.

186 8 Anaerobic Degradation of Organics
An anaerobic wastewater treatment process can be calculated easily if the follow-ing conditions are met:
• The process is controlled by acetate degradation.• It is a steady-state process.• The reactor is completely mixed.• The surplus bacteria are removed with the overflow.• Bacterial decay is neglected.
We want to estimate the acetate concentration Se depending on the mean hydraul-ic retention time tR. Looking at Fig. 8.5, we write the bacterial balance for the reac-tor:
0 = QM (XM – X) + µ X V (8.40)
For the bacterial concentration at mixing point M, we obtain:
XM = XR (8.41)
with:
nR = as the sludge recycle ratio (6.39)
The concentration of bacteria in the recycled sludge XR must be calculated fromthe balance of a settler:
(Q0 + QR) X = Q0 Xe + QR XR (8.42)
with Q0 Xe as the overflow mass flow rate and QR XR as the mass flow rate of recy-cled sludge.
It is useful to define â, the separation coefficient of the settler:
â = (8.43)
and considering Eq. (6.39):
â = (8.44)
then, respectively:
Xe = X (1 – â) (1 + nR) (8.45)
which is introduced into Eq. (8.43):
XR = Xâ (8.46)
Eq. (8.47) in Eq. (8.41) gives:
XM = â X (8.47)
1 + nR
nR
(1 +nR) X – Xe
(1 +nR)X
(Q0 + QR) X –Q0 Xe
(Q0 +QR) X
QR
Q0
nR
1+nR
SOFTbank E-Book Center Tehran, Phone: 66403879,66493070 For Educational Use.

1878.4 High-rate Processes
introducing this into the balance of the reactor (Eq. 8.40) and considering QM = Q0 + QR, we can write:
0 = (1 + nR) (â – 1) + µ tR (8.48)
Using Monod kinetics:
µ = µmax (6.1)
The acetate concentration in the effluent is represented by:
Se = (8.49)
and the critical mean retention time follows for Se = S0:
tRC = (8.50)
For â = 0, nR = 0, S0pKS, we obtain the simple solution valid for a chemostat:
tRC = (6.26)
In large-scale contact reactors, the mixing energy is not sufficient to realize locallyconstant conditions (concentrations, temperature, pH), which means that consid-erable discrepancies exist between theory and practice. Nevertheless, the influenceof tR, â and nR can be discussed fundamentally and can often be compared success-fully with operational data.
Two-stage anaerobic contact processes can be advantageous, with a first stagepredominately for the formation of lower fatty acids at a lower pH 5.5–6.5 and asecond stage predominately for the methanization process at a higher pH 6.5–7.5.Because of the higher yield coefficient of acidogenic bacteria (Table 8.2; Yo
X/S =0.23 g MLSS (g COD)–1) compared with that of methanization (Yo
X/S = 0.04 g MLSS(g COD)–1) and the higher reaction rate in the first stage, sludge concentrations arefrequently high enough and must not be increased by sedimentation and sludgerecycle.
In all systems described below, the bacteria are retained directly inside the reac-tor.
8.4.3Upflow Anaerobic Sludge Blanket
In the upflow anaerobic sludge blanket (UASB) type of reactor, the gas/solid/liquidseparation system is integrated into the vessel (Fig. 8.6).
This reactor can only be used if large, dense, readily settleable particles areformed – a granular sludge which allows high concentrations of suspended solidsbetween 20 g L–1 MLSS and 30 g L–1 MLSS (Lettinga and Hueshoff 1991, 1992).
1
µmax
(1 –â) (1+nR) (KS +S0)
µmax S0
KS (1–â) (1 +nR)
µmax tR – (1 –â) (1+nR)
S
KS +S
SOFTbank E-Book Center Tehran, Phone: 66403879,66493070 For Educational Use.

188 8 Anaerobic Degradation of Organics
The influent wastewater is distributed at the bottom by a system of tubes whichprovides a flow through a blanket of granular sludge. Inside these porous particles,fatty acids and biogas are formed. The reaction rate of the process is controlled bydiffusion, convection and reaction inside the pores. Ascending biogas bubbleskeep the particles partially fluidized. Depending on the kind of wastewater, thesludge tends to be more or less flocculating, which determines how well it is sus-pended in the fluidized sludge (Fig. 8.6). At the top of the UASB, the gas bubblesare separated from the water in hoods and the rising flocs which show a lower set-tling rate are carried up by the gas/liquid flow. Gas is collected in the hoods and re-moved. Liquid/solid separation takes place in the settler section. The treated waterflows over weirs while discharging into a wastewater canal system for further treat-ment either together with municipal wastewater or directly by subsequent dedicat-ed processes, such as aerobic purification. The mass of flocculent and granularsludge must be controlled by siphoning off excess sludge. Depending on thewastewater, hydraulic retention times of tR = 0.2–2.0 d are typical for a load of BV = 2–25 kg COD m–3 d–1 (Grady et al. 1999).
8.4.4
Anaerobic Fixed Bed Reactor
A fixed bed reactor is filled with solid media to facilitate the formation of biofilmswith anaerobic bacteria. Frequently, the synthetic media used are the same asthose in trickling filters (Fig. 8.7a; Young 1991) or, alternatively, they are porouspolyurethane particles with a diameter between 0.3 cm and 1.0 cm and are usedwith inner surfaces for bacteria immobilization (Fig. 8.7b; Spieß 1991; Kus 1993).
Examples of such support materials are shown in Fig. 8.7. The surface area forbacterial growth is about 100 m2 m–3 with a void volume fraction of 90–95% (Gradyet al. 1999). The formation of biofilms and the two-phase flow must facilitateliquid/gas separation and must avoid blockage by thick biofilms or large suspend-ed sludge particles. For these reasons, the wastewater is recycled to increase theflow rate and shear stress inside the fixed bed (Fig. 8.8a).
Fig. 8.6 Upflow anaerobic sludge blanket.
SOFTbank E-Book Center Tehran, Phone: 66403879,66493070 For Educational Use.

1898.4 High-rate Processes
Excess sludge is normally rinsed out with the effluent. If blockages occur, theflow rate of the recycle flow must be increased temporarily.
In some cases, the advantages of the UASB and the fixed bed reactor – the estab-lishment of high bacteria concentrations by granular particles and the formation ofbiofilms near the effluent to reduce the loss of bacteria – are combined (Fig. 8.8b).
Fig. 8.7 Media for immobilization of anaerobic bacteria. (a) Non-porous synthetic media (Young 1991). (b) Immobilized bacteria on porous polyurethane particle.
Fig. 8.8 Anaerobic fixed bed reactor (a), Hybrid USAB (b).
SOFTbank E-Book Center Tehran, Phone: 66403879,66493070 For Educational Use.

190 8 Anaerobic Degradation of Organics
On the top of an UASB, a fixed bed reactor with a relatively short bed of syntheticmedia is installed (hybrid UASB).
8.4.5
Anaerobic Rotating Disc Reactor
Anaerobic rotating disc reactors (RDR) are characterized by a horizontal wheelthat, on a technical scale, can have a diameter of up to 2 m and a length of about5 m (Fig. 8.9). With a plate spacing of 5 cm, about 100 plates can be installed, giv-ing a total surface area of about 630 m2.
An anaerobic RDR has a double wall for heating and temperature control, has aclosed top and is combined with a gas collection system. The plates are completelysubmerged in the wastewater. Surplus sludge is collected at the bottom and mustbe removed periodically. The discs rotate with a speed of 0.5–2.0 min–1.
Several authors have published results obtained by laboratory-, pilot- and large-scale studies (Tait and Friedman 1980; Laquidara et al. 1986; Ware and Pescod1989; Ware et al. 1990; Breithaupt 1997; Breithaupt and Wiesmann 1998).
Breithaupt (1997) used plates with a covering made from a synthetic structuralmaterial which made it possible to form biofilms with a higher area and thickness.In these anaerobic RDR both a high total COD removal and a high COD removalrate could be realized for wastewater with high acetate concentrations.
The reactor is not completely mixed: the concentration of immobilized bacteriaincreases in the first 25% of the total length up to 10 g L–1 MLSS and decreases inthe last 75% down to 2.5 g L–1 MLSS. The pH increases due to the methanizationof acetate. Using an acetate balance and considering axial dispersion, Haldane ki-netics and the influence of locally changing pH, mathematical models were usedto calculate the acetate concentration profile (Breithaupt 1997).
Anaerobic RDRs are particularly suitable for moderate amounts of highly loadedwastewater. Low amounts of <10 m3 d–1 wastewater are more appropriate for aero-
Fig. 8.9 Anaerobic rotating disc reactor (Breithaupt 1997).
SOFTbank E-Book Center Tehran, Phone: 66403879,66493070 For Educational Use.

1918.4 High-rate Processes
bic treatment; and high amounts of >103 m3 d–1 should be treated by using one ofthe other anaerobic processes described above.
8.4.6
Anaerobic Expanded and Fluidized Bed Reactors
In both systems, small particles are used as carriers for biofilms (bioparticles).Frequently, silica sand with a diameter of 0.2–0.5 mm and a specific density of2.65 g cm–3 or activated carbon particles with somewhat higher diameters and alower density are used. The upward flow rate must be high enough to expand thebed and the wastewater must be recycled at a much higher rate than in fixed bedreactors (Fig. 8.10).
Expanded beds are expanded by 15–30% and fluidized beds by 30–300%, relativeto the volume at rest. Because of the very high surface area of the biofilms(9000–11 000 m2 m–3), their low thickness and the high mass transfer rate in themobile bed, the biogas production rate is very high and the mean retention time ofthe wastewater is often only about 6 h and sometimes remarkably lower.
High biomass concentrations of 15–35 g L–1 MLSS are possible, similar to thoseachieved with the UASB process (Hall 1992), but the load rates achieved of morethan 20 kg COD m–3 d–1 can be significantly higher than that of the UASB process(2–25 kg COD m–3 d–1; Grady et al. 1999) because of the reduced limitation of masstransfer by diffusion and convection. The upper segment of the reactors above theexpanded and fluidized beds serves to separate the gas bubbles from the water(which is recycled to a large degree) and from the bacterial flocs which havesheared off the biofilms.
In recent times, new anaerobic systems have been investigated and proposed fortechnical use which are equipped with integrated membranes for retaining and in-creasing the amount of bacteria.
Fig. 8.10 Anaerobic expanded and fluidized bed reactors: (a) expanded bed, (b) fluidized bed
SOFTbank E-Book Center Tehran, Phone: 66403879,66493070 For Educational Use.

192 8 Anaerobic Degradation of Organics
PROBLEM
An industrial wastewater with a substrate concentration of So = 2000 mg L–1
DOC = 5000 mg L–1 COD and a flow rate of Qo = 1000 m3 d–1 is to be treatedanaerobically by a one-stage contact process at steady state for a temperatureof 35 °C, with a removal efficiency of 90% and a concentration of X = 1 g L–1
MLSS methanogenic bacteria. The wastewater is free of SO32– and NO3
–. Thereaction is neither limited nor inhibited by low or high concentrations ofacetate.
Given coefficients:
µmax = 0.18 d–1
Y°X/S = 0.037 g MLSS (g COD)–1
Calculate:1. The necessary volume of the bioreactor V.2. The volume of methane produced daily rCH4 V in Nm3 d–1.
Solution
1. First we have to balance the substrate. As demonstrated in Section 8.2.4,the organics and the CO2 formed are all converted into acetate. Althoughintermediate compounds are formed by other bacteria, they do not reducethe COD or DOC.
0 = Q0 (S0 –S) –
V = = = 925 m3
2. As demonstrated in Section 8.25, the yield is:
YoCH4/S = 0.35 Nm3 CH4 (kg COD)–1
or: rCH4 = 0.35 rS Nm3 CH4 (kg COD)–1
rS = = g (dm3)–1 = 4.86 kg COD (m3 d)–1
rCH4 = 0.35·4.86 Nm3 CH4 (m3 d)–1 = 1.70 Nm3 CH4 (m3 d)–1
rCH4 ·V = 925 · 1.70 = 1.572 Nm3 d–1
103 ·4.5·103
925
Q0 (S0 – S)
V
103 ·4.5·103 ·0.037
0.18· 1
Q0 (S0 – S) YoX/S
µmax X
µmax X·V
YoX/S
SOFTbank E-Book Center Tehran, Phone: 66403879,66493070 For Educational Use.

193References
References
Andrews, J.F. 1969, Dynamic model of theanaerobic digestion process, Am. Soc. CivilEng. 95, 95–116.
Attal, A.; Ehlinger, F.; Audic, J.M.; Faup,G.M. 1988, pH-Inhibition mechanism of acetogenic, acetoclastic and hydro-genophilic populations, Proc. Int. Symp.Anaerobic Digestion, 5, 22–26.
Balch, W.E.; Fox, F.E.; Magrum, L.J.; Woese,C.R.; Wolfe, R.S. 1979, Methanogens:reevaluation of an unique biological group,Microbiol. Rev. 43, 260–296.
Bolle, W.L.; Breugel, J.; Gils, W. 1986,Kinetics of anaerobic purification ofindustrial wastewater, Biotechnol. Bioeng.28, 542–548.
Boone, D.R.; Bryant, M. 1980, Propionatedegrading bacterium Synthrophobacterwolinii sp. nov. gen. nov. from methano-genic ecosystem, Appl. Environ. Microbiol.40, 626–632.
Brandis, A.; Thauer, R.K. 1981, Growth ofDesulfovibrio species on hydrogen andsulfate as sole energy source, J. Gen.Microbiol. 126, 249–252.
Breithaupt, T. 1997, Rotationsscheiben-reaktor für die aerobe, anoxische undanaerobe Abwasserreinigung. PraktischeEinsatzmöglichkeiten und mathematischeModellierung, VDI-Forschungsberichte,Reihe 15, 197.
Breithaupt, T.; Wiesmann, U. 1998,Konzentrationsprofile in Rotationsschei-benreaktoren und deren Modellierung am Beispiel des anaeroben Acetatabbausmit experimenteller Überprüfung, ActaHydrochem. Hydrobiol. 26, 288–295.
Bryer, J.D. 1985, Structured modelling of the anaerobic digestion of biomassparticulates, Biotechnol. Bioeng. 27,638–649.
Carr, A.D.; O’Donell, R.C. 1977, Thedynamic behavior of an anaerobic digester,Prog. Water Technol. 9, 727–738.
Chang, J. 1982, Studies On MethanogenicPhase In Anaerobic Digestion, PhD thesis,Tohoku University, Tohoku.
Dauber, S. 1993, in: Anaerobtechnik, ed. B.Böhnke, W. Bischofsberger, S.F. Seyfried,Springer-Verlag, Berlin.
Denac, M. 1986, Anaerober Abbau gelösterorganischer Stoffe in Festbett- und Wirbel-schichtreaktoren, PhD thesis, ETH Zurich.
Fukuzaki, S.; Nishio, N.; Nagai, S. 1990,Kinetics of the methanogenic fermenta-tion of acetate, Appl. Environ. Microbiol. 56,3158–3163.
Ghosh, S.; Pohland, F.G. 1974, Kinetics ofsubstrate assimilation and product forma-tion in anaerobic digestion, J. W.P.C.F. 46,748–759.
Gottschalk, G. 1986, Bacterial Metabolism,2nd edn, Springer-Verlag, Berlin.
Grady, C.P.L. Jr.; Daisser, G.T.; Lin, H.C.1999, Biological Wastewater Treatment, 2ndedn, Marcel Dekker, New York, p. 611.
Graef, S.P.; Andrews, J.F. 1973, Mathema-tical modelling and control of anaerobicdigestion, AIChE Symp. Ser. 70, 101–131.
Gujer, W.; Zehnder, A.J.B. 1983, Conversionprocesses in anaerobic digestion, WaterSci. Technol. 15, 127–167.
Hall, E.R. 1992, Anaerobic treatment ofwastewaters in suspended growth andfixed film processes, in: Design of Anaerobic Processes for the Treatment of Industrial and Municipal Wastes, ed. Malina, J.F. Jr.; Pohland, F.G.,Technomics Publishing, Lancaster, Penn.,p. 41–118.
Hanaki, K.; Noike, T.; Matsumoto, J. 1985,Mathematical modelling of the anaerobicdigestion process, in: Mathematical Modelsin Biological Waste Water Treatment, ed.Jörgensen, S.E.; Gromiec, M.J., Elsevier-Verlag, Berlin, p. 41–118.
Harper, S.R.; Pohland, F.G. 1986, Recentdevelopments in hydrogen managementduring anaerobic biological wastewatertreatment, Biotechnol. Bioeng. 27, 585–602.
Jeris, J.S.; McCarty, P.C. 1965, Biochemistryof methane fermentation using 14Ctracers, J. W.P.C.F. 37, 178.
Kus, F. 1993, Kinetik des anaeroben Abbausvon Essig- und Propionsäure in Bioreak-toren mit immobilisierten Bakterien, VDI-Forschungsberichte, Reihe 15, 115.
Laquidara, M.J.; Blanc, F.C.; O’Shaughnessy,J.C. 1986, Developtment of biofilm,operating characteristics and operationalcontrol in the anaerobic rotating biologicalcontactor process, Water Pollut. ControlFed. 58, 107–114.
Lawrence, A.W.; McCarty, P.L. 1969, Kineticsof methane fermentation in anaerobictreatment, J. W.P.C.F. 41, 2.
SOFTbank E-Book Center Tehran, Phone: 66403879,66493070 For Educational Use.

194 8 Anaerobic Degradation of Organics
Lettinga, G.; Hulshoff, L.W. 1991, UASBprocess design for various types of waste-waters, Water Sci. Technol. 24, 87–108.
Lettinga, G.; Hulshoff, L.W. 1992, UASBprocess design for various types of waste-waters, in: Design of Anaerobic Processes forthe Treatment of Industrial and MunicipalWastes, ed. Malina, J.F. Jr.; Pohland, F.G.,Technomics Publishing, Lancaster, Penn.,p. 119–145.
Massey, M.L.; Pohland, F.G. 1978, Phaseseparation of anaerobic stabilization bykinetic controls, J. W.P.C.F. 50,2204–2222.
McInerney, M.J. 1999, Anaerobic metabolismand its regulation, Biotechnology 11a,455–478
McInerney, M.J.; Bryant, M.P. 1981, Reviewof methane fermentation fundamentals,in: Fuel Gas Production from Biomass, ed.Wise, D.L., CRC Press, Boca Raton,p. 19–46.
McInerney, M.J.; Bryant, M.P.; Pfennig, N.1979, Anaerobic bacterium that degradesfatty-acids in syntrophic association withmethanogenes, Arch. Microbiol. 122,129–135.
Mosey, F.E. 1983, Mathematical modelling ofthe anaerobic digestion process: regulatorymechanisms for the formation of shortchain volatile acids from glucose, WaterSci. Technol. 15, 209–232.
Nethe-Jaenchen, R.; Thauer, R.K. 1984,Growth yields and saturation constant ofDesulfovibrio vulgaris in chemostat culture,Arch. Microbiol. 137, 236–240.
Pohland, F.G. 1992, Anaerobic treatment:fundamental concepts, applications, andnew horizons, in: Design of AnaerobicProcesses for the Treatment of Industrial and Municipal Wastes, ed. Malina, J.F.;Pohland, F.G., CRC Press, London, p. 1–33.
Seyfried, C.F. 1979, Reinigung organischhochverschmutzter Abwässer mit demanaeroben Belebungsverfahren am Bei-spiel von Abwässern aus der Nahrungs-mittelherstellung, Veröffentlichung desInstituts für Siedlungswasserwirtschaft,Universität Hannover.
Shea, T.G.; Pretorius, W.A.; Cole, R.D.;Pearson, E.A. 1968, Kinetics of hydrogenassimilation in the methane fermentation,Water Res. 2, 833–848.
Spieß, A. 1991, Anaerobe Abwasserreinigungin neuen Bioreaktoren mit Polyurethan-partikeln zur Immobilisierung der Bakte-rien, VDI-Forschungsberichte, Reihe 15, 85.
Stronach, S.M.; Rudd, T.; Lester, J.N. 1986,Anaerobic Digestion Processes in IndustrialWastewater Treatment, Springer-Verlag,Berlin, p. 32–33.
Tait, S.J.; Friedman, A.A. 1980, Anaerobicrotating biological contactor for carbenouswastewater, J. W.P.C.F. 52, 2256–2269.
Ware, A.J.; Pescod, M.B. 1989, Full-scalestudies with an anaerobic/aerobic RBCunit treating brewery wastewater, WaterSci. Technol. 21, 197–208.
Ware, A.J.; Pescod, M.B.; Storch, B. 1990,Evaluation of alternatives to conventionaldisc support media for rotating biologicalcontactors, Water Sci. Technol. 22,113–117.
Weimer, P.J.; Zeikus, J.G. 1978, Acetatemetabolism in Methanosarcina barceri,Archiv. Microbiol. 119, 175–182.
Widdel, F.; Pfennig, N. 1981, Studies ondissimilatory sulfate reducing bacteria thatdecompose fatty acids I. Isolation of newsulfate reducing bacteria enriched withacetate from saline environments. Descrip-tion of Desulfobacter postgatei gen. nov., sp.nov., Arch. Microbiol. 129, 395–400.
Yoo, E.S. 2000, Biological and ChemicalMechanisms of Reductive Decolorization ofAzo Dyes, PhD thesis, TU Berlin.
Young, J.C. 1991, Factors effecting thedesign and performance of up flowanaerobic filters, Water Sci. Technol. 24,133–156.
Zehnder, A.J. 1988, Biology of AnaerobicMicroorganisms, John Wiley & Sons, New York.
Zehnder, A.J.; Wuhrmann, K. 1977, Physiol-ogy of a Methanobacterium Strain AZ,Arch. Microbiol. 111, 119.
Zehnder, A.J.; Huser, B.A.; Brock, T.D.;Wuhrmann, K. 1980, Characterisation ofan acetic-decaroxylation, non-hydrogen-oxidizing methane bacteria, Arch. Micro-biol. 124, 1–11.
Zeikus, J.G. 1979, Microbial populations indigesters, in: Proc. 1st Int. Symp. AnaerobicDigestion, Applied Science Publications,London.
SOFTbank E-Book Center Tehran, Phone: 66403879,66493070 For Educational Use.