Embed Size (px)
Citation preview
1
Anaerobic Digestion of Palm Oil Mill Effluent (POME) and Empty Fruit
Bunches (EFB):
Maximized biogas production through full utilization of palm oil
processing wastes and by-products
Anders Ek, Chief Scientist
Asia Biogas Singapore PTE Limited 03 June 2014
ASIA BIOGAS INTRODUCTION
2
Company Introduction
• Offices in Singapore, Bangkok and Jakarta
• Design/Engineering, Turn-key supply , O&M Services and Project Development
o Industrial heat
o Power generation
o Compressed Biogas/Biomethane (CBG/bioCNG)
• Over 80 projects in Thailand, Philippines and Vietnam
• 6 operating projects in Thailand (BOOT)
• Under construction:
o Krabi 2.2 MW POME, Thailand
o Greenfields Dairy Farm Biogas, Indonesia
3
LARGE PLANTS?
4
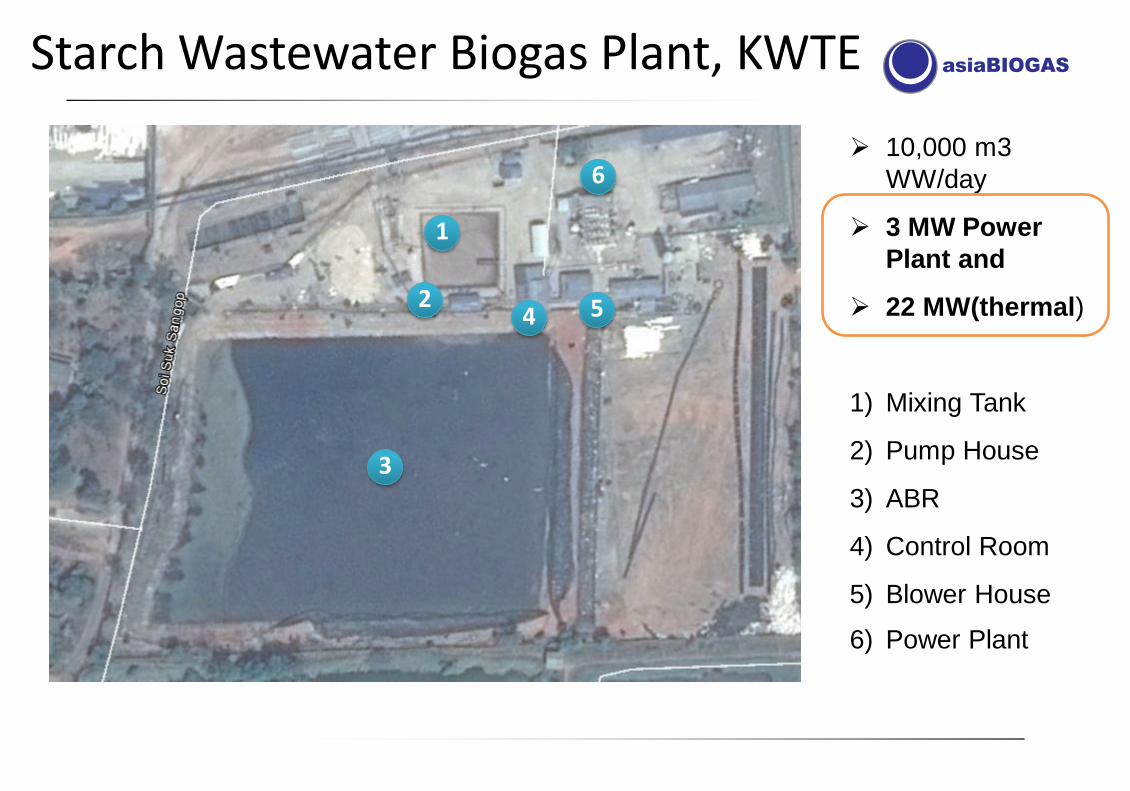
Starch Wastewater Biogas Plant, KWTE
10,000 m3
WW/day
3 MW Power
Plant and
22 MW(thermal)
1) Mixing Tank
2) Pump House
3) ABR
4) Control Room
5) Blower House
6) Power Plant
1
2
3
4 5
6
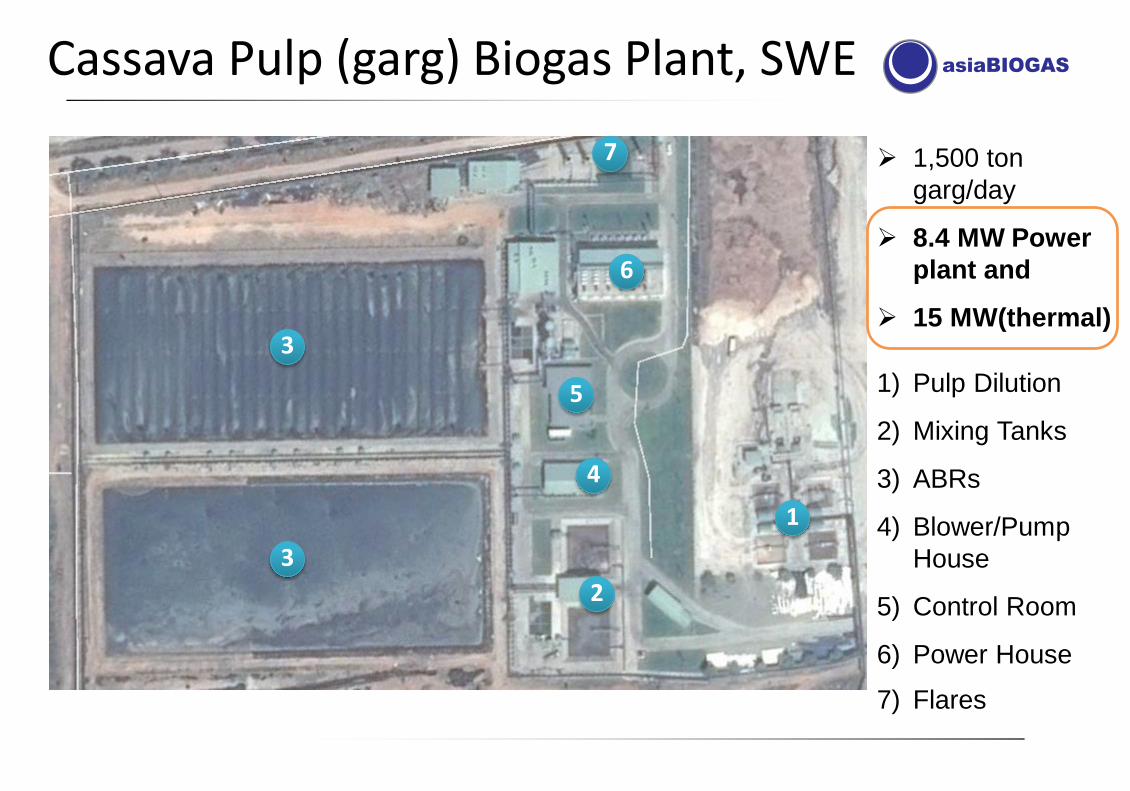
Cassava Pulp (garg) Biogas Plant, SWE
1
2
3
3
7 1,500 ton
garg/day
8.4 MW Power
plant and
15 MW(thermal)
1) Pulp Dilution
2) Mixing Tanks
3) ABRs
4) Blower/Pump
House
5) Control Room
6) Power House
7) Flares
4
5
6
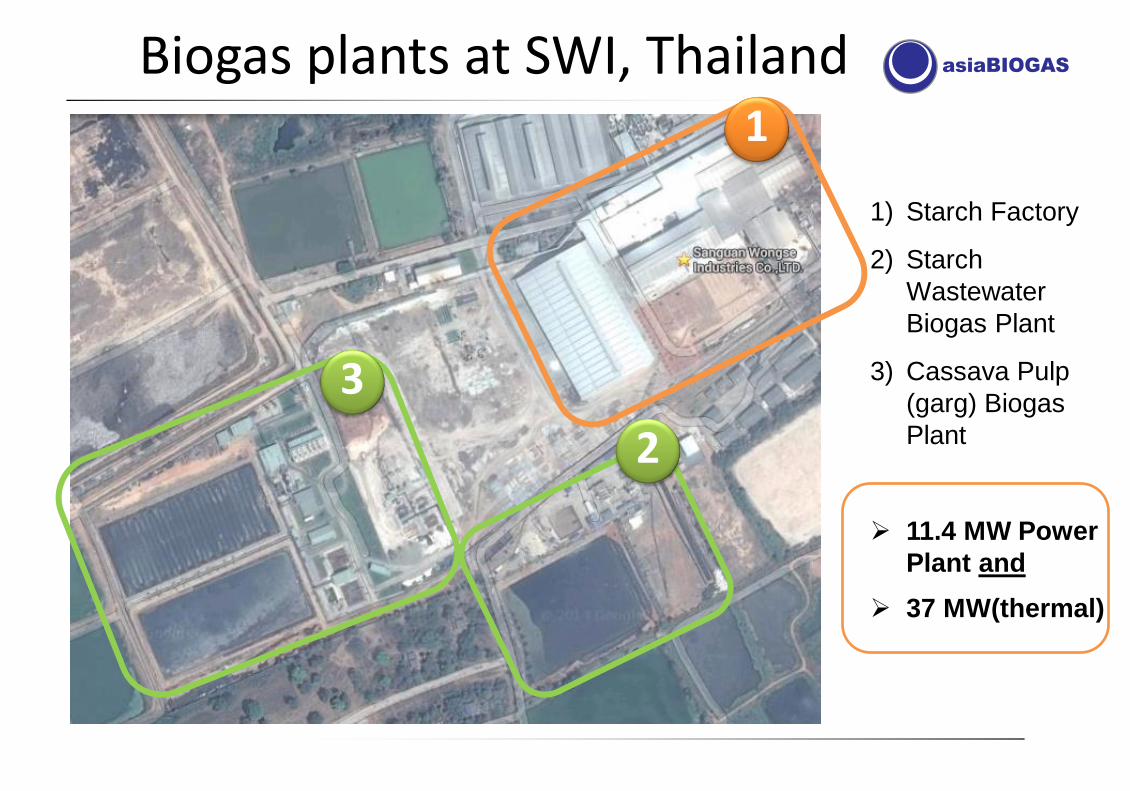
Biogas plants at SWI, Thailand 1
2
3
1) Starch Factory
2) Starch
Wastewater
Biogas Plant
3) Cassava Pulp
(garg) Biogas
Plant
11.4 MW Power
Plant and
37 MW(thermal)
WASTES FROM PALM OIL PRODUCTION – BIOGAS AND POWER POTENTIAL
8
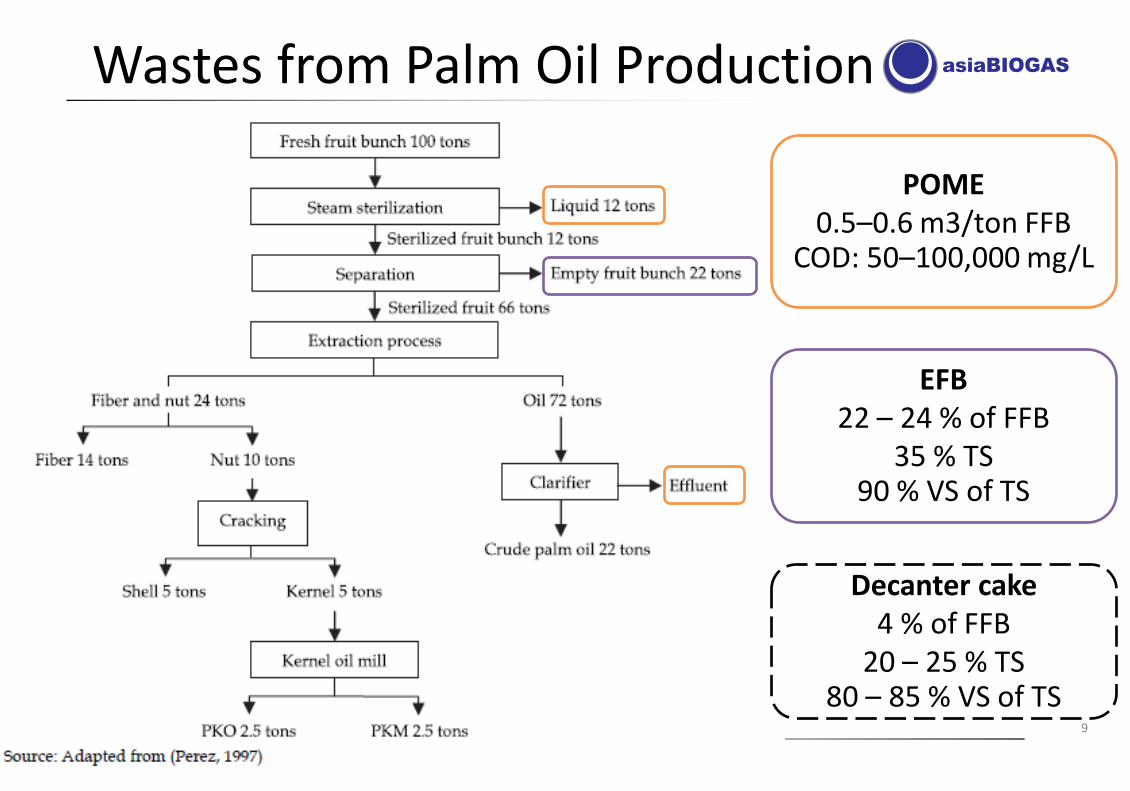
Wastes from Palm Oil Production
9
POME 0.5–0.6 m3/ton FFB
COD: 50–100,000 mg/L
EFB 22 – 24 % of FFB
35 % TS 90 % VS of TS
Decanter cake 4 % of FFB
20 – 25 % TS 80 – 85 % VS of TS
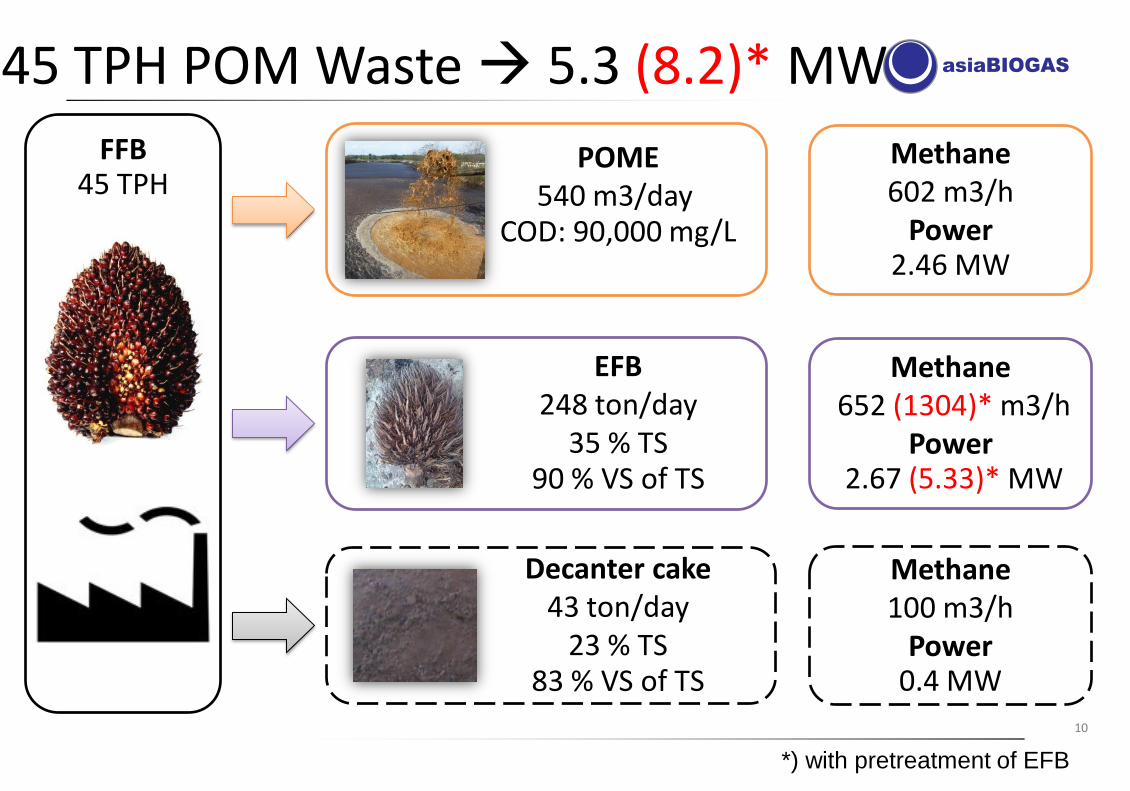
45 TPH POM Waste 5.3 (8.2)* MW
10
FFB 45 TPH
POME 540 m3/day
COD: 90,000 mg/L
EFB 248 ton/day
35 % TS 90 % VS of TS
Decanter cake 43 ton/day
23 % TS 83 % VS of TS
Methane 602 m3/h
Power 2.46 MW
Methane 652 (1304)* m3/h
Power 2.67 (5.33)* MW
Methane 100 m3/h
Power 0.4 MW
*) with pretreatment of EFB
BIOGAS PRODUCTION FROM POME
11
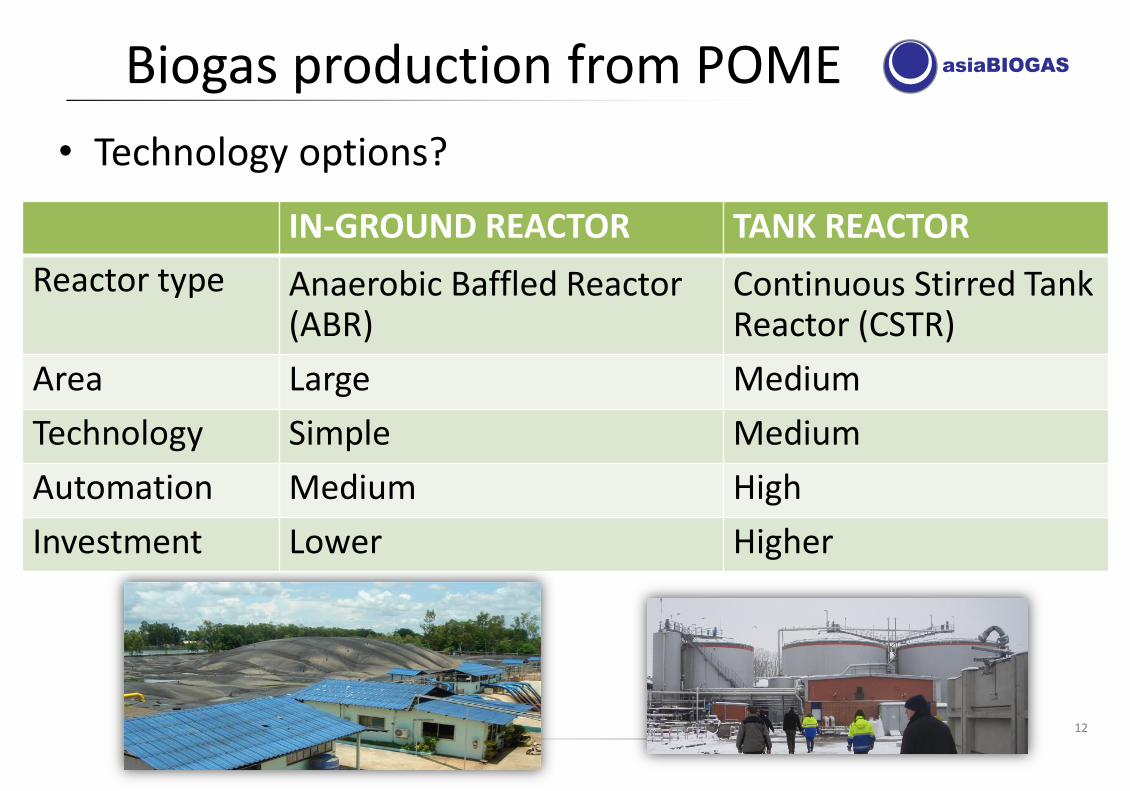
Biogas production from POME • Technology options?
12
IN-GROUND REACTOR TANK REACTOR
Reactor type Anaerobic Baffled Reactor (ABR)
Continuous Stirred Tank Reactor (CSTR)
Area Large Medium
Technology Simple Medium
Automation Medium High
Investment Lower Higher
10 MWth bioCNG CSTR in Sweden
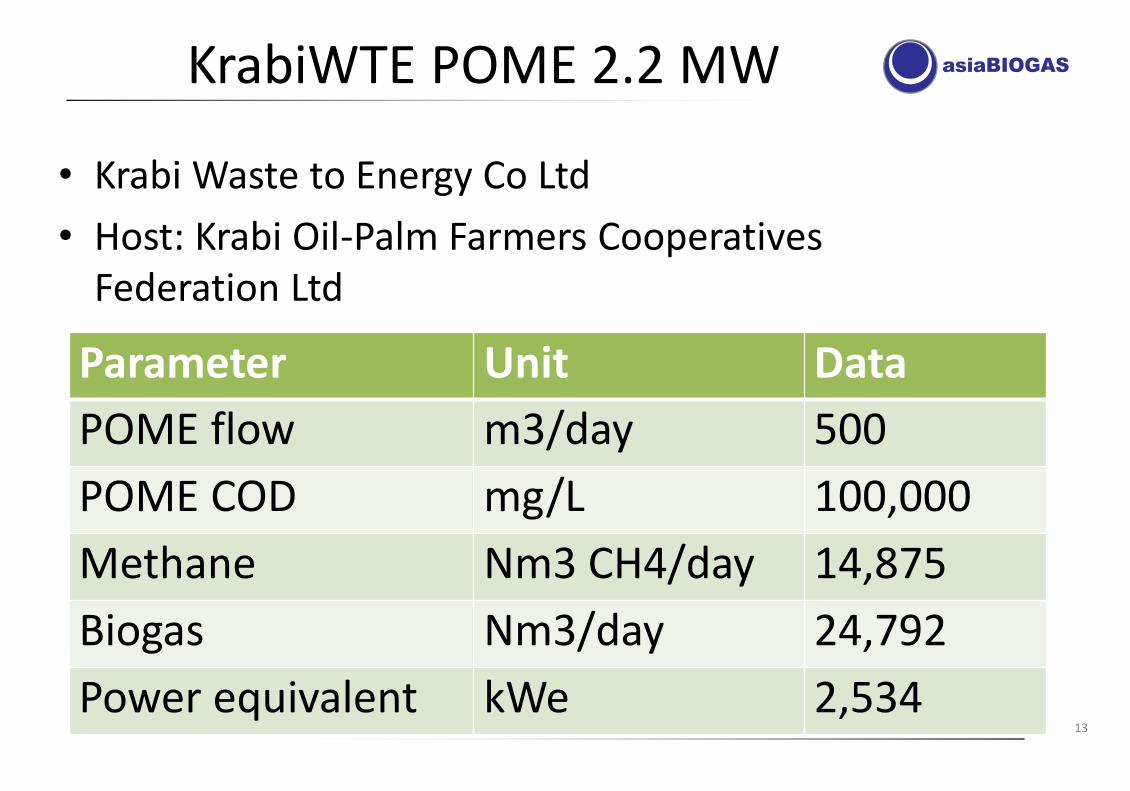
KrabiWTE POME 2.2 MW
• Krabi Waste to Energy Co Ltd
• Host: Krabi Oil-Palm Farmers Cooperatives Federation Ltd
13
Parameter Unit Data
POME flow m3/day 500 POME COD mg/L 100,000 Methane Nm3 CH4/day 14,875 Biogas Nm3/day 24,792 Power equivalent kWe 2,534
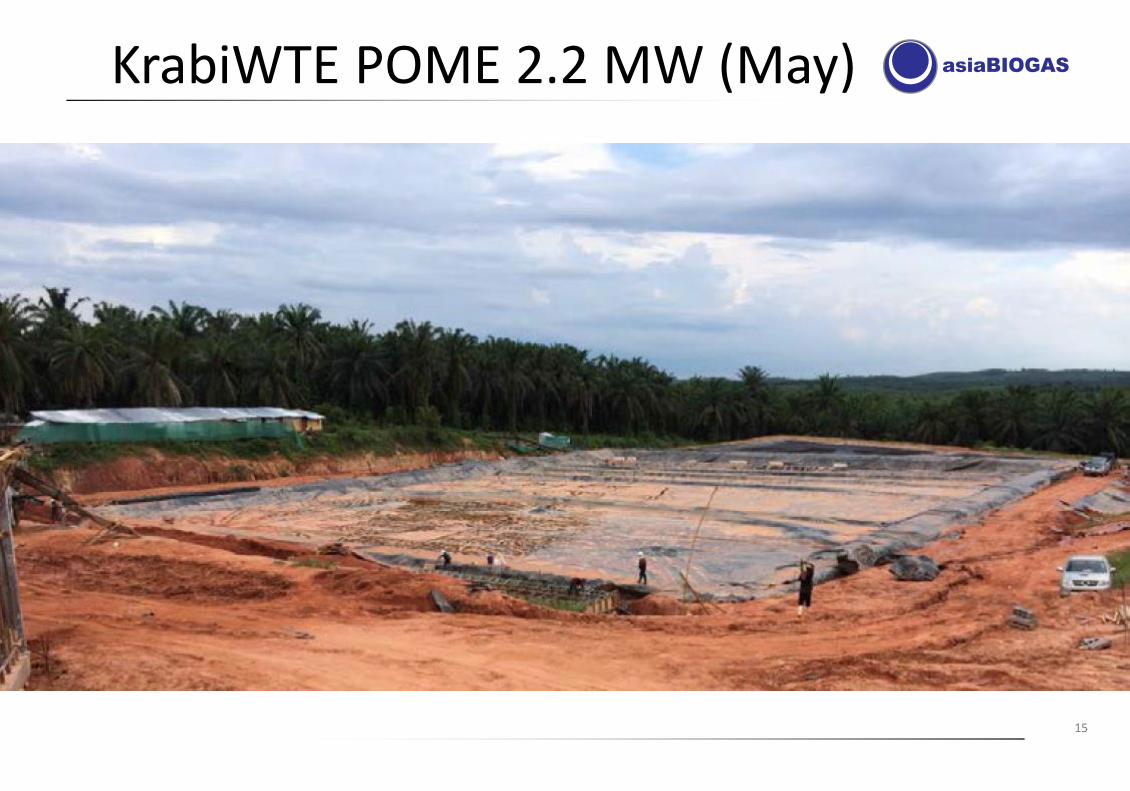
KrabiWTE POME 2.2 MW (May)
15
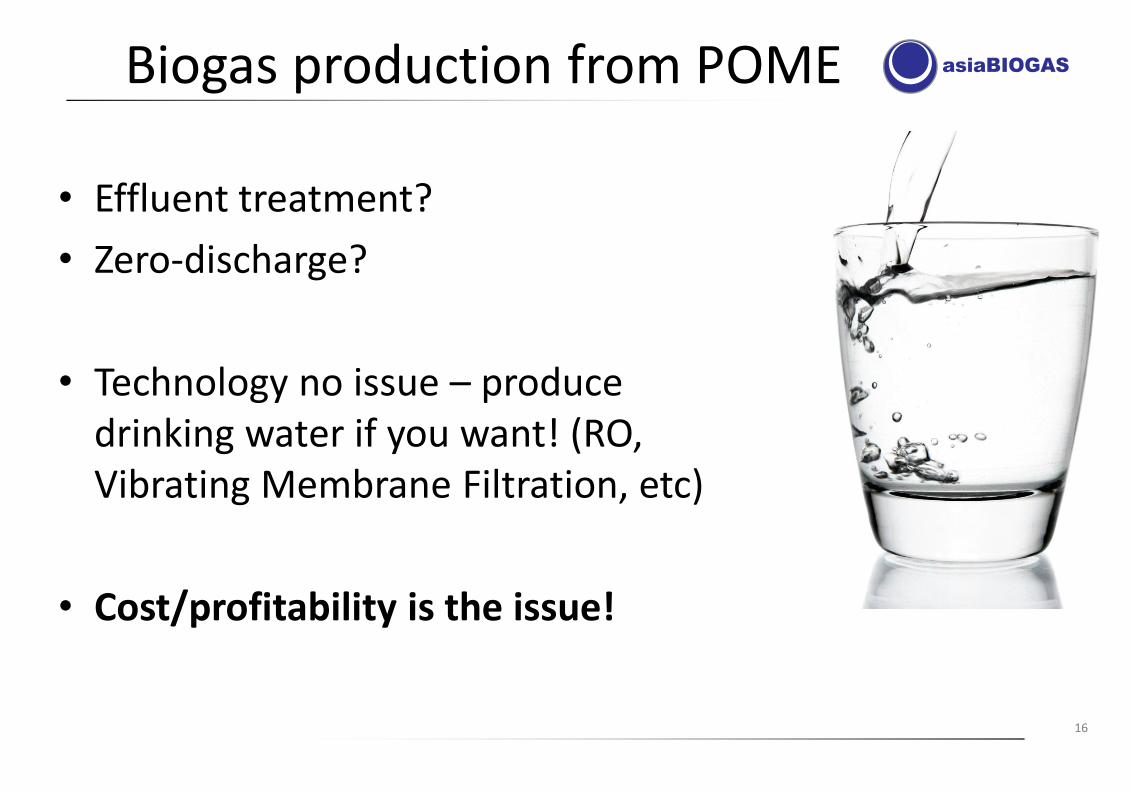
Biogas production from POME
• Effluent treatment?
• Zero-discharge?
• Technology no issue – produce drinking water if you want! (RO, Vibrating Membrane Filtration, etc)
• Cost/profitability is the issue!
16
Biogas production from POME
17
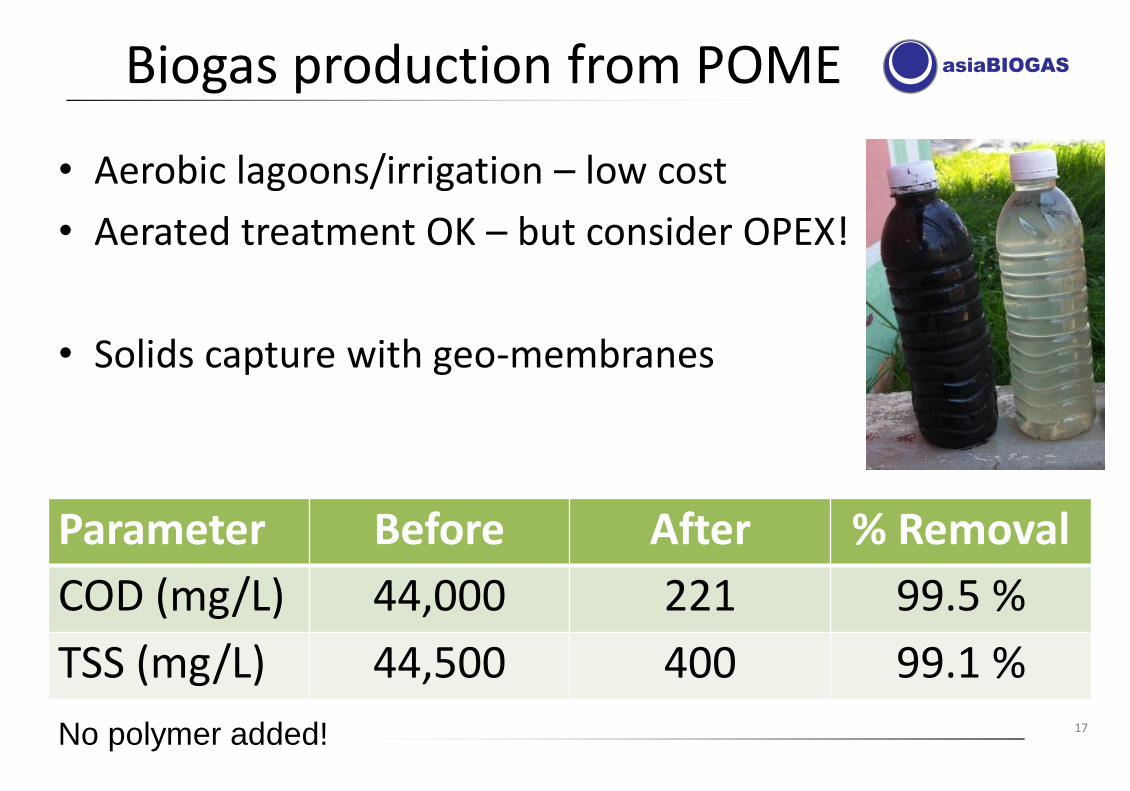
• Aerobic lagoons/irrigation – low cost
• Aerated treatment OK – but consider OPEX!
• Solids capture with geo-membranes
Parameter Before After % Removal
COD (mg/L) 44,000 221 99.5 % TSS (mg/L) 44,500 400 99.1 % No polymer added!
BIOGAS PRODUCTION FROM EFB
18
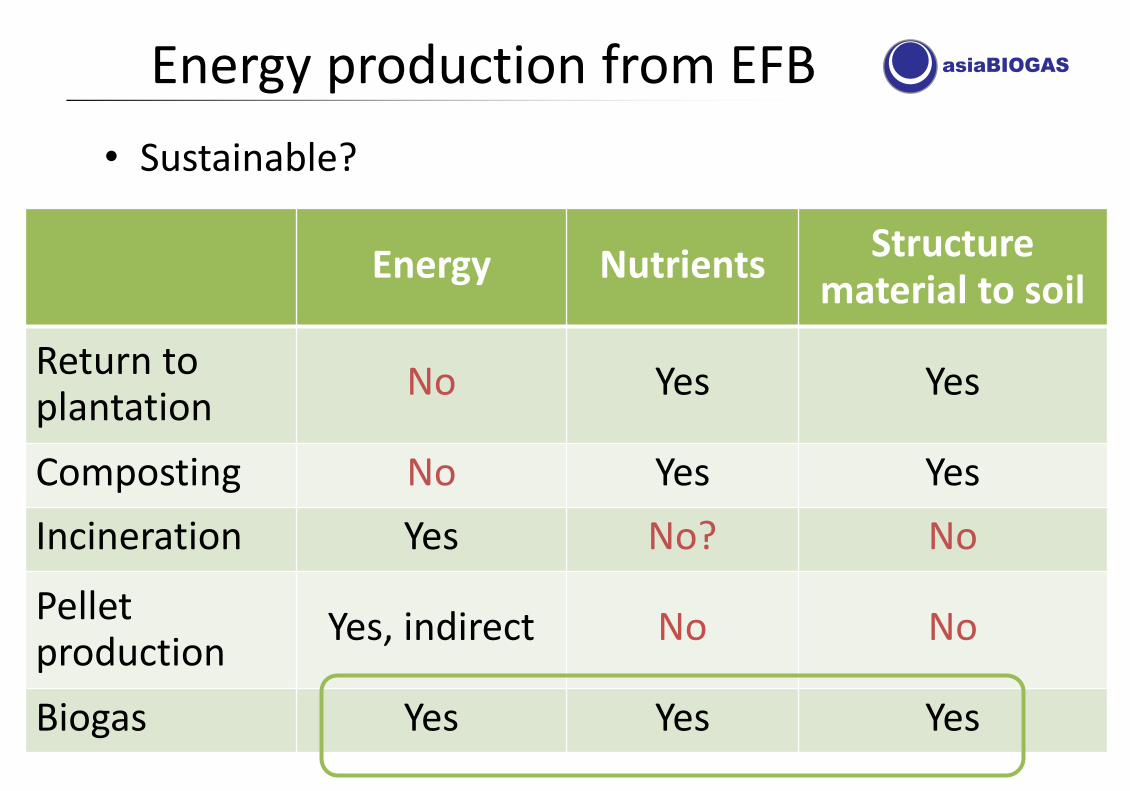
Energy production from EFB
• Sustainable?
19
Energy Nutrients Structure material to soil
Return to plantation
No Yes Yes
Composting No Yes Yes
Incineration Yes No? No
Pellet production
Yes, indirect No No
Biogas Yes Yes Yes
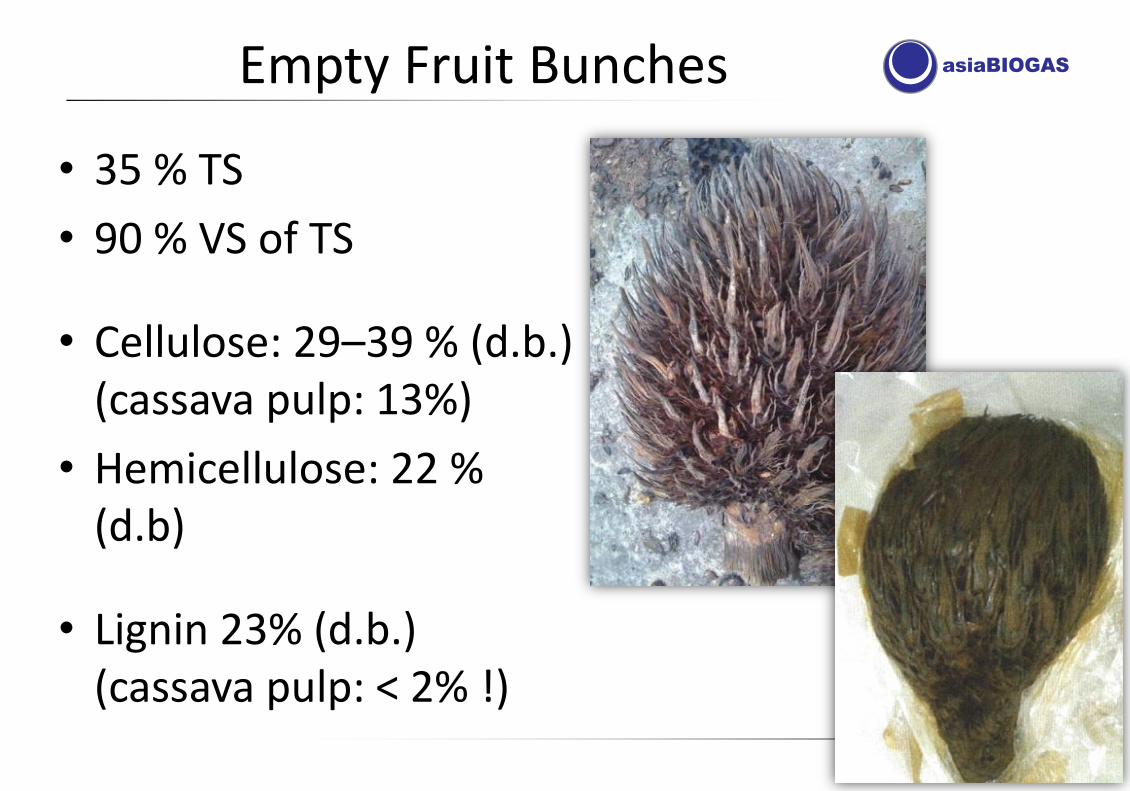
Empty Fruit Bunches
• 35 % TS
• 90 % VS of TS
• Cellulose: 29–39 % (d.b.) (cassava pulp: 13%)
• Hemicellulose: 22 % (d.b)
• Lignin 23% (d.b.) (cassava pulp: < 2% !)
20
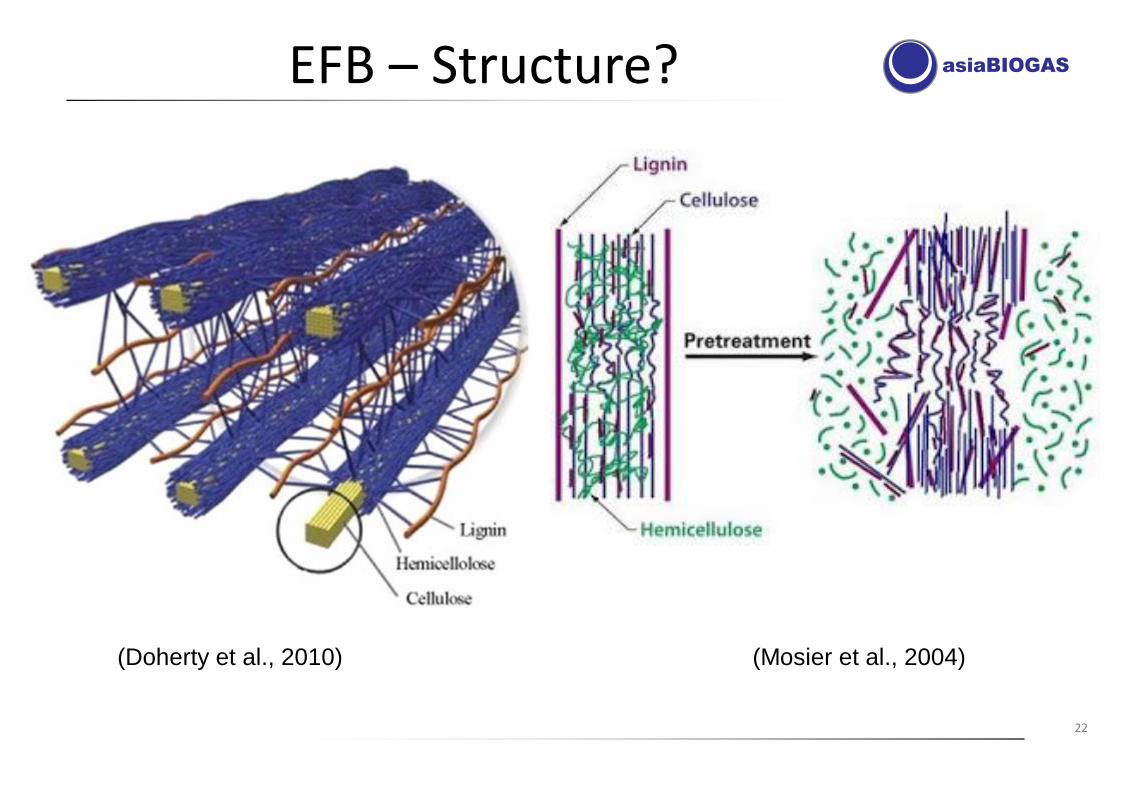
EFB – Structure?
22
(Doherty et al., 2010) (Mosier et al., 2004)
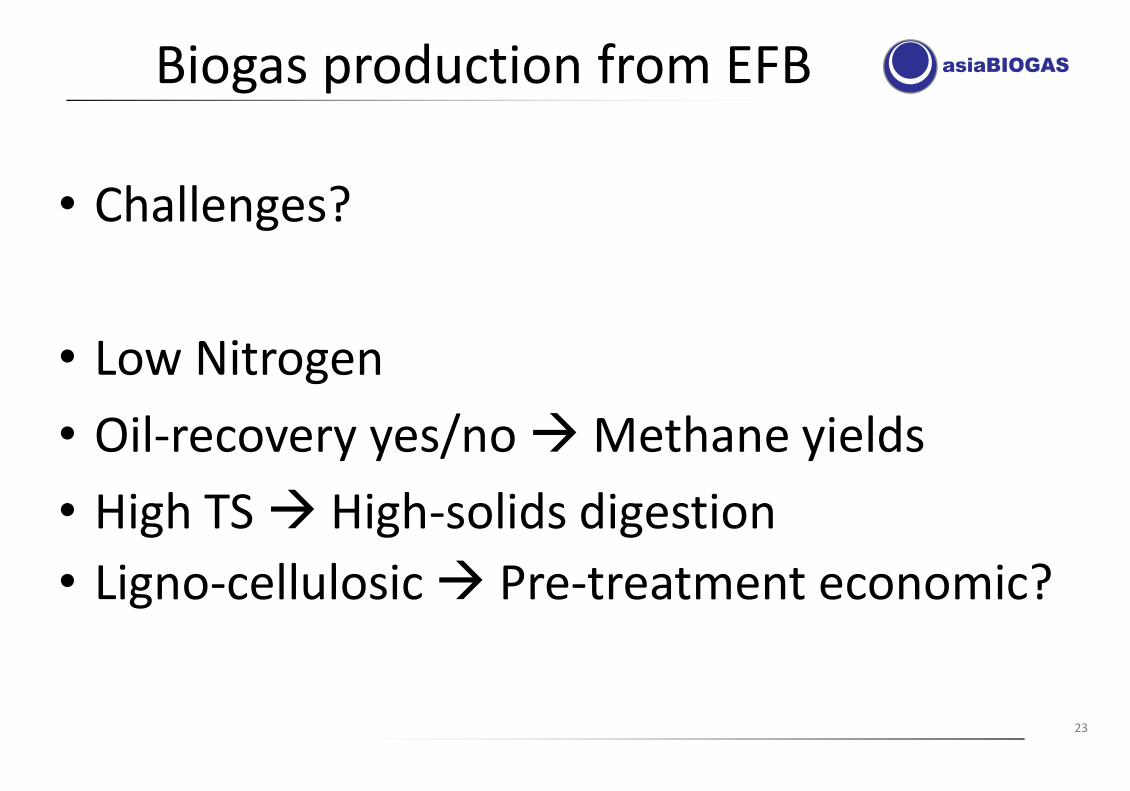
Biogas production from EFB
• Challenges?
• Low Nitrogen
• Oil-recovery yes/no Methane yields
• High TS High-solids digestion
• Ligno-cellulosic Pre-treatment economic?
23
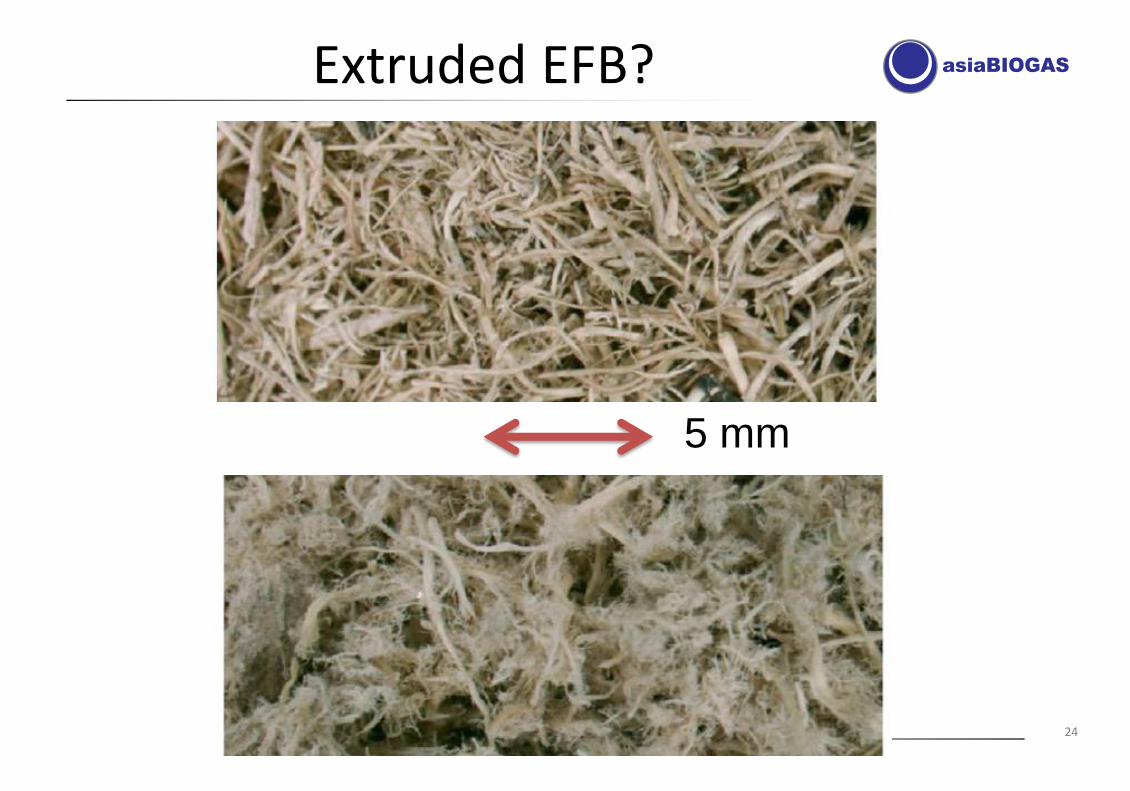
Extruded EFB?
24
5 mm
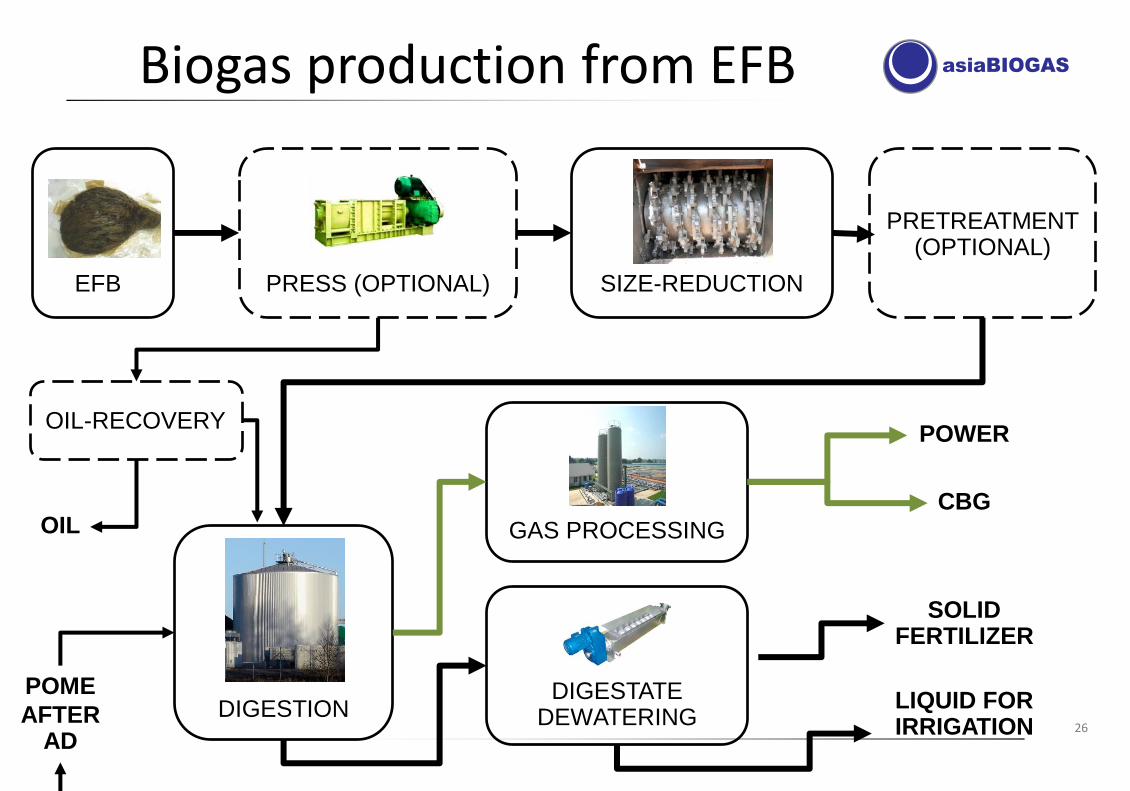
Biogas production from EFB
26
PRETREATMENT (OPTIONAL)
POWER
CBG
SOLID FERTILIZER
LIQUID FOR IRRIGATION
PRESS (OPTIONAL) EFB
OIL-RECOVERY
SIZE-REDUCTION
DIGESTION
GAS PROCESSING
DIGESTATE DEWATERING
OIL
POME
AFTER AD
SYNERGIES / CONCLUSIONS
28
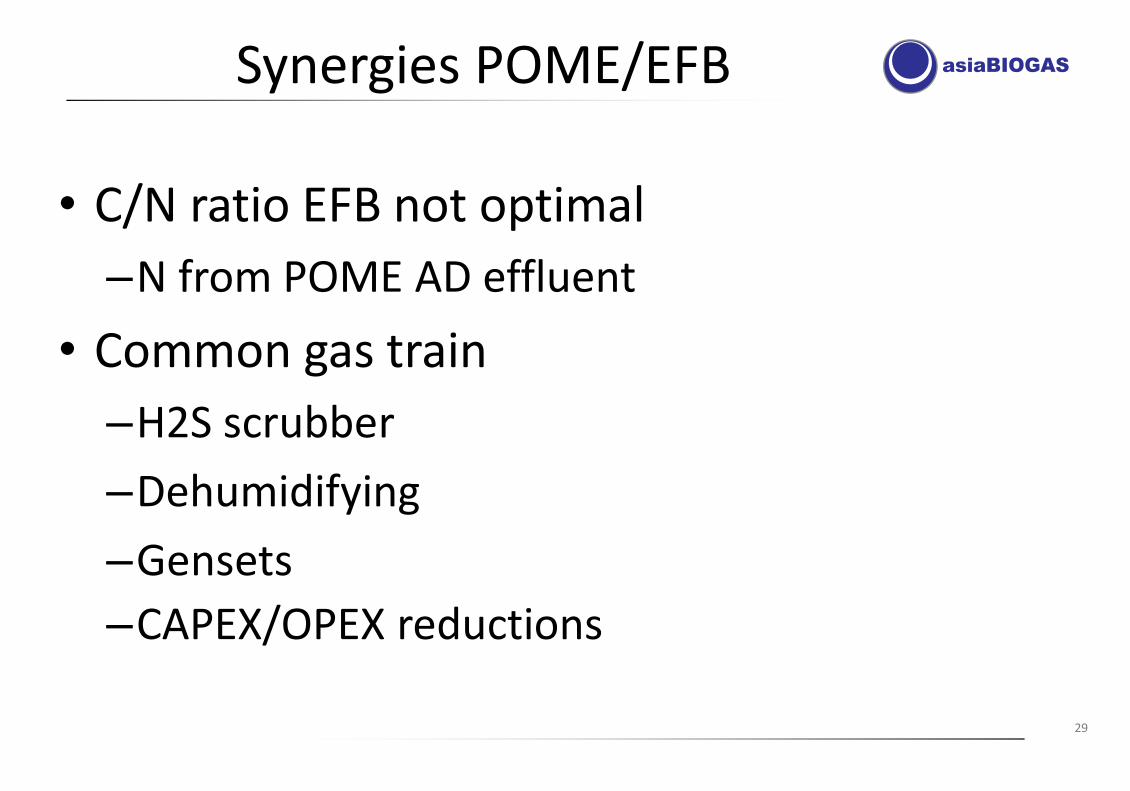
Synergies POME/EFB
• C/N ratio EFB not optimal
–N from POME AD effluent
• Common gas train
–H2S scrubber
–Dehumidifying
–Gensets
–CAPEX/OPEX reductions
29
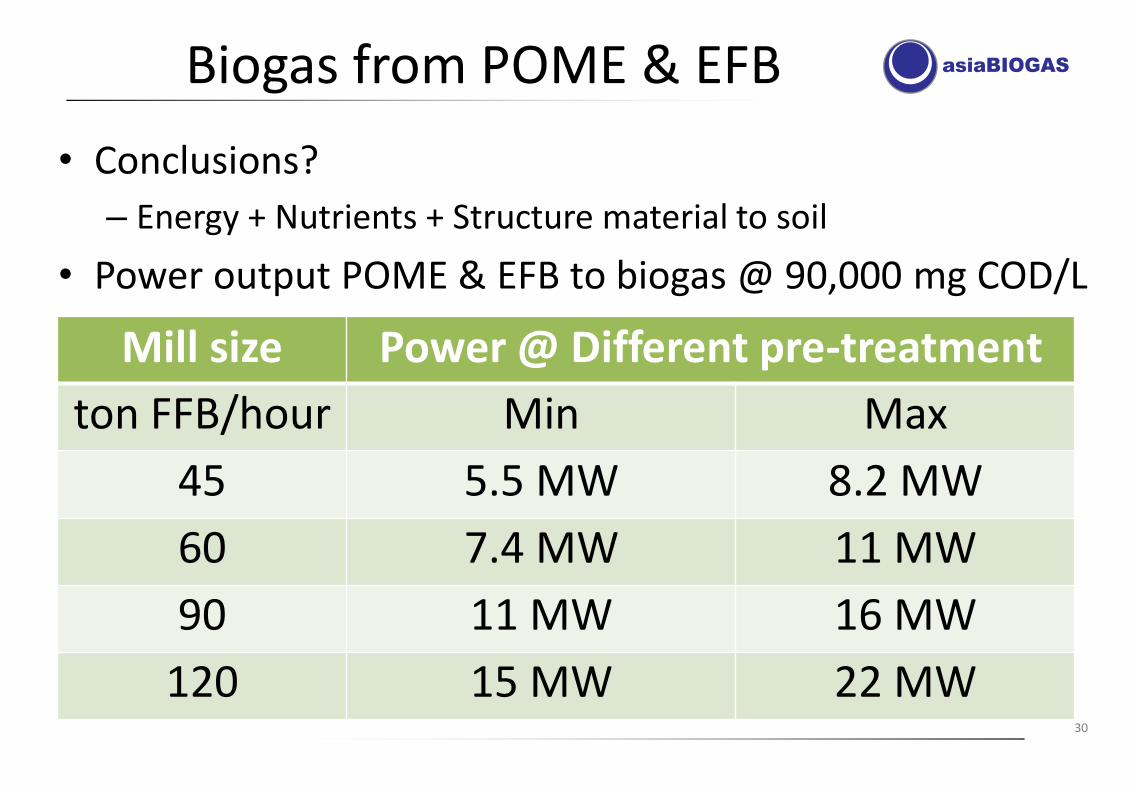
Biogas from POME & EFB
• Conclusions?
– Energy + Nutrients + Structure material to soil
• Power output POME & EFB to biogas @ 90,000 mg COD/L
30
Mill size Power @ Different pre-treatment
ton FFB/hour Min Max 45 5.5 MW 8.2 MW 60 7.4 MW 11 MW 90 11 MW 16 MW
120 15 MW 22 MW
31
Biogas Design Engineering Services
EPC and Turnkey
Project Construction
Project Financing Solutions
Biogas solutions for:
Cassava Starch Palm Oil Manure
Energy Crops Agro-industrial Wastes
Food/Beverage Ethanol
Anders Ek, Chief Scientist
asiaBIOGAS
Bangkok – Singapore – Jakarta
www.asiabiogas.com