Embed Size (px)
Citation preview

8/12/2019 Anaerobic Membrane Reactor With Phase Separation for Treatment the Whey
http://slidepdf.com/reader/full/anaerobic-membrane-reactor-with-phase-separation-for-treatment-the-whey 1/7
Anaerobic membrane reactor with phase separationfor the treatment of cheese whey
Ahlem Saddoud, Ilem Hassaıri, Sami Sayadi *
Laboratoire des Bio-procedes, Centre de Biotechnologie de Sfax, BP: K, Sfax 3038, Tunisia
Received 18 February 2005; received in revised form 15 August 2006; accepted 18 August 2006Available online 13 October 2006
Abstract
Two-phase anaerobic digestion of cheese whey was investigated in a system consisting of a stirred acidogenic reactor followed by astirred methanogenic reactor, the latter being coupled to a membrane filtration system to enable removal of soluble effluent whilst retain-ing solids. The acidogenic reactor was operated at a hydraulic retention time (HRT) of one day, giving maximum acidification of 52.25%with up to 5 g/l volatile fatty acids, of which 63.7% was acetic acid and 24.7% was propionic acid. The methanogenic reactor received anorganic load up to 19.78 g COD/l d, corresponding to a HRT of 4 days, at which 79% CODs and 83% BOD 5 removal efficiencies wereobtained. Average removals of COD, BOD5 and TSS in the two-phase anaerobic digestion process were 98.5%, 99% and 100%, respec-tively. The daily biogas production exceeded 10 times reactor volume and biogas methane content was greater than 70%. 2006 Elsevier Ltd. All rights reserved.
Keywords: Cheese whey; Acidogenesis; Methanogenesis; Cross-flow microfiltration
1. Introduction
Whey is a by-product of the dairy industry in which theprincipal components are lactose, proteins and mineralsalts (Vasala et al., 2005). Approximately 47% of the 115million tons of whey produced world-wide every year aredisposed of in the environment (Leite et al., 2000; Zhouand Kosaric, 1993; Siso, 1996). This represents a significantloss of resources and causes serious pollution problemssince whey is a high strength organic pollutant with high
BOD5 and COD, with values of 40,000–60,000 mg/l and50,000–80,000 mg/l, respectively (Ben-Hassan and Ghaly,1994; Fournier et al., 1993). More than 90% of wheyBOD5 is due to lactose (Kisaalita et al., 1990).
Currently, the whey production in Tunisia is estimatedat 35,000 tonnes/year. During the last few decades, thisproduction has increased very rapidly with the develop-ment of the dairy industry. Thus, the problem of whey dis-posal will worsen. Indeed, the continuous discharge of whey onto land can endanger the chemical and physical
structure of the soil, reduce crop yields and lead to seriousgroundwater pollution problems (Ben-Hassan and Ghaly,1994).
For medium size cheese factories, that have growing dis-posal problems and cannot afford high investment costs forwhey valorisation technologies (such as whey protein andlactose recovery, spray drying, etc.), physico-chemicaland/or biological treatment of this effluent is imperative.Due to the high organic content of whey, the basic biolo-gical treatment process to be used can only be anaerobicdigestion, whereas regular treatment processes such as the
0960-8524/$ - see front matter 2006 Elsevier Ltd. All rights reserved.
doi:10.1016/j.biortech.2006.08.013
Abbreviations: AD, anaerobic digestion; AR, acidogenic reactor; BOD5,biochemical oxygen demand; COD, chemical oxygen demand; CODs,soluble chemical oxygen demand; CSTRs, continuous stirred tank reac-tors; CSMR, continuous stirred methanogenic reactor; HRT, hydraulicretention time; TMP, trans-membrane pressure; TN, total nitrogen; TP,total phosphorous; TS, total solids; TSS, total suspended solids; VCR,volumetric concentration factor; VFAs, volatile fatty acids; VS, volatilesolids; VSS, volatile suspended solids; MR, methanogenic reactor; CFM,cross-flow microfiltration; MS, mineral solids.* Corresponding author. Tel./fax: +216 74 440452.
E-mail address: [email protected] (S. Sayadi).
Bioresource Technology 98 (2007) 2102–2108

8/12/2019 Anaerobic Membrane Reactor With Phase Separation for Treatment the Whey
http://slidepdf.com/reader/full/anaerobic-membrane-reactor-with-phase-separation-for-treatment-the-whey 2/7
activated sludge process are completely inappropriate(Gavala et al., 1999).
Anaerobic digestion of cheese whey offers an excellentsolution in terms of both energy saving and pollution con-trol (Erguder et al., 2001). The major advantages of thisprocess are low cost, high energy efficiency and process
simplicity compared to other waste treatment methods.However, despite these advantages, anaerobic digestionis not widespread in the dairy industry, largely due to theproblems of slow reaction, which requires longer HRT,and poor process stability, especially for effluents rich incomponents that are subject to rapid acidification. Indeed,Malaspina et al. (1996) stated that raw whey is a quiteproblematic substrate to treat anaerobically because of very low bicarbonate alkalinity (50 meq l1), high CODconcentration (70 g COD l1) and a tendency to acidifyvery rapidly.
The idea of developing anaerobic digestion as a two-phase process originated from the view that it is generally
a process involving two different sets of activities. Overall,the two-phase process takes advantage of the phase separa-tion phenomenon, deriving naturally from different kineticrates. This provides separate acidogenic and methanogenicreactors to decrease the cost, and to improve treatment effi-ciency, energy production and process stability of anaero-bic systems (Ke and Shi, 2005).
Anaerobic digesters are widely used for treatment of agro-industry by-product wastewaters. These digesters aresingle pass reactors with no selective solids recycle. Thislimits the organic loading rates and operating biomass con-centrations (Pillay et al., 1994). One way to overcome these
problems is to include a membrane to enable independentcontrol of hydraulic and solid retention times (Dhouibet al., 2003). Indeed, in recent years, considerable attentionhas been focused on development of a novel anaerobic pro-cess in which a membrane separation unit is incorporatedin place of a settlement system. So far, several investigatorshave studied anaerobic-membrane processes for treatmentof wastewaters such as wine distillery effluents (Rosset al., 1990), palm oil mill effluent (Fakhru’l-Razi andNoor, 1999) and dairy wastes (Li et al., 1985).
This study examined the feasibility of applying an anaer-obic membrane bioreactor with phase separation (acido-genesis/ methanogenesis) to treat cheese whey.
2. Methods
2.1. Whey
The whey used in this study was obtained from the‘‘Tunisian Cheese Factory’’ (Sfax, Tunisia) which used tra-ditional technologies for cheese manufacture. The wheysamples were drained directly from the cheese vats, col-lected in 20 l tanks and transported to the laboratory free-zer and stored there at a temperature of 20 C to avoidthe acidification and the chemical composition modifica-
tion of cheese whey. About one week before it was needed,
a proportion of the frozen whey was moved into a coldroom at 4 C for defrosting. During the adaptation phasediluted whey at pH 6.5 was fed into the reactor.
The chemical composition of cheese whey is shown inTable 1. The notable characteristics of this effluent arethe high COD and especially BOD5 values. Indeed, morethan 90% of whey BOD5 is due to lactose (Kisaalitaet al., 1990).
2.2. Experimental apparatus
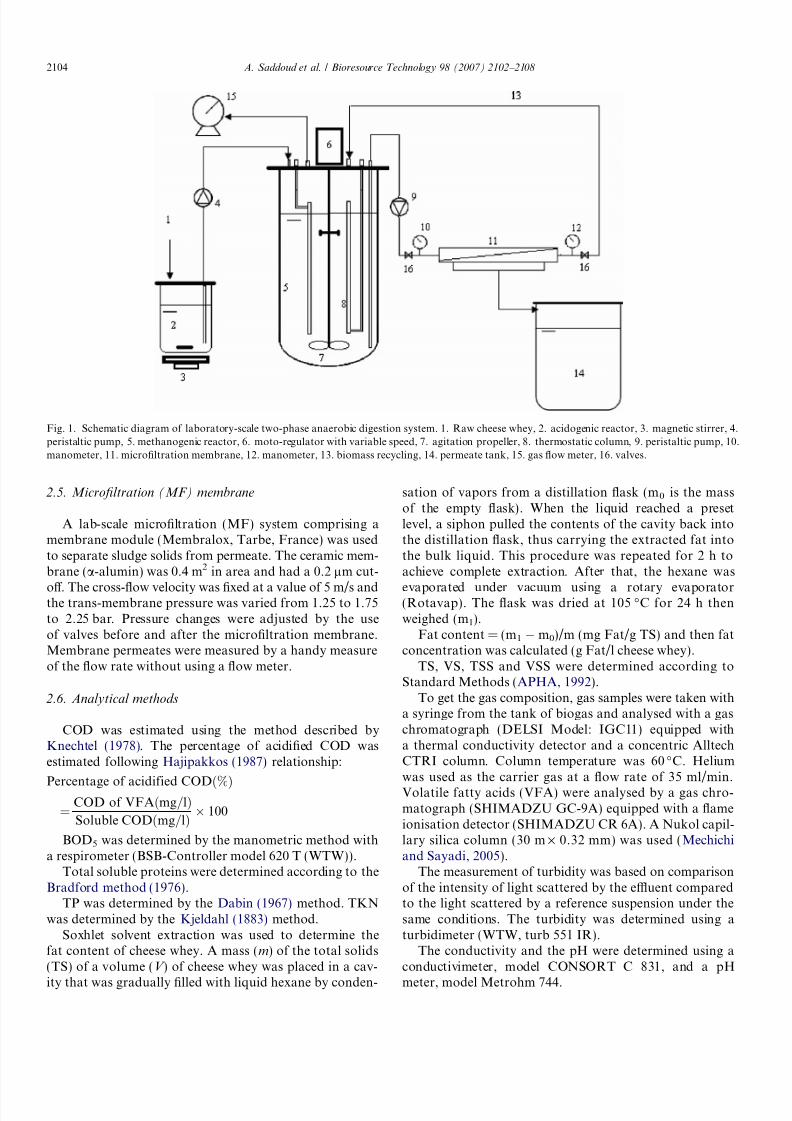
The experimental set-up used in this study is shownschematically in Fig. 1. It consisted of a continuously stir-red reactor used as an acidogenic reactor and a continu-ously stirred reactor coupled to a membrane module used
as a methanogenic reactor.The seed sludge for both reactors was obtained from a
full-scale anaerobic wastewater treatment plant.
2.3. Acidogenesis
The acidogenic phase was carried out in a 7 l stirredreactor (diameter 16.4 cm; height 33 cm), with 5 l workingvolume. The acidogenic reactor was kept at room temper-ature (37 ± 2 C). Agitation was provided by a magneticstirrer. The pH of the feed was regulated at the beginningof the tests at 6.5.
2.4. Methanogenesis
The methanogenic phase was carried out in a 20 l (dia-meter 22 cm; height 52 cm) Biolafite thermostatic reactorwith a working volume of 15 l and a stirring speed of 200 rpm. The temperature of the reactor was maintainedconstant at 37 C by circulating water through the thermo-static column in the reactor.
Solids (anaerobic sludge) separation prior to recyclingwas achieved by gravity settlement using a conventionaldecanter during the first 25 days. After this period, a mem-brane module was attached to the methanogenic reactor
and the retentate was recycled into the reactor.
Table 1Chemical characteristics of raw cheese whey
Characteristics Sample
COD (g/l) 68.6 ± 3.3BOD5 (g/l) 37.71 ± 2.84COD/BOD5 1.83 ± 0.05TSS (g/l) 1.35 ± 0.06
Lactose (g/l) 45.9 ± 0.88Proteins (g/l) 2.71 ± 0.05TS (%) 5.93 ± 0.38VS (%) 5.61 ± 0.36MS (%) 0.31 ± 6.3 · 104
Fat (g/l) 9.439 ± 1.14pH 4.9 ± 0.27TKN (g/l) 1.12 ± 0.01TP (g/l) 0.5 ± 1.8 · 103
A. Saddoud et al. / Bioresource Technology 98 (2007) 2102–2108 2103
8/12/2019 Anaerobic Membrane Reactor With Phase Separation for Treatment the Whey
http://slidepdf.com/reader/full/anaerobic-membrane-reactor-with-phase-separation-for-treatment-the-whey 3/7
2.5. Microfiltration (MF) membrane
A lab-scale microfiltration (MF) system comprising amembrane module (Membralox, Tarbe, France) was usedto separate sludge solids from permeate. The ceramic mem-brane (a-alumin) was 0.4 m2 in area and had a 0.2 lm cut-
off. The cross-flow velocity was fixed at a value of 5 m/s andthe trans-membrane pressure was varied from 1.25 to 1.75to 2.25 bar. Pressure changes were adjusted by the useof valves before and after the microfiltration membrane.Membrane permeates were measured by a handy measureof the flow rate without using a flow meter.
2.6. Analytical methods
COD was estimated using the method described byKnechtel (1978). The percentage of acidified COD wasestimated following Hajipakkos (1987) relationship:
Percentage of acidified CODð%Þ
¼COD of VFAðmg=lÞ
Soluble CODðmg=lÞ 100
BOD5 was determined by the manometric method witha respirometer (BSB-Controller model 620 T (WTW)).
Total soluble proteins were determined according to theBradford method (1976).
TP was determined by the Dabin (1967) method. TKNwas determined by the Kjeldahl (1883) method.
Soxhlet solvent extraction was used to determine thefat content of cheese whey. A mass (m) of the total solids(TS) of a volume (V ) of cheese whey was placed in a cav-
ity that was gradually filled with liquid hexane by conden-
sation of vapors from a distillation flask (m0 is the massof the empty flask). When the liquid reached a presetlevel, a siphon pulled the contents of the cavity back intothe distillation flask, thus carrying the extracted fat intothe bulk liquid. This procedure was repeated for 2 h toachieve complete extraction. After that, the hexane was
evaporated under vacuum using a rotary evaporator(Rotavap). The flask was dried at 105 C for 24 h thenweighed (m1).
Fat content = (m1 m0)/m (mg Fat/g TS) and then fatconcentration was calculated (g Fat/l cheese whey).
TS, VS, TSS and VSS were determined according toStandard Methods (APHA, 1992).
To get the gas composition, gas samples were taken witha syringe from the tank of biogas and analysed with a gaschromatograph (DELSI Model: IGC11) equipped witha thermal conductivity detector and a concentric AlltechCTRI column. Column temperature was 60 C. Heliumwas used as the carrier gas at a flow rate of 35 ml/min.Volatile fatty acids (VFA) were analysed by a gas chro-matograph (SHIMADZU GC-9A) equipped with a flameionisation detector (SHIMADZU CR 6A). A Nukol capil-lary silica column (30 m · 0.32 mm) was used (Mechichiand Sayadi, 2005).
The measurement of turbidity was based on comparisonof the intensity of light scattered by the effluent comparedto the light scattered by a reference suspension under thesame conditions. The turbidity was determined using aturbidimeter (WTW, turb 551 IR).
The conductivity and the pH were determined using aconductivimeter, model CONSORT C 831, and a pH
meter, model Metrohm 744.
Fig. 1. Schematic diagram of laboratory-scale two-phase anaerobic digestion system. 1. Raw cheese whey, 2. acidogenic reactor, 3. magnetic stirrer, 4.peristaltic pump, 5. methanogenic reactor, 6. moto-regulator with variable speed, 7. agitation propeller, 8. thermostatic column, 9. peristaltic pump, 10.manometer, 11. microfiltration membrane, 12. manometer, 13. biomass recycling, 14. permeate tank, 15. gas flow meter, 16. valves.
2104 A. Saddoud et al. / Bioresource Technology 98 (2007) 2102–2108
8/12/2019 Anaerobic Membrane Reactor With Phase Separation for Treatment the Whey
http://slidepdf.com/reader/full/anaerobic-membrane-reactor-with-phase-separation-for-treatment-the-whey 4/7
3. Results and discussion
3.1. Acidogenesis stage
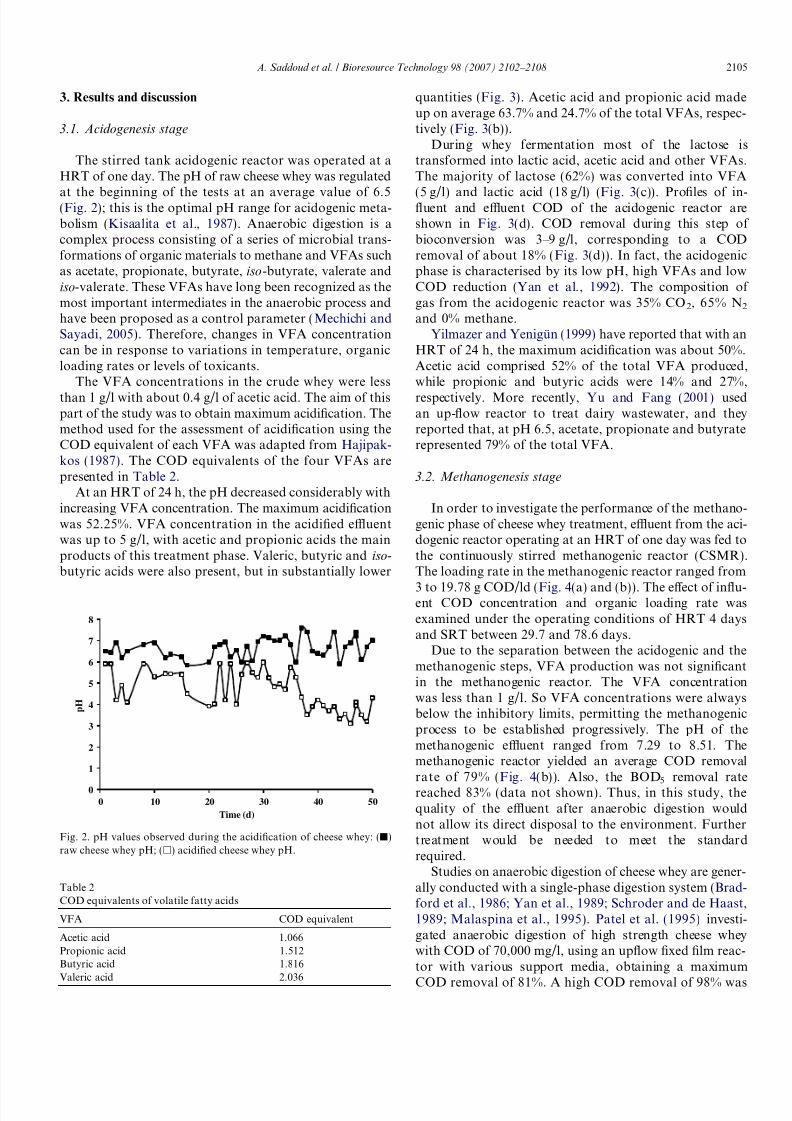
The stirred tank acidogenic reactor was operated at aHRT of one day. The pH of raw cheese whey was regulated
at the beginning of the tests at an average value of 6.5(Fig. 2); this is the optimal pH range for acidogenic meta-bolism (Kisaalita et al., 1987). Anaerobic digestion is acomplex process consisting of a series of microbial trans-formations of organic materials to methane and VFAs suchas acetate, propionate, butyrate, iso-butyrate, valerate andiso-valerate. These VFAs have long been recognized as themost important intermediates in the anaerobic process andhave been proposed as a control parameter (Mechichi andSayadi, 2005). Therefore, changes in VFA concentrationcan be in response to variations in temperature, organicloading rates or levels of toxicants.
The VFA concentrations in the crude whey were less
than 1 g/l with about 0.4 g/l of acetic acid. The aim of thispart of the study was to obtain maximum acidification. Themethod used for the assessment of acidification using theCOD equivalent of each VFA was adapted from Hajipak-kos (1987). The COD equivalents of the four VFAs arepresented in Table 2.
At an HRT of 24 h, the pH decreased considerably withincreasing VFA concentration. The maximum acidificationwas 52.25%. VFA concentration in the acidified effluentwas up to 5 g/l, with acetic and propionic acids the mainproducts of this treatment phase. Valeric, butyric and iso-butyric acids were also present, but in substantially lower
quantities (Fig. 3). Acetic acid and propionic acid madeup on average 63.7% and 24.7% of the total VFAs, respec-tively (Fig. 3(b)).
During whey fermentation most of the lactose istransformed into lactic acid, acetic acid and other VFAs.The majority of lactose (62%) was converted into VFA
(5 g/l) and lactic acid (18 g/l) (Fig. 3(c)). Profiles of in-fluent and effluent COD of the acidogenic reactor areshown in Fig. 3(d). COD removal during this step of bioconversion was 3–9 g/l, corresponding to a CODremoval of about 18% (Fig. 3(d)). In fact, the acidogenicphase is characterised by its low pH, high VFAs and lowCOD reduction (Yan et al., 1992). The composition of gas from the acidogenic reactor was 35% CO2, 65% N2
and 0% methane.Yilmazer and Yenigun (1999) have reported that with an
HRT of 24 h, the maximum acidification was about 50%.Acetic acid comprised 52% of the total VFA produced,while propionic and butyric acids were 14% and 27%,
respectively. More recently, Yu and Fang (2001) usedan up-flow reactor to treat dairy wastewater, and theyreported that, at pH 6.5, acetate, propionate and butyraterepresented 79% of the total VFA.
3.2. Methanogenesis stage
In order to investigate the performance of the methano-genic phase of cheese whey treatment, effluent from the aci-dogenic reactor operating at an HRT of one day was fed tothe continuously stirred methanogenic reactor (CSMR).The loading rate in the methanogenic reactor ranged from
3 to 19.78 g COD/ld (Fig. 4(a) and (b)). The effect of influ-ent COD concentration and organic loading rate wasexamined under the operating conditions of HRT 4 daysand SRT between 29.7 and 78.6 days.
Due to the separation between the acidogenic and themethanogenic steps, VFA production was not significantin the methanogenic reactor. The VFA concentrationwas less than 1 g/l. So VFA concentrations were alwaysbelow the inhibitory limits, permitting the methanogenicprocess to be established progressively. The pH of themethanogenic effluent ranged from 7.29 to 8.51. Themethanogenic reactor yielded an average COD removalrate of 79% (Fig. 4(b)). Also, the BOD5 removal ratereached 83% (data not shown). Thus, in this study, thequality of the effluent after anaerobic digestion wouldnot allow its direct disposal to the environment. Furthertreatment would be needed to meet the standardrequired.
Studies on anaerobic digestion of cheese whey are gener-ally conducted with a single-phase digestion system (Brad-ford et al., 1986; Yan et al., 1989; Schroder and de Haast,1989; Malaspina et al., 1995). Patel et al. (1995) investi-gated anaerobic digestion of high strength cheese wheywith COD of 70,000 mg/l, using an upflow fixed film reac-tor with various support media, obtaining a maximum
COD removal of 81%. A high COD removal of 98% was
0
1
2
3
4
5
6
7
8
0 10 20 30 40 50
Time (d)
p H
Fig. 2. pH values observed during the acidification of cheese whey: (j)raw cheese whey pH; (h) acidified cheese whey pH.
Table 2COD equivalents of volatile fatty acids
VFA COD equivalent
Acetic acid 1.066Propionic acid 1.512Butyric acid 1.816
Valeric acid 2.036
A. Saddoud et al. / Bioresource Technology 98 (2007) 2102–2108 2105

8/12/2019 Anaerobic Membrane Reactor With Phase Separation for Treatment the Whey
http://slidepdf.com/reader/full/anaerobic-membrane-reactor-with-phase-separation-for-treatment-the-whey 5/7
reported by Malaspina et al. (1996) using a downflow– upflow hybrid reactor. More recently, Yilmazer and Yeni-gun (1999) obtained high COD removal, over 90%, in anup-flow anaerobic filter operated at a HRT of 4 days with
a maximum biogas yield of 0.55 m3
/kg COD removed.
3.3. Methanogenesis stage coupled to cross-flow
microfiltration
Membrane separation is an effective method to achieve
complete separation of solids from the effluent and thismethod allows operation at high sludge ages.
The tests were carried out under optimal conditions fortreated whey microfiltration at a cross-flow velocity of 5m/s, a VCF of 1 and a biomass concentration of 8.5 g/l(Dhouib et al., 2003). The main parameter varied for opti-misation was TMP. The results of these tests are shown inFig. 5. Permeate flux increased with increasing TMP from1.25 to 1.75 bar. A plateau with 1.75 bar pressure was
0
10
20
30
40
50
60
70
80
90
100
1 4 12 17 20 24 30 36 40 43 46
Time (d)
A
c i d i f i c a t i o n ( % )
0
1
2
3
4
0 10 20 30 40 50
V F A c o n c e n t r a t i o n ( g / l )
Time (d)
0
5
10
15
20
25
30
35
40
0 10 15 20 25 30
Time (h)
C o n
c e n t r a t i o n ( g / l )
0
10
20
30
40
50
60
70
80
90
0 10 20 30 40 50
Time (d)
C O D c o n c e n t r a t i o n ( g / l )
6 95
Fig. 3. (a) Rate of acidification of cheese whey expressed as percentage of acetic acid, propionic acid, iso-butyric acid, butyric acid and valeric acidproduced. h: Acetic acid, : propionic acid, : iso-butyric acid, j: butyric acid, : valeric acid. (b) Total volatile fatty acids in raw (j) and acidified (h)cheese whey. (c) Lactose, lactic acid, acetic acid and total volatile fatty acid concentrations in the acidogenic reactor. (n): lactose, (j): total volatile fattyacids, (h ): lactic acid, (m): acetic acid. (d) COD concentrations in the feed and in the effluent of the acidogenic reactor. (h): Feed COD concentration,(j): Effluent COD concentration.
0
5
10
15
20
25
0 10 20 30 40 50
Time (d)
L o a d i n g r a t e ( g C O D / l . d )
0
10
20
30
40
50
60
70
80
90
0 10 20 30 40 50
C O D c o n c e n t r a t i o n ( g / l )
Time (d)
Fig. 4. (a) Organic loading rate introduced into the methanogenic reactor.(b) COD concentrations before and after methanogenesis. (h): raw whey,(j): effluent.
120
130
140
150
0 10 20 30 40 50
Time (min)
F l u x ( l / h . m
2 )
Fig. 5. Flux variation at TMP = 1.25, 1.75 and 2.25 bar. (h): TMP =
1.25 bar, (j): 1.75 bar, (m): 2.25 bar.
2106 A. Saddoud et al. / Bioresource Technology 98 (2007) 2102–2108

8/12/2019 Anaerobic Membrane Reactor With Phase Separation for Treatment the Whey
http://slidepdf.com/reader/full/anaerobic-membrane-reactor-with-phase-separation-for-treatment-the-whey 6/7
obtained after 20 min at a flux of 139.5 l/h m2. Increasingthe TMP to 2.25 bar caused a decline of the flux to136.5 l/h m2. The flux decline can be explained by mem-brane fouling caused by the formation and compactionof a cake layer on the membrane surface (Hassairi et al.,2001) or by partial breakdown of the cake layer and contin-
uous infiltration of the particulate matter inside the porousmembrane. To conclude, the results of the optimisation of the treated whey cross-flow microfiltration show that theoptimal TMP was 1.75 bar which resulted in a flux of 139.5 l/h m2 (Fig. 5).
The reactor performance during a period of 45 days con-tinuous operation is given in Fig. 6(a)–(d). The methani-sation phase coupled to the cross-flow microfiltrationimproved the organic content and the turbidity reductionof the effluent (14.5 NTU). The average COD removal inthe whole process was 98.5% throughout the whole exper-imental period (Fig. 6(a)). The BOD5 of the raw cheesewhey fed in the first step (acidogenic reactor) was between
5 and 35 g/l and less than 0.1 g/l after integrated methani-sation-microfiltration, so that the average BOD5 removalwas 99.2% for the last ten days of the experiment. Permeatequality indicated that the removal of suspended solids was100%. The data clearly indicated that anaerobic treatmentcoupled to cross-flow microfiltration of cheese whey wassuccessful, the quality of the permeate effluent beingacceptable for disposal via public drains. Indeed, in theTunisian wastewater standards the COD, BOD and SSconcentrations are 90, 30 and 90 mg/l, respectively (Tuni-sian Standard, 1989).
The calculated methane yield expressed as the volume of
methane produced per g of COD removed is presented in
Fig. 6(b). The average was 0.3 l CH4/g CODremoved.Fig. 6(c) shows that the biogas productivity increased withincreasing loading rate. In addition, combining the mem-brane system with the methanogenic reactor for the acidi-fied cheese whey treatment led to an improvement in thedaily biogas production, which exceeded 10 times the reac-
tor volume at HRT of 4 days. The biogas productionincreased steadily with the increase in organic loading rate.The methane content was more than 70%. This proportionof methane is considered indicative of good performance(Strohwald and Ross, 1992).
As can be seen in Fig. 6(d), during the first 25 dayswhere the biomass was recycled after decantation, the bio-mass concentration was constant at a value of 6.4 g VSS/l,corresponding to a SRT of 31.6 days. The combination of the methanogenic reactor with membrane microfiltrationallowed complete retention of the microorganisms withinthe system. This led to an increase of the VSS from 6.4to 10 g/l.
4. Conclusions
The study of two-stage anaerobic digestion of cheesewhey was undertaken. During the acidogenesis step, a max-imum acidification of 52.25% was achieved in the com-pletely mixed acidification reactor at an HRT of 24 h.COD removal was low. The AR did not produce methaneand achieved bioconversion only.
During the methanogenesis step, about 79% CODremoval was achieved. The optimisation of cross-flowmicrofiltration at a VCF = 1 gave a TMP and permeate
flux of about 1.75 bar and 139.5 l/h m2
, respectively.
0
10
20
30
40
50
60
70
80
0 10 20 30 40 50 C O D c o n c e n t r a t i o n
( g / l )
Time (d)
0
0.1
0.2
0.3
0.4
0 10 20 30 40 50
Time (d)
( l C H
4 / g C O D r e m o v e d
)
M e t h a n e Y i e l d
0
2
4
6
8
10
0 10 20 30 40 50
P r o d u c t i v i t y ( l / l . d )
Time (d)
0
2
4
6
8
10
12
0 10 20 30 40 50
II I
B i o m a s s c o n c e n t r a t i o n ( g / l )
Time (d)
Fig. 6. (a) COD concentrations in raw whey (n), in the effluent leaving the methanogenic reactor (j) and in the permeate leaving the membrane module(m). (b) Variation of the methane yield (l CH4/g CODremoved) during the methanisation of the acidified cheese whey. (c) Biogas productivity in themethanogenic reactor coupled to cross-flow microfiltration. (d) Variation of biomass concentration in the methanogenic reactor. (I) Biomass recycled after
decantation. (II) Biomass recycled after microfiltration (V = 5 m/s and TMP = 1.75 bar).
A. Saddoud et al. / Bioresource Technology 98 (2007) 2102–2108 2107

8/12/2019 Anaerobic Membrane Reactor With Phase Separation for Treatment the Whey
http://slidepdf.com/reader/full/anaerobic-membrane-reactor-with-phase-separation-for-treatment-the-whey 7/7