Embed Size (px)
Citation preview

ANALISIS PRODUKTIVITAS PEKERJA PADA PROYEK PEMBANGUNAN GEDUNG
DPRD KOTA SAMARINDA KALIMANTAN TIMUR
Patrisius Demon Lote Wayan
14.11.1001.7311.229
Program StudiTeknikSipilUniversitas 17 Agustus 1945Samarinda
Jl. Ir. H. JuandaGedung E Telp.(0541) 743390 Ext. 121 Samarinda
E-mail ;[email protected]
INTISARI
Produktivitas merupakan faktor mendasar yang mempengaruhi performasi kemampuan bersaing dalam
industri kontruksi.
Produktivitastenagakerjaakansangatberpengaruhjugaterhadapbesarnyakeuntunganataukerugiansuatupr
oyek.Dalam mengukur tingkat produktivitas tenaga kerja ada berbagai macam cara, salah satunya
dengan meneliti besarnya tingkat LUR ( Labour Utilitation Rate ) masing-masing pekerja, yaitu
meneliti sampai seberapa besar tingkat efektivitas para pekerja dala bekerja.
Penelitian ini dilakukan menggunakan metode uji validitas, uji realibilitas, uji normalitas, uji regresi
dan uji hipotesis.Dimana data diperoleh dengan mengumpulkan data primer dan data sekunder, yang
kemudian dianalisis menggunakan metode statistika parametris dengan bantuan program SPSS.
Berdasarkan hasil penelitian yang dilakukan, Analisis Produktivitas Pekerja Pada Proyek Gedung
Kantor DPRD kotasamarinda Kalimantan timurmasihbanyakkendala yang mempengaruhi
produktivitas pekerja pada proyek tersebut
.
Kata Kunci :LUR, Pengaruh Variabel Dominan, Produktivitas Pekerja.
PENDAHULUAN
Latar Belakang
Secara umum, produktivitas diartikan sebagai suatau
tingkatan efisiensi dalam memproduksi barang atau
jasa. Iman Soeharto (1995) Mendefinisikan
produktivitas sebagai suatu pendekatan interdisipliner
untuk menentukan tujuanyang efektif, pembuatan
rencana, aplikasi penggunaan cara yang produktif
untuk menggunakan sumber-sumber secara efisien,
dan tetap menjaga adanya kualitas yang tinggi.
Sumber daya manusia merupakan elemen yang paling
strategis dalam organisasi, harus diakui dan diterima
oleh manajemen. Sumber daya yang berpengaruh
dalam proyek terdiri dari man, materials, machine,
money dan method.Sumber Daya Manusia adalah
salah satu faktor yang sangat berpengaruh dalam
sebuah pekerjaan, termasuk dalam sebuah pekerjaan
konstruksi. Sebuah pekerjaan sekecil apapun apabila
tidak didukung dengan sumber daya manusia yang
bagus dalam hal kualitas dan produktivitas, tidak akan
memberikan hasil yang maksimal dan memuaskan
dalam sebuah proyek.
Rumusan Masalah
1. Berapakah tingkat produktivitas pekerja pada
pekerjaan proyek Pembangunan Gedung Kantor
DPRD Kota Samarinda ?
2. Indikator apa saja yang berpengaruh terhadah
variabel upah, waktu, motivasi, pengalaman,
kemampuan, kinerja ?
3. Faktor variabel apa yang paling dominan yang
berpengaruh terhadap produktivitas ?
Batasan Masalah
Batasanmasalah yaitu penelitian hanya untuk pekerja
pada pelaksanaan pembangunan Gedung Kantor
DPRD Kota Samarinda.
TINJAUAN PUSTAKA
Pengertian Produktivitas
Produktivitas diartikan sebagai hubungan
antara hasil nyata maupun fisikdengan masukan
sebenarnya. Peningkatan tingkat produktivitas
berelasi terhadap waktu yang dibutuhkan, khususnya
berasal dari pengurangan biaya yang di konsumsi
oleh pekerja bangunan.
Menurut Oglesby, 1989 yaitu pengamatan
produktivitas dilakukan dengan metode productivity
rating, dimana aktivitas pekerja diklasifikasikan
dalam 3 hal yaitu : Essential Contributory Work,
Effective Work (pekerjaan efektif), dan Not Useful (
pekerjaan tidak efektif).
Faktor utilitas pekerja (LUR) = waktu bekerja efektif
+ ¼waktu bekerja kontribusi x 100% \
pengamatan total
Pengamatantotal = waktu efektif + waktu kontribusi +
waktu tidak efektif
Pengujian Angket / Kuesioner :
1. Uji ValiditasMenurut Ghozali (2009) menyatakan
bahwa uji validitas digunakan untuk mengukur sah
atau valid tidaknya suatu kuesioner. Suatu kuesioner
dikatakan valid jika pertanyaan pada kuesioner
mampu untuk mengungkapkan sesuatu yang akan
diukur oleh kuesioner tersebut.
2. Uji ReliabilitasReabilitas menunjukkan pada satu
pengertian bahwa sesuatu instrumen cukup dapat
dipercaya untuk digunakan sebagai pengumpul data
karena instrumen tersebut sudah baik.
3. Uji Normalitas DataUji normalitas data dilakukan
untuk mengetahui apakah data sampel dalam
penelitian ini telah terdistribusi secara normal.
Analisis Regresi Linier Berganda
Analisis ini digunakan untuk mengetahui pengaruh
variabel upah, waktu,motivasi, , pengalaman,
kemampuan, dan kinerja terhadap produktivitas
tenaga kerja pada pekerjaan.
Dengan analisis ini kita bisa memprediksi perilaku
dari variabel dependent dengan menggunakan data
variabel terikat.
Variabel bebas (X)
X1 :Upah
X2 :Waktu
X3 :Motivasi
X4 :Pengalaman
X5 :Kemampuan
X6 :Kinerja
Variabel terikat (Y)
Produktivitas Pekerja
Uji Hipotesis
Uji hipotesis adalah metode pengambilan keputusan
yang didasarkan dari analisis data, baik dari
percobaan yang terkontrol, maupun dari observasi.
Pada umumnya hipotesis adalah jawaban sementara

terhadap pertanyaan-pertanyaan yang dikemukakan
dalam perumusan masalah.
METODOLOGI PENELITIAN
Lokasi Penelitian
Penelitian ini mengambil lokasi pada Proyek
pembangunan Gedung Kantor DPRD Kota Samarinda
di Jl. Basuki Rahmat, Kel. Pelabuhan, Kec.
Samarinda Kota,Kota Samarinda– Kalimantan Timur.
Teknik Pengumpulan Data
Untuk memperoleh data yang sesuai dengan masalah
ini, maka menggunakan tenik pengumpulan data
sebagai berikut:
1. Teknik Kepustakaan yaitu dengan
mendapatkan informasi dan data mengenai
teori-teori yang berkaitan dengan pokok
permasalahan yang diperoleh dari literatur-
literatur, bahan kuliah, majalah konstruksi,
media internet, dan media cetak lainnya.
2. Wawancara yaitu pengumpulan data dengan
tanya jawab sepihak kepada yang
bersangkutan yaitu tenaga kerja yang
berjumlah 30 orang.
3. Menyebarkan kuesioner dengan pihak
pekerja lapangan yang terkait dan terlibat
pada kegiatan proyek pembangunan gedung
kantor DPRD Kota Samarinda.
4. Observasi (pengamatan) dilakukan untuk
menghitung besarnya LUR (Labour
Utilization Rate) dengan mengamati nilai
effective work, essential work,dan ineffective
work
ANALISA DAN PEMBAHASAN
Sampel penelitian ini dilakukan pada karyawan PT.
Sarana Karya Membangun selaku Kontraktor
Pelaksana pada proyek pembangunan gedung kantor
DPRD Kota Samarinda sebanyak 30 orang yang
ditemui oleh penulis pada saat penelitian berlangsung.
Kuesioner yang diajukan oleh penulis yaitu ada 22
pertanyaan kepada para responden.
Pengumpulan data dilakukan dengan mengamati
setiap aktivitas pekerja sehingga diperoleh
databerdasarkan metode productivity rating.
Dengan metode ini diperoleh data yang terbagi
menjadi tiga jenis aktivitas yaitu waktu bekerja
(working), waktu kontribusi dan waktu tidak bekerja
(not working). Dari data-data tersebut akan diperoleh
besarnya prosentase LUR (labour utilitation rate)
yang menunjukan nilai produktivitas masing-masing
pekerja.
Contoh perhitungan faktor utilitas pekerja sebagai
berikut :
- Pengamatan total = Waktu bekerja efektif +
waktu bekerja kontribusi + waktu bekerja
tidak efektif.
- Pengamatan total tenaga kerja Heni hari ke-1
= 369 + 45 + 16 = 430 menit.
Faktor Utilitas Hendri hari ke-1 = (369+1/4x45) / 430
x 100% = 88.43%
Pengujian Instrumen Penelitian
Pengujian instrument dalam penelitian yang
menggunakan kuesioner diperlukan untuk
menentukan apakah alat pengukuran dapat digunakan
atau tidak dalam proses pengumpulan data. Dalam
pengujian ini dilakukan proses validitas dan
reliabilitas jawaban dari kuesioner. Dengan
dilakukannya proses pengujian data ini diharapkan
hasil hipotesis didapatkan dengan tepat sesuai dengan
yang diharapkan.
a. Uji Validitas
Rumus yang digunakan dalam uji
validitas adalah Product Moment dari Pearson. Dari
rumus tersebut, akan diperoleh angka korelasi (nilai r)
yang dapat dipakai untuk menjelaskan hubungan
antar variabel. Besarnya r dapat dihitung dengan taraf
kesalahan atau signifikasi 5% atau 1%. Apabila r
hitung > r tabel maka dapat disimpulkan data tersebut
valid dan dapat digunakan untuk mengukur apa yang
akan diukur
disimpulkan bahwa sebagian item
pertanyaan valid dan ada 1 pertanyaan yang tidak
valid yaitutentang kematangan bekerja
menggambarkan penguasaan seorang karyawan
terhadap suatu pekerjaan, pertanyaan tersebut
mempunyai tingkat pertanyaan yang paling rendah,
maka dari itu diambil indikator yang mempunyai
indikator tinggi sebanyak 22 indikator. Jika setiap
pertanyaan dibuang berarti ada indikator yang tidak
bisa terwakili dalam pertanyaan tersebut. Karena
indikator itu tidak bisa mencerminkan keadaan yang
ada dilapangan / objek penelitian dan itu biasa terjadi.
b. Uji Reliabilitas
Uji reliabilitas dilakukan untuk mengetahui
kestabilan dan kekonsistenan apabiladilakukan
pengukuran kembali dengan subjek yang sama.
Pengukuran reliabilitas dilakukan dengan
menggunakan Cronbach’s alpha (alpha cronbach).
Dari hasil pengujian dilakukan penganalisaan dengan
membandingkan terhadap R tabel yang dapat dicari
dengan menginterpolasi jumlah butir pertanyaan
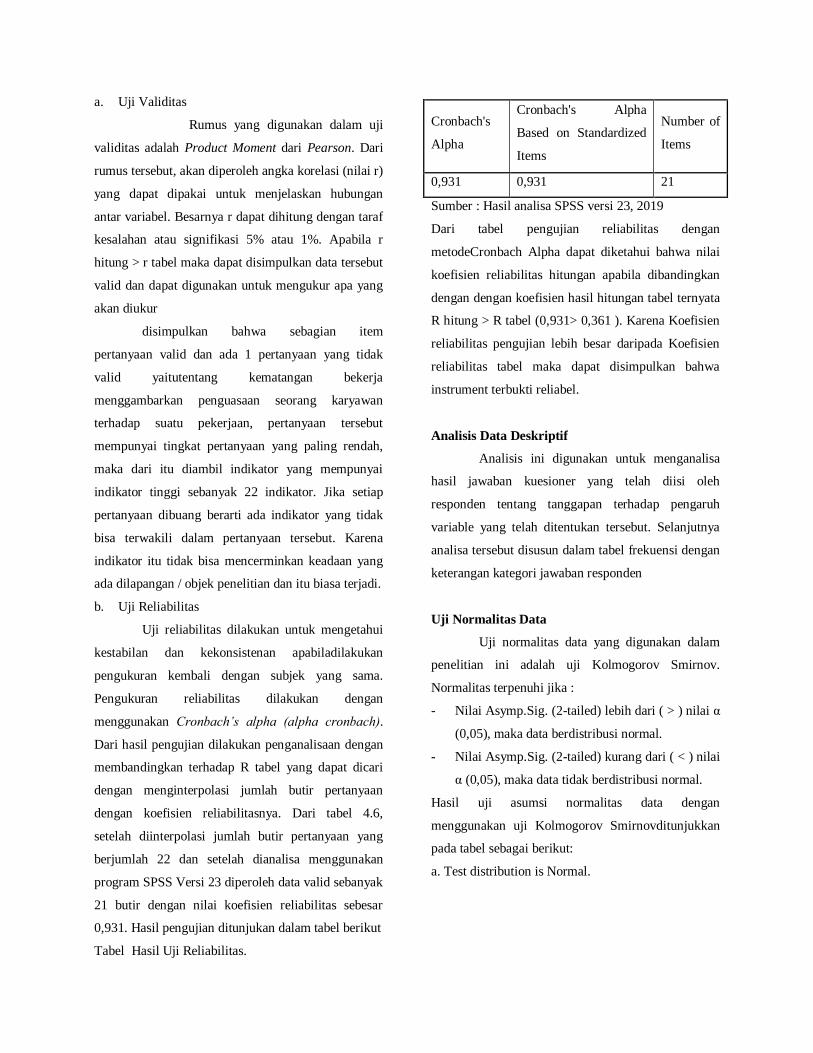
dengan koefisien reliabilitasnya. Dari tabel 4.6,
setelah diinterpolasi jumlah butir pertanyaan yang
berjumlah 22 dan setelah dianalisa menggunakan
program SPSS Versi 23 diperoleh data valid sebanyak
21 butir dengan nilai koefisien reliabilitas sebesar
0,931. Hasil pengujian ditunjukan dalam tabel berikut
Tabel Hasil Uji Reliabilitas.
Cronbach's
Alpha
Cronbach's Alpha
Based on Standardized
Items
Number of
Items
0,931 0,931 21
Sumber : Hasil analisa SPSS versi 23, 2019
Dari tabel pengujian reliabilitas dengan
metodeCronbach Alpha dapat diketahui bahwa nilai
koefisien reliabilitas hitungan apabila dibandingkan
dengan dengan koefisien hasil hitungan tabel ternyata
R hitung > R tabel (0,931> 0,361 ). Karena Koefisien
reliabilitas pengujian lebih besar daripada Koefisien
reliabilitas tabel maka dapat disimpulkan bahwa
instrument terbukti reliabel.
Analisis Data Deskriptif
Analisis ini digunakan untuk menganalisa
hasil jawaban kuesioner yang telah diisi oleh
responden tentang tanggapan terhadap pengaruh
variable yang telah ditentukan tersebut. Selanjutnya
analisa tersebut disusun dalam tabel frekuensi dengan
keterangan kategori jawaban responden
Uji Normalitas Data
Uji normalitas data yang digunakan dalam
penelitian ini adalah uji Kolmogorov Smirnov.
Normalitas terpenuhi jika :
- Nilai Asymp.Sig. (2-tailed) lebih dari ( > ) nilai α
(0,05), maka data berdistribusi normal.
- Nilai Asymp.Sig. (2-tailed) kurang dari ( < ) nilai
α (0,05), maka data tidak berdistribusi normal.
Hasil uji asumsi normalitas data dengan
menggunakan uji Kolmogorov Smirnovditunjukkan
pada tabel sebagai berikut:
a. Test distribution is Normal.

Dari tabel diatas dapat diketahui hasil uji normalitas
diketahui nilai signifikansi 0,122 > 0,05, maka dapat
disimpulkan bahwa data tersebut berdistribusi normal,
karena nilai probabilitas = 0,05.
Analisis Regresi Linier Berganda
Analisis ini digunakan untuk mengetahui
pengaruh variabel upah,waktu, motivasi, pengalaman,
kemampuan, dan kinerja terhadap produktivitas
tenaga kerja pada pekerjaan
Model persamaanregresi (Unstandardized
coefficients) menunjukkan koefesien B yaitunilai
yang menjelaskanbahwa Y (variabelterikat).
Dari perhitungan tabel tentang analisis regresi linier
berganda dapat disusun fungsi persamaan linier
berganda sebagai berikut :
Y = B0+ B1X1 + B2X2 + B3X3 + B4X4+ B5X5 +
B6X6
Y = 80.172 + 0,180 + 0,239 – 0,186 – 0,490 + 0,554
– 0,198
Hasil dari persamaan regresi linier berganda diatas
dapat dilihat sebagai berikut :
1. Konstanta (a)
Dari hasil perhitungan spss, maka diperoleh nilai
konstanta sebesar + 80,172
2. Pengaruh Upah (X1) terhadap beta (Y)
Untuk koefisien regresi pengaruh upah atau x1
terhadap produktivitas pekerja sebesar +0,180
3. Pengaruh Waktu (X2) terhadap beta (Y)
Untuk koefisien regresi pengaruh waktu atau x2
terhadap produktivitas pekerja sebesar +0,239
4. Pengaruh Motivasi (X3) terhadap beta (Y)
Untuk koefisien regresi pengaruh motivasi atau x3
terhadap produktivitas pekerja sebesar -0,186
5. Pengaruh Pengalaman (X4) terhadap beta (Y)
Untuk koefisien regresi pengaruh pengalaman atau x4
terhadap produktivitas pekerja sebesar -0,490.
6. Pengaruh Kemampuan (X5) terhadap beta (Y)
Untuk koefisien regresi pengaruh kemampuan atau x5
terhadap produktivitas pekerja sebesar +0,554
7. Pengaruh Kinerja (X6) terhadap beta (Y)
Untuk koefisien regresi pengaruh kinerja atau x6
terhadap produktivitas pekerja sebesar -0,196
Pengaruh Faktor Variabel
Uji Hipotesis
Pengujian hipotesis ini bertujuan untuk
melihat bagaimana pengaruh variabel independen
terhadap variabel dependen. Pengujian hipotesis ini
terdiri atas uji hipotesis secara parsial (Uji T) dan uji
hipotesis secara simultan (Uji F). Adapun hasil dari
pengujian tersebut juga akan dijelaskan.
a. Uji F
Yaitu uji hipotesis pengaruh variabel bebas secara
simultan atau bersama-samaterhadap variabel terikat.
1) Hipotesis Operasional :
HO : Variabel bebas secara simultan tidak
memiliki pengaruh yang signifikan terhadap
variabel terikat.
HI : Variabel bebas secara simultan memiliki
pengaruh yang signifikanterhadap variabel terikat.
2) Perhitungan F tabel :
Tingkat signifikasi (α) = 0,05
F tabel =( k ; (n-k) )

Dengan jumlah variabel (k) = 6 dan jumlah
sample (n) = 30, maka :
F tabel =(k ; (n-k))
F tabel =(6 ; (30-6))
F tabel =( 6 ; 24)
3) Dasar pengambilan keputusan :
-Berdasarkan tabel F , Jika :
F hitung < F tabel ( 2,51), maka HO diterima
F hitung > F tabel ( 2,51), maka HO ditolak
- Berdasarkan nilai probabilitas, Jika :
Sig > 0,05 maka HO diterima
Sig < 0,05 maka HO ditolak
Jika F hitung > F tabel dengan signifikasi 5%
maka HO ditolak, berarti variabel upah, waktu,
motivasi, pengalaman, kemampuan, dan kinerja,
secara bersama-sama berpengaruh terhadap
produktivitas tenaga kerja.
Sedangkan jika Sig F < 0,05 maka dapat
disimpulkan bahwa variabel upah, waktu, motivasi,
pengalaman, kemampuan, dan kinerja secara
bersama- sama berpengaruh signifikan terhadap
produktivitas tenaga kerja, maka HI diterima.
2) Kesimpulan
Dari tabel 4.13 dapat diketahui nilai F hitung
= 0,552 dan nilai Sig F = 0,464 sedangkan nilai F
tabel = 2,51 dan αyang ditetapkan adalah 0,05 ,
karena nilai F = 0,552 < 2,51 dan nilai sig 0,464 >
0,05 maka dari hasil tersebut dapat disimpulkan
bahwa HO diterima dan HI ditolak. Artinya
bahwavariabel bebas seperti upah, waktu, motivasi,
pengalaman, kemampuan,dan kinerja tidak memiliki
pengaruh secara simultan terhadap produktivitas
tenaga kerja.
b. Uji T
Yaitu uji hipotesis pengaruh variabel bebas secara
parsial atau sendiri-sendiri terhadap variabel terikat.
1) Hipotesis Operasional :
HO : Variabel bebas secara parsial tidak
memiliki pengaruh yangsignifikan terhadap
variabel terikat.
HI :Variabel bebas secara parsial memiliki
pengaruh yang signifikanterhadap variabel terikat.
2) Perhitungan T tabel :
Tingkat signifikasi (α) = 0,05
T tabel = T (α /2 ; ( n-k-1) )
Dengan jumlah variabel (k) = 8 dan jumlah data
(n) = 30, maka :
T tabel = T (α/2 ; 30-6-1)
T tabel = T (0,025 ; 23)
T tabel = 2,069
3) Dasar pengambilan keputusan :
- Berdasarkan tabel T , Jika :
T hitung < T tabel ( 2,069), maka HO diterima
T hitung > T tabel ( 2,069), maka HO ditolak
- Berdasarkan nilai probabilitas, Jika :
Sig > 0,05 maka HO diterima
Sig < 0,05 maka HO ditolak
Jika Sig.t > 0,05 maka dapat disimpulkan
bahwa variabel upah, waktu, motivasi, pengalaman,
kemampuan, kinerja secara parsial berpengaruh
positif dan tidak signifikan terhadap produktivitas
tenaga kerja, maka Ha tidak diterima atau ditolak.
Dan apabila Sig.t< 0,05 maka dapat sisimpulkan
bahwa variabel umur, waktu, motivasi, pengalaman,
kemampuan, pengalaman, kinerja secara parsial
berpengaruh positif dan signifikan terhadap
produktivitas tenaga kerja, maka Ha diterima

Pembahasan Hasil Penelitian
Besarnya tingkat produktivitas diperoleh dari
hasil pengumpulan data tentang tingkat LUR (labour
utilization rate) masing-masing pekerja. Dari hasil
pengolahan data tentang tingkat produktivitas (LUR)
masing masing pekerja, dapat diketahui besarnya
tingkat produktivitas rata-rata LUR adalah 85,53%>
50%. Hal ini menunjukan bahwa tingkat produktivitas
pekerja pada proyek pembangunan Gedung Kantor
DPRD Kota Samarinda cukup memuaskan. Dari hasil
pengolahan data tingkat produktivitas pekerja dapat
diketahui pula bahwa pekerja yang memiliki rata-rata
tingkat produktivitas terbesar adalah Samsul Hadi
sebesar 89,71 %. Besarnya tingkat produktivitas
pekerja dipengaruhi oleh adanya variabel-variabel
bebas. Untuk mengetahui pengaruh dari variabel-
variabel bebas tersebut telah dilakukan pengolahan
data dengan program SPSS versi 23 kuesioner yang
telah diisi oleh pekerja.
Dari hasil pengolahan data dapat diketahui
jawaban-jawaban hasil kuesioner telah melalui uji
validitas dan reliabilitas. Hasil dari pengujian
menunjukan bahwa jawaban hasil kuesioner telah
valid dan reliabel, oleh karena itu data layak untuk
dilakukan pengujian hipotesis.
Dari pengujian hipotesis yang telah
dilakukan terhadap data yang ada, dapat diketahui
bahwa dari tabel 4.16 hasil uji F diperoleh nilai sig.f
= 0,464 > 0,05. Dari nilai tersebut dapat disimpulkan
variabel bebas secara simultan mempunyai pengaruh /
hubungan yang signifikan terhadap variabel terikat
yaitu produktivitas pekerja. Dari hasil uji t diperoleh
hasil hipotesis pengaruh dari masing-masing variabel
(secara parsial) terhadap tingkat produktivitas
pekerja. Hasil diketahui dengan membandingkan
besarnya nilai t dan sig.t hitung dengan nilai tabel.
a. Variabel (X1) Upah
Diperoleh sig.t = 0,207 > 0,05 dan t = 1,298 <
2,069, artinya variabel secara parsial tidak
memiliki pengaruh yang signifikan terhadap
variabel terikat produktivitas pekerja.
b. Variabel (X2) Waktu
Diperoleh sig.t = 0,721 > 0,05 dan t = 0,362 <
2,069 , artinya variabel secara parsial tidak
memiliki pengaruh yang signifikan terhadap
variabel terikat produktivitas pekerja.
c. Variabel (X3) Motivasi
Diperoleh sig.t = 0,468 > 0,05 dan t = -0,737 <
2,069, artinya variabel secara parsialtidak
memiliki pengaruh yang signifikan terhadap
variabel terikat produktivitas pekerja.
d. Variabel (X4) Pengalaman
Diperoleh sig.t = 0,077 > 0,05 dan t = -1,853 <
2,069 , artinya variabel secara parsialtidak
memiliki pengaruh yang signifikan terhadap
variabel terikat produktivitas pekerja.
e. Variabel (X5) Kemampuan
Diperoleh sig.t = 0,616 > 0,05 dan t = -0,508 <
2,069, artinya variabel secara parsial tidak
memiliki pengaruh yang signifikan terhadap
variabel terikat produktivitas pekerja.
f. Variabel (X6) Kinerja
Diperoleh sig.t = 0,067 > 0,05 dan t =1,925 <
2,069artinya variabel secara parsial tidak
memiliki pengaruh yang signifikan terhadap
variabel terikat produktivitas pekerja.

Dari hasil uji dominasi, dengan
membandingkan nilai koefisien beta masing-masing
variabel dapat diketahui variabel kinerja memiliki
nilai koefisien beta terbesar yaitu 0,550. Dengan nilai
koefisisen beta terbesar yaitu 0,550 dapat
disimpulkan bahwa variabel kinerja memiliki
pengaruh yang paling dominan terhadap tingkat
produktivitas pekerja pada proyek pembangunan
Gedung Kantor DPRD Kota Samarinda.
Kinerja itu sendiri mempunyai peranan yang
sangat penting dalam produktivitas tenaga kerja
karyawan, karenadapat memberikan bekal
pengetahuan dan kemampuan bagi seseorang untuk
memasuki dunia kerja dan pendidikan luar sekolah
memberikan tambahan pengetahuan dan keterampilan
yang sangat menunjang pendidikan seseorang.
Variabel kinerja mempunyai pengaruh yang positif
terhadapvariabel produktivitas kerja. Hal ini berarti
bahwa setiap kenaikan indeks pada tingkat
pendidikan akan diikuti pula oleh kenaikan indeks
tingkatproduktivitas secara signifikan. Sebaliknya
jika terjadi penurunan pada variabel kinerja maka
variabel produktivitas kerja juga akan menurun.
PENUTUP
Kesimpulan
Dari hasil analisis yang telah dilakukan, maka penulis
dapat mengambil kesimpulan sebagai berikut :
1. Besarnya tingkat produktivitas pekerja pada
proyek pembangunan Gedung Kantor DPRD
Kota Samarinda cukup memuaskan karena
rata-rata produktivitasnya sebesar 85,53 % >
50 % Hal ini sesuai dengan pustaka (Oglesby,
1989 : 180 - 181) yang berisi “Untuk sebuah
tim kerja dikatakan mencapai waktu efektif
atau memuaskan bila faktor utilitas
pekerjanya lebih dari 50 %”.
2. Variabel- variabel bebas yang telah
ditentukan secara simultan yaitu upah, waktu,
motivasi, pengalaman, kemampuan.
mempunyai pengaruh yang signifikan
terhadap besarnya produktivitas pekerja.
Secara parsial atau sendiri-sendiri variabel
yang mempunyai pengaruh yang signifikan
terhadap besarnya tingkat produktivitas
pekerja adalah variabel kinerja dengan
koefisien beta 0,550 . Dengan nilai koefisien
beta terbesar yaitu 0,550 dapat disimpulkan
bahwa variabel tingkat pendidikan memiliki
pengaruh yang paling dominan terhadap
tingkat produktivitas pekerja pada proyek
pembangunan Gedung Kantor DPRD Kota
Samarinda. Tingkat pendidikan itu sendiri
mempunyai peranan yang sangat penting
dalam produktivitas pekerja karyawan di
proyek pembangunan tersebut, karena dapat
memberikan bekal pengetahuan dan
kemampuan bagi seseorang untuk memasuki
dunia kerja dan pendidikan luar sekolah
memberikan tambahan pengetahuan dan
keterampilan yang sangat menunjang
pendidikan seseorang.
3. Variabel yang mempunyai pengaruh paling
dominan terhadap tingkat produktivitas tenaga
kerja yaitu variabel kinerja, upah, waktu.
karena nilai koefisien betanya yaitu 0,550. Hal
ini berarti bahwa variabel kinerja secara
parsial memiliki pengaruh yang sangat
dominan terhadap produktivitas tenaga kerja
dibandingkan dengan variabel yang lainnya.
Saran
Dari penilitian yang telah dilakukan, maka penulis
dapat menyimpulkan saran sebagai berikut :
1. Dalam membuat kuesioner, sebaiknya
pertanyaan dibuat sesederhana mungkin tanpa
mengaburkan maksud pertanyaan tersebut
agar pertanyaan mudah dipahami oleh

responden.
2. Pihak manajemen selain memperhatikan
faktor pendidikan formal, juga perlu
memperhatikan faktor pendidikan nonformal
dari karyawannya, karena pengetahuan
karyawan dapat mendukung produktivitas
kerjanya.
3. Sebaiknya peneliti memastikan terlebih
dahuluapakahpekerjaan pada proyek
yangakan diteliti dikerjakan 30 orang, agar
syarat distribusi normal dapat terpenuhi.
4. Dalam melakukan pengamatan data LUR
pekerja, sebaiknya satu pengamat mengawasi
lebih dari 2 orang pada wilayah yang sama
(tidak terpisah).
5. Pihak manajemen sebaiknya memberlakukan
peraturan dan sanksi-sanksi kepada karyawan
yang melakukan pelanggaran peraturan tanpa
kecuali, agar tingkat efisiensi penggunaan
waktu kerja dapat meningkat yang pada
akhirnya dapat meningkatkan produktivitas
kerja.

LABOR PRODUCTIVITY ANALYSIS IN BUILDING CONSTRUCTION PROJECT CITY DPRD
Samarinda, East Kalimantan
Patrick Demon Lote Wayan
14.11.1001.7311.229
StudiTeknikSipilUniversitas Program August 17 1945Samarinda
Jl. Ir. H. JuandaGedung E Tel. (0541) 743390 Ext. 121 Samarinda
E-mail;[email protected]
ABSTRACT
Productivity is a fundamental factor affecting performasi competitive capability in the construction industry. Labor
productivity would also affect the amount of the gain or loss of a proyek. In measure the level of labor productivity
there are a variety of ways, one of them by examining the level of LUR (Utilitation Labor Rate) of each worker,
which is examined to the extent of effectiveness dala workers work.
This research was conducted using the method of validity, reliability, normality test, regression and hipotesis.Where
data is obtained by collecting primary data and secondary data, which is then analyzed using parametric statistical
methods with SPSS. Based on the results of research conducted, Labor Productivity Analysis In Parliament Office
Building Project samarinda city east Kalimantan are still many obstacles that affect the productivity of workers on
the project
,
Keywords : LUR, Variable Dominant Influence, Productivity Workers.
PRELIMINARY
Background
In general, productivity is defined as a level of
efficiency in producing goods or services. Faith
Suharto (1995) Defining productivity as an
interdisciplinary approach to determine the effective
tujuan yang, making a plan, application usage
productive way to use resources efficiently, while
maintaining their high quality. Human resource is the
most strategic element in the organization, must be
recognized and accepted by the management.
Resources are influential in the project consists
ofman, materials, machines, money and
method.Human Resources is one of the factors that
influence in a job, included in a construction work. A
job slightest if not supported by a good human
resources in terms of quality and productivity, will
deliver maximum results and satisfactory in a project.
Formulation of the problem
1. What is the level of labor productivity in project
work Building Samarinda City Council Office?
2. What indicators terhadah variables affect wages,
time, motivation, experience, ability, performance?
3. What factors most dominant variables that affect
productivity?

Scope of problem
Limitation of the problem is research only for
workers in the implementation of the construction of
Samarinda City DPRD Office.
Building.LITERATURE REVIEW
understanding Productivity
Productivity defined as the relationship
between the real and actual input fisikdengan.
Increased levels of productivity related to the time
required, especially coming from cost reductions in
consumption by the construction workers.
According to Oglesby, 1989 ie productivity
observations made by the method of productivity
rating, where the activities of workers classified in
three areas: Contributory Essential Work, Effective
Work (work effectively), and Not Useful (not work
effectively).
Factors utility worker (LUR) = time to work
effectively + ¼waktu work contributions x 100% \
total observation
Total observation = effective time + time + time no
effective contribution
Testing Questionnaire / Questionnaire:
1. Test ValiditasMenurut Ghozali (2009) states that
the validity of the test is used to measure whether a
legitimate or valid questionnaires. A questionnaire
considered valid if the questions in the questionnaire
were able to reveal something that will be measured
by the questionnaire.
2. TestReabilitas show on the understanding that
something instruments trustworthy enough to be used
as data collectors because the instrument is good.
3.Test Data normality Normality Test is performed to
determine whether the sample data in this study are
normally distributed.
Multiple Linear Regression Analysis
This analysis is used to determine the effect of
variable wages, time, motivation, experience, ability,
and performance on labor productivity on the job.
With this analysis we can predict the behavior of the
dependent variable using data dependent variable.
The independent variable (X)
X1 :Wage
X2 :Time
X3 :Motivation
X4 :Experience
X5 :Ability
X6 :performance
The dependent variable (Y)
Worker productivity
Hypothesis testing
Hypothesis test is a method of making decisions
based on the analysis of the data, either from
controlled trials, as well as from observation. In
general, the hypothesis is a temporary answer to the
questions raised in the formulation of the problem.
RESEARCH METHODOLOGY

Research sites
This study took place at the construction project
Samarinda City Council Office Building on Jl. Basuki
Rahmat, Ex. Ports, district. Kota Samarinda, East
Kalimantan Samarinda- City.
Data collection technique
To obtain data in accordance with this problem, then
use tenik data collection as follows:
5. Mechanical Library is to obtain information
and data about the theories relating to the
subject matter derived from the literature,
lecture materials, construction magazines,
internet media, and other print media.
6. Interviews of data collection with a question
and answer to the person concerned, namely
unilateral workforce numbered 30 people.
7. Distributing questionnaires to the mobile
worker concerned and involved in the
activities of the office building development
project Samarinda City Council.
8. Observation (observation) is performed to
calculate the amount of LUR (Labor
Utilization Rate) by observing the value of
effective work, essential work, and
ineffective work
ANALYSIS AND DISCUSSION
The research sample was conducted at PT. Sarana
Karya Building Contractor on the project as the
construction of office buildings Samarinda City
Council counted 30 people encountered by the
authors at the time of the study.
The questionnaire submitted by the author that there
are 22 questions to the respondents.
Data collection was conducted by observing every
activity worker productivity method that earned data
based on rating.
With this method the obtained data is divided into
three types of activity that is the time to work
(working), while the contribution and non-working
time (not working). From these data will be obtained
by the magnitude of the percentage of LUR
(utilitation labor rate) which shows the value of the
productivity of each worker.
Example calculation of utility workers following
factors:
- Observation total = effective working time +
time + time work contribution working
ineffectively.
- Observation of the total workforce of Heni
day-1 = 369 + 45 + 16 = 430 minutes.
Utilities factor Hendri day 1 = (369 + 1 / 4x45) / 430
x 100% = 88.43%
Testing Instrument Research
Testing instrument in a study using a
questionnaire needed to determine whether the
measurement tool can be used or not in the data
collection process. In this test the validity and
reliability of the process carried out answers from the
questionnaire. By doing the testing process this data
expected results obtained with proper hypothesis as
expected.
a. Validity test
The formula used is a validity test
of Pearson Product Moment. From this formula, will
be obtained figures correlation (r) that can be used to
describe the relationship between variables. The
amount r can be calculated with an error or

significance level of 5% or 1%. If r count> r table it
can be concluded the data is valid and can be used to
gauge what will be measured
concluded that some items valid question
and there is one question that is not valid yaitutentang
maturity works illustrate mastery of an employee to a
job, the question has the lowest level of the question,
and therefore taken indicators that have high
indicators by 22 indicators. If any question thrown
away means there are indicators that can not be
represented in the question. Because of the indicator
can not reflect the existing situation in the field /
object of research, and it usually happens.
b. test Reliability
Reliability tests performed to determine the
stability and consistency of measurement if done back
to the same subject. Reliability measurement is done
by using Cronbach's alpha (Cronbach alpha). From
the results of tests carried out by comparing the
analysis of the R tables that can be searched by
interpolating the number of the questions the
reliability coefficient. From table 4.6, after the
interpolated number of the questions which amounted
to 22 and having analyzed using SPSS version 23
obtained a valid data as many as 21 items with a
value of reliability coefficient of 0.931. The test
results shown in the following table
Reliability Test Results Table.
Cronbach's
Alpha
Cronbach's Alpha
Based on Standardized
Items
Number of
Items
0.931 0.931 21
Source: Results of analysis of SPSS version 23, 2019
From table metodeCronbach reliability testing with
Alpha can be seen that the value of the coefficient of
reliability count when compared with the result of a
calculation coefficient table turns R arithmetic> R
table (0.931> 0.361). Because the test reliability
coefficient greater than the coefficient of reliability of
the table it can be concluded that the instrument
proved to be reliable.
Descriptive Data Analysis
This analysis is used to analyze the results of
the answers to questionnaires filled out by
respondents about the response to the effects of the
variables that have been determined. Furthermore, the
analysis is arranged in a frequency table with a
description of the category of respondents
Normality Test Data
Normality test data used in this study is the
Kolmogorov-Smirnov test. Normality is met if:
- Asymp.Sig value. (2-tailed) more than (>) valueα
(0.05), the normal distribution of data.
- Asymp.Sig value. (2-tailed) less than (<) valueα
(0.05), then the data is not normal.
The results of the normality assumption test data
using the Kolmogorov Smirnovshowed on the table
as follows:
a. Test distribution is Normal.

From the above table it can be seen normality test
results known to the significant value of 0.122> 0.05,
it can be concluded that the data are normally
distributed, because the probability value = 0.05.
Multiple Linear Regression Analysis
This analysis is used to determine the effect
of variable wages, time, motivation, experience,
ability, and performance on labor productivity at
work
Regression model (unstandardized
coefficients) shows the coefficient B that is value who
explain that Y (dependent variable )
From the calculation table on linear regression
analysis can be composed of multiple linear equations
functions as follows:
Y = B0 + b1x1 + B2X2 + B3X3 + B4X4 + B5X5 +
B6X6
Y =80 172 + 0.180 + 0.239 - 0.186 to 0.490 + 0.554
to 0.198
The results of multiple linear regression equation
above can be seen as follows:
1. Constant (a)
From the calculation of SPSS, then obtained a
constant value of + 80.172
2. Effect Wage (X1) to beta (Y)
For the regression coefficient of wages or x1
influence on the productivity of workers by +0.180
3. Effect of Time (X2) to beta (Y)
For the regression coefficient time or x2 influence on
worker productivity by +0.239
4. Effect of Motivation (X3) against beta (Y)
For the regression coefficient or x3 motivational
influence on the productivity of workers by -0.186
5. Effect of Experience (X4) against beta (Y)
For the regression coefficient or x4 influence on the
productivity experience of workers at -0.490.
6. Effect Capability (X5) against beta (Y)
For the regression coefficient or x5 ability to
influence worker productivity by +0.554
7. Effect of Performance (X6) against beta (Y)
For the regression coefficient of performance or x6
influence on the productivity of workers by -0.196
Effect of Variable Factors
Hypothesis testing
Testing this hypothesis is to see how the
influence of the independent variable on the
dependent variable. Testing this hypothesis consists
of partial hypothesis test (Test T) and simultaneous
hypothesis test (Test F). The results of these tests will
also be explained.
a. test F

That hypothesis testing independent variables
simultaneously or collectively same towards
dependent variable.
1) Operational Hypothesis:
HO : The independent variables simultaneously
does not have significant effect on the dependent
variable.
HI : The independent variables simultaneously
influence signifikanterhadap dependent variable.
2) The calculation of F table:
The level of significance (α) = 0.05
F table = (k; (nk))
With the number of variables (k) = 6 and the
number of samples (n) = 30, then:
F table = (k; (nk))
F table = (6; (30-6))
F table = (6; 24)
3) The basis for decision-making:
-Based on the table F, if:
F arithmetic <F table (2.51), then the HO is
accepted
F count> F table (2.51), then HO rejected
- Based on the probability value, if:
Sig> 0.05 and then HO accepted
Sig <0.05 and then HO rejected
If F count> F table with 5% significance then
HO rejected, it means that the variable salary, time,
motivation, experience, ability, and performance,
together affect the productivity of labor.
Whereas if Sig F <0.05, it can be concluded
that the variable salary, time, motivation, experience,
ability, and performance jointly have a significant
effect on labor productivity, the HI accepted.
3) Conclusion
4:13 From the table it can be seen the value
of F arithmetic = 0.552 and the value of Sig F =
0.464, while the value of F table = 2.51 andαis set at
0.05, because the value of F = 0.552 <2.51 and 0.464
sig value> 0.05 then the results can be concluded that
HO HI accepted and rejected. This means that free
bahwavariabel such as wages, time, motivation,
experience, ability, and performance does not have a
simultaneous effect on labor productivity.
b. test T
That hypothesis testing independent variables
partially or individually on the dependent variable.
1) Operational Hypothesis:
HO : The independent variable partial significant
has no effect on the dependent variable.
HI : Partially independent variables influence
the dependent variable significant to.
2) The calculation of the T table:

The level of significance (α) = 0.05
T table = T (α/ 2; (Nk-1))
With the number of variables (k) = 8 and the
number of data (n) = 30, then:
T table = T (α/ 2; 30-6-1)
T table = T (0,025; 23)
T table = 2.069
3) The basis for decision-making:
- According to the table T, if:
T arithmetic <T table (2.069), then the HO is
accepted
T arithmetic> T table (2.069), then HO
rejected
- Based on the probability value, if:
Sig> 0.05 and then HO accepted
Sig <0.05 and then HO rejected
If Sig.t> 0.05, it can be concluded that the
variable salary, time, motivation, experience, ability,
partial performance and no significant positive effect
on labor productivity, then Ha is not accepted or
rejected.
And if Sig.t <0.05 then can sisimpulkan that age,
time, motivation, experience, ability, experience,
performance is partially positive and significant
impact on labor productivity, so Ha is received
Discussion of Results
The level of productivity obtained from the
collection of data on the level of LUR (labor
utilization rate) of each worker. From the data
processing on the level of productivity (LUR) each
worker, can know the magnitude of the average level
of productivity of LUR was 85.53%> 50%. This
shows that the productivity levels of workers on
development projects Samarinda City Council Office
Building was satisfactory. From the data processing
rate of labor productivity can be noted that workers
who have an average level of productivity is Samsul
Hadi largest of 89.71%. The level of labor
productivity is influenced by the independent
variables.
From the results of data processing can
know the results of the questionnaire responses has
been through validity and reliability. The results of
the test show that the answers to the questionnaire
was valid and reliable, therefore the data feasible
hypothesis testing.
Of hypothesis testing has been conducted on
the data available, it is known that on the table 4:16 F
test results obtained sig.f value = 0.464> 0.05. The
value can be inferred from the independent variables
simultaneously have influence / significant
relationship to the dependent variable is labor
productivity. From the results of the t test result
hypothetical influence of each variable (partially) on

the level of labor productivity. Results determined by
comparing the value of t and sig.t count with the
value of the table.
a. Variable (X1) Wages
Retrieved sig.t = 0.207> 0.05 and t = 1.298
<2.069, meaning that the variable partial does
not have a significant effect on the dependent
variable worker productivity.
b. Variable (X2) Time
Retrieved sig.t = 0.721> 0.05 and t = 0.362
<2.069, meaning that the variable partial does
not have a significant effect on the dependent
variable worker productivity.
c. Variable (X3) Motivation
Retrieved sig.t = 0.468> 0.05 and t = -0.737
<2.069, meaning that the variable is
parsialtidak have a significant effect on the
dependent variable worker productivity.
d. Variable (X4) Experience
Retrieved sig.t = 0.077> 0.05 and t = -1.853
<2.069, meaning that the variable is
parsialtidak have a significant effect on the
dependent variable worker productivity.
e. Variable (X5) Capability
Retrieved sig.t = 0.616> 0.05 and t = -0.508
<2.069, meaning that the variable partial does
not have a significant effect on the dependent
variable worker productivity.
f. Variable (X6) Performance
Retrieved sig.t = 0.067> 0.05 and t = 1,925
<2,069that means partial variable did not have
a significant effect on the dependent variable
worker productivity.
From the results of the dominance test, by
comparing the value of the beta coefficient of each
variable can be known to have a performance variable
The beta coefficient is 0.550. With the value of the
largest beta koefisisen which 0,550 can be concluded
that the performance variable has the most dominant
influence on the level of productivity of workers on
development projects Samarinda City Council Office
Building.
The performance itself has a very important
role in labor productivity of employees, as this may
give the knowledge and the ability for a person to
enter the world of work and out of school education
providing additional knowledge and skills that is
supporting education.
Performance variables have positive influence
terhadapvariabel productivity. This means that any
increase in the index at the level of education will be
followed by a significant increase in the index
tingkatproduktivitas. Conversely, if there is a
decrease in the variable performance of the variable
labor productivity will also decrease.
COVER
Conclusion
From the analysis that has been done, the writer can
draw conclusions as follows:
3. The level of productivity of workers on
development projectsParliament Office
Building Samarinda city quite satisfactory
because the average productivity of 85.53%>
50% This is consistent with the literature
(Oglesby, 1989: 180-181) containing "For a
work team is said to achieve an effective or
satisfactory time when workers utility factor
of more than 50%".
4. Free variables which have been determined
simultaneously, namely wages, time,
motivation, experience, capability. have a
significant impact on the amount of worker
productivity. inpartial or individually variable
having a significant impact on the level of
labor productivity is variable beta coefficient
of performance with 0,550.With the largest
beta coefficient is 0,550 can be concluded
that the variable level of education had the
most dominant influence on the level of
productivity of workers on development
projectsParliament Office Building
Samarinda. The level of education itself has a
very important role in the productivity of
employees working on the construction
project, because it can provide knowledge
and ability for a person to enter the world of
work and out of school education providing
additional knowledge and skills that is
supporting education.
3. The variable that has the most dominant
influence on the level of labor productivity is
the variable performance, wages, time.
because the value of beta coefficient is 0.550.
This means that the partial performance
variables have a very dominant influence on
labor productivity compared to other variables.
Suggestion
From penilitian that has been done, the writer can
conclude the following suggestions:
6. In a questionnaire, the question should be
made as simple as possible without blurring
purpose of these questions so that questions
easily understood by respondents.
7. The management consider factors other than
formal education, also need to take into
account the non-formal education of their
employees, because employees can support
knowledge work productivity.
8. Researchers should ascertain in advance
whether the work on the project that will be
examined is done 30, so a normal distribution
requirement can be met.
9. In observing the data LUR workers,
preferably one observer oversees more than
two people in the same area (not separated).
10. The management should impose rules and
sanctions to employees who violate the rules
without exception, so that the level of
efficiency in the use of working time can be
increased, which in turn can increase work
productivity.