Embed Size (px)
Citation preview
CAIT-UTC-020
Analyses of Interactions between the Marine Terminal and
Highway Operations
FINAL REPORT April 2014
Submitted by:
Birnur Ozbas, Ph.D.*
Research Associate
Lazar N. Spasovic, Ph.D.**
Professor
Matt Campo*
Senior Research Associate
Dejan Besenski, Ph.D.**
Senior Transportation Planner
Rutgers University
New Jersey Institute of Technology
In cooperation with Rutgers, The State University of New Jersey
And State of New Jersey
Department of Transportation And
U.S. Department of Transportation Federal Highway Administration
Disclaimer Statement
The contents of this report reflect the views of the authors, who are responsible for the facts and the accuracy of the
information presented herein. This document is disseminated under the sponsorship of the Department of Transportation, University Transportation Centers Program, in the interest of
information exchange. The U.S. Government assumes no liability for the contents or use thereof.
The Center for Advanced Infrastructure and Transportation (CAIT) is a Tier I UTC Consortium
led by Rutgers, The State University. Members of the consortium are the University of Delaware,
Utah State University, Columbia University, New Jersey Institute of Technology, Princeton
University, University of Texas at El Paso, University of Virginia and Virginia Polytechnic
Institute. The Center is funded by the U.S. Department of Transportation.
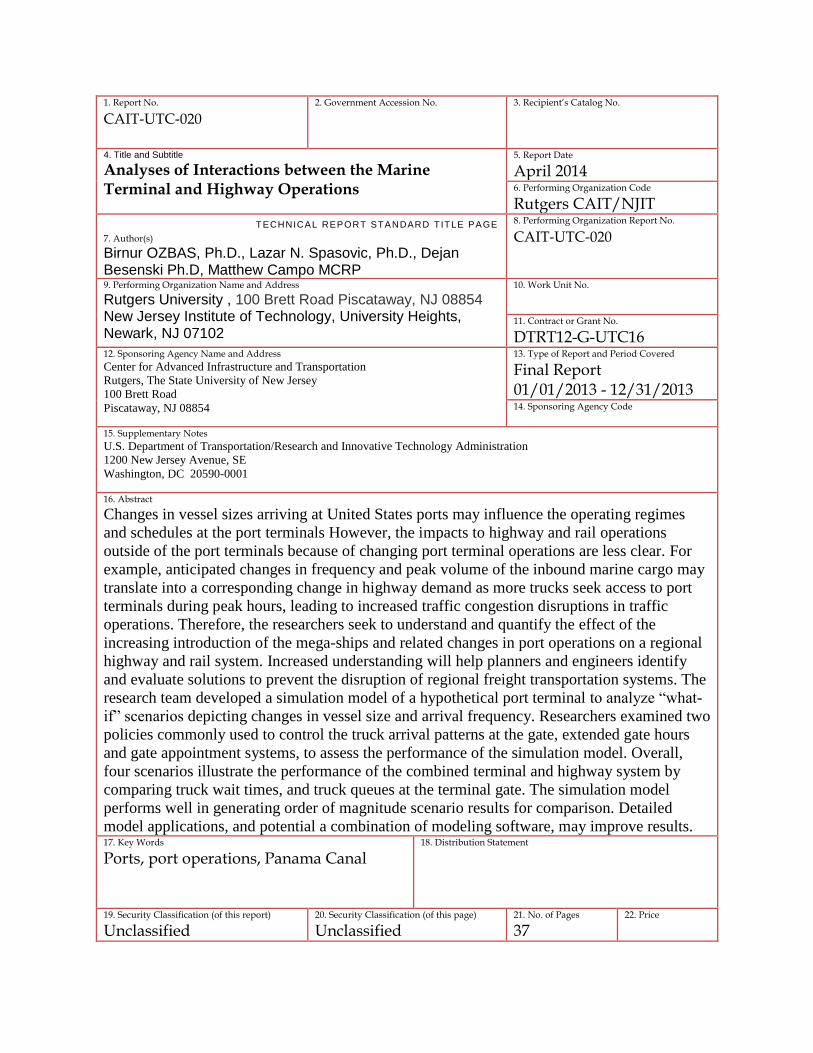
1. Report No.
CAIT-UTC-020
2. Government Accession No. 3. Recipient’s Catalog No.
4. Title and Subtitle
Analyses of Interactions between the Marine Terminal and Highway Operations
5. Report Date
April 2014 6. Performing Organization Code
Rutgers CAIT/NJIT
7. Author(s)
Birnur OZBAS, Ph.D., Lazar N. Spasovic, Ph.D., Dejan Besenski Ph.D, Matthew Campo MCRP
8. Performing Organization Report No.
CAIT-UTC-020
9. Performing Organization Name and Address
Rutgers University , 100 Brett Road Piscataway, NJ 08854 New Jersey Institute of Technology, University Heights, Newark, NJ 07102
10. Work Unit No.
11. Contract or Grant No.
DTRT12-G-UTC16 12. Sponsoring Agency Name and Address
Center for Advanced Infrastructure and Transportation
Rutgers, The State University of New Jersey
100 Brett Road
Piscataway, NJ 08854
13. Type of Report and Period Covered
Final Report 01/01/2013 - 12/31/2013
14. Sponsoring Agency Code
15. Supplementary Notes
U.S. Department of Transportation/Research and Innovative Technology Administration
1200 New Jersey Avenue, SE
Washington, DC 20590-0001
16. Abstract
Changes in vessel sizes arriving at United States ports may influence the operating regimes
and schedules at the port terminals However, the impacts to highway and rail operations
outside of the port terminals because of changing port terminal operations are less clear. For
example, anticipated changes in frequency and peak volume of the inbound marine cargo may
translate into a corresponding change in highway demand as more trucks seek access to port
terminals during peak hours, leading to increased traffic congestion disruptions in traffic
operations. Therefore, the researchers seek to understand and quantify the effect of the
increasing introduction of the mega-ships and related changes in port operations on a regional
highway and rail system. Increased understanding will help planners and engineers identify
and evaluate solutions to prevent the disruption of regional freight transportation systems. The
research team developed a simulation model of a hypothetical port terminal to analyze “what-
if” scenarios depicting changes in vessel size and arrival frequency. Researchers examined two
policies commonly used to control the truck arrival patterns at the gate, extended gate hours
and gate appointment systems, to assess the performance of the simulation model. Overall,
four scenarios illustrate the performance of the combined terminal and highway system by
comparing truck wait times, and truck queues at the terminal gate. The simulation model
performs well in generating order of magnitude scenario results for comparison. Detailed
model applications, and potential a combination of modeling software, may improve results. 17. Key Words
Ports, port operations, Panama Canal
18. Distribution Statement
19. Security Classification (of this report)
Unclassified 20. Security Classification (of this page)
Unclassified 21. No. of Pages
37 22. Price
TECHNICAL REPORT STANDARD T ITLE PAGE

Acknowledgments The research team would like to thank the New Jersey Department of Transportation for their assistance in this research.
Table of Contents
DESCRIPTION OF THE PROBLEM ....................................................................................... 1
APPROACH ........................................................................................................................... 2
LITERATURE REVIEW .......................................................................................................... 3
METHODOLOGY ................................................................................................................... 5
BERTH OPERATION .......................................................................................................... 8
TERMINAL GATE OPERATION ........................................................................................14
SCENARIOS AND RESULTS ...............................................................................................18
THE MODELING SCENARIOS ..........................................................................................19
FINDINGS .............................................................................................................................20
SCENARIO I RESULTS .....................................................................................................20
SCENARIO II RESULTS ....................................................................................................21
SCENARIO III RESULTS ...................................................................................................23
SCENARIO IV RESULTS ..................................................................................................24
CONCLUSIONS ....................................................................................................................26
RECOMMENDATIONS .........................................................................................................28
REFERENCES ......................................................................................................................29

List of Figures
Figure 1. Vessel Arrival and Berth Allocation ............................................................................10 Figure 2. Container Transfer Logic From the Berth to the Yard .................................................12 Figure 3. Container Transfer Logic From the Yard to the Berth .................................................12 Figure 4. The Logic Applied to a Truck in the Slot .....................................................................13 Figure 5. Processes within the Gate Model ...............................................................................15 Figure 6. Hourly Truck Volume Entering Port (Weekday) ..........................................................16 Figure 7. Average Truck Waiting Time and Lane Queue ...........................................................21 Figure 8. Average Truck Waiting Time and Lane Queue (Scenarios I and II) ............................22 Figure 9. Average Truck Waiting Time and Lane Queue (Scenario III and Baseline) ................24 Figure 10. Average Truck Waiting Time and Lane Queue (Scenario IV and Baseline) ..............25 Figure 11. Queue Length Outside of the Gate ...........................................................................26
List of Tables
Table 1. Vessel Traffic by Ship Capacity .................................................................................... 8 Table 2. Vessel Classification by Type and Capacity ................................................................. 8 Table 3. Truck processing times in the slot ...............................................................................14 Table 4. Analyzed Scenarios .....................................................................................................19 Table 5. The Performance Indicators ........................................................................................20 Table 6. The Performance Indicators ........................................................................................22 Table 7. Scenario III Performance Indicators and Comparison to Other Scenarios ...................23 Table 8. Scenario IV Results .....................................................................................................24 Table 9. The Average Truck Turnaround Time and Waiting Time Comparison .........................27
1
DESCRIPTION OF THE PROBLEM
Prior to expansion, the Panama Canal handled vessels hauling approximately 5,000 twenty-foot
equivalent units (TEU1s). In an analysis of North American ports, Conway (2012) suggests that
the expansion of the Panama Canal would enable passage of vessels capable of carrying
around 12,500 containers. Rodrigue (2014) estimated that such an expansion could induce an
additional 2,000 transits through the canal each year. According to the U.S. Army Corps of
Engineers (2012), post-Panamax vessels may make up 62 percent of total container ship
capacity by 2030. One can anticipate that these future changes in vessel size and shipment
frequency resulting from the Panama Canal expansion will alter global trade routes, creating a
need to understand the potential for port terminals to perform under changing operating
conditions.
All major US Ports are already ready or will be ready to accommodate vessels capable of
carrying around 12,500 containers by 2015 (Thuermer, 2013). The Port Authority of New York
and New Jersey is spending $1.3billion to raise its Bayonne Bridge so that the post-Panamax
vessels can make clearance. The Port Newark Container Terminal (PNCT) in undergoing a half-
billion dollar investment to create a state-of-the-art container terminal while the maritime cargo
center is undergoing $1.3 billion of improvements to provide access for post-Panamax ships to
the Newark and Elizabeth terminals. Port of Savannah, Charleston and Miami are also investing
into infrastructure and channel dredging to be able accommodate larger vessels.
The change in vessel size arriving at the port will not only impacts the operating regimes and
schedules at the port terminals, but highway and rail operations outside of the ports as well. For
example, changes in frequency and peak volume of the inbound marine cargo may translate to
1 The twenty-foot equivalent unit is an inexact unit of cargo capacity often used to describe the capacity of container ships and container terminals

2
a corresponding change in highway demand as more trucks may be seeking access to ports
and the cargo during the peak hours. This would lead to increased traffic congestion and over
time serious disruptions in traffic operations. For this reason, it is necessary to understand and
quantify the effect of the increasing introduction of the mega-ships and related changes in port
operations on a regional highway system. A better understanding of these effects will help
planners identify and evaluate solutions for preventing disruptions to local or regional freight
transportation systems.
APPROACH
The objective of this study was to develop a model that will be capable of ascertaining the
impact of the marine terminal operations on a highway system that provides access to the port.
The model focuses on the specific relationships between the changes in terminal wharf
operations caused by anticipated changes in vessel sizes and arrival schedules. Researchers
measured the resulting peak truck demand on regional highways, along with the distribution of
truck arrivals and departures at the terminal gates. Subsequently, researchers simulated a
limited number of capital improvements and operating policies to analyze the effects of
implementing alternative strategies to reduce congestion and demonstrate the efficacy of the
simulation model.
The simulation model assumes the presence of a hypothetical intermodal (containerized)
marine port terminal. The terminal components include the wharf operations, container storage,
and truck and railway yards. Researchers defined a set of variables describing the terminal
operations, such as vessel arrival times or distributions, the vessel size, the equipment
productivity (e.g. moves per hour for cranes, straddle carriers, etc.), distribution of container
storage times, truck arrivals for pick-up and/or delivery, train departure times and departure
frequency. The simulation models allow users to analyze “what-if” scenarios evaluated different
3
port development and growth scenarios with respect to the ship size and frequency of their
arrivals at the port on a comparative basis.
LITERATURE REVIEW
Researchers reviewed both academic and professional literature to identify and catalog prior
uses of simulation models to analyze interactions between marine ports and surface
transportation systems. During the review, researchers also identified suitable port performance
variables and operational characteristics to incorporate into model assumptions. The research
team discovered three groups of applicable modeling literature: studies that focus solely on
simulations of port operations, studies that model ports as a part of intermodal transportation
and studies that measure the effects of policy or operational proposals on the performance of
port infrastructure with respect to the adjacent surface transportation systems.
Researchers use computer simulation as part of the decision-making process for port terminal
investments in order to mitigate the risk of the potential for unanticipated sensitivities in the
performance of system designs. Carpenter and Ward (1990) used simulation modeling to
integrate container flows with several sub-models to understand in-yard container handling
operations. This multi-layered approach to simulation modeling for understanding performance
of an overall system as the result of several subsystems is consistent with early simulation
modeling methods. Yun and Choi (1999) proposed an object-oriented approach to simulation
models for container terminal analysis in Pusan, Korea, that included additional sub-system
simulations for container handling at the terminal, container transport between equipment, and
equipment control. Kia et al. (2000) focused on developing an object-oriented modeling
approach to compare a container terminal equipped with electronic devices to track containers
against a terminal without such devices. Other studies extend simulation models beyond
terminal boundaries to include the influence of terminal basin operations on terminal capacity,
4
demonstrating the need for coordination of maritime systems within and outside of the terminal
to most effectively utilize terminal capacity (Ng and wong, 2006; Cortes et al., 2007). Simulation
provides a tool for researchers to understand the effects of changes in single mode operations
both within and outside of the boundaries of a given marine terminal.
However, increasing system complexity and freight volumes require the multi-modal transport of
goods to reduce cargo handling, improve security, reduce damage and loss, and allow freight to
be transported faster multiple modes of transportation. Nagy (1975) performed an early
simulation study to analyze the cost and performance of an intermodal dry bulk commodity-
transshipping terminal. Others, such as Gambardella et al. (1998), later focused on using
simulation to understand resource allocation problems at intermodal container terminals using
various forecasting and optimization techniques based in operations research theory. Several
researchers have used discrete event simulations to model the effects of modal shifts toward
rail for container drayage and inland movements on port terminal operations, allowing decision
makers to understand effects on capacity and inventory costs (Kia et al., 2002; Lee et al., 2006;
Parola and Sciomachen, 2004). These simulations depend on models that reside within the
same simulation tools, whereas other approaches require the integration of several modeling
platforms.
Several researchers have been successful in integrating different simulation platforms to create
comprehensive models. Ioannou et al. (2007) investigated the impact of various technologies
and concepts on the terminal capacity and cost as well as on the traffic network outside the
terminals, simultaneously modeling terminal performance measures that included gate, handling
equipment and labor performance measures (e.g. utilization, productivity, turnaround time).
Puglisi (2008) integrated an ARENA based port operations model with a VISSIM traffic
simulation model to understand the effects of increases in container traffic at the Port of
Savannah to address congestion concerns. Wall (2012) later improves and expands the model
5
developed by Puglisi (2008) by automating the interaction among the VISSIM and Arena models
to allow for the analysis of queue lengths, travel times, and other performance measures of
concern. Moini (2010) develops a simulation model in ARENA that identifies six operational
modules for terminal operations: truck arrivals, entrance gate (pre-gates and main gates),
interchange area, yard, apron, and departure gates. Additional integrated macro and micro
simulation modeling strategies have been used to study the interaction between container
operations and truck operations to reduce congestion domestically at the Port of New York and
New Jersey (Dougherty, 2010), and evaluate alternatives for emissions reductions
internationally (Karafa, 2012; Tsitsamis and Vlachos, 2010). While the integration of different
simulations models can allow for detailed analyses, it may also add a level of complexity and
expense that will not be suitable for our exploratory purposes in this study.
METHODOLOGY
The research team chose to use a discrete event simulation model. Prior literature supports the
choice of discrete event simulation because of the utility of the approach for modeling port
systems in a variety of different contexts. Discrete event simulation approaches are commonly
used in the analysis of complex systems with stochastic properties (e.g., processing sequences
and times for ships, containers and trucks in a port terminal), and is effective in ascertaining the
interactions between the components of a system.
The research team developed the simulation model using the Arena2 simulation modeling
software. The team chose this alternative based on researchers’ experience with the software
and a desire to limit cost and complexity through the use of a single modeling suite. Arena
models entities through a process that is defined by a flowchart of blocks. Entities are the units
of analysis for the study that the model processes and analyzes to record statistics (e.g. vessel
2 http://www.arenasimulation.com
6
and trucks in this study). The entities travel through processes that consist of process blocks or
modules. Blocks represent logical principles used to control entities, and sometimes require
elements as inputs to define the actions performed by the block. Elements are resources used
to describe the model components. The resources implemented in this model are berths, gantry
cranes, gate (number of lanes), straddle carriers and truck parking slots.
Researchers determined candidate performance measures available from the literature and
supplement those measures with site visits to marine container terminals in the Port of New
York/New Jersey to enable the research team to observe and implement the processes that
occur within typical container terminal. The system components such as the gate operation,
wharf operations, container storage, and truck parking slots were implemented within the model,
along with variables that represent vessel arrival times, vessel size, equipment productivity (e.g.
moves per hour for cranes, straddle carriers, etc.), container storage times, and arrival times for
truck and rail conveyances. The extensive literature review ensured the appropriate definition
and selection of system variables to make sure that the model realistically approximates port
terminal operations, which one can implement with data that are generally available to public
transportation planning agencies.
The research team developed the simulation model for a hypothetical intermodal (containerized)
marine port terminal. The model validation focuses primarily on the logical structure of the
model and the sensitivity of model outputs and performance parameters with respect to
changes in input parameters. The simulation model is applied in analyzing a series of “what-if”
scenarios involving different combinations and iterations of the growth in freight demand,
increase in vessel size and different operating policies. For each scenario, a set of operating
policies is formulated and simulated in order to determine their effectiveness in responding to
the changes in freight (container) demand.
7
The simulation of scenarios yields a set of performance measures such as truck and container
processing and waiting times and port terminal resource utilization. The research team analyzed
and compared these performance measures to ascertain the effects of changes in vessel arrival
schedule and size on operating policies.
DEVELOPING A CONCEPTUAL MODEL
The operation within the container terminal can be divided into three major categories:
Berth Operation. The activities consist of allocation of berth(s) and crane(s) to vessels
based on their capacity.
Yard Operation. The processes consist of allocating container handling equipment (i.e.
straddle carriers) between:
o The yard and berths. The straddle carriers are transferring cranes from (to) berths,
and
o The yard and truck slots. The available straddle carriers perform unloading and
loading of containers to (from) trucks located in parking slots.
Gate Operation. The processes simulate the truck related activities usually performed at the
terminal gates (the scanning of containers, checking the paperwork, additional inspection,
etc.)
The processes within the container terminal use basic process modules, advanced process
modules and advanced transfer modules that are part of the Arena simulation software. The
model does not simulate the movement of containers between the yard and rail. The research
team assumed that 5% of inbound container are moved by rail.
The following sections explain the logic, assumptions and parameters based on which the
container terminal is designed and simulated. The terminal characteristics (such as number of
berths, cranes, number of gates, yard capacity, and number of parking slots for trucks) and
8
operational parameters (vessel capacities, allocation of cranes to vessels, truck processing
times, etc.) were obtained from the literature review and by field visits to terminal operations.
BERTH OPERATION
VESSEL CHARACTERISTICS
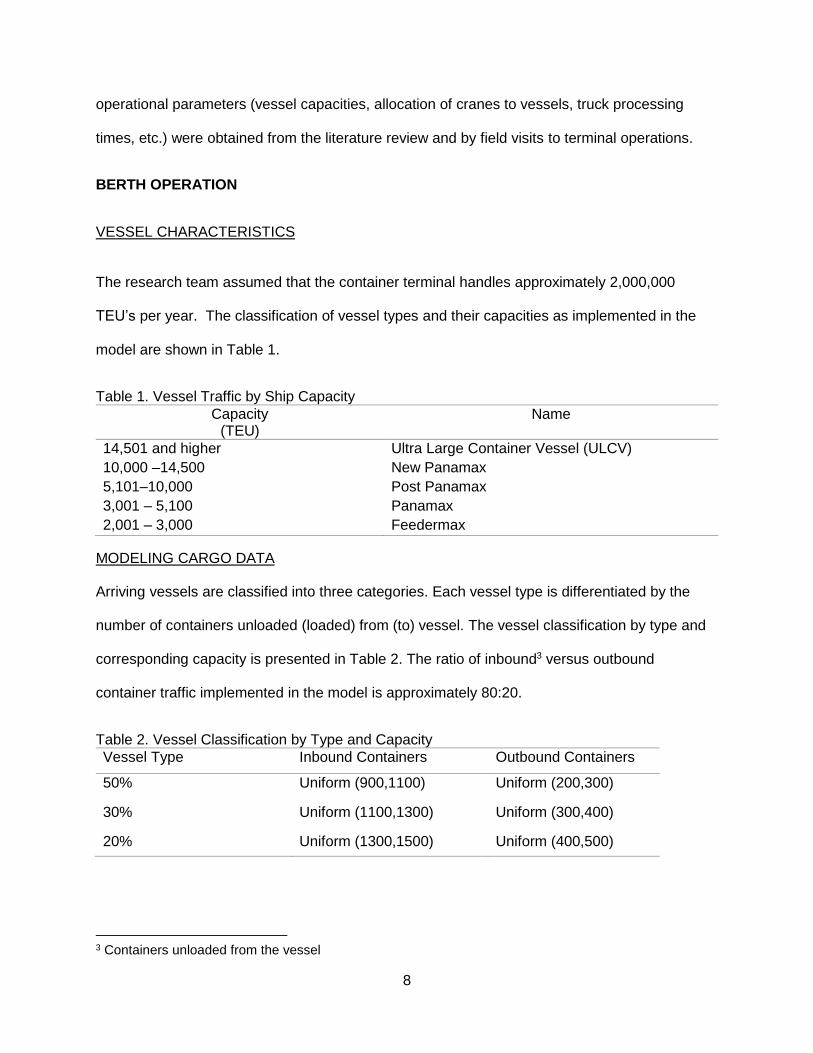
The research team assumed that the container terminal handles approximately 2,000,000
TEU’s per year. The classification of vessel types and their capacities as implemented in the
model are shown in Table 1.
Table 1. Vessel Traffic by Ship Capacity
Capacity (TEU)
Name
14,501 and higher Ultra Large Container Vessel (ULCV)
10,000 –14,500 New Panamax
5,101–10,000 Post Panamax
3,001 – 5,100 Panamax
2,001 – 3,000 Feedermax
MODELING CARGO DATA
Arriving vessels are classified into three categories. Each vessel type is differentiated by the
number of containers unloaded (loaded) from (to) vessel. The vessel classification by type and
corresponding capacity is presented in Table 2. The ratio of inbound3 versus outbound
container traffic implemented in the model is approximately 80:20.
Table 2. Vessel Classification by Type and Capacity
Vessel Type Inbound Containers Outbound Containers
50% Uniform (900,1100) Uniform (200,300)
30% Uniform (1100,1300) Uniform (300,400)
20% Uniform (1300,1500) Uniform (400,500)
3 Containers unloaded from the vessel
9
VESSEL ARRIVALS
The vessel arrival is modeled based on the premises the vessel inter-arrival times are not
correlated. Each vessel has a time window (i.e. laytime) designated for container loading and
unloading operations. Based on vessel arrival observations, the research team selected the
mean length of 20 hours for laytime. The distribution of the vessel arrival times was estimated
based on a literature review is obtained through a literature review of previous port operations
models. The mean vessel inter-arrival time is 10 hours and the distribution of the vessel arrival
time is described by a triangular distribution (Triangular (0, 20, 40).
RESOURCES
The model assigns necessary resources to each vessel upon their arrival. There are two types
of resources assigned to each vessel:
The berth and
The cranes
There are total of eight berths that vessels can have assigned. Five out eight berths has an
ability of accommodating post-Panamax and ultra large container vessels. The model tracks
berth availability and assigns the appropriate vessel to a berth based on a vessel size. As soon
as a vessel arrives at the berth, the model allocates the necessary number of cranes needed to
unload the vessel. There are 16 cranes within the model, 9 of which are capable of handling the
height and width of Post-Panamax vessels. Crane productivity in the model is 30 lifts per hour
and cranes are assigned to a vessel based on a number of container-moves4 that have to be
performed per vessel. There are two possible cases based on which the cranes are allocated to
a vessel:
The model allocates 2 cranes if the number of container-moves per vessel is below 1300
4 The number of containers to be unloaded/loaded from/to a vessel.
10
The model allocates 3 cranes if the number of container-moves per vessel are over 1300
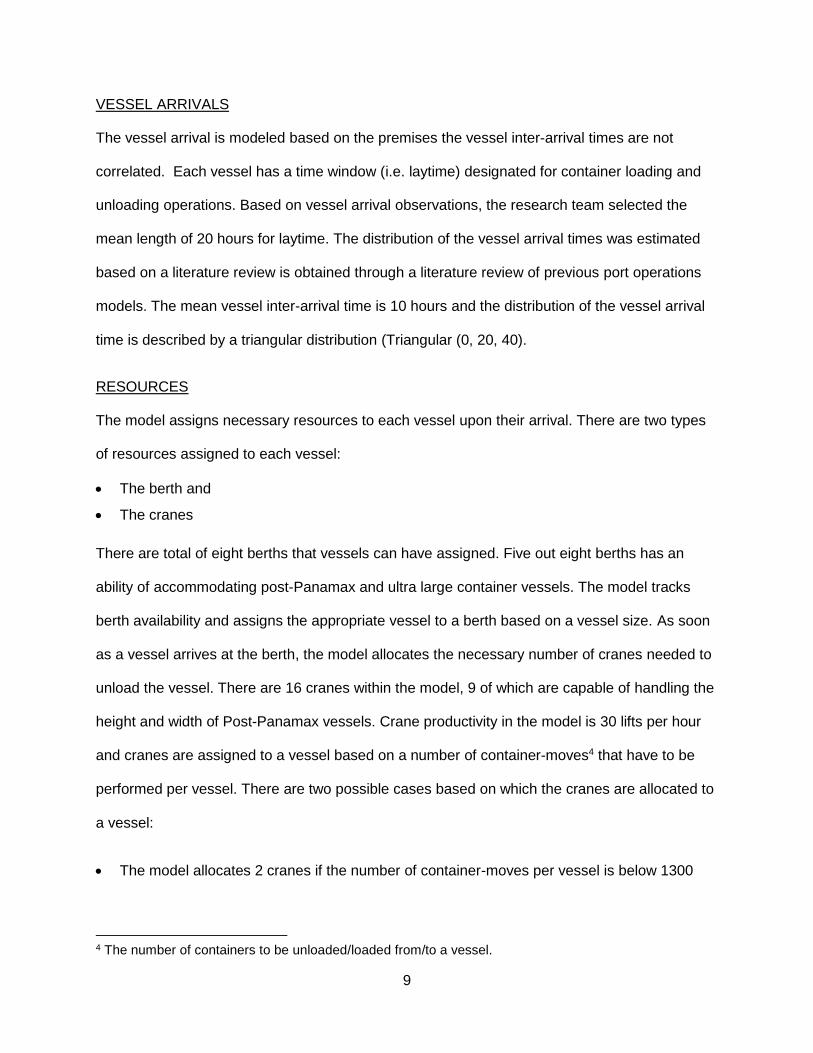
Figure 1 below shows the logic based on the berth operation is implemented within the model.
Upon vessel arrival the model checks if there is available berth based on the vessel type. If
there is an available berth, the model assigns vessel to a berth. If the berth is not available, the
vessel is waiting until the adequate berth becomes available. The model keeps track of number
of available berths, cranes, records their utilization and vessel turnaround time as well.
Vessel Arrival
LayTime
Wait for the
Available Beth
Is the Berth
Available?
Yes
No
Vessel Departure
Vessel Loading/Unloading
Assign the Berth Based on a Vessel Type
Assign
Cranes
Based on the
Number of
Container-
Moves per
Vessel
Figure 1. Vessel Arrival and Berth Allocation
THE YARD OPERATION
Typical operations in the yard include storage and retrieval of containers. The Straddle carrier
operation can be classified into processes:
The transfer of containers between the cranes and storage area, and
The transfer of containers between the trucks and the storage area
11
The storage capacity at the terminal is estimated based on the aerial observation of a single
container terminal. Researchers assumed that the storage capacity is from 25,000 to 27,000
containers. The model further classifies the storage yard area designated for inbound
containers (maximum of 20,000 containers) and the storage area for outbound containers that
has a capacity of 5,000 containers. The maximum number of straddle carriers that can be
operational at any given point of time is 100.
Figure 2 below shows the logic applied to transfer a container from the moment it is unloaded
from the vessel to the storage yard. When the container is unloaded from the vessel the model
first checks the availability of the straddle carriers. If the straddle carrier is available it is
assigned to a container, the total transfer time to the storage is recorded and the model
releases the straddle carrier for the next assignment. The model records the number of
containers in the storage, and at the decision point checks if any straddle carrier is available.
Figure 3 shows the logic applied to a process of transferring a container from the yard to the
berth.

12
Container
Unloaded from the
Vessel
Wait for the
Available Straddle
Carrier
Is the Straddle
Carrier Available?
Yes
No
Transfer Time
Record Container Into the Storage
Inventory
Release the Straddle Carrier
Seize the Straddle Carrier and Assign to
a Container
Container to be
Transferred from
the Storage to a
Vessel
Wait for the
Available Straddle
Carrier
Is the Straddle
Carrier Available?
Yes
No
Transfer Time
Release the Container at
Assigned Berth
Release the Straddle Carrier
Seize the Straddle Carrier and Assign to
a Container
Figure 2. Container Transfer Logic From the Berth to the Yard
Figure 3. Container Transfer Logic From the Yard to the Berth
Figure 4 shows the logic implemented for the container transfer between the storage area and
truck waiting in the slots. There are three distinctive cases that can occur:
Container is dropped-off by the truck and truck leaves the slot
Container is picked-up by the truck and truck leaves the slot, and
Transshipment of container ( truck drops-off the container and picks-up the container and
then leaves the slot)
13
Truck in The Slot
Wait for the
Available Straddle
Carrier
Is the Straddle
Carrier Available?
YesNo
Container Transfer Time
Release the Truck
Release the Straddle Carrier
Seize the Straddle Carrier and Assign to
a Container
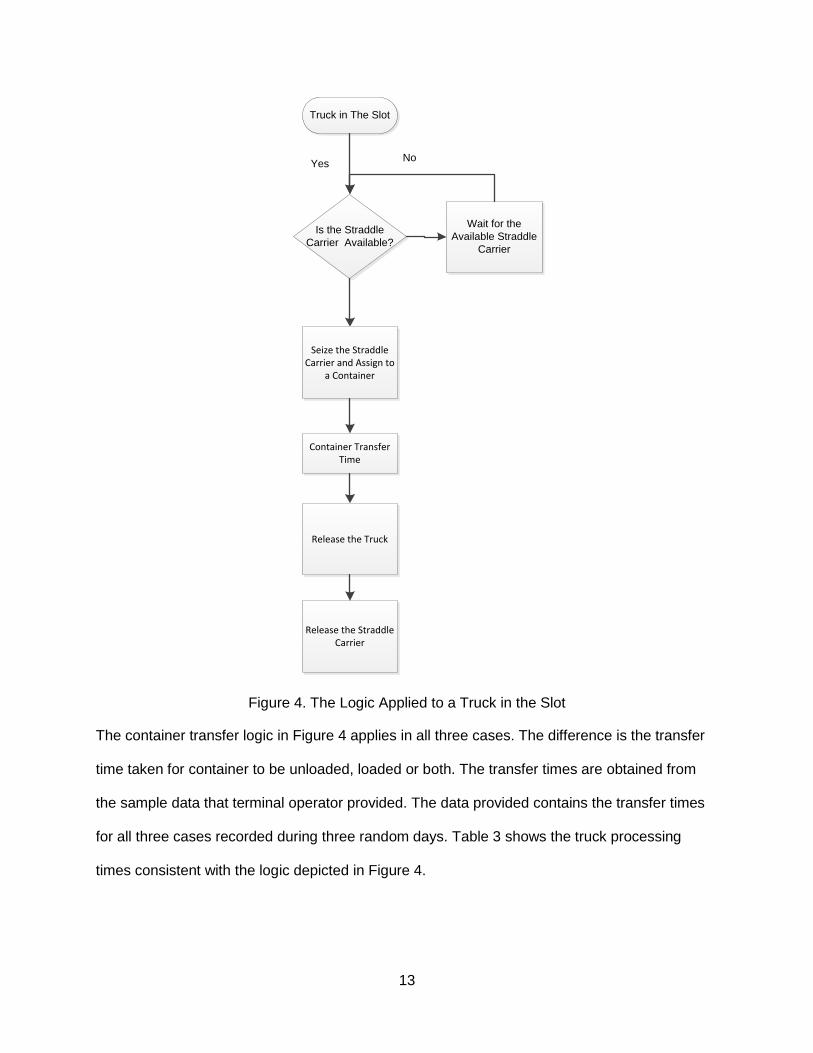
Figure 4. The Logic Applied to a Truck in the Slot
The container transfer logic in Figure 4 applies in all three cases. The difference is the transfer
time taken for container to be unloaded, loaded or both. The transfer times are obtained from
the sample data that terminal operator provided. The data provided contains the transfer times
for all three cases recorded during three random days. Table 3 shows the truck processing
times consistent with the logic depicted in Figure 4.
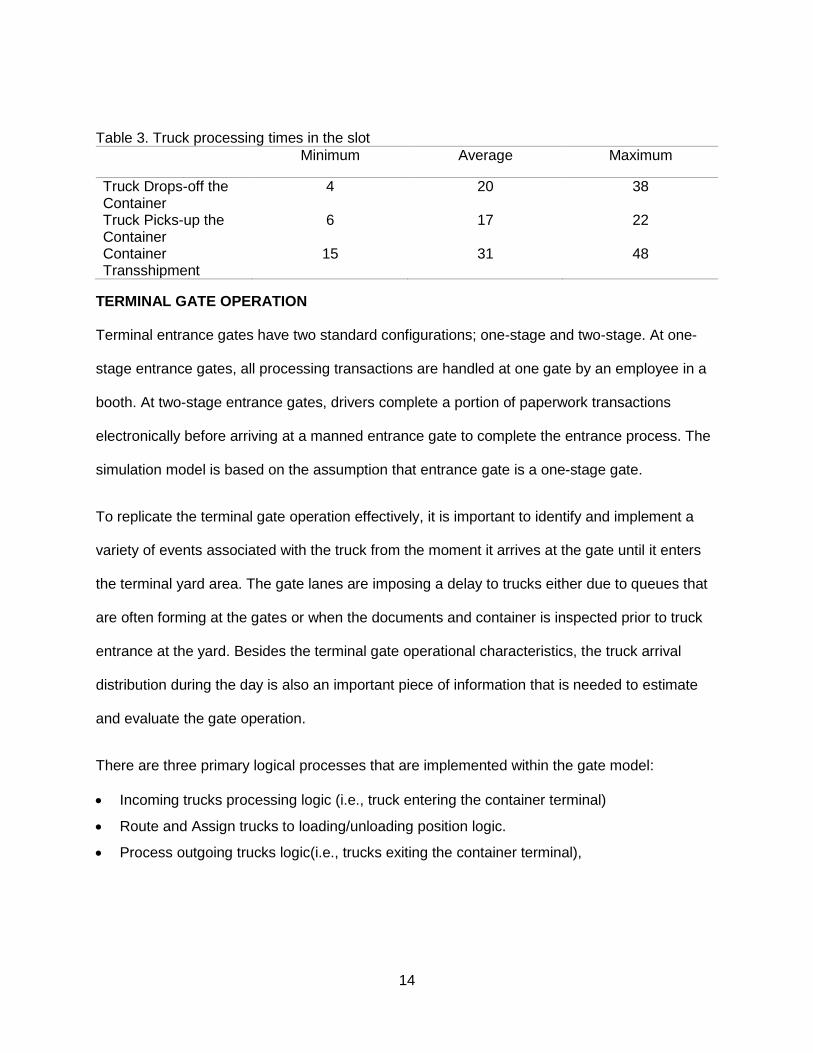
14
Table 3. Truck processing times in the slot
Minimum Average Maximum
Truck Drops-off the Container
4 20 38
Truck Picks-up the Container
6 17 22
Container Transshipment
15 31 48
TERMINAL GATE OPERATION
Terminal entrance gates have two standard configurations; one-stage and two-stage. At one-
stage entrance gates, all processing transactions are handled at one gate by an employee in a
booth. At two-stage entrance gates, drivers complete a portion of paperwork transactions
electronically before arriving at a manned entrance gate to complete the entrance process. The
simulation model is based on the assumption that entrance gate is a one-stage gate.
To replicate the terminal gate operation effectively, it is important to identify and implement a
variety of events associated with the truck from the moment it arrives at the gate until it enters
the terminal yard area. The gate lanes are imposing a delay to trucks either due to queues that
are often forming at the gates or when the documents and container is inspected prior to truck
entrance at the yard. Besides the terminal gate operational characteristics, the truck arrival
distribution during the day is also an important piece of information that is needed to estimate
and evaluate the gate operation.
There are three primary logical processes that are implemented within the gate model:
Incoming trucks processing logic (i.e., truck entering the container terminal)
Route and Assign trucks to loading/unloading position logic.
Process outgoing trucks logic(i.e., trucks exiting the container terminal),

15
Entry Gate Model with
Truck Processing Logic
Outgoing Gate Submodel
Containers from
the vessel
Trucks and
Containers Arrived
from Roadway
Vehicle Routing Logic
Vehicle and Container
Handling Logic
Trucks and Containers
To Roadway
Figure 5. Processes within the Gate Model
Figure 5 above shows the relationship between gate model processes. The elements shown in
green and blue represent the logic developed for the incoming and outgoing trucks respectively.
The logic is designed to assign a truck to appropriate lane with predefined processing time. The
trucks are differentiated based on if they are hauling a container (empty or full) or arriving with a
chassis or as a bobtail. Upon entrance, “vehicle routing logic” emulates the process of trucks
travelling to the available slot where it is handled by a straddle carrier. The delay is added to
each truck that represents travel time from the gate to a parking slot. The vehicle routing logic
monitors the number of available slots and holds a truck in the queue if the slot is not available.
The process “vehicle and container handling logic” assigns straddle carrier to a truck waiting in
a slot. It measures the truck time in the slot and its processing time.
GATE DESCRIPTION
In contrast to vessel operations, which can arrive at any day and hour, a container terminal gate
is usually open during the workweek (Monday thru Friday) for a fixed time interval. In this model
the gate is designed to process trucks from 6:00 A.M. to 9:00 P.M. Monday through Friday. The
entrance and exit gate consist of 20 lanes. Based on the field observations and literature review
the first 6 lanes are assigned to process chassis and bobtail trucks with uniform distribution

16
among lanes. The container truck demand is handled by remaining 14 lanes with equal demand
assigned to each lane.
AVAILABLE DEMAND DATA
To simulate the realistic demand the data from New Jersey Department of Transportation “The
Portway Extensions Study Area5 was able to provide a basis for truck arrival pattern
development. The study provides truck counts for the area around the container terminals
during the day. The site visit enabled research team to closely observe the truck arrival pattern
and movements around the entrance gate. The data is further adjusted to meet the demand
requirement from the berth side. Figure 6 below shows the truck hourly distribution entering the
gate on a typical weekday.
Figure 6. Hourly Truck Volume Entering Port (Weekday)
5 “Portway Extensions Concept Development Study””, NJDOT, 2003
0
50
100
150
200
250
300
350
400
1 2 3 4 5 6 7 8 9 10 11 12 13 14 15 16 17 18 19 20 21 22 23 24
Traffic Volume Entering Port
17
The literature review suggests that a weekly cyclical truck arrival pattern repeats over a monthly
period when accounting for all types of transactions. In this model three vehicle types are
defined that represent trucks arrival at the terminals; trucks hauling a container (from now on
referred to as container trucks), trucks hauling a bare chassis (chassis trucks), and bobtail
trucks. Container trucks are further disseminated into a truck hauling a full container or an
empty container. The Port Authority of New York and New Jersey6 annual trade reports are
used to determine the ratio of full versus empty containers handled by the port. The ration of
truck with a full versus empty container is 78 to 22 percent of total demand at the gate.
MODELING DELAYS AT THE GATE
Delays at terminal gates result from delays to in-gate processing. As discussed this process
typically includes verifying driver identity, in case the driver is picking up the container operator
is determining availability of the specified container, delivering instructions to drayage operators
for container pick-up and dispatching yard equipment. If the driver is dropping off a container,
container related paperwork and possible container inspection has to be conducted before the
truck is assigned and dispatched to a specific slot. At exit gates, in-gate delays typically consist
of verifying that the correct container has been picked up. Reduction in the amount of
processing needed at exit gates corresponds with lower delays for these gates.
The mean delay for an entrance gate on a lane which serviced container was represented by a
normal distribution with a mean of 4 minutes. Entrance gates that serviced chassis trucks are
approximated with a normal distribution with a mean delay of 2 minutes. The literature review
suggests that the delay for exit gates would be half of a delay for entrance gates, as the
operation for trucks exiting the terminal is tend to be simpler.
6 http://www.panynj.gov/
18
SCENARIOS AND RESULTS
The researchers hypothesize that the greater frequency of vessel arrivals, combined with the
increasing variability of the size of the vessel s will generate new challenges for port terminal
managers. Researchers developed scenarios based on recent studies completed to inform the
raising of the Bayonne Bridge. As part of this exercise, research developed scenarios to simulate
the potential growth of the New York and New Jersey truck traffic as result of attracted Post-
Panamax vessel due to rising of the Bayonne Bridge. While the research team is not modeling a
particular terminal facility, we are using the knowledge of the terminal operations and
configurations to develop a baseline scenario of the terminal operation to understand the potential
impacts on a given hypothetical port terminal. The baseline scenario operational assumptions
are utilized to portray the potential policy impacts of Post-Panamax ships on traffic and
consequently highway infrastructure around the port.
The increasing truck waiting time at the gate might defer shippers of using terminal services and
cause them to redirect their cargo to other terminals that can provide faster service. To provide
the same level of service, terminal operators can either increase the throughput of the gate by
adding more entry and exit lanes or change the gate operating hours or reduce the gate
processing times by implementing new technologies. Often the limited land availability restricts
the expansion of the gate lanes leaving the change in gate operating policy and new gate
technologies as the only viable strategy that can increase the gate throughput. In this study two
policies, commonly used to control the truck arrival patterns at the gate, were examined to
address the gate operation:
Extended gate hours, and
Gate appointment system
The goal of extended gate hours strategy is to divert a percentage of demand from peak hours to
off-peak hours. The gate appointments strategy goal is also the reduction of the congestion at

19
peak hour periods and thus controlling the demand at the gate side. At the same time terminal
operator can efficiently plan the yard side operations. The strategies can be especially successful
if the terminal operator decides to provide incentives to the drayage operators for using the gates
at off peak.
THE MODELING SCENARIOS
Table 4 illustrates the characteristics of each of the four scenarios analyzed in this study:
Scenario I is design evaluate the operation of the terminal under the assumption that one
Post-Panamax ship is arriving per month. The gate operating hours remain identical to
baseline scenario.
Scenario II emulates the extended gate hours strategy. The gate operating hours during the
day are extended for 3 hours per day (to 16 hours per day).
Scenario III emulates the gate appointment strategy. Compared to Scenario 2, the gate
remains open for an additional day during the week. The gate remains open for 13 hours
during the day.
Scenario IV is based on the Scenario 1. It has the same vessel arrival frequency and gate
operating hours. The difference is that the chassis lanes are allowed process container
trucks as well.
Table 4. Analyzed Scenarios
Based on the literature review, the research team assumed that a single Post-Panamax vessel
will induce demand of 3,000 trucks at the port gates. The truck arrival distribution in each
scenario is modified to reflect additional demand.
The terminal performance indicators chosen to depict the gate performance are:
The Truck Turnaround Time; The time elapsed from truck the moment that truck generated
in the model until it leaves the model
Scenario Post-Panamax Vessel Arrival Frequency Gate Operating Hours
I 1 per month 13 hrs/day and 5 day week II 1 per month 16 hrs/day and 5 days/week III 1 per month 13 hrs/day and 6 days/week IV 1 per month 13 hrs/day and 6 days/week
20
The Truck In Terminal Time; The time elapsed from the moment truck passed the gate until
it processed by straddle carrier
Average Truck Waiting Time at the Gate; The time elapsed from the moment truck is
generate in the model until the moment is being started processed by the gate
Truck Queue Size at the Gate; The number of truck waiting at the gate
FINDINGS
This section presents the results of modeling scenarios and their comparison to the baseline
scenario. The scenarios are evaluated and compared by capturing change in performance
indicators as a result of a Post-Panamax vessel arrival.
SCENARIO I RESULTS
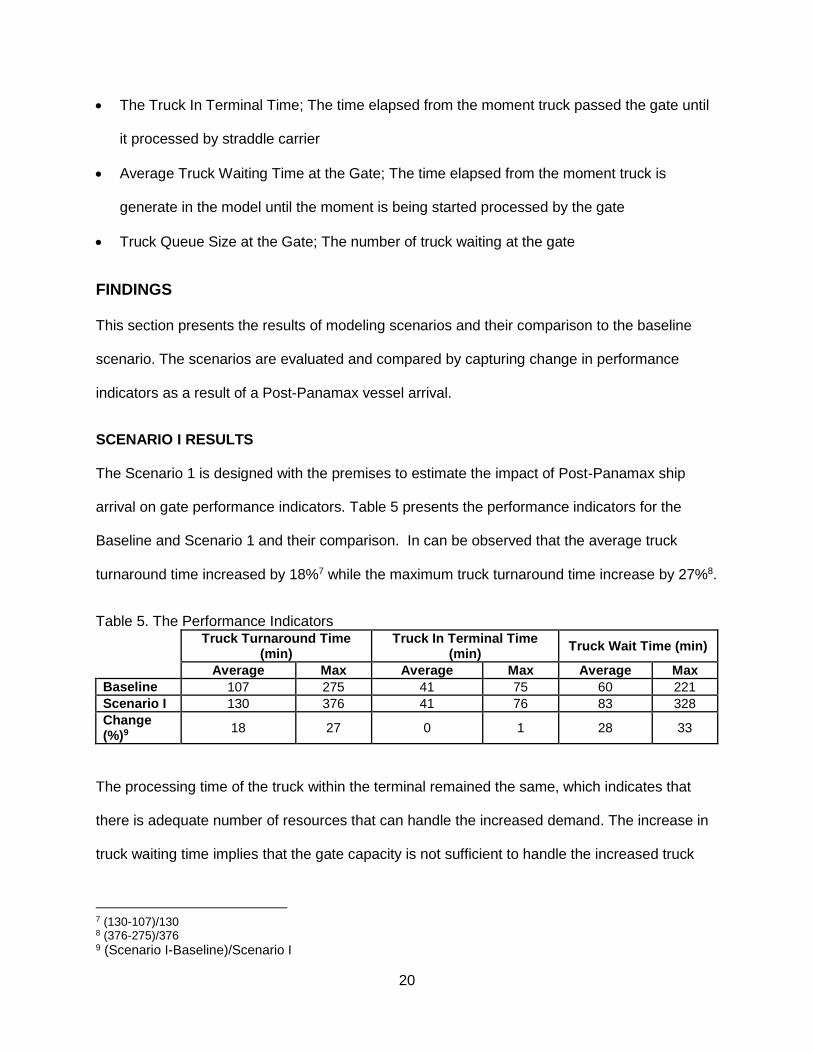
The Scenario 1 is designed with the premises to estimate the impact of Post-Panamax ship
arrival on gate performance indicators. Table 5 presents the performance indicators for the
Baseline and Scenario 1 and their comparison. In can be observed that the average truck
turnaround time increased by 18%7 while the maximum truck turnaround time increase by 27%8.
Table 5. The Performance Indicators
Truck Turnaround Time
(min) Truck In Terminal Time
(min) Truck Wait Time (min)
Average Max Average Max Average Max
Baseline 107 275 41 75 60 221
Scenario I 130 376 41 76 83 328
Change (%)9
18 27 0 1 28 33
The processing time of the truck within the terminal remained the same, which indicates that
there is adequate number of resources that can handle the increased demand. The increase in
truck waiting time implies that the gate capacity is not sufficient to handle the increased truck
7 (130-107)/130 8 (376-275)/376 9 (Scenario I-Baseline)/Scenario I

21
demand, thus the truck are waiting longer (on average 28%10). The consequence of increased
truck turnaround time is that it limits the number of trips that a truck driver can make during the
day, limiting the potential revenues of contracted drayage truck drivers.
Figure 7. Average Truck Waiting Time and Lane Queue
Figure 7 shows the change in average truck waiting time and average truck queue at each gate
lane during the day. The average queue in the Baseline scenario has two peaks that follow the
truck arrival pattern. In Scenario 1, the truck queue is constantly increasing reaching its peak
around 5 pm. One can observe that in Scenario 1 it would take additional 2.5 hours to process
all truck remaining in queue.
SCENARIO II RESULTS
The implemented extended gate hours policy reduced the average truck turnaround time and
waiting time is reduced by 14 % and by 24% respectively (Table 6) compared to Scenario I.
10 (83-60)/83
0
20
40
60
80
100
120
140
160
0
10
20
30
40
50
60
5 6 7 8 9 10 11 12 13 14 15 16 17 18 19 20 21 22 23 24
Tim
e (
min
)
Nu
mb
er
of
Tru
ck
s
Time (h)
Average Truck Waiting Time and Lane Queue
Queue - Baseline Queue - Scenario I
Waiting Time - Baseline Waiting Time - Scenario I
22
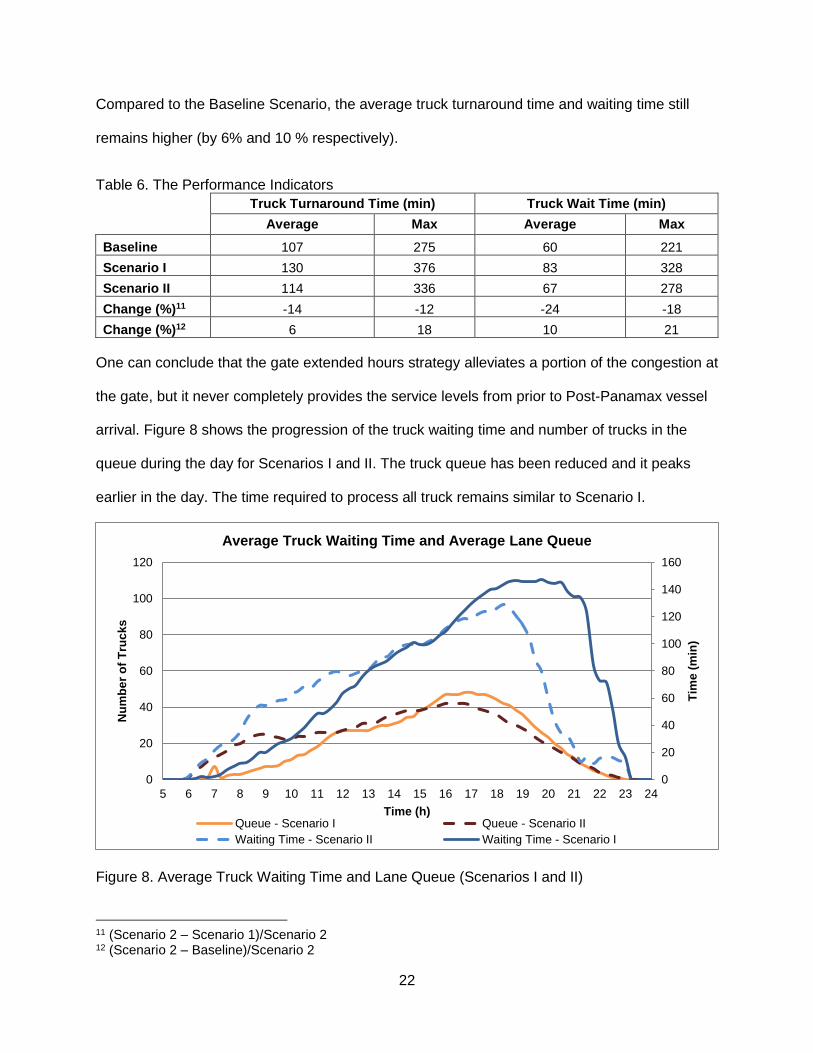
Compared to the Baseline Scenario, the average truck turnaround time and waiting time still
remains higher (by 6% and 10 % respectively).
Table 6. The Performance Indicators
Truck Turnaround Time (min) Truck Wait Time (min)
Average Max Average Max
Baseline 107 275 60 221
Scenario I 130 376 83 328
Scenario II 114 336 67 278
Change (%)11 -14 -12 -24 -18
Change (%)12 6 18 10 21
One can conclude that the gate extended hours strategy alleviates a portion of the congestion at
the gate, but it never completely provides the service levels from prior to Post-Panamax vessel
arrival. Figure 8 shows the progression of the truck waiting time and number of trucks in the
queue during the day for Scenarios I and II. The truck queue has been reduced and it peaks
earlier in the day. The time required to process all truck remains similar to Scenario I.
Figure 8. Average Truck Waiting Time and Lane Queue (Scenarios I and II)
11 (Scenario 2 – Scenario 1)/Scenario 2 12 (Scenario 2 – Baseline)/Scenario 2
0
20
40
60
80
100
120
140
160
0
20
40
60
80
100
120
5 6 7 8 9 10 11 12 13 14 15 16 17 18 19 20 21 22 23 24
Tim
e (
min
)
Nu
mb
er
of
Tru
ck
s
Time (h)
Average Truck Waiting Time and Average Lane Queue
Queue - Scenario I Queue - Scenario II
Waiting Time - Scenario II Waiting Time - Scenario I
23
SCENARIO III RESULTS
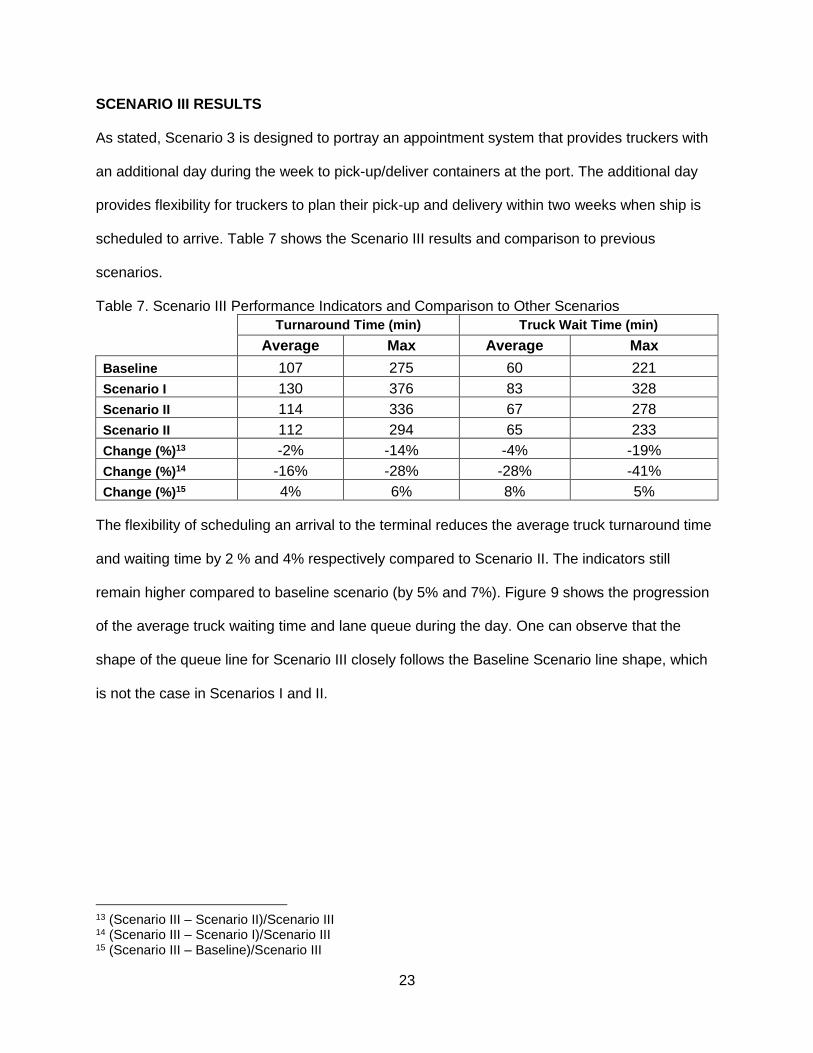
As stated, Scenario 3 is designed to portray an appointment system that provides truckers with
an additional day during the week to pick-up/deliver containers at the port. The additional day
provides flexibility for truckers to plan their pick-up and delivery within two weeks when ship is
scheduled to arrive. Table 7 shows the Scenario III results and comparison to previous
scenarios.
Table 7. Scenario III Performance Indicators and Comparison to Other Scenarios
Turnaround Time (min) Truck Wait Time (min)
Average Max Average Max
Baseline 107 275 60 221
Scenario I 130 376 83 328
Scenario II 114 336 67 278
Scenario II 112 294 65 233
Change (%)13 -2% -14% -4% -19%
Change (%)14 -16% -28% -28% -41%
Change (%)15 4% 6% 8% 5%
The flexibility of scheduling an arrival to the terminal reduces the average truck turnaround time
and waiting time by 2 % and 4% respectively compared to Scenario II. The indicators still
remain higher compared to baseline scenario (by 5% and 7%). Figure 9 shows the progression
of the average truck waiting time and lane queue during the day. One can observe that the
shape of the queue line for Scenario III closely follows the Baseline Scenario line shape, which
is not the case in Scenarios I and II.
13 (Scenario III – Scenario II)/Scenario III 14 (Scenario III – Scenario I)/Scenario III 15 (Scenario III – Baseline)/Scenario III
24
Figure 9. Average Truck Waiting Time and Lane Queue (Scenario III and Baseline)
SCENARIO IV RESULTS
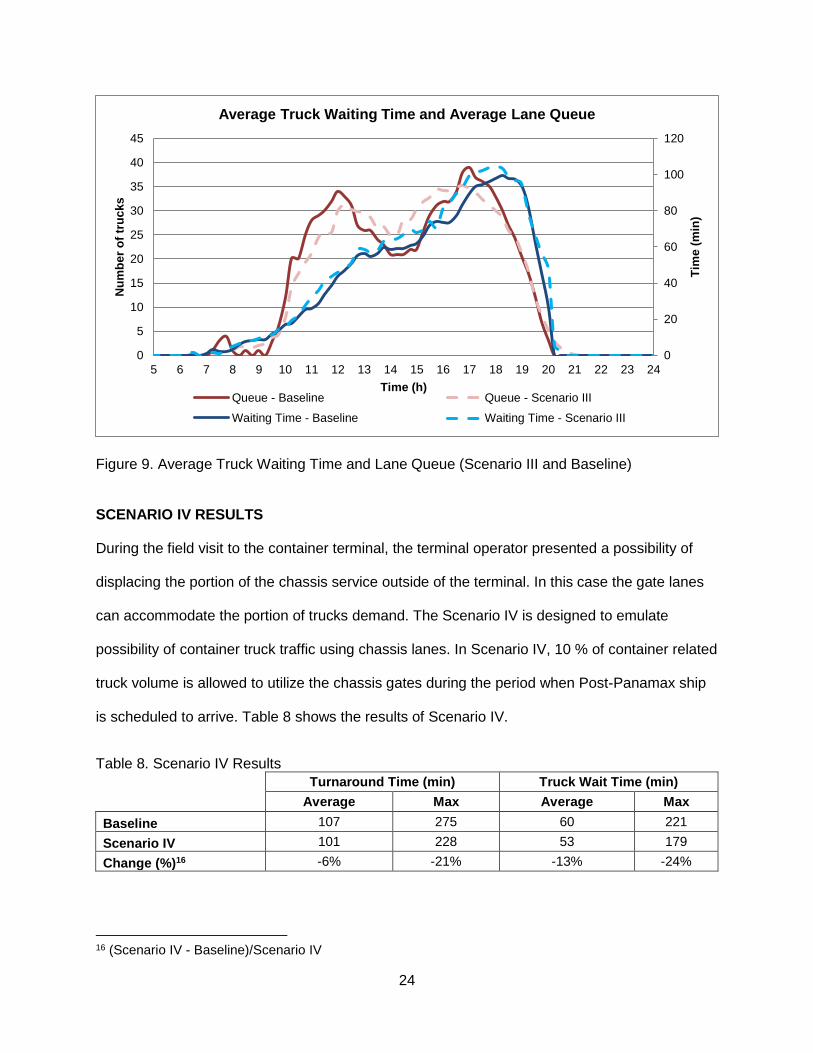
During the field visit to the container terminal, the terminal operator presented a possibility of
displacing the portion of the chassis service outside of the terminal. In this case the gate lanes
can accommodate the portion of trucks demand. The Scenario IV is designed to emulate
possibility of container truck traffic using chassis lanes. In Scenario IV, 10 % of container related
truck volume is allowed to utilize the chassis gates during the period when Post-Panamax ship
is scheduled to arrive. Table 8 shows the results of Scenario IV.
Table 8. Scenario IV Results
Turnaround Time (min) Truck Wait Time (min)
Average Max Average Max
Baseline 107 275 60 221
Scenario IV 101 228 53 179
Change (%)16 -6% -21% -13% -24%
16 (Scenario IV - Baseline)/Scenario IV
0
20
40
60
80
100
120
0
5
10
15
20
25
30
35
40
45
5 6 7 8 9 10 11 12 13 14 15 16 17 18 19 20 21 22 23 24
Tim
e (
min
)
Nu
mb
er
of
tru
ck
s
Time (h)
Average Truck Waiting Time and Average Lane Queue
Queue - Baseline Queue - Scenario III
Waiting Time - Baseline Waiting Time - Scenario III
25
Allowing 10 % of container traffic to utilize chassis lanes improves the truck turnaround time by
6% compared to the Baseline scenario. The added gate capacity reduced the truck waiting time
on average 13%. The observed underutilization of the chassis gates indicates that they can be
an additional resource for terminal operator to service trucks during high demand. The partial or
full displacement of chassis service adds the needed capacity for container trucks and thus
improves the gate throughput. Figure 10 illustrates the change in average truck waiting time and
lane queue during the day. One observes that the waiting time and queue is below levels
observed in the Baseline Scenario.
Figure 10. Average Truck Waiting Time and Lane Queue (Scenario IV and Baseline)
The researchers modeled captured the number of trucks waiting at the gate in each simulated
scenario. Considering average truck length with a 20 foot container, the number of trucks
waiting can be translated into the queue length expressed in feet. Figure 11 shows the truck
queue length (in miles) progression during the day. The queue length outside of the gate in
Scenario 1 has the maximum length of 1.6 miles. The Scenarios II and III alleviate the maximum
0
20
40
60
80
100
120
0
5
10
15
20
25
30
35
40
45
5 6 7 8 9 10 11 12 13 14 15 16 17 18 19 20 21 22 23 24
Tim
e (
min
)
Nu
mb
er
of
Tru
ck
s
Time (h)
Average Truck Waiting Time and Average Lane Queue
Queue - Baseline Queue - Scenario IV
Waiting Time - Baseline Waiting Time - Scenario IV

26
queue length to 1.3 and 1.03 miles respectively. The Scenario IV significantly reduces the
queue during the morning compared to Baseline Scenario while the afternoon queue is at same
level or below.
Figure 11. Queue Length Outside of the Gate
CONCLUSIONS
The objective of this research was to investigate the hypothesis that the greater frequency of
vessel arrivals, combined with the increasing variability of the size of the vessel will generate new
challenges for a port terminal. The research was partially motivated by the results and
recommendations of recent studies of the rising of Bayonne Bridge in New Jersey. As part of this
exercise developed scenarios simulate the potential growth of the New York and New Jersey
truck traffic as result of attracted Post-Panamax vessel due to rising of the Bayonne Bridge.
The research team used the knowledge of the terminal operation and configuration to develop a
baseline scenario of the hypothetical terminal operation. The four developed scenarios are used
0
0.2
0.4
0.6
0.8
1
1.2
1.4
1.6
1.8
5 6 7 8 9 10 11 12 13 14 15 16 17 18 19 20 21 22 23 24
Dis
tan
ce
(m
ile
s)
Time (h)
Queue Length Outside The Gate
Baseline Scenario I Scenario II Scenario III Scenario IV

27
understand the potential impacts on a given hypothetical port terminal. Two scenarios are based
on policies commonly used to control the truck arrival patterns at the gate:
Extended gate hours, and
Gate appointment system
Scenario I evaluates the operation of the container terminal under Baseline scenario operational
assumptions with a premise that one Post-Panamax vessel is arriving during the month. The
results show that the truck turnaround time and truck waiting time increased by 18% and 28%
respectively. The in terminal processing time remained the same which implies that the gate
capacity is insufficient to handle the increase in truck volume. The result shows it would take
additional 2.5 hours to process all trucks remaining in the queue within the terminal.
Two scenarios (Scenario II and Scenario III) represent policies commonly used to control the truck
arrival patterns. Both scenarios reduced the truck turnaround time and truck waiting time
compared to Scenario I. The Scenario II reduced the truck turnaround time and truck waiting time
by 14 % and 24% respectively. The Scenario III reduced the truck turnaround time and truck
waiting time by 16 % and 28% respectively. However, the truck turnaround time and waiting time
still remains higher compared to the baseline scenario. Scenario IV allows 10% of container
related truck volume to utilize the chassis gates reduced the truck turnaround time and waiting
time below levels observed in the Baseline Scenario. Table 9 summarizes the change in these
two performance measures compared to the Baseline scenario.
Table 9. The Average Truck Turnaround Time and Waiting Time Comparison
Percent Change Compared to Baseline Scenario
Truck Turnaround Time Truck Wait Time
Scenario I 18 28
Scenario II 6 10
Scenario III 4 8
Scenario IV -6 -13

28
RECOMMENDATIONS
The arrival of larger vessels at current container terminal operations may have detrimental
effects on terminal performance rising from issues with gate capacity. The recorded truck
turnaround times in this study, across scenarios, range from a minimum of approximately 10
minutes to a maximum of 8 hours in some cases. The discrete event simulation modeled within
ARENA software served to allow researchers to make initial comparative conclusions related to
the effects of post-Panamax vessel arrivals at a container terminal. Further improvements in the
model for future research can add to transportation planners’ capabilities to understand the
effects of vessel size and arrival distribution on multimodal networks:
Researchers can expand the model logic to incorporate more detailed process models that
use specific terminal data and performance measures. In particular, more detailed logic and
observations regarding the behavior of trucks within and outside of the terminal would
improve the findings of the simulation model.
One could choose to integrate additional macro or micro simulation software that are able to
more closely model the behavior of land transportation through standard process logic, such
as VISSIM.
Researcher can improve the logic models that define the behavior of different terminal yard
handling equipment and processes including modified behaviors for straddle carriers,
container cranes, and other processing resources.
Gate operations scenarios can include the simulation of several different policies available
for appointment systems, including 24 hour prior appointment scheduling.
One could choose to model the interaction between neighboring container terminals to
develop a more comprehensive analysis of total burden on the highway system from
container processing at neighboring terminals, consistent with port terminal areas in New
York, Virginia, Los Angeles / Long Beach and elsewhere.
29
REFERENCES
Abadi, Afshin, Mithun Baphana, and Petros Ioannou. "Simulation Models for Evaluation of Terminal Operations and Traffic Flow on Adjacent Road Network." In Proceedings of 12th IFAC Symposium on Transportation Systems, Redondo Beach, CA, USA, September 2-4, 2009.
American Transportation Research Institute (ATRI). Compendium of Idling Regulations. 2005. Available at: http://www.atri-online.org/research/results/idling_chart.pdf
Carpenter, Beth C., and Thomas Ward. "The use of computer simulation for marine terminal planning." In Proceedings of Winter Simulation Conference, pp. 802-804, 1990.
Christensen Associates. National Cooperative Freight Research Program (NCFRP) 16: “Preserving and Protecting Freight Infrastructure and Routes”. Transportation Research Board. Washington, DC. 2012 Available at: http://onlinepubs.trb.org/onlinepubs/ncfrp/ncfrp_rpt_016.pdf
Cortés, Pablo, Jesús Muñuzuri, J. Nicolás Ibáñez, and José Guadix. "Simulation of freight traffic in the Seville inland port." Simulation Modelling Practice and Theory 15, no. 3 (2007): 256-271.
Conway, K.C.,“North American Port Analysis preparing for the first post-Panamax Decade”, 2012, Colliers international.
Dougherty, Patrick Shane. "Evaluating the impact of gate strategies on a container terminal's roadside network using microsimulation: the Port Newark/Elizabeth case study." Ph.D. dissertation, Rutgers University-Graduate School-New Brunswick, 2010.
Gambardella, Luca Maria, Andrea E. Rizzoli, and Marco Zaffalon. "Simulation and planning of an intermodal container terminal." Simulation 71, no. 2 (1998): 107-116.
Giuliano, Genevieve, and Thomas O'Brien. Evaluation of Extended Gate Operations at the Ports of Los Angeles and Long Beach. No. METRANS Project 05-12. 2008.
Huynh, Nathan N., and C. Michael Walton. “Methodologies for reducing truck turn time at marine container terminals”. No. SWUTC/05/167830-1. 2005.
ICF International. National Cooperative Freight Research Program (NCFRP) 6: Impacts of Public Policy on the Freight Transportation System (Revised). Transportation Research Board. Washington, DC. 2010 Available at: http://onlinepubs.trb.org/onlinepubs/ncfrp/ncfrp_rpt_006.pdf
Ioannou, Petros, Anastasios Chassiakos, G. Valencia, and C. Hwan. “Simulation test-bed and evaluation of truck movement concepts on terminal efficiency and traffic flow”. METRANS, 2007.
Karafa, Jeffery. "Simulating gate strategies at intermodal marine container terminals." Ph.D. dissertation, The University of Memphis, 2012.
Kia, M., E. Shayan, and F. Ghotb. "The importance of information technology in port terminal operations." International Journal of Physical Distribution & Logistics Management 30, no. 3/4 (2000): 331-344.
30
Kia, M., E. Shayan, and F. Ghotb. "Investigation of port capacity under a new approach by computer simulation." Computers & Industrial Engineering 42, no. 2 (2002): 533-540.
Klodzinski, Jack, and Haitham M. Al-Deek. "Methodology for modeling a road network with high truck volumes generated by vessel freight activity from an intermodal facility." Transportation Research Record: Journal of the Transportation Research Board 1873, no. 1 (2004): 35-44.
Lee, Byung Kwon, Bong Joo Jung, Kap Hwan Kim, Soon Oh Park, and Jeong Hoon Seo. "A simulation study for designing a rail terminal in a container port." In Proceedings of Winter Simulation Conference, pp. 1388-1397, 2006.
Moini, Nadereh. "Modelling the interrelationship between vessel and truck traffic at marine container terminals." Ph.D. Dissertation, Rutgers University-Graduate School-New Brunswick, 2010.
Nagy, Ellen A. "Intermodal Transshipment Facility Simulation: A Case Study." In Proceedings of Winter Computer Simulation Conference, Sacramento, pp. 217-23, 1975.
Ng, Wing-Cheong, and Ching-Sze Wong. "Evaluating the impact of vessel-traffic interference on container terminal capacity." Journal of Waterway, Port, Coastal, and Ocean Engineering 132, no. 2 (2006): 76-82.
Parola, Francesco, and Anna Sciomachen. "Intermodal container flows in a port system network: Analysis of possible growths via simulation models." International Journal of Production Economics 97, no. 1 (2005): 75-88.
Puglisi, Christopher Michael. "Issues and challenges of federating between different transportation simulators." Master’s Thesis, School of Civil and Environmental Engineering, Georgia Institute of Technology, 2008.
Rizzoli, Andrea E., Nicoletta Fornara, and Luca Maria Gambardella. "A simulation tool for combined rail/road transport in intermodal terminals." Mathematics and Computers in Simulation, 59, no. 1 (2002): 57-71.
Rodrigue, Jean-Paul “Comparative Characteristics of the Panama Canal Expansion”, Hofstra University, http://people.hofstra.edu/geotrans/eng/ch1en/appl1en/table_panama_new.html, Accessed January 2014.
Strauss-Wieder, A. “NCHRP 320: Integrating Freight Facilities and Operations with Community Goals”. Transportation Research Board. Washington, DC. 2003. Available at: http://onlinepubs.trb.org/onlinepubs/nchrp/nchrp_syn_320.pdf
Thuermer, K., “Bigger, wider, deeper: US ports prepare for post-Panamax ships”, http://www.fdiintelligence.com/Locations/Americas/USA/Bigger-wider-deeper-US-ports-prepare-for-post-Panamax-ships?ct=true, Accessed December 2013.
Tsitsamis, D. and D. Vlachos. “Truck operations planning at a container terminal.” In Proceedings of 1st Olympus International Conference on Supply Chains, 1-2 October, Katerini, Greece, 2010.
U.S. Army Corps of Engineers, “U.S. Port and Inland Waterways Modernization: Preparing for Post-Panamax Vessels”, 2012

31
Wall, Thomas Aubrey. "A federated simulation approach to modeling port and roadway operations." Master’s Thesis, School of Civil and Environmental Engineering, Georgia Institute of Technology, 2010.
Yun, Won Young, and Yong Seok Choi. "A simulation model for container-terminal operation analysis using an object-oriented approach." International Journal of Production Economics 59, no. 1 (1999): 221-230.